Article

Localizing Bifurcations in Non-Linear Dynamical Systems via Analytical and Numerical Methods

Politechnika Świȩtokrzyska, Al. 1000-lecia PP 7, 25-314 Kielce, Poland
*
Author to whom correspondence should be addressed.
These authors contributed equally to this work.
Processes 2022, 10(1), 127; https://doi.org/10.3390/pr10010127
Submission received: 19 November 2021 / Revised: 21 December 2021 / Accepted: 5 January 2022 / Published: 8 January 2022
(This article belongs to the Special Issue Numerical Simulation of Nonlinear Dynamical Systems)

Abstract

:
In this paper, we study the bifurcations of non-linear dynamical systems. We continue to develop the analytical approach, permitting the prediction of the bifurcation of dynamics. Our approach is based on implicit (approximate) amplitude-frequency response equations of the form F Ω , A ; c ̲   = 0 , where c ̲ denotes the parameters. We demonstrate that tools of differential geometry make possible the discovery of the change of differential properties of solutions of the equation F Ω , A ; c ̲   = 0 . Such qualitative changes of the solutions of the amplitude-frequency response equation, referred to as metamorphoses, lead to qualitative changes of dynamics (bifurcations). We show that the analytical prediction of metamorphoses is of great help in numerical simulation.

1. Introduction

Non-linear dynamical systems find important applications in science and technology. It is thus necessary to analyse and solve non-linear equations governing dynamics of such systems with high accuracy. Unfortunately, analytical solutions of non-linear systems are scarce and numerical simulation is the main tool to provide useful solutions. Numerical simulation is becoming more popular due to enormous progress in computer technology and computer simulation software; see [1] for the early history of computer simulation software and [2] for a comprehensive list of the software.
The history of computer simulation dates back to World War II and the Manhattan Project problems which led John Von Neumann, Stanislaw Ulam and Nicholas Metropolis to invent the Monte Carlo method to explain the complicated dynamics of neutrons in the fission process [3,4]. More about the development of computer simulation can be found in [5]. A typical textbook on computer simulation in physics and engineering is [6]. For a survey of applications of computer simulation to non-linear science, see [7].
Another large group of numerical methods based on discretization of differential equations stem from the Leonhard Euler method [8] and the very useful Runge–Kutta type methodology [9,10]. A competent text on this type of numerical computations with applications to dynamical systems is [11].
On the other hand, due to the approximate nature of numerical simulation, analytical tools are demanded. One approach originates from the works of Henri Poincarė on the three-body problem [12], which led to the theory of chaos; see [11,13,14]. There is also another body of analytical work based on ideas of René Thom [15], from which Catastrophe Theory and Singularity Theory were born, as well as a modern theory of bifurcations [16,17]. An interesting application of the Catastrophy Theory to a dynamical problem—the Duffing equation—was made by Holmes and Rand [18].
In spite of the progress in finding analytical solutions of non-linear differential equations (see [19]) approximate analytical tools are also needed. A very interesting approach, used in this work, to non-linear equations written in a non-dimensional form as:
d 2 y d τ 2 + Ω 2 y = ε f y , d y d τ , τ ; c ̲ ,
where ε is a small parameter, c ̲ =   c 1 , c 2 , , c m are control parameters, and f is a periodic function of non-dimensional time τ with period T = 2 π Ω and with polynomial non-linearities, is based on asymptotic methods; see [20] for a comprehensive survey and discussion on the applicability of this approach. This class of approximate methods consists in computing non-linear resonances of the form:
y τ   = A Ω cos Ω τ + φ Ω + ε y 1 τ +
where the amplitude A and frequency Ω fulfill the approximate amplitude-frequency response equation:
F Ω , A ; c ̲   = 0 .
Equation (3) defines an implicit function—the amplitude-frequency response curve (the amplitude profile), which is a two-dimensional planar curve. The form of this curve, as well as the stability of the solution (2), determine (approximately) the dynamics of the system.
Equation (1), or a system of such equations, although simple, can successfully model many real non-linear dynamical systems; see [21] for theoretical as well as experimental issues.
We have proposed in our earlier papers an analysis of differential properties of solutions of the amplitude-frequency response Equation (3) [22,23]. It turns out that bifurcations of dynamics, such as hysteresis and jump phenomenon, related to appearance/disappearance of branches of solutions, as well as more complex bifurcations, such as, for example, creation/destruction of solutions, follow from changes of differential properties of solutions of the amplitude-frequency response Equation (3), induced by a change of the parameters c ̲ . Note that, from a mathematical point of view, Equation (3) defines an implicit 2 D curve.
More precisely, we have demonstrated that the jump phenomenon follows from the condition (defining a critical point of the curve) F Ω , A ; c ̲ A = 0 [23] (this was first noticed for the Duffing equation in [24]), while more complicated qualitative changes of these curves follow from the conditions (defining a singular point of the curve) F Ω , A ; c ̲ Ω = 0 , F Ω , A ; c ̲ A = 0 [25]. In all these cases, 2 D implicit curves defined by Equation (3) change their form at critical or singular points of the curve F Ω , A ; c ̲   = 0 . Therefore, we have proposed to call such qualitative changes of curves (3) metamorphoses of these curves [25].
It should be noted that this approach can be generalized for systems of non-linear equations of the form (1) describing multi-degree-of-freedom systems; see [26].
It seems that the first investigation of metamorphoses of amplitude profiles induced by a change of parameters was carried out in the framework of Catastrophe Theory in [18] for the Duffing equation in a non-singular case and without reference to differential properties of the amplitude profiles. The idea to use the Implicit Function Theorem to “define and find different branches intersecting at singular points” of amplitude profiles was described in [27]. Then, it was determined by Kalmár-Nagy and Balachandran that the metamorphosis described by Holmes and Rand follows from a differential condition [24]. Singular points of amplitude profiles were first investigated in the setting of differential geometry in [25]. An introduction to differential properties of curves can be found in [28,29].
The prediction of such qualitative changes of the solutions of the amplitude-frequency response equation referred to as metamorphoses permits the prediction of qualitative changes of dynamics (bifurcations). Some metamorphoses are often stable in a narrow interval of control parameters and are challenging to find numerically. Therefore, analytical methods permitting the prediction of metamorphoses are of great help in numerical simulation.
A novel contribution of our work consists of (i) the classification of a wide variety of metamorphoses of the dynamics of steady-state solutions of non-linear equations due to changes of the differential properties of the amplitude-frequency response curves; (ii) the definition and description of the construction of borderline sets, i.e., sets containing parameters for which jump phenomena are present; (iii) the computation of numerically exact bifurcation sets for pendulum systems using a standard asymptotic approach (this is a new result since pendulums are non-polynomial systems while standard asymptotic methods can be applied to polynomial systems only); and (iv) the demonstration of bifurcations corresponding to parameters belonging to the bifurcation set.
In Section 2 we describe our methodology and classify a wide variety of metamorphoses; then, in Section 3, we show applications of our approach to two dynamical systems. Firstly, we consider a damped periodically driven pendulum, applying our results obtained in [23]. Secondly, we study a driven pendulum with van der Pol’s type damping, generalizing our previous studies [30,31]. Since we compute non-linear resonances (2) by the Krylov–Bogoliubov–Mitropolsky (KBM) method, which applies to polynomial non-linearities only, we have to expand the typical pendulum term sin y , appearing in the function f y , d y d τ , τ ; c ̲ in (1), and consider contributions from terms of the expansion sin y k = 1 n c k y 2 k + 1 for growing n.
In Section 3, we compute bifurcation sets Ɗ n c ̲   = 0 , where Ɗ n is a non-linear function of parameters c ̲ and n + 1 is the number of terms in the expansion of sin y . The bifurcation set consists of points in the parameter space c 1 , c 2 , c n such that the amplitude-frequency response Equation (3) has a singular point for every c ̲ fulfilling Ɗ n c ̲   = 0 . We show that, for increasing values of n, the physical values of parameters c ̲ belonging to bifurcation sets Ɗ n c ̲   = 0 converge quickly, thus providing a good approximation of the pendulum’s singular points. We summarize our results in the last Section.

2. Analytical Properties of Amplitude-Frequency Response Curves and Bifurcations of Dynamics

In this Section, we describe differential properties of the implicit curve (3) as well as metamorphoses of the curve induced by smooth changes of the parameters c ̲ . Moreover, we attempt to classify metamorphoses as well as related bifurcations of dynamics. In Section 3, we show several examples of changes of differential properties of the amplitude-frequency curves and the corresponding bifurcations for the pendulum systems.

2.1. Critical Points, Vertical Tangencies, Borderline Sets

Critical points of the function Ω = f A , i.e., vertical tangencies (VTs), which follow from the Kalmár-Nagy and Balachandran condition d Ω d A = f A   = 0 for the implicit function F Ω , A ;   c ̲   = 0 [24], fulfill an equivalent set of equations expressed in the implicit functions setting [23]:
F Ω , A ;   c ̲ = 0 ,
F Ω , A ;   c ̲ A = 0 F Ω 0 ,
where we do not have to determine the function Ω = f A . In critical points of the function f A , jump phenomena can be observed in non-linear dynamical systems; see [18,24] for the Duffing equation and continuation of this Subsection. For example, in Figure 1, a multi-valued function A = g Ω with VTs represented by vertical dashed lines are shown. Red points indicate critical points of the inverse function Ω = f A .
For the sake of an example, we consider the cubic Duffing equation
y ¨ + h y ˙ + y + c 3 y 3 = f cos Ω τ ,
and the corresponding amplitude curve [18,24]:
F D Ω , A = A 2 h 2 Ω 2 + A 2 3 4 c 3 A 2 Ω 2 + 1 2 f 2 = 0 .
Equation (4a,b) for the amplitude function (6) yield critical points Ω , A where vector tangencies occur: X = 9 c 3 2 Y 3 + 12 c 3 Y 2 + 8 f 2 12 c 3 Y 2 , while Y is a solution of the equation:
f Y = 27 c 3 3 h 2 Y 5 + 36 c 3 2 h 2 Y 4 36 c 3 2 f 2 Y 3 + 24 f 2 c 3 h 2 Y 2 + 16 f 4 = 0 ,
where X = Ω 2 , Y = A 2 (obviously, only solutions A > 0 are acceptable).
Let c 3 = 1 , f = 1 . In this case Equation (8) has only complex solutions, while Equation (9) has one positive solution, h * = 0.511 878 853 . In Figure 1, several amplitude curves (6) are shown.
Coordinates of critical points Ω * , A * (red dots), computed from Equation (4a,b), are 1.537 , 1.101 , 1.615 , 0.905 , 1.857 , 1.782 . In critical points, metamorphoses occur—a number of branches of the asymptotic solutions are changed, and this corresponds to the vertical tangency of the amplitude-frequency curve and the jump phenomenon for dynamics of the Duffing equation [18,24].
Equation (7) may have, for some parameter values, double/multiple solutions—coalescing critical points. This happens when discriminant Δ of the polynomial f Y is zero and is important because a number of real/complex solutions of (7) change at such point in the parameter space.
The condition Δ = 0 is equivalent, for non-zero parameters, to R f , f   = 0 , where R f , f is a resultant of f Y and its derivative f Y . Computing the resultant of f Y , as explained in the Appendix A, we find that the equation R f , f   = 0 factorizes and thus is satisfied if either of two equations is fulfilled:
48 f 2 c 3 + 16 h 2 8 h 4 + h 6 = 0 ,
1024 h 6 2592 c 3 f 2 h 6 2592 c 3 f 2 h 4 + 243 c 3 2 f 4 = 0 .
Equations (8) and (9) determine the borderline set— parameter values at which vertical tangencies (VTs) appear/disappear. Note, for example, that for c 3 > 0 , Equation (8) has no real solutions.
To explain the jump phenomenon, consider the dark gray amplitude curve in Figure 1. Typically, the upper branch as well as the lower branch are stable, while the middle branch (dashed line) is unstable. Therefore, if a system is on the upper branch, then, for increasing value of Ω , it must fall down on the lower branch for Ω > 1.857 . This is a jump phenomenon, described in [18] and also in [24], where a differential condition d Ω d A = 0 was formulated. Note that, as follows from our analysis, for, say, c 3 = 1 , f = 1 vertical tangencies appear only for h h * .
Finally, we draw the borderline sets determined by Equations (8) and (9), see Figure 2.

2.2. Singular Points

In singular points, neither the function A = g Ω nor Ω = f A are single-valued. According to the differential geometry of curves [28,29], an implicit curve changes its form at singular points which fulfill the following equations:
F Ω , A ;   c ̲ = 0 ,
F Ω , A ;   c ̲ Ω = 0 ,
F Ω , A ; c ̲ A = 0 .
Solutions of Equation (10a–c), if they exist, are of the form Ω = Ω * , A = A * , c ̲ = c ̲ * . Accordingly, the amplitude response curve F Ω , A , c ̲ *   = 0 changes its differential properties at a singular point Ω * , A * . Such changes, referred to as metamorphoses, can be very complicated and of various natures.

2.3. Classification of Singular Points and Corresponding Bifurcations: Basic Cases

There are several generic cases of singular points which can be classified with the help of higher derivatives of F Ω , A ; c ̲ in a singular point Ω * , A * . In what follows, we shall use the following notation F 11 = 2 F Ω 2 Ω * , A * , F 12 = 2 F Ω A Ω * , A * , F 22 = 2 F A 2 Ω * , A * for elements of the matrix of second derivatives (Hessian).

2.3.1. Isolated Points

In the case of an isolated point, a new branch of solution (stable or unstable) is created. In an isolated point, we have
F 11 F 22 F 12 2 > 0 .
The corresponding amplitude curves are shown, for example, in Figure 3 in [22] (blue-green curve) and in Figure 3 in [23] (red curve). The isolated point indicates the birth of a new branch of solutions, often stable. This is shown in bifurcation diagrams in Figure 9 in [22] or in Figure 4 in [23].

2.3.2. Self-Intersections

The condition for the self-intersection reads:
F 11 F 22 F 12 2 < 0 .
Such an amplitude curve is shown in Figure 4, and two curves just before and just after metamorphosis are shown in Figure 6 in [22]; see also Figures 5 and 6 in [23]. In this case, an existing branch of stable solution is disrupted; see bifurcation diagrams, Figure 7 in [22] or Figure 7 in [23].

2.3.3. Degenerate Points: A Cusp

A necessary condition for the cusp is:
F 11 F 22 F 12 2 = 0 .
In the neighborhood (in the parameter space) of the cusp, there are infinitely many isolated points and self-intersections [23,32]. Therefore, small changes of control parameters lead to qualitative changes of dynamics [23,32].

2.3.4. Higher-Order Degenerate Points

There are singular points which fulfill:
F 11 = F 12 = F 22 = 0 .
The classification of such points requires information about higher-order derivatives. In the neighborhood (in the parameter space) of degenerate points, infinite families of singular points exist [33], and thus various forms of dynamics are possible [33].

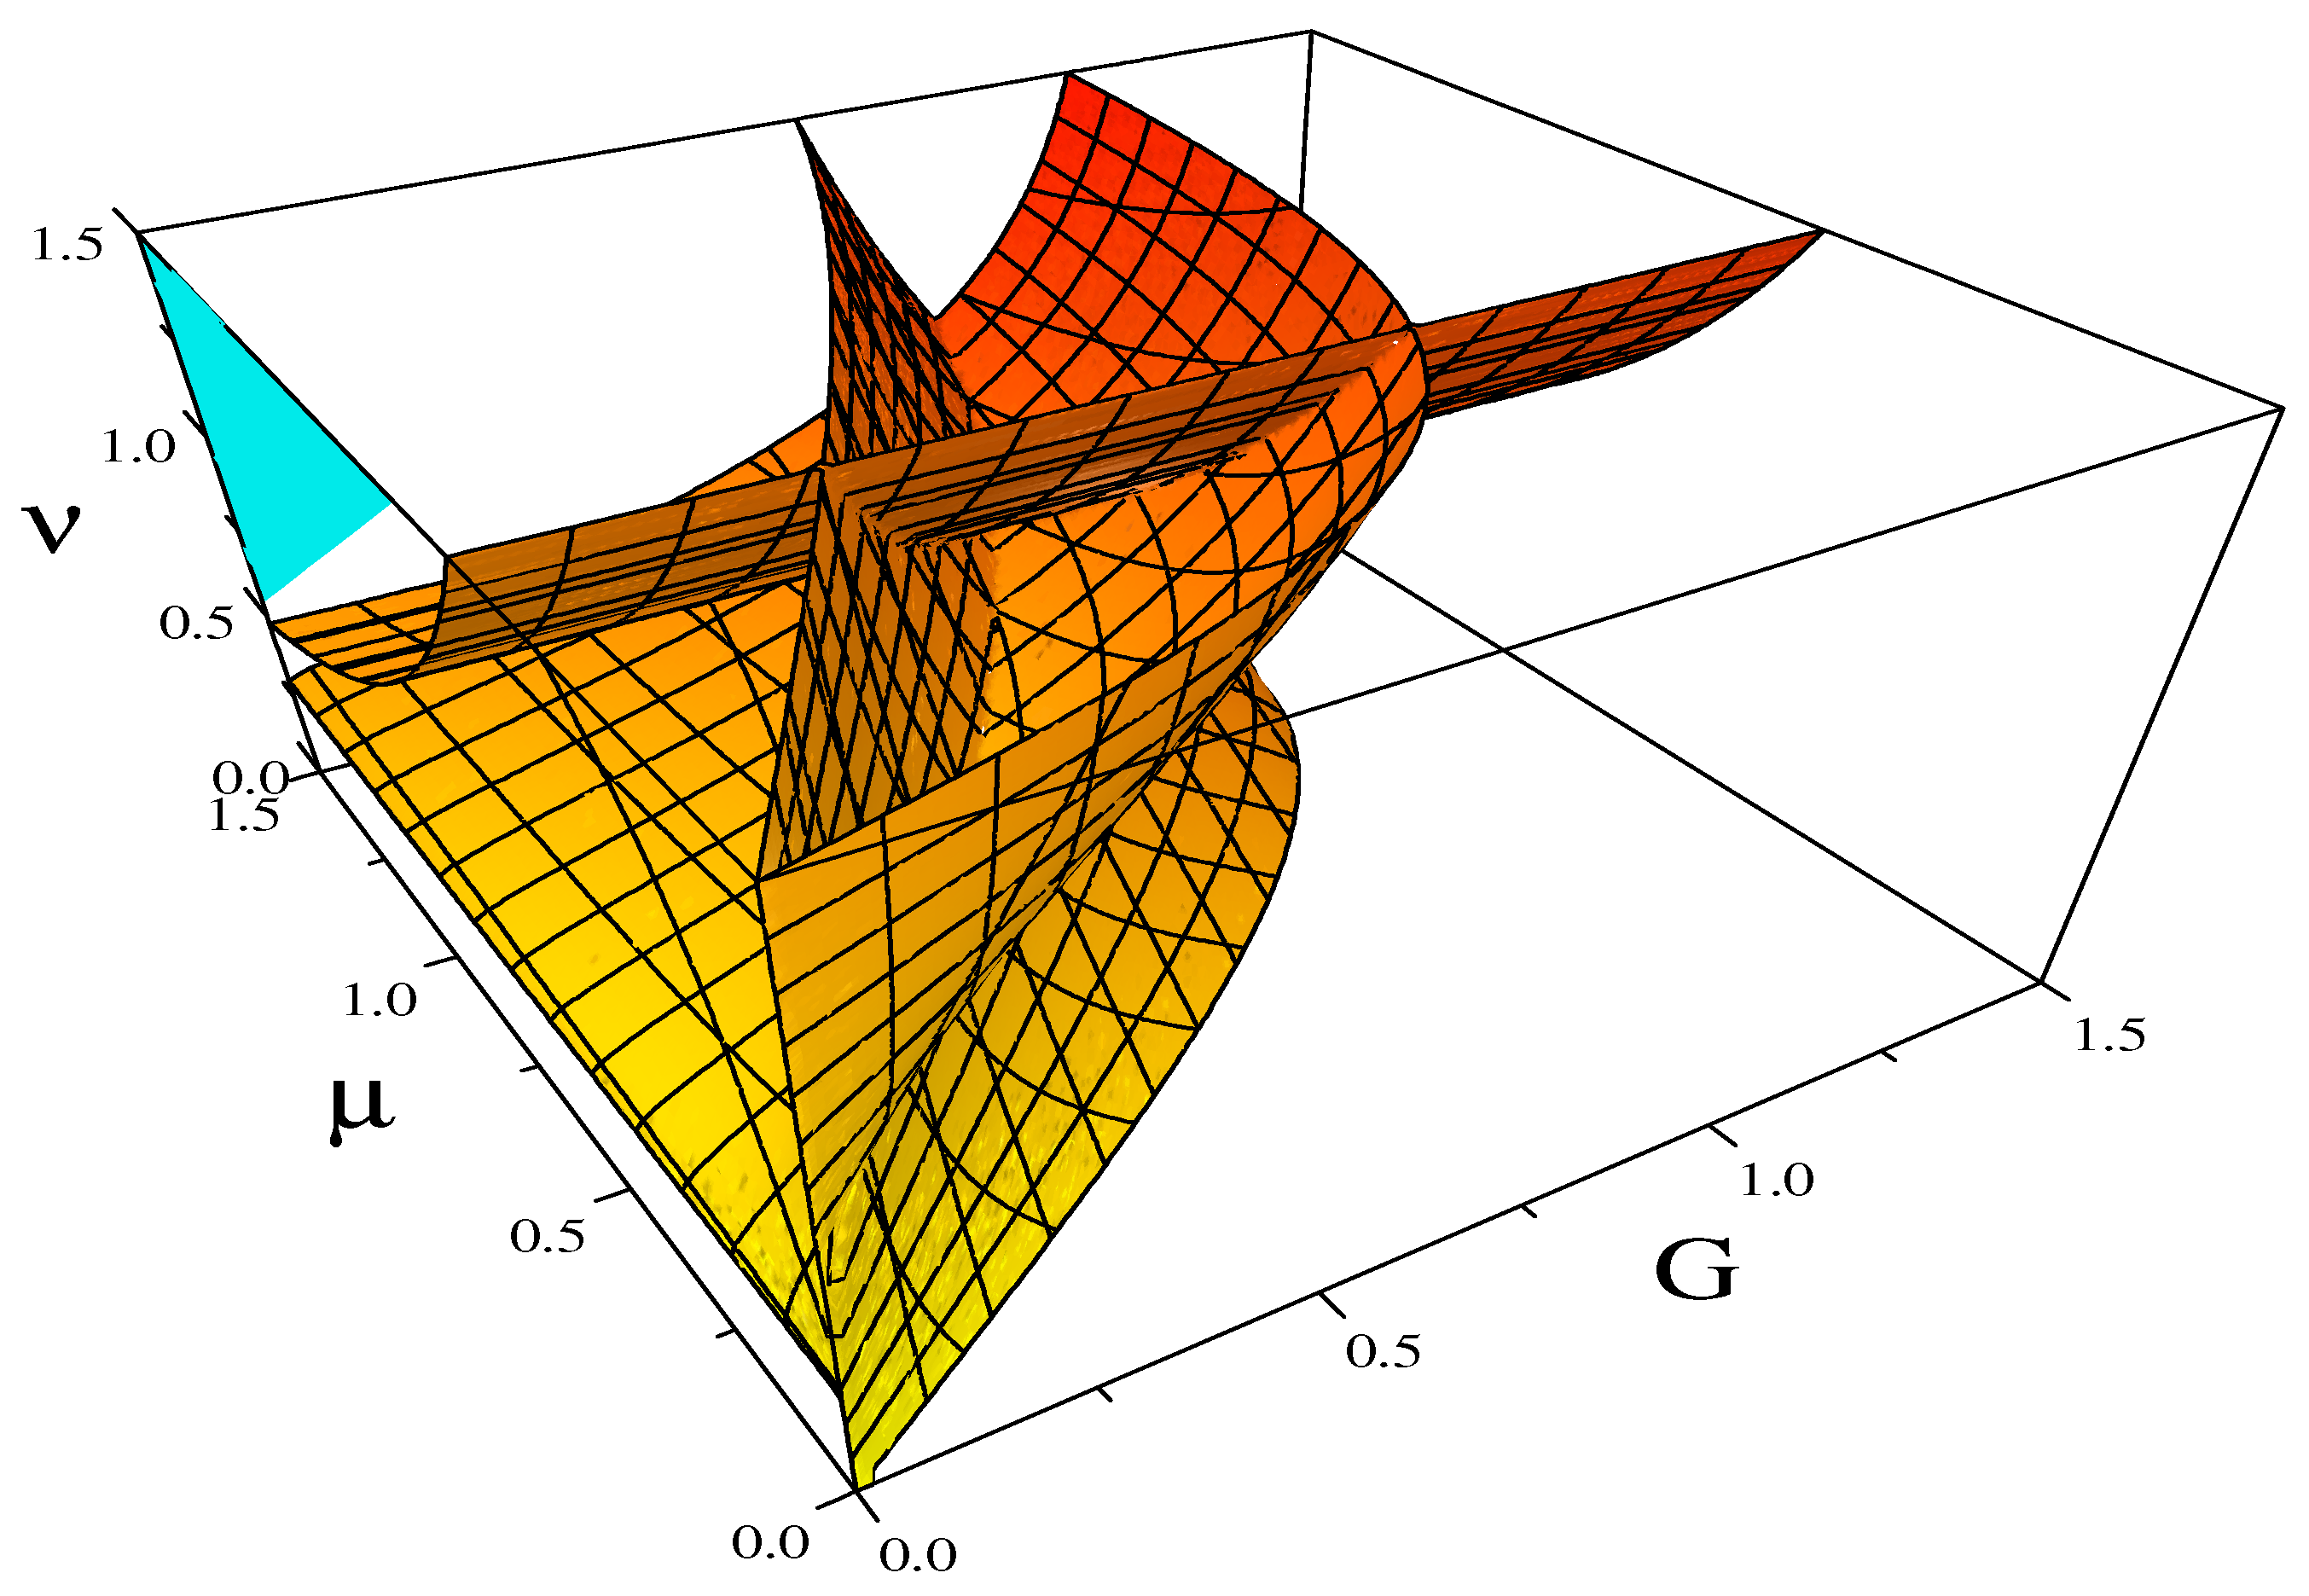
2.4. Bifurcation Sets

In many cases, it is possible to compute a bifurcation set M —a set of parameters c ̲ , such that F Ω , A ; c ̲ has a singular point Ω * , A * for c ̲ =   c 1 , c 2 , , c m   M .
Assume that Equation (10a,b) can be solved in the form:
Ω = p A ; c ̲ ,
q A ; c ̲ = 0 ,
where p and q are polynomials.
Note that Equation (10b) excludes the existence of a single-valued function Ω = f A . To obtain a condition for a singular point, we now need an alternative to Equation (10c) which excludes the existence of a single-valued function A = g Ω . It follows that it suffices to demand that Equation (16) has multiple roots. Therefore, the formula for the bifurcation set M is [22]:
c 1 , c 2 , , c m   M : R q , q   = 0 = Ɗ c 1 , c 2 , , c m ,
where R q , q is the resultant (A1) of q A ; c ̲ and its derivative q A ; c ̲ = d q A ; c ̲ d A , and the polynomial Ɗ c ̲ is a normalized resultant (see Equation (A2)).

3. Examples of Applications

In this Section we apply the formalism described in Section 2 to two important pendulum systems. Models of this kind are idealized yet extensively studied [21]. We consider a damped periodically driven pendulum, applying our results obtained in [23]. Then we study a driven pendulum with van der Pol’s type damping, generalizing our previous studies [30,31]. We show how changes of differential properties of asymptotic solutions are related to changes of existence and stability of dynamical states. We thus obtain new information on the dynamical behavior of these systems.

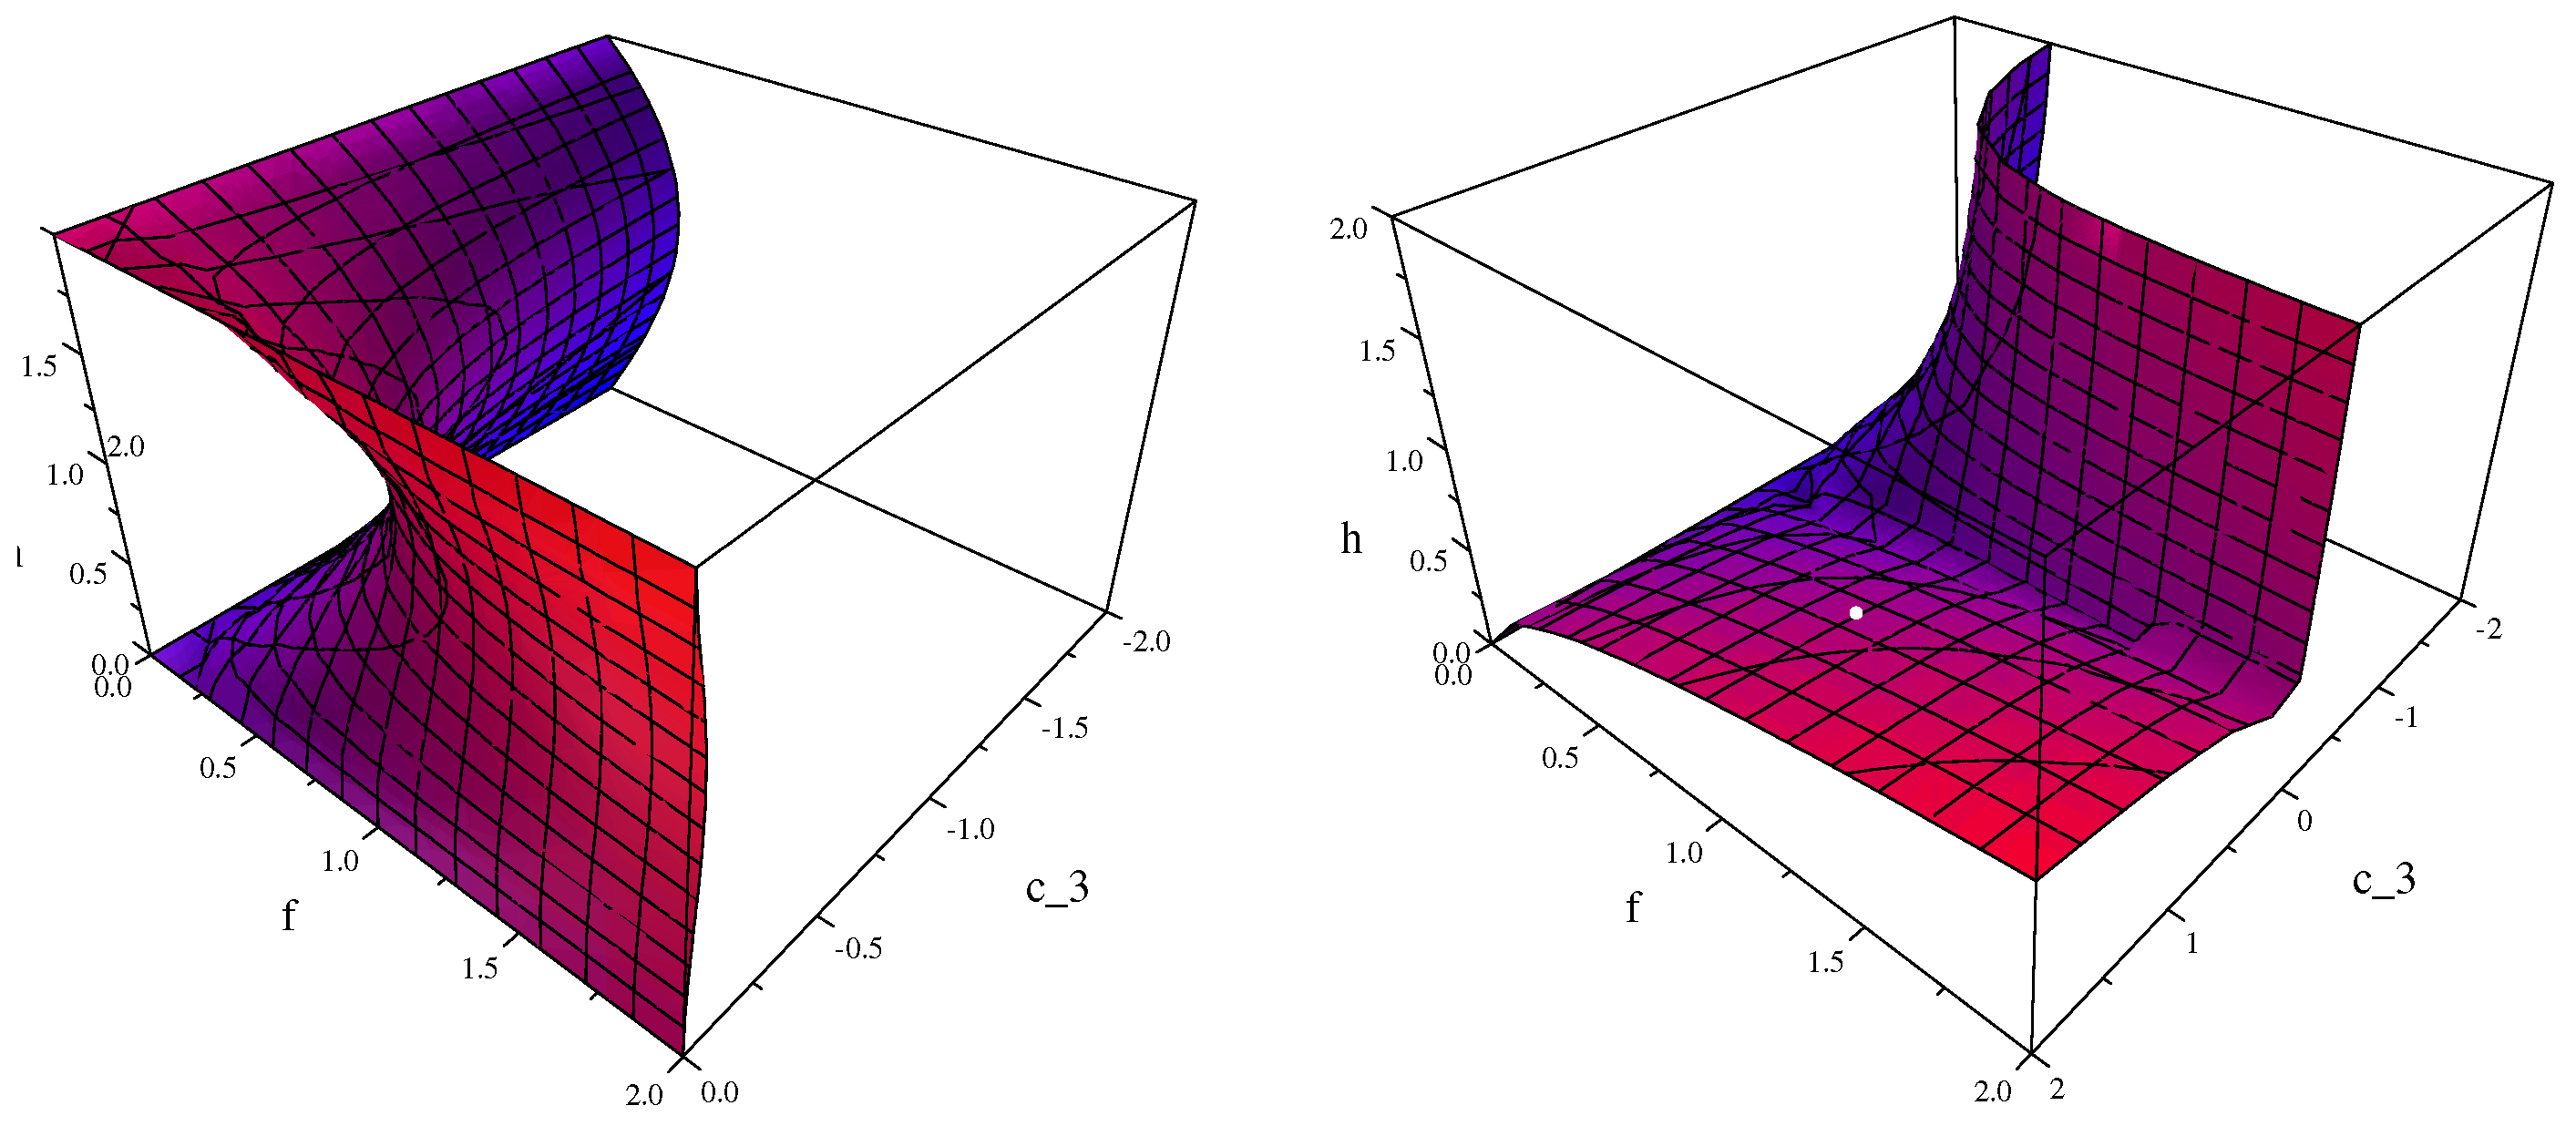
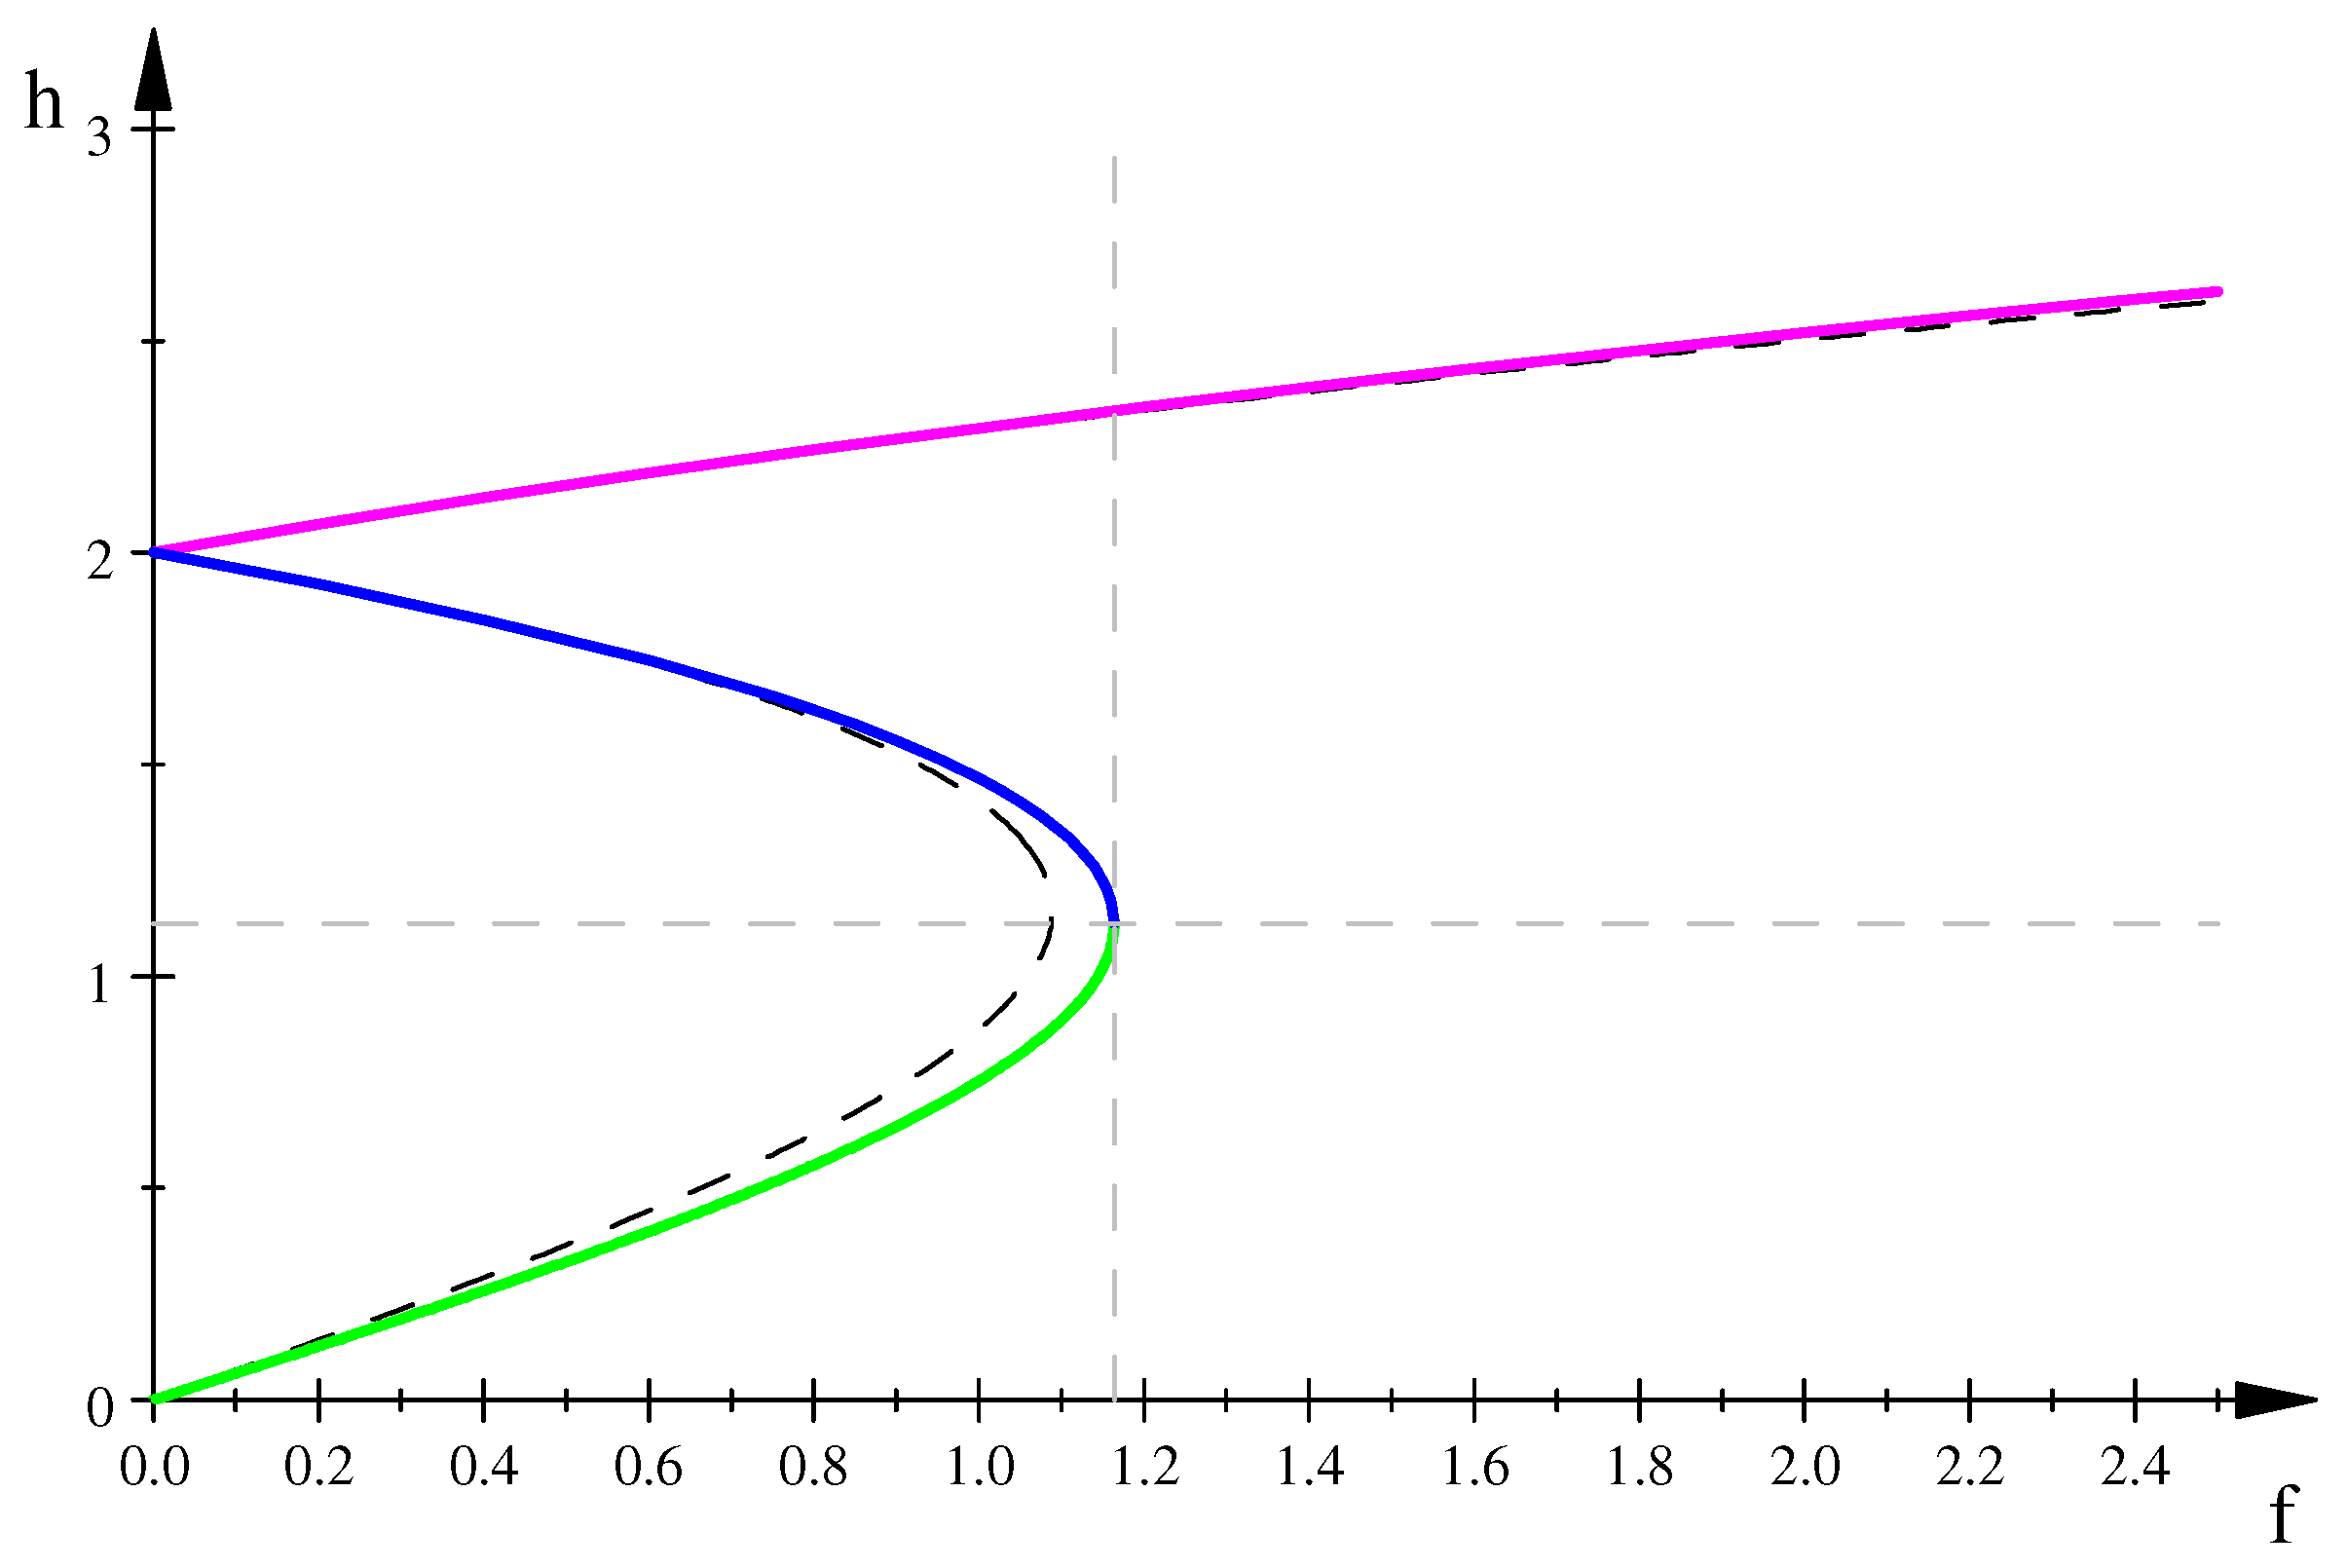
3.1. Damped Driven Pendulum

The damped driven pendulum is a very interesting non-linear dynamical system exhibiting chaotic dynamics [34,35,36,37,38] and fractal basin boundaries [13,39]. The pendulum equation with friction and external periodic force in nondimensional variables is [14]:
d 2 y d τ 2 + h d y d τ + sin y = f cos Ω τ .
Equation (18) can be considered a special case of the generalized Duffing equation:
y ¨ + h y ˙ + c 0 y + c 1 y 3 + c 2 y 5 + + c n y 2 n + 1 = f cos Ω τ ,
in the limit n , where overdots denote derivatives with respect to τ , with
c n = 1 n 2 n + 1 ! , n = 0 , 1 , 2 , ,
since sin y = n = 0 c n y 2 n + 1 .
In [23], we have determined the asymptotic solution (2) of Equation (19) by computing the amplitude-frequency response equation. It follows that the amplitude function for the pendulum is:
L X , Y ; f , h   = h 2 X Y + Y X p Y 2 f 2 = 0 , X Ω 2 , Y A 2
where
p Y = n = 0 d n Y 2 n + 1 ,
d n = 2 n 2 n + 1 ! ! n + 1 ! c n , n = 0 , 1 , 2 , .
Note that d n   = 2 n 1 n + 1 ! 2 n ! ! ; therefore, the series defining function p Y converges very rapidly. Similar computations were performed for the unforced generalized Duffing equation f = 0 for an arbitrary n in [40] and within another formalism for a driven generalized Duffing oscillator in [41]. Moreover, the authors of [40] documented convergence of their approximate solution to the exact numerical solution for n = 0 , 1 , 2 , 3 . We have obtained, for the function p Y , the same formula as obtained earlier in [40].
We can now compute approximations of the bifurcation set. To this end, we define:
L m X , Y   = h 2 X Y + Y X p m Y 2 f 2 , p m Y = k = 0 m d k Y k ,
and, as explained in Section 2.4, solve equations:
L m X , Y = h 2 X Y + Y X p m Y 2 f 2 = 0 ,
L m X , Y X = 0 ,
obtaining a solution for X and a polynomial equation for Y:
X = 1 2 h 2 + p m Y ,
w m Y = h 2 Y p m Y     1 4 h 4 Y f 2 = = k = 0 m h 2 d k Y k + 1 1 4 h 4 Y f 2 = 0 .
Finally, the condition for bifurcation sets M m , m = 1 , 2 , is:
f , h   M m : R w m , w m   = 0 = Ɗ m f , h ,
where R w m , w m is a resultant of w m and w m ; see the Appendix A.
For example,
M 1 : Ɗ 1 = h 6 8 h 4 + 16 h 2 8 f 2 = 0
M 2 : Ɗ 2 =   2 h 5 + 6 h 4 8 h 2 + 3 f 2 2 h 5 6 h 4 + 8 h 2 3 f 2   = 0
M 3 : Ɗ 3 = 243 h 14 1728 h 12 + 2592 h 10 2376 f 2 h 8 + 6912 h 6 576 f 2 + 6 f 2 h 4 + 432 f 4 h 2 64 f 6 = 0 .
Note that points f * , h *   M m are exactly the same as in singular solutions X * , Y * , f * , h * of equations:
L m X , Y   = 0 , L m X , Y X = 0 , L m X , Y X = 0 .
For any real f there are 6 + 4 m 1 values of h lying on M m , mostly complex. For f < f c r = 1.1637 there are three real h > 0 on M m m = 3 , 4 , ; there are thus three branches in the plots, while for f > f c r there is only one real h > 0 . Although the number of solutions increases, we note that for increasing m, solutions of the equation Ɗ m = 0 converge rapidly. To show this we have computed a family of singular points for f = 0.5 , see Table 1, converging from the dashed line m = 1 to the green line m = 7 in Figure 3:
Since the convergence is fast, it is meaningful to consider the limit M = lim k M k defining the bifurcation set for the pendulum. It follows that M 7 approximates M very exactly (at least for real (physical) singular points).
In Figure 3, we show for real values of f, h the bifurcation sets M 1 and M 7 (note that the set M 3 already provides quite a good approximation of M ). The corresponding amplitude profile with self-intersection is shown in Figure 4.
More exactly, for f = 0.5 we compute numerically from the equation Ɗ 7 0.5 , h   = 0 the singular value h * = 0.326 435 . It is a self-intersection, and we also show in Figure 4 a metamorphosis of the amplitude profile L 7 Ω 2 , A 2 ; f , h *   = 0 for f < 0.5 , f = 0.5 , h > 0.5 .
In bifurcation diagrams in Figure 5, we show that a stable branch is disrupted at a singular point (blue and green colours in Figure 5 correspond to blue and green colours in Figure 4).
In a numerical simulation for the damped driven pendulum (18), the bifurcation occurs not at f * = 0.5 but at 0.5204 < f < 0.5206 , and it follows that the KBM method’s error is about 4 % , yet the character of the bifurcation is in agreement with our prediction.

3.2. Driven Pendulum with van der Pol’s Type Damping

A driven pendulum with van der Pol’s type damping is a more complicated pendulum dynamical system [42,43,44]. A non-dimensional equation describing a driven pendulum with van der Pol damping is:
d 2 y d τ 2 μ 1 ν y 2 d y d τ + sin y = G sin Ω τ .
Equation (32) and Equation (3) of [31] are compatible (but, of course, not equivalent) for ν = 1 and λ = 1 6 , and we obtain Equation (18) for ν = 0 , μ = h , and G = f .
The amplitude equation was computed by the Krylov–Bogoliubov–Mitropolsky method as:
L m X , Y , μ , ν , G   = μ 2 X Y 1 1 4 ν Y 2 + Y X p m Y 2 G 2 ,
where
p m Y = k = 0 m d k Y k ,
and the coefficients d k are given in Equation (23).
To compute the bifurcation set, we solve equations (cf. Section 2.4):
L m X , Y , μ , ν , G = 0
L m X , Y , μ , ν , G X = 0
obtaining
X = 1 32 μ 2 ν Y 4 2 + p m Y ,
w m Y = 64 μ 2 Y ν Y 4 2 p m Y + + μ 4 Y ν Y 4 4 + 1024 G 2 = 0 .
The bifurcation sets M m consist of such parameter values for which the polynomials w m Y have multiple roots. Accordingly, conditions for the bifurcation sets are (see Equation (A2)):
μ , ν , G   M m : R w m , w m   = 0 = Ɗ m μ , ν , G Ɗ m μ , ν , G   = G 2 d m μ , ν , G
where Ɗ m and d m are high-order polynomials of the variables μ , ν , G .
In the Table 2, we show for μ = 1 , ν = 1 the convergence of physical (real) solutions of equation d 5 μ , ν , G   = 0 for growing values of m:
We note that the convergence is fast. We show the bifurcation set M 3 (i.e., d 3 = 0 , G = 0 ) in Figure 6.
This surface has a richer structure than the bifurcation set for the Duffing–van der Pol equation (i.e., M 1 ), cf. Figure 1 in [31]. We note that the surface d 3 = 0 (sienna) consists of several patches intersecting one another along some lines and intersected by the plane G = 0 (blue and green).
In this work, we make a preliminary exploration of the bifurcation set. More precisely, we have found up to now that physical (corresponding to real Ω , A) points lying on the surface d 3 = 0 are self-intersections, while points belonging to the plane G = 0 correspond to pairs of isolated points; see the Section 3.2.2 on isolated points below. It is interesting that some points on the surface d 3 = 0 correspond to two self-intersections of the amplitude profiles—they lie on some self-intersections of the surface d 3 = 0 ; see the Section 3.2.1 below.

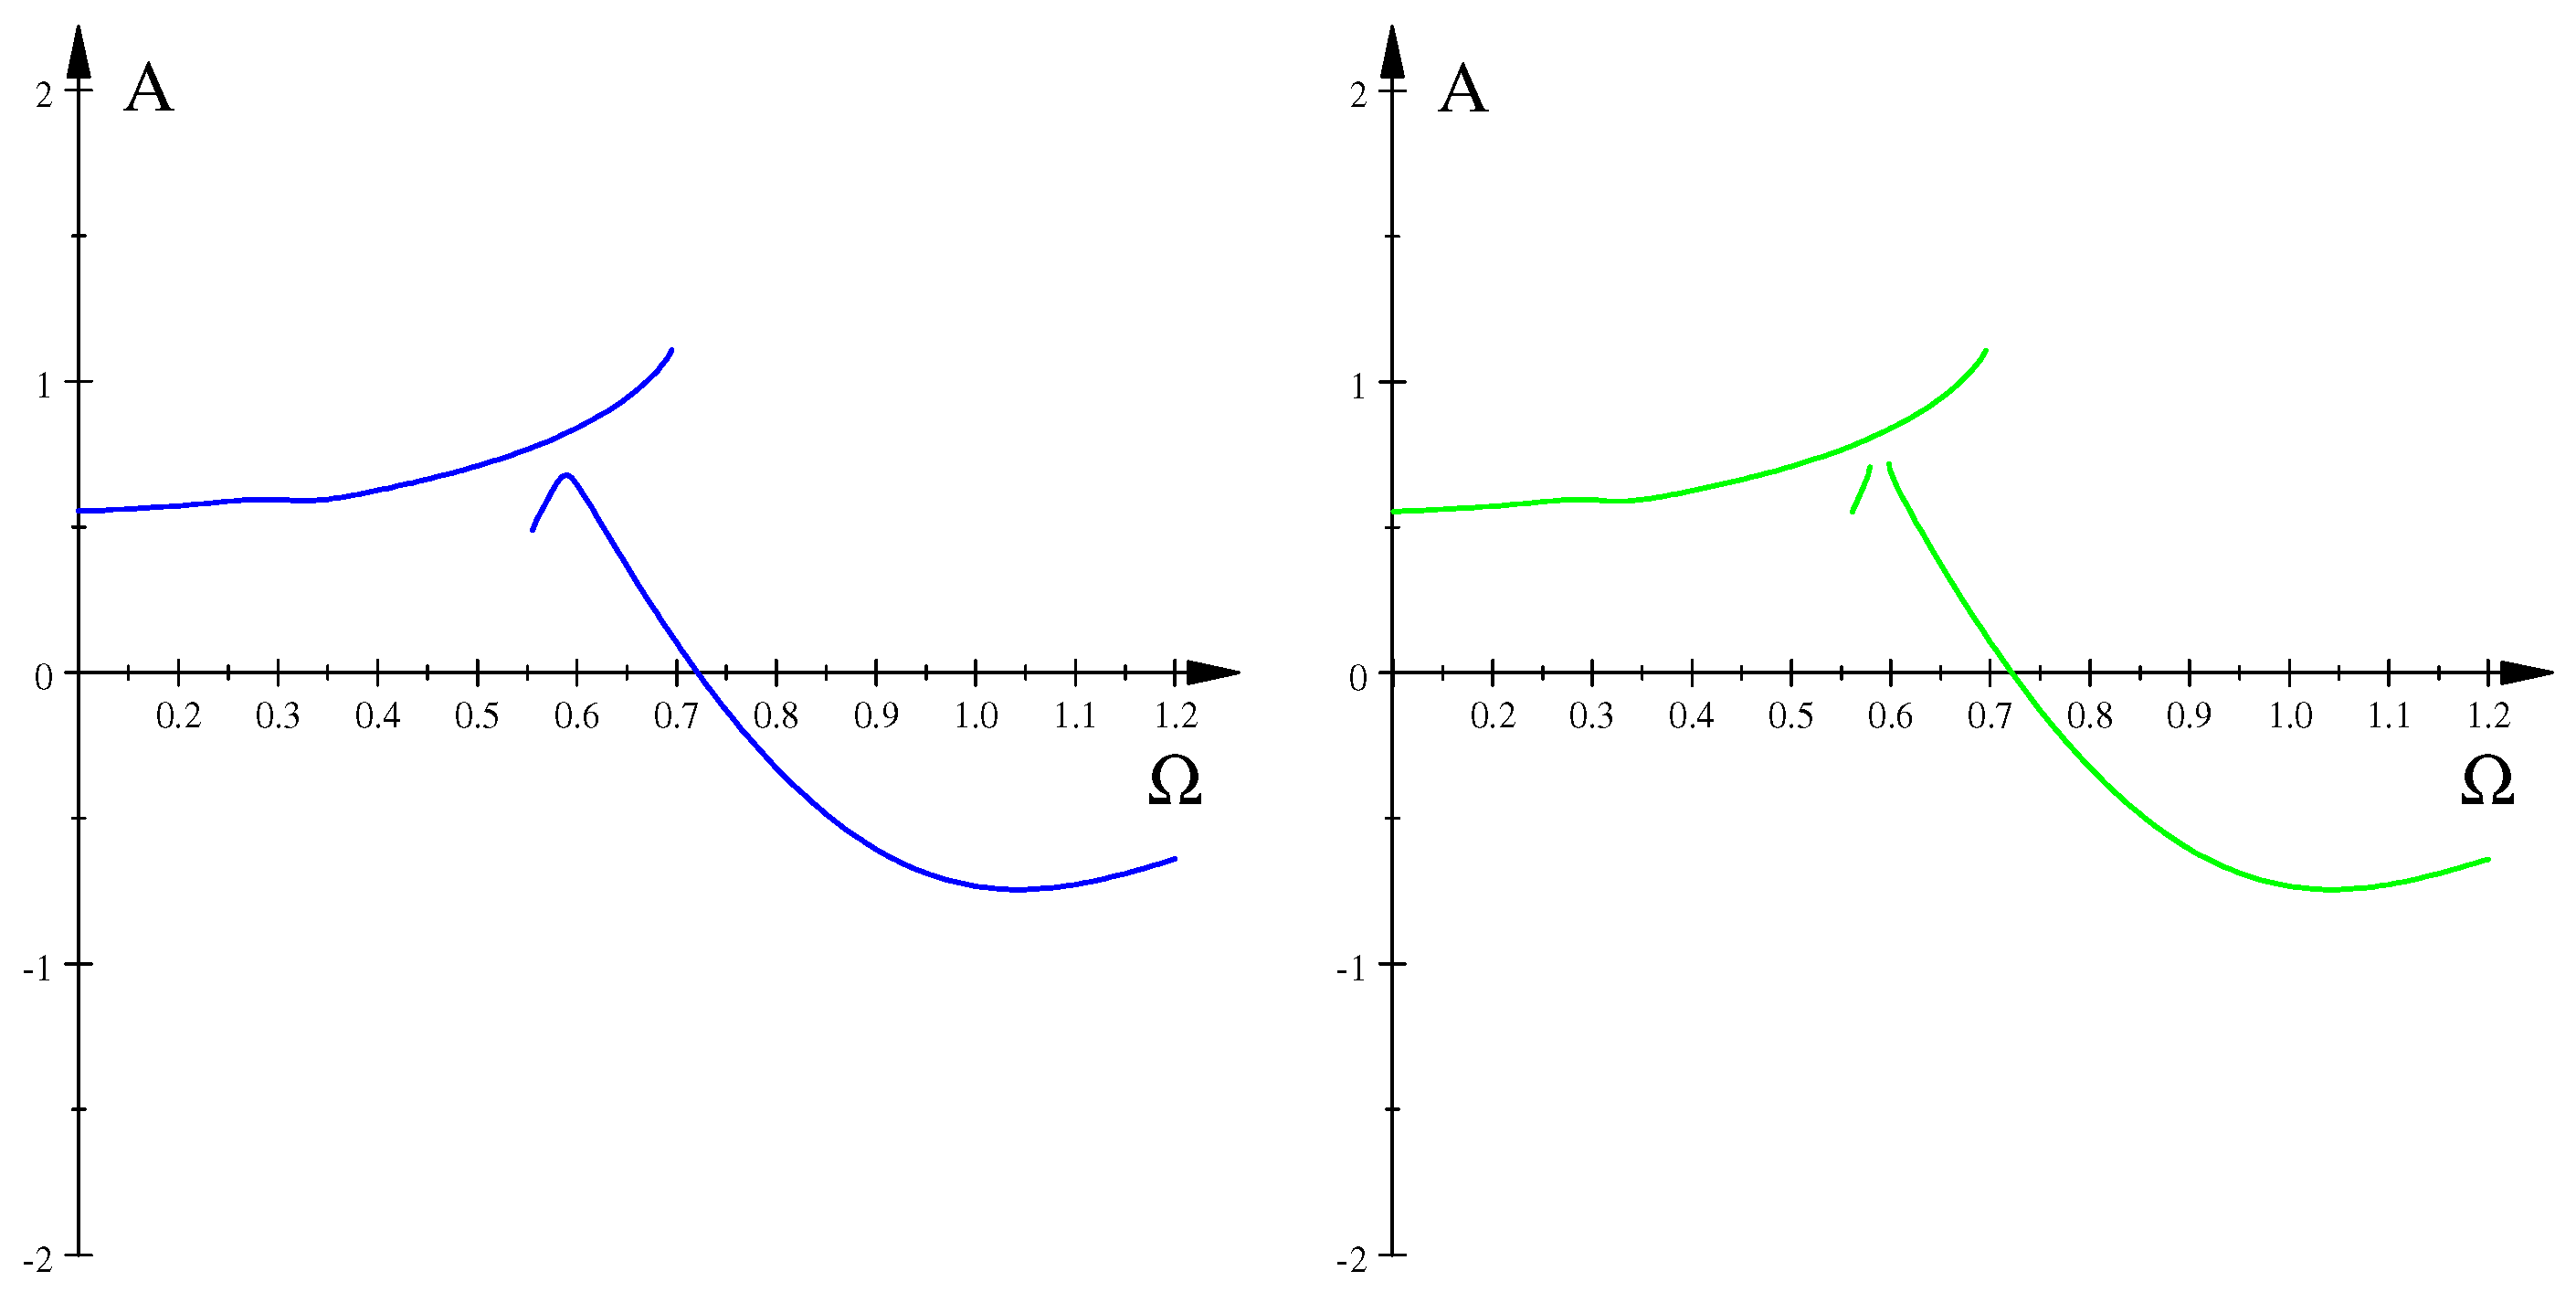
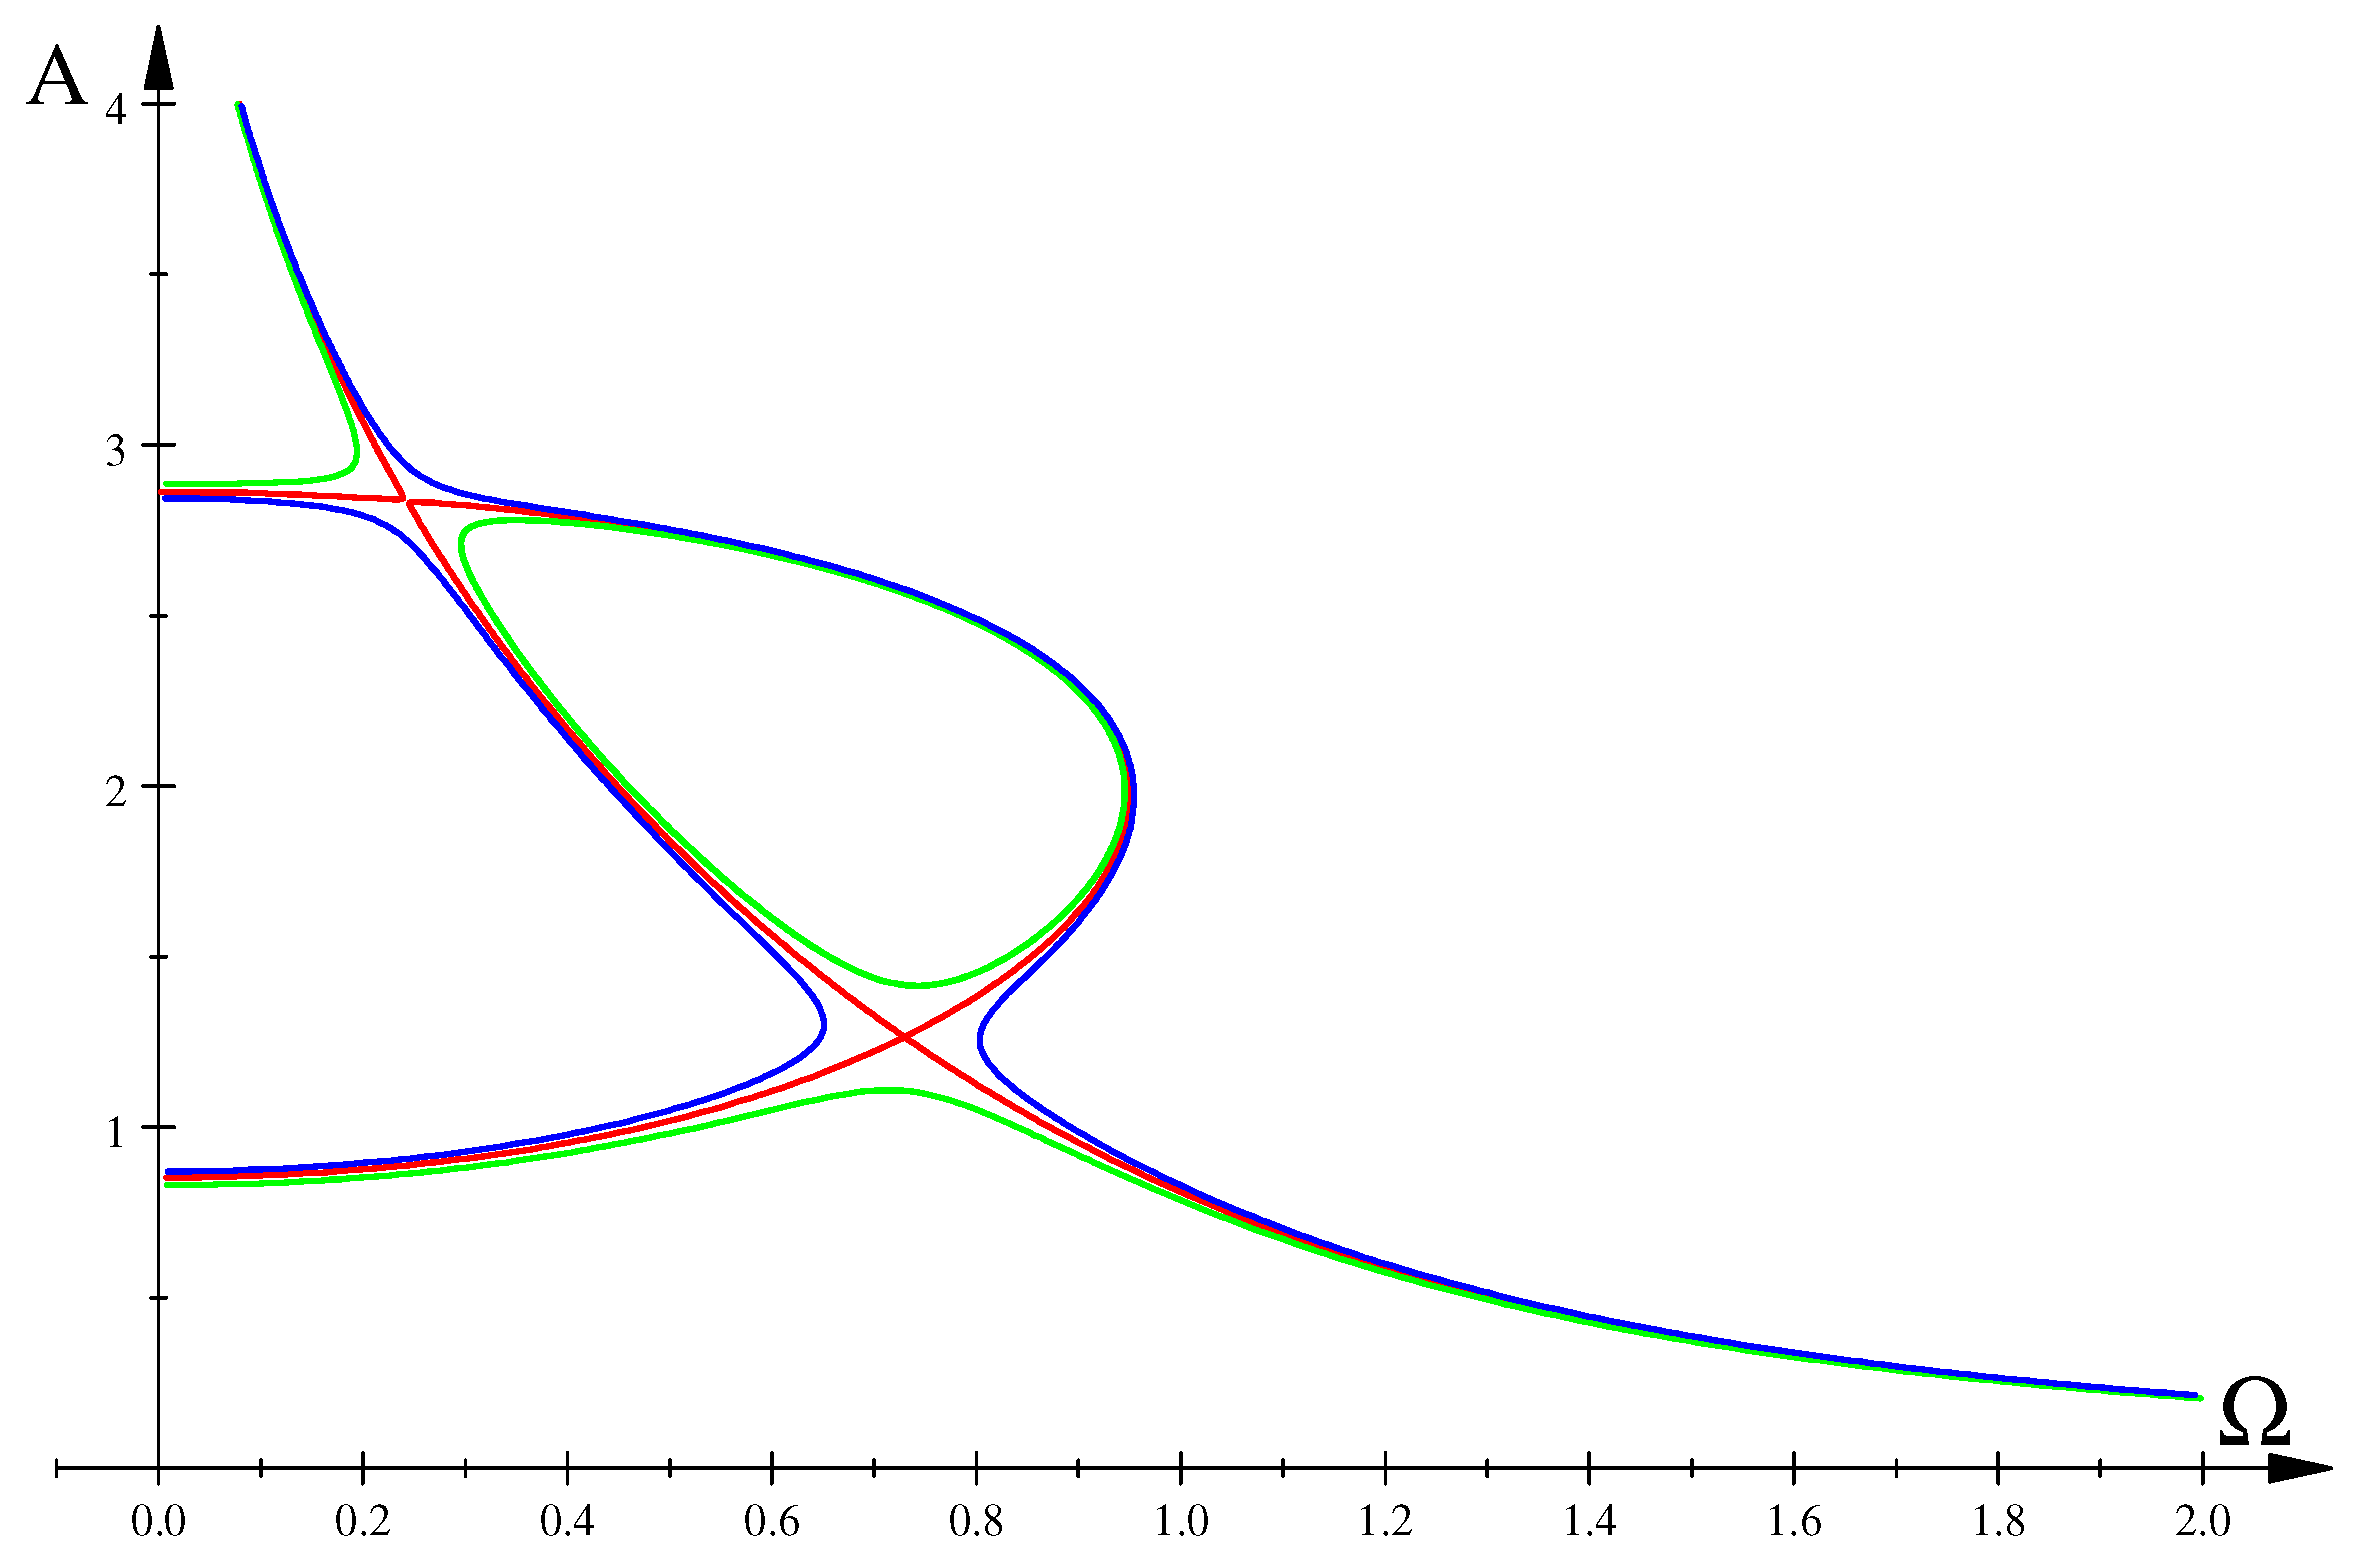
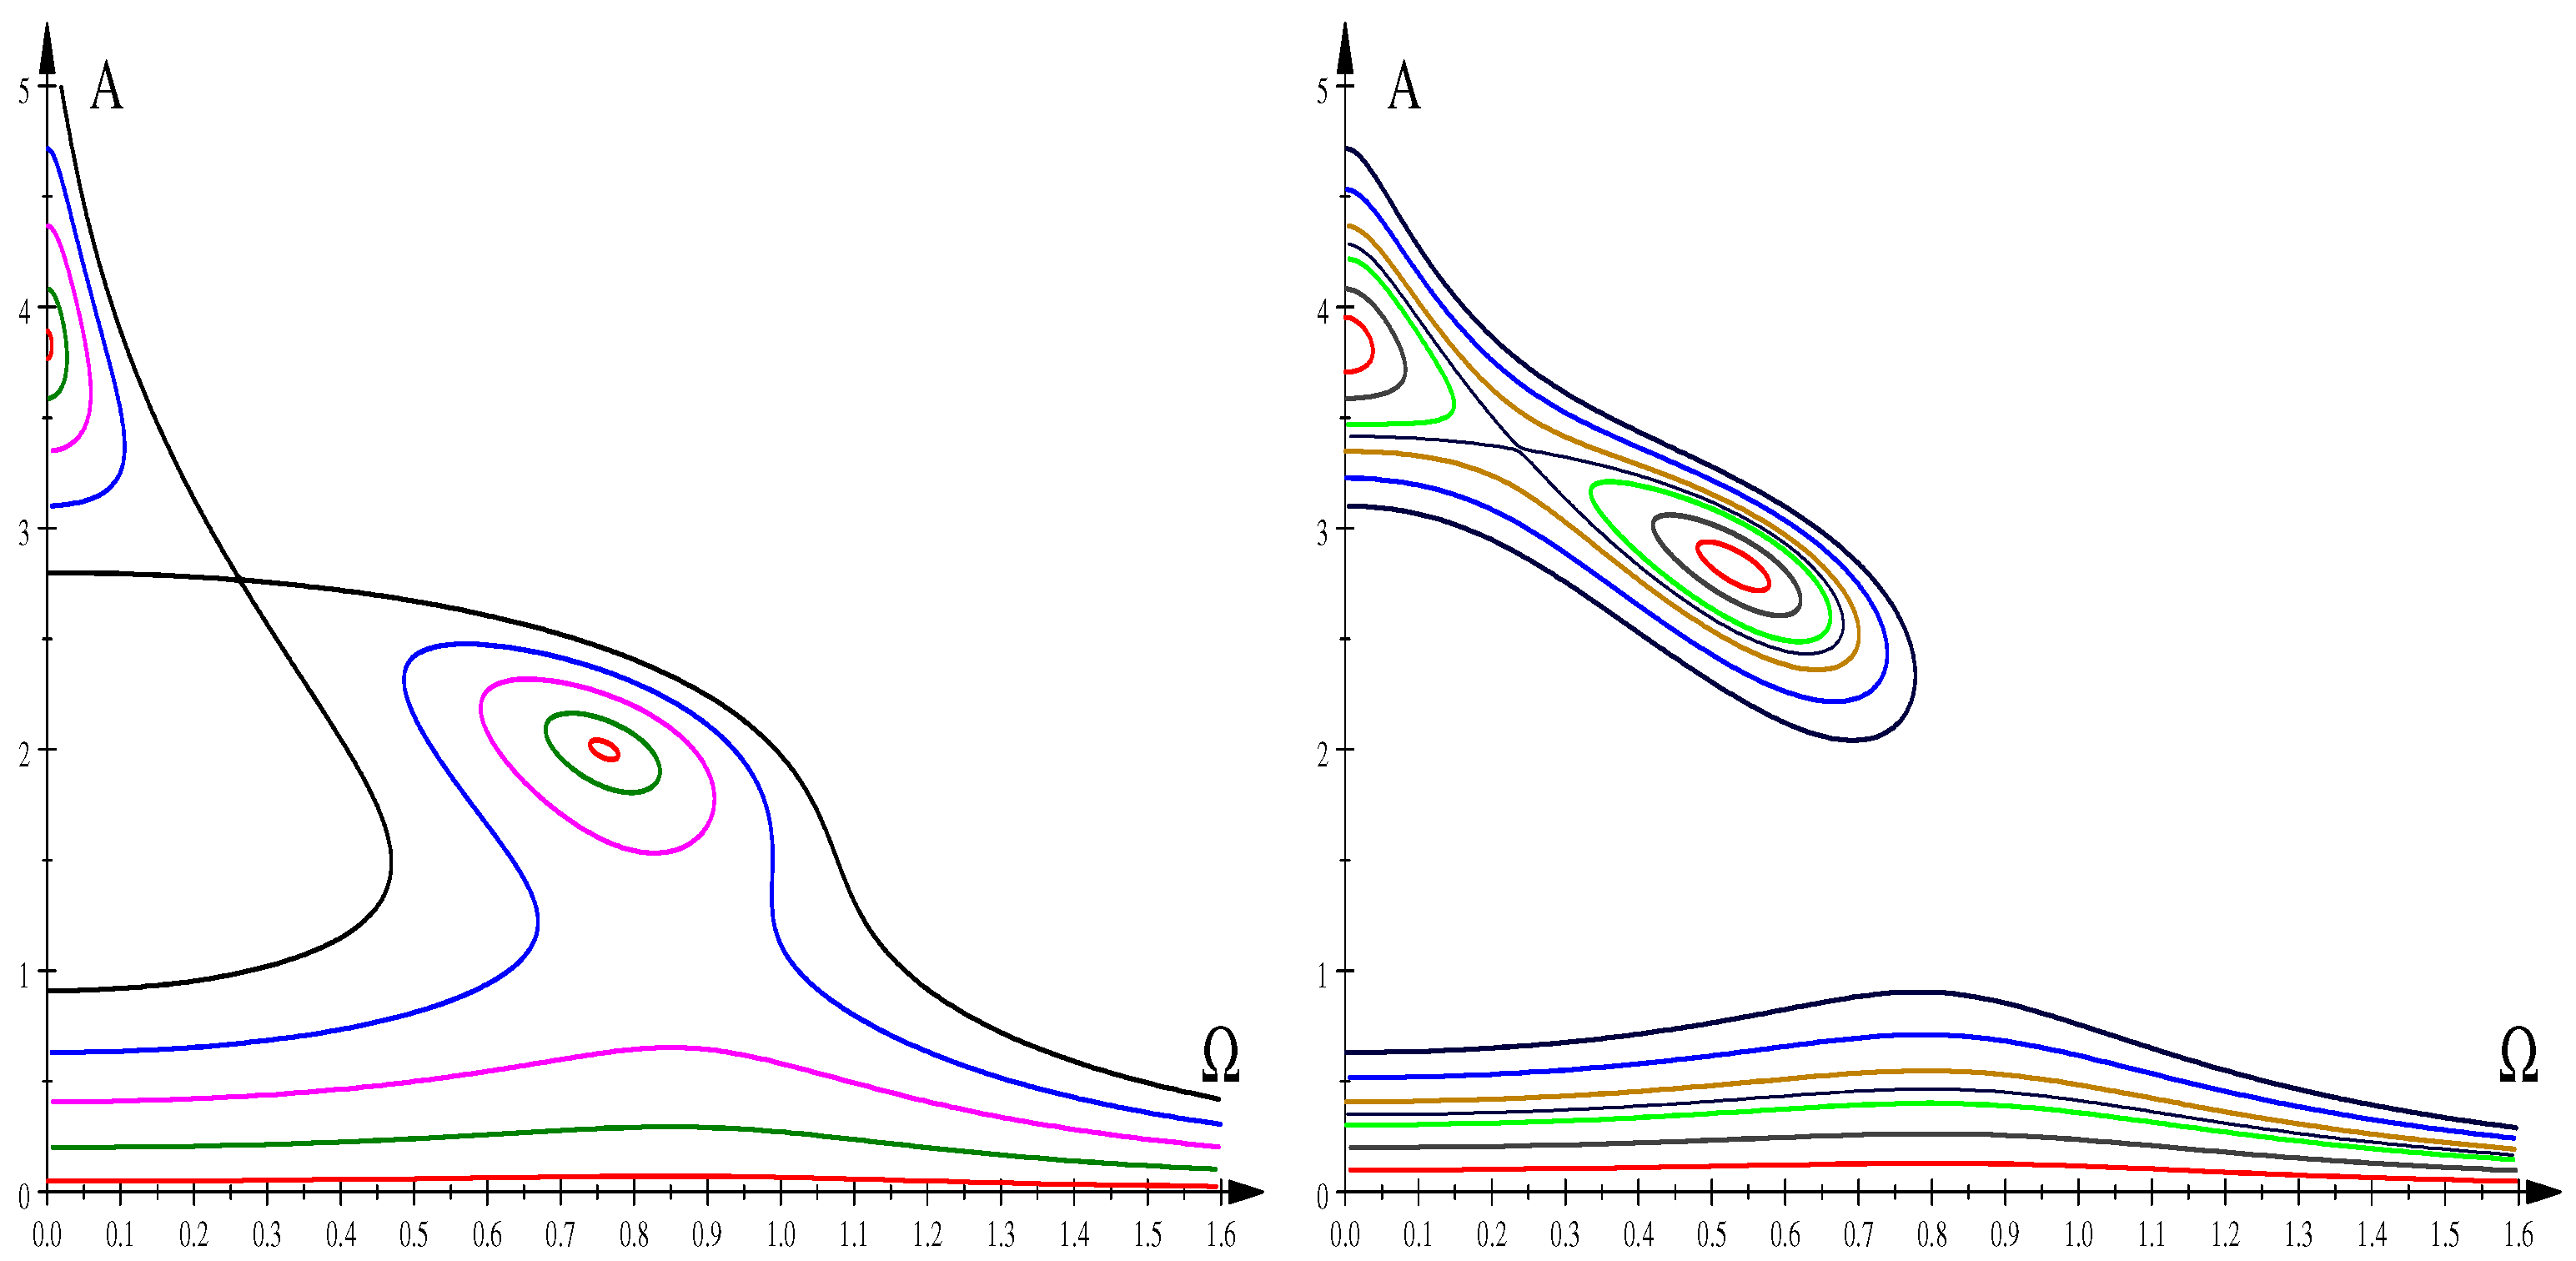
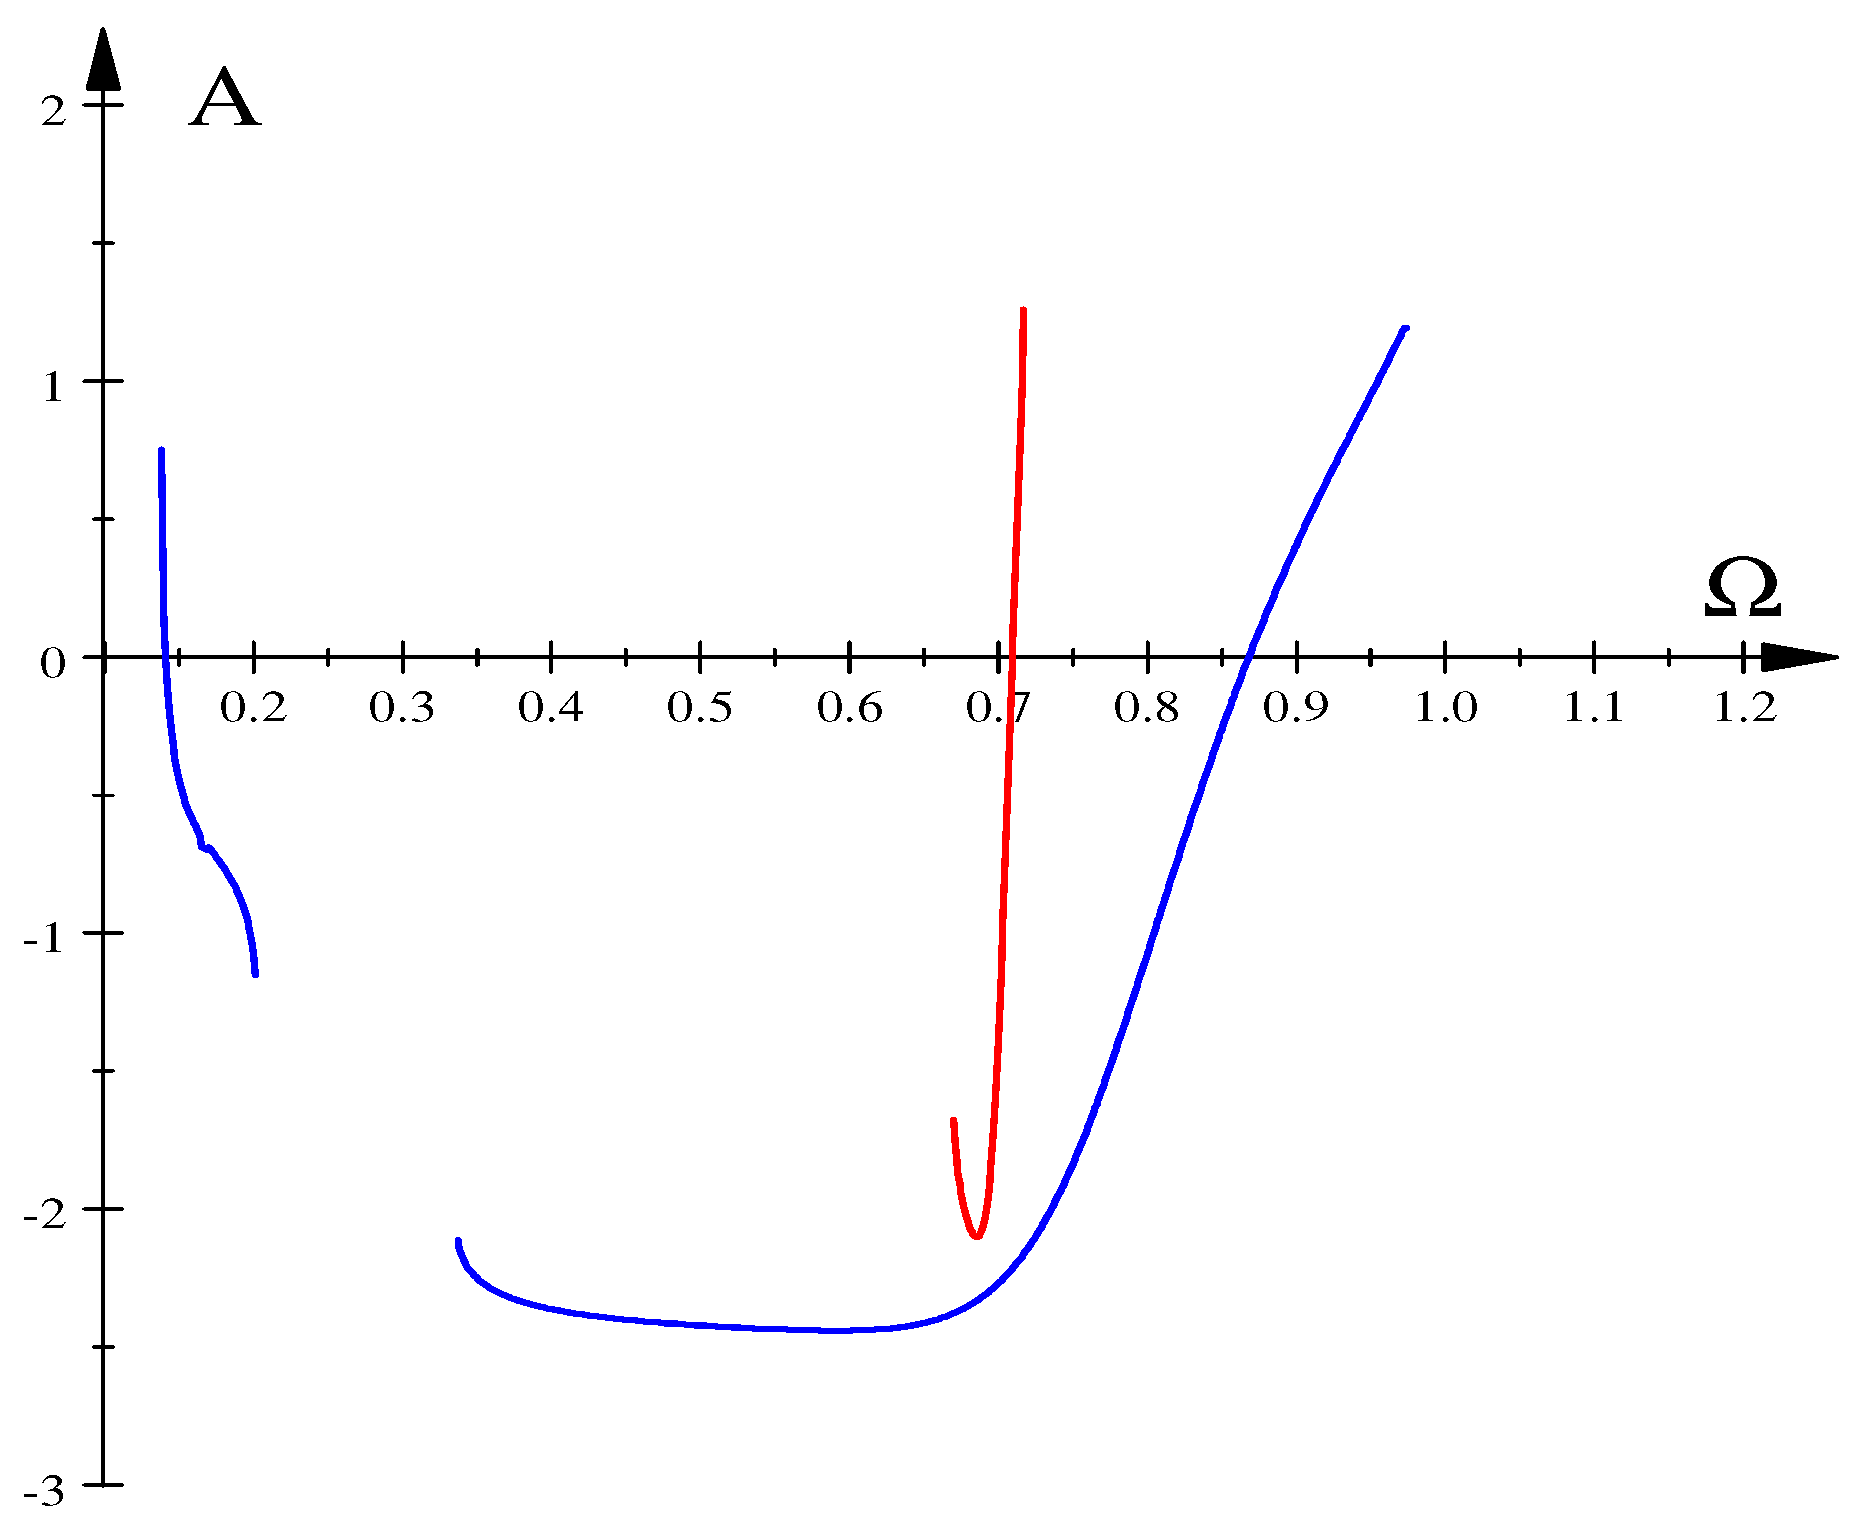
3.2.1. Two Self-Intersections

Singular points—points belonging to the self-intersection of the surface Ɗ 5 μ , ν , G   = 0 —can be computed numerically. It follows from Figure 6 that for some μ = μ 0 there are self-intersections of the surface d 3 μ , ν , G   = 0 . Therefore, a point ν 0 , G 0 on the intersection curve can be computed from the following equations [31]:
Ɗ 5 μ 0 , ν , G G = 0 ,
Ɗ 5 μ 0 , ν , G ν = 0 .
For example, for μ 0 = 1.1 , we get from Equation (40a,b) ν 0 = 0.797 754 , G 0 = 0.777 016 , and from equations defining a singular point, L 5 X , Y , μ , ν 0 , G 0   = 0 , L 5 X , Y , μ , ν 0 , G 0 X = 0 , L 5 X , Y , μ , ν 0 , G 0 Y = 0 , we obtain again μ 0 = 1.1 , and two singular points Ω 0 , A 0   =   0.242 040 , 2.836 903 , Ω 0 , A 0   =   0.729 602 , 1.264 283 corresponding to a pair of self-intersections of the amplitude profile (note that X = Ω 2 , Y = A 2 ); see Figure 7. Bifurcation diagrams are shown in Figure 8.
Lef top and right top figures show the disruption of the bifurcation curve due to metamorphosis at the left self-intersection in Figure 7 while the left bottom and right bottom curves show, for an inverted time flow, analogous bifurcation due to metamorphosis at the right self-intersection in Figure 7. Green and blue colours in Figure 8 correspond to green and blue colours in Figure 7.

3.2.2. Two Isolated Points

Isolated points lie on the plane G = 0 . Moreover, these are always pairs of isolated points, since the resultant is proportional to G 2 , Ɗ m μ , ν , G   = G 2 d m μ , ν , G , and hence, there is always a double solution of the equation Ɗ m μ , ν , G   = 0 . It follows that the implicit function L m Ω , A ; μ , ν , G   = 0 contracts locally to two isolated points for G 0 and arbitrary μ and ν . This result simplifies our analysis for the Duffing–van der Pol equation ( m = 1 ) [31] and generalizes if for an arbitrary m.
In Figure 9, we show, for two different sets of values of parameters μ , ν , two examples of local contractions of the amplitude profiles to two isolated points for G 0 .
Bifurcation diagrams for the left amplitude profiles in Figure 9 are shown in Figure 10 (colours of stable branches correspond to colours of amplitude profiles in the left Figure 9).
The blue bifurcation diagram of Figure 10 shows two stable branches corresponding to two disjoint parts of the blue amplitude profile in Figure 9. In the case of the red bifurcation diagram of Figure 10, we see that only the right red amplitude profile shown in the left Figure 9 is stable.
Note a qualitative agreement of the red and blue bifurcation diagrams of Figure 10 with the red and blue amplitude profiles shown in the left Figure 9.

4. Discussion and Conclusions

This work has described critical points of the function Ω = f A , given by Equation (4a,b), and classified singular points of the amplitude-frequency response function, defined by Equation (10a–c). It should be noted that both conditions are expressed in terms of the known implicit function F Ω , A ; c ̲ (computed by an asymptotic method) and thus can be easily tackled analytically or numerically. Furthermore, we have described how dynamics change at critical or singular points of F Ω , A ; c ̲ , providing several examples.
We have applied this methodology to the damped driven pendulum and driven pendulum with van der Pol’s type damping, predicting several metamorphoses of the amplitude profile F Ω , A ; c ̲ and related bifurcations of dynamics.
More precisely, we have computed bifurcation sets c ̲ M n : Ɗ n c ̲   = 0 , where Ɗ n is a non-linear function of parameters c ̲ and n + 1 is the number of terms in the expansion of the pendulum term sin y . The bifurcation set M n consists of parameters c ̲   =   c 1 , c 2 , , c n , for which the function F n Ω , A ; c ̲ has a singular point. It turns out that for both pendulum systems considered, for growing values of n, the bifurcation sets M n converge fast. In conclusion, the computed bifurcation sets M n provide quite good information about pendulum bifurcation sets M .
We have confirmed our predictions of bifurcations of dynamics by numerical simulation of pendulums dynamics, documenting bifurcations of dynamics of predicted character. Deviations of the computed singular parameter values from parameter values for which a bifurcation of dynamics occurred in dynamical systems, as in (18) and (32), can be attributed to inaccuracies of the computed amplitude profiles F n Ω , A ; c ̲ due to the approximate nature of the asymptotic method (the Krylov–Bogoliubov–Metropolsky approach) used in our work.

Author Contributions

J.K. and A.O. Data curation; Formal analysis; Investigation; Methodology; Writing-review & editing. Both authors contributed equally to this work. All authors have read and agreed to the published version of the manuscript.

Funding

This research received no external funding.

Data Availability Statement

Computational details are available from the authors.

Conflicts of Interest

The authors declare no conflict of interest.

Abbreviations

The following abbreviations are used in this manuscript:
KBMKrylov–Bogoliubov–Mitropolsky
VTVertical tangency

Appendix A. Discriminants and Resultants of Polynomials

A necessary and sufficient condition for a polynomial f x to have multiple roots is that its discriminant Δ vanishes [45,46]. In case a polynomial has a multiple root, then f and its derivative f = d f d x have a common root. It thus follows that a discriminant Δ can be computed as a resultant of a polynomial f x and its derivative f x , denoted as R f , f , with a normalizing factor.
More generally, polynomials f and g have a common root if and only if their resultant R f , g is zero [45,46]. The resultant R f , g of two polynomials, f x   = a n x n + + a 1 x + a 0 , g x   = b m x m + + b 1 x + b 0 , a n 0 , b m 0 , can be computed as a determinant of the m + n   ×   m + n Sylvester matrix, which has m rows involving a i and n rows involving b j —see, for example, Equation (1) in [46] (or the equivalent Equation (1.12), Chapter 12 in [45]) or Equation (A1) below.
R f , g   = det a n a n 1 a n 2 0 0 0 0 a n a n 1 0 0 0 0 0 0 a 1 a 0 0 0 0 0 a 2 a 1 a 0 b m b m 1 b m 2 0 0 0 0 b m b m 1 0 0 0 0 0 0 b 1 b 0 0 0 0 0 b 2 b 1 b 0 .
It follows that the resultant R f , g is [45,46]:
R f , g   = a n m b m n i = 1 n j = 1 m ξ i η j   a n m b m n Ɗ a ̲ , b ̲ ,
where ξ 1 , ξ 2 , ξ n are roots of f and η 1 , η 2 , η m are roots of g. Note that Ɗ a ̲ , b ̲ is a high-order polynomial of variables a ̲ =   a 0 , a 1 , , a n , b ̲ =   b 0 , b 1 , , b m .

Appendix B. Computational Details

Non-linear polynomial equations were solved numerically using the computational engine Maple 4.0 from the Scientific WorkPlace 4.0. Figures were plotted with the computational engine MuPAD 4.0 from Scientific WorkPlace 5.5. Curves shown in bifurcation diagrams in Figure 5, Figure 8 and Figure 10 were computed by numerically integrating Equations (18) and (32) running DYNAMICS, a program written by Helena E. Nusse and James A. Yorke [11], and our own programs written in Pascal.

References

  1. Nance, R.E.; Overstreet, C.M. History of computer simulation software: An initial perspective. In Proceedings of the 2017 Winter Simulation Conference (WSC), Las Vegas, NV, USA, 3–6 December 2017. [Google Scholar]
  2. Wikipedia Contributors. List of Computer Simulation Software. Wikipedia, The Free Encyclopedia. Wikipedia, The Free Encyclopedia, 2 November 2021. Web. 9 December 2021. Available online: https://en.wikipedia.org/w/index.php?title=List_of_computer_simulation_software&oldid=1053178584 (accessed on 2 November 2021).
  3. Metropolis, V.N.; Ulam, S. Monte carlo method. Natl. Bur. Stand. Appl. Math. Ser. 1951, 12, 36. [Google Scholar] [CrossRef]
  4. Metropolis, N.; Ulam, S. The monte carlo method. J. Am. Stat. Assoc. 1949, 44, 335–341. [Google Scholar] [CrossRef]
  5. Borrelli, A.; Wellmann, J. Computer Simulations Then and Now: An Introduction and Historical Reassessment. NTM 2019, 27, 407–417. [Google Scholar] [CrossRef] [Green Version]
  6. Steinhauser, M.O. Computer Simulation in Physics and Engineering; de Gruyter: Berlin, Germany, 2012. [Google Scholar]
  7. Luo, A.C.J.; Liming, D.; Hamid, R.H. (Eds.) Nonlinear Science and Complexity; World Scientific: Singapore, 2007. [Google Scholar]
  8. Euler, L. Institutionum calculi integralis Vol. Primum. In Opera Omnia Series Prima; Bibliotheca Teubneriana; de Gruyter: Berlin, Germany, 1768. [Google Scholar]
  9. Runge, C. Ueber die numerische Auflösung von Differentialgleichungen. Math. Ann. 1895, 4, 167–178. [Google Scholar] [CrossRef] [Green Version]
  10. Kutta, W. Beitrag zur naherungsweisen Integration von Differentialgleichungen. Z. Math. Phys. 1901, 46, 435–453. [Google Scholar]
  11. Nusse, H.E.; Yorke, J.A. Dynamics: Numerical Explorations: Accompanying Computer Program Dynamics; Springer: Berlin/Heidelberg, Germany; Dordrecht, The Netherlands; New York, NY, USA, 2012; Volume 101. [Google Scholar]
  12. Poincaré, H. The Three-Body Problem and the Equations of Dynamics: Poincaré’s Foundational Work on Dynamical Systems Theory; Springer: Berlin/Heidelberg, Germany; Dordrecht, The Netherlands; New York, NY, USA, 2017; Volume 443. [Google Scholar]
  13. Ott, E. Chaos in Dynamical Systems; Cambridge University Press: Cambridge, UK, 2002. [Google Scholar]
  14. Schuster, H.G.; Just, W. Deterministic Chaos: An Introduction; John Wiley & Sons: Hoboken, NJ, USA, 2006. [Google Scholar]
  15. Thom, R. Stabilité Structurelle et Morphogénèse; Benjamin: New York, NY, USA, 1972. [Google Scholar]
  16. Arnold, V.I.; Afrajmovich, V.S.; Il’yashenko, Y.S.; Shil’nikov, L.P. Dynamical Systems V: Bifurcation Theory and Catastrophe Theory; Springer: Berlin/Heidelberg, Germany; Dordrecht, The Netherlands; New York, NY, USA, 2013; Volume 5. [Google Scholar]
  17. Guckenheimer, J.; Holmes, P. Nonlinear Oscillations, Dynamical Systems, and Bifurcations of Vector Fields; Springer: Berlin/Heidelberg, Germany; Dordrecht, The Netherlands; New York, NY, USA, 2013; Volume 42. [Google Scholar]
  18. Holmes, P.J.; Rand, D.A. The bifurcations of Duffing’s equation: An application of Catastrophe Theory. J. Sound Vib. 1976, 44, 237–253. [Google Scholar] [CrossRef]
  19. Cveticanin, L. Strongly Nonlinear Oscillators: Analytical Solutions, 2nd ed.; Mathematical Engineering; Springer: Berlin/Heidelberg, Germany; Dordrecht, The Netherlands; New York, NY, USA, 2018. [Google Scholar]
  20. Nayfeh, A.H. Introduction to Perturbation Techniques; John Wiley & Sons: Hoboken, NJ, USA, 2011. [Google Scholar]
  21. Nayfeh, A.H.; Balachandran, B. Applied Nonlinear Dynamics: Analytical, Computational, and Experimental Methods; John Wiley & Sons: Hoboken, NJ, USA, 2008. [Google Scholar]
  22. Kyzioł, J.; Okniński, A. Effective equation for two coupled oscillators: Towards a global view of metamorphoses of the amplitude profiles. Int. J. Nonlinear Mech. 2020, 123, 103495. [Google Scholar] [CrossRef]
  23. Kyzioł, J.; Okniński, A. Duffing-type equations: Singular points of amplitude profiles and bifurcations. Acta Phys. Polon. B 2021, 52, 1239–1262. [Google Scholar] [CrossRef]
  24. Kalmár-Nagy, T.; Balachandran, B. Forced harmonic vibration of a Duffing oscillator with linear viscous damping. In The Duffing Equation: Nonlinear Oscillators and Their Behavior; John Wiley & Sons: Hoboken, NJ, USA, 2011; pp. 139–174. [Google Scholar]
  25. Kyzioł, J.; Okniński, A. Coupled nonlinear oscillators: Metamorphoses of amplitude profiles. The case of the approximate effective equation. Acta Phys. Polon. B 2011, 42, 2063–2076. [Google Scholar] [CrossRef]
  26. Kyzioł, J. Metamorphoses of resonance curves for two coupled oscillators: The case of small non-linearities in the main mass frame. Int. J. Nonlinear Mech. 2015, 76, 164–168. [Google Scholar] [CrossRef]
  27. Awrejcewicz, J. (Ed.) Modified Poincaré method and implicit function theory. In Nonlinear Dynamics: New Theoretical and Applied Results; Akademie Verlag: Berlin, Germany, 1995; pp. 215–229. [Google Scholar]
  28. Spivak, M. Calculus on Manifolds; W.A. Benjamin, Inc.: Menlo Park, CA, USA, 1965. [Google Scholar]
  29. Wall, C.T.C. Singular Points of Plane Curves; Cambridge University Press: New York, NY, USA, 2004. [Google Scholar]
  30. Kyzioł, J.; Okniński, A. The Duffing–Van der Pol Equation: Metamorphoses of Resonance Curves. Nonlinear Dyn. Syst. Theory 2015, 15, 25–31. [Google Scholar]
  31. Kyzioł, J.; Okniński, A. Van der Pol-Duffing oscillator: Global view of metamorphoses of the amplitude profiles. Int. J. Nonlinear Mech. 2019, 116, 102–106. [Google Scholar] [CrossRef] [Green Version]
  32. Kyzioł, J.; Okniński, A. Metamorphoses of Amplitude Curves in a System of Coupled Oscillators. The Case of Degenerate Singular Points. AIP Conf. Proc. 2018, 1922, 100001. [Google Scholar]
  33. Kyzioł, J.; Okniński, A. Metamorphoses of resonance curves in systems of coupled oscillators: The case of degenerate singular points. Int. J. Nonlinear Mech. 2017, 95, 272–276. [Google Scholar] [CrossRef]
  34. d’Humieres, D.; Beasley, M.R.; Huberman, B.A.; Libchaber, A. Chaotic states and routes to chaos in the forced pendulum. Phys. Rev. A 1982, 26, 3483–3496. [Google Scholar] [CrossRef]
  35. Bohr, T.; Bak, P.; Jensen, M.H. Transition to chaos by interaction of resonances in dissipative systems. II. Josephson junctions, charge-density waves, and standard maps. Phys. Rev. A 1984, 30, 1970–1981. [Google Scholar] [CrossRef]
  36. Kadanoff, L.P. From periodic motion to unbounded chaos: Investigations of the simple pendulum. Phys. Scr. 1985, T9, 5–10. [Google Scholar] [CrossRef] [Green Version]
  37. Gray, D.D. The Damped Driven Pendulum: Bifurcation Analysis of Experimental Data. Ph.D. Thesis, Reed College, Portland, OR, USA, 2011. [Google Scholar]
  38. Luo, A.C.J.; Guo, Y. Periodic motions to chaos in pendulum. Int. J. Bifurc. Chaos 2016, 26, 1650159. [Google Scholar] [CrossRef]
  39. Grebogi, C.; Ott, E.; Yorke, J.A. Basin boundary metamorphoses: Changes in accessible boundary orbits. Nucl. Phys. B-Proc. Suppl. 1987, 2, 281–300. [Google Scholar] [CrossRef]
  40. Younesian, D.; Askari, H.; Saadatnia, Z.; KalamiYazdi, M. Frequency analysis of strongly nonlinear generalized Duffing oscillators using He’s frequency–amplitude formulation and He’s energy balance method. Comput. Math. Appl. 2010, 59, 3222–3228. [Google Scholar] [CrossRef] [Green Version]
  41. Khatami, I.; Zahedi, E.; Zahedi, M. Efficient solution of nonlinear Duffing oscillator. J. Appl. Comput. Mech. 2020, 6, 219–234. [Google Scholar]
  42. Ambika, G.; Babu Joseph, K. Transition to chaos in a driven pendulum with nonlinear dissipation. Pramana 1988, 31, 1–8. [Google Scholar] [CrossRef]
  43. Bourkha, R.; Belhaq, M. Effect of fast harmonic excitation on a self-excited motion in van der Pol oscillator. Chaos Solitons Fractals 2007, 34, 621–627. [Google Scholar] [CrossRef]
  44. Kapitaniak, T.; Czołczyński, K.; Perlikowski, P.; Stefański, A. Energy balance of two synchronized self-excited pendulums with different masses. J. Theor. Appl. Mech. 2012, 50, 729–741. [Google Scholar]
  45. Gelfand, I.M.; Kapranov, M.M.; Zelevinsky, A.V. Discriminants, Resultants, and Multidimensional Determinants; Springer: Berlin/Heidelberg, Germany; Dordrecht, The Netherlands; New York, NY, USA, 2008. [Google Scholar]
  46. Janson, S. Resultant and Discriminant of Polynomials, Lecture Notes. 2010. Available online: http://www2.math.uu.se/~svante/papers/sjN5.pdf (accessed on 18 November 2021).
Figure 1. Amplitude profiles: critical (blue, h = h * ), with two VTs (dark gray, h = 0.3 ; solid line—stable, dashed—unstable), and without VT (sienna, h = 0.65 ). Red dots show VTs.
Processes 10 00127 g001
Figure 2. Borderline sets: Equation (8)—left, Equation (9)—right. White dot denotes parameters 1 , h * , 1 of the double critical point and corresponds to the red dot on the blue amplitude profile in Figure 1.
Processes 10 00127 g002
Figure 3. The bifurcation sets: M 1 (Duffing)—dashed, M 7 —green (physical self-intersections), blue (unphysical self-intersections), magenta (unphysical isolated points).
Processes 10 00127 g003
Figure 4. Metamorphosis of the amplitude profile. Singular (red)— h = 0.326 435 , f c r = 0.5 , green— h = 0.326 435 , f = 0.49 < f c r , blue— h = 0.326 435 , f = 0.51 > f c r .
Processes 10 00127 g004
Figure 5. Bifurcation diagrams: h = 0.3264 , f = 0.5206 —left, h = 0.3264 , f = 0.5204 —right.
Processes 10 00127 g005
Figure 6. The bifurcation set M 3 . Surface d 3 = 0 (yellow and light red) and is part of the plane G = 0 (blue and green).
Processes 10 00127 g006
Figure 7. Amplitude profile with two intersections, μ 0 , ν 0 , G 0   =   1.1 , 0.797 754 , 0.777 016 .
Processes 10 00127 g007
Figure 8. μ 0 = 1.1 , ν 0 = 0.7978 , G = 0.593 —left top, G = 0.592 —right top, μ 0 = 1.1 (time inversion), ν 0 = 0.7978 , G = 0.778 —left bottom, G = 0.779 —right bottom.
Processes 10 00127 g008
Figure 9. Two metamorphoses. Left figure: μ = 0.75 , ν = 1 , G = 0.05 —red, 0.2 —green, 0.4 —magenta, 0.6 —blue, 0.8191 —black. Right figure: μ = 0.85 , ν = 0.5 , G = 0.1 —red, 0.2 —gray, 0.3 —green, 0.3445 —black, 0.4 —sienna, 0.5 —blue, 0.6 —navy.
Processes 10 00127 g009
Figure 10. Bifurcation diagrams: μ = 0.75 , ν = 1 , G = 0.05 —red, G = 0.6 —blue.
Processes 10 00127 g010
Table 1. A family of singular points, f = 0.5 .
mh
1 0.365 789 198 161
2 0.320 100 600 265
3 0.326 927 238 987
4 0.326 411 735 282
5 0.326 436 070 491
6 0.326 435 269 057
7 0.326 435 288 885
8 0.326 435 288 503
Table 2. Solutions of equation d 5 μ , ν , G   = 0 for growing values of m; μ = 1 , ν = 1 .
m G 1 G 2
1 0.532 423 0.654 807
2 0.658 654 0.984 427
3 0.658 549 0.892 667
4 0.658 551 0.900 030
5 0.658 551 0.899 594
Publisher’s Note: MDPI stays neutral with regard to jurisdictional claims in published maps and institutional affiliations.

