Article

Thermal Behavior of Ceramic Bodies Based on Estonian Clay from the Arumetsa Deposit with Oil Shale Ash and Clinker Dust Additives

1
Laboratory of Inorganic Materials, Tallinn University of Technology, Ehitajate Tee 5, 19086 Tallinn, Estonia
2
Department of Physics, Constantine the Philosopher University, A. Hlinku 1, 949 01 Nitra, Slovakia
3
Estonian Marine Institute, University of Tartu, Mäealuse Tee 14, 12618 Tallinn, Estonia
*
Author to whom correspondence should be addressed.
Processes 2022, 10(1), 46; https://doi.org/10.3390/pr10010046
Submission received: 25 November 2021 / Revised: 17 December 2021 / Accepted: 21 December 2021 / Published: 27 December 2021

Abstract

:
The thermal behavior of green clay samples from the Arumetsa and Füzérradvány deposits (Hungary) and the influence of two new types of Estonian oil shale (OS) ashes and cement bypass dust (clinker dust) additives on it were the objectives of this study. Thermal and thermo-dilatometric analysis methods were applied using a Setaram Setsys 1750 thermoanalyzer coupled with a Pfeiffer Omnistar spectrometer and a Setaram Setsys 1750 CS Evolution dilatometer. The kinetic parameters were calculated based on the differential isoconversional method of Friedman. The results of the thermal analysis of clays and blends indicated the emission of physically bound water at 200–250 °C. At temperatures from 200–250 °C to 550–600 °C the release of water is caused by oxidation of organic matter and dehydroxylation of different clay minerals like illite, illite-smectite, mica and kaolin. From blends, in addition, also from the decomposition of portlandite. The emission of CO2 at these temperatures was a result of the oxidation of organic matter contained in the clays. In the temperature range from 550–600 °C to 800–900 °C, the mass loss was caused by ongoing dehydroxylation processes in clay minerals but was mainly due to the decomposition of the carbonates contained in the OS ashes and clinker dust. These processes were accompanied by contraction and expansion of the ceramic bodies with the corresponding changes in the SSA and porosity values of the samples. Therefore, the decomposition of the clays took place in one step which blends in two steps. At first, dehydroxylation of the clay minerals occurs, followed by decomposition of the carbonates. The value of the conversion-dependent activation energy E along the reaction progress α varied for the Arumetsa and illitic clay between 75–182 and 9–206 kJ mol−1, respectively. For the blends based on Arumetsa and illitic clay, the activation energy of the first step varied between 14–193 and 5–205 kJ mol−1, and for the second step, it was between 15–390 and 135–235 kJ mol−1, respectively, indicating the complex mechanism of the processes.

1. Introduction

Previously, the influence of new types of OS ashes and clinker dust on the thermal behavior of Estonian clay from Kunda deposits has been studied [1]. In this research, the results of studying the influence of these ashes and clinker dust additives on the thermal behavior of Estonian clay from another big deposit (i.e., the Arumetsa deposit) is presented. The ashes used were formed through the circulated fluidized bed combustion of OS at the Auvere Power Plant (CFBC at temperatures 750–830 °C; fly ash (FA)) and through pulverized firing of it at the Eesti Power Plant (PF, 1200–1400 °C; DeSOx ash). Clinker dust was collected from the Kunda Nordic Cement Factory. The total amount of OS ashes and clinker dust is decreasing, according to the reduction of OS-based electricity production in Estonia and improvements in the exploited technologies for OS combustion and cement production [2,3]. Nevertheless, the amount of OS ashes formed in 2020 was on the level of 2.6 million tons, and the clinker dust in 2018 totaled 30,000 tons. Most of these wastes were deposited in dumps.
Considering the increasing demand of circular economies [4,5], it will be of the highest importance to find possibilities for reusing these wastes. One possibility could be reuse of these wastes in the ceramic industry by replacing a part of the clay (or grog) with OS ashes or clinker dust additives.
The influence of ashes with different origins like coal, biomass or MSW incineration ashes on the thermal behavior and physical, chemical and mechanical properties of different ceramic goods has been widely studied [6,7,8,9,10,11,12,13,14,15,16,17,18,19].
Porous cordierite ceramics produced from stevensite-rich clay and an andalusite mixture with an oil shale additive as a natural pore-forming agent were studied in [6]. It was established that the microstructure and mechanical properties were strongly influenced by the sintering conditions and the amount of oil shale added (0–20 wt.%). The maximum addition of oil shale resulted in an increase in the pore size and open porosity from 17.7% to 52.8%. The gradual increase in the oil shale addition revealed a strong decline in mechanical properties such as flexural strength, tensile strength and Young’s modulus.
In [7], the compositions were based on different amounts of clay and recycled ceramics, and wastepaper pulp was used as a pore-forming agent in different proportions in order to increase and control the total porosity of the final bricks. The small pores with diameters less than 0.1 mm affected the thermal conductivity and the compressive strength less than the macro-pores with diameters higher than 0.1 mm. The thermal conductivity decreased from 0.75 to 0.58 Wm−1K−1 by increasing the porosity from 3.5% to 35%.
Ceramics based on incinerated paper mill sludge and glass cullet from energy saving lamps blended with different amounts (10–40%) of red clay, yellow clay and high-grade kaolin were studied in [8]. It was established that compositions containing 30–40% red or yellow clay or 20–40% kaolin displayed shrinkage values below 10% at the temperature interval from 1040 to 1140 °C. The crystal structure of the fired materials is mainly caused by nature, the chemical compositions and crystal phases of the recycled materials and only minimally by the characteristics of the natural clays.
Mixtures containing brick raw materials and the paper waste were also studied in [9]. The compressive strength of fired bricks with 10 wt.% paper wastes were higher than 20 MPa, while the bulk density of the bricks decreased from 1.85 to 1.62 g cm−3, and the thermal conductivity decreased from 0.83 to 0.59 W m−1 K−1, but the porosity of the samples without and with additives increased from 30.8 to 38.9%, respectively.
In [10], bricks based on clay bodies with rice husk additives up to 10% satisfied the requirements for building materials for indoor structural applications.
As an additive, sugarcane bagasse ash up to 10% content in the production of clay bricks was successfully tested in [11] without decreasing the mechanical strength of the final product, indicating the possible reuse of this waste in ceramics.
Sugarcane bagasse ash as well as flat glass waste were also studied as possible additives in replacing a part of natural raw materials (kaolinic clay and quartz) in the production of wall tile pastes [12]. It was established that sugarcane bagasse ash and flat glass waste influenced the thermal behavior of the paste differently. Replacing a part of the quartz with sugarcane bagasse ash in amounts up to 5% tended to increase the mass loss, resulting in wall tiles with a higher open porosity. On the contrary, partial replacement of kaolinic clay with flat glass waste resulted in a denser microstructure.
Replacement of clay up to 20 wt.% with wood waste incinerator ash [13] or with olive pomace bottom ash [14] was followed by a decrease in the bulk density and an increase in the porosity of the bricks. The compressive strength of the bricks decreased but did not fall below the limits for the standards of conventional bricks. Adding the biomass gasification fly ash of to 20 wt.% in the clay mixtures also enabled obtaining clay bodies which corresponded to the requirements for facing bricks [15].
Two types of bricks produced in the SanMarco-Terreal factory in Italy were compared with the newly designed bricks obtained from the same clay with the addition of ceramic sludge instead of the traditionally used siliceous sand [16]. The results indicated that the bricks produced with added ceramic sludge could substitute traditional bricks well, maintaining their mechanical properties. The only drawback was that these new materials did not satisfy the freeze-thaw cycle requirements, decreasing their usability in cold climate conditions.
Coal fly ash (5%) was used as an additive for preparing bricks based on clays from the Guadix and Viznar deposits in Spain. The texture of the bricks with and without fly ash were very similar, except that the samples with the additive contained spherical fly ash particles with diameters ranging between 0.1 and 10 µm, leading to a reduction in the density of the bricks [17].
The effect of coal fly ash with a high clay replacement ratio (60% or 80%) on the firing parameters and properties of bricks were studied by Lingling et al. [18]. The sintering temperature increased from 1050 °C to 1100–1150 °C, followed by an increase in compressive strength, low water absorption and high resistance to frost-melting cycles.
The optimum amount of fluidized bed fly ash in a composition with kaolinic clay for the production of dry pressed ceramic tiles was on the level of 20%, as shown in [19]. Fluidized bed fly ash reduces firing shrinkage and increases the porosity of the body, being more remarkable when non-milled ash was used.
Therefore, different types of wastes and additives have been studied to find possibilities for reusing them in the ceramic industry. The aim of this research was to study the influence of new types of oil shale ashes and clinker dust from electricity and cement production on the thermal behavior and physical and chemical characteristics of ceramic bodies based on Estonian clay from the Arumetsa deposit.

2. Materials and Methods

The mineralogical and chemical compositions of the clays, OS ashes and clinker dust studied are presented in Table 1 and Table 2. The ashes used as additives were formed via circulated fluidized bed combustion (CFBC) of Estonian OS at the Auvere Power Plant (at 750–830 °C with electrostatic precipitator ash or fly ash; Auvere FA) and by pulverized firing of it at the Eesti Power Plant (at 1200–1400 °C, DeSOx ash; DeSOx). Clinker dust (CD) was formed from the manufacturing of cement at the Kunda Nordic Cement Factory (Kunda NCF).
The content of illite, illite-smectite and mica was high in both of the studied clays (48.9% in the Arumetsa clay and 76.4% in the illitic clay). Both clays also contained quartz (18.5% and 17.5%, respectively) and orthoclase (3.8% and 5.8%, respectively). In addition, the Arumetsa clay contained some amount of other clay minerals like kaolin, amphipole and chlorite, as well as plagioclase, hematite and calcite-dolomite (Table 1).
The contents of calcite, lime and anhydrite in Auvere FA were 9.8%, 8.7% and 6.0%, respectively, and in DeSOx, they were 8.8%, 6.9% and 10.7%, respectively. The content of calcite in the clinker dust was on the level of 47.3%, while that of arcanite was 15.9%. The content of portlandite in the ashes was high (10.5% in DeSOx and 7.0% in Auvere FA). The ashes and clinker dust also contained quartz and different silicates, having primary ones like orthoclase as well as secondary ones like belite and merwinite. All additives contained some amount of periclase, and the ashes were also characterized by high contents of amorphous phase (20.0% in Auvere FA and 24.6% in DeSOx (Table 1)).
The content of organic carbon in the Arumetsa and illitic clays was 0.32 and 0.06%, while the BET specific surface area (SSA) was 44.71 and 48.79 m2g−1 and the porosity was 77.63 and 82.14 mm3g−1, respectively (Table 2).
The content of sulfur calculated as SO3 in the Auvere FA was 3.5%, while it was 9.3% in the DeSOx 9.3% and 7.2% in the clinker dust. The content of free CaO in the Auvere FA and DeSOx was 11.8 and 7.9%, respectively, and in the clinker dust, it was only 3.8% (Table 2).
The value of the SSA for the Auvere FA and DeSOx was 4.68 and 1.4 m2g−1, and the porosity was 8.87 and 3.84 mm3 g−1, respectively, while for the clinker dust, these values were 3.00 m2g−1 and 5.15 mm3 g−1. The mean particle size for the Auvere FA and DeSOx was 21. 9 and 42.0 µm, respectively, and for the clinker dust, it was 41.1 μm (Table 2). The particles of the Auvere FA had an irregular shape with a porous surface, but the particles of DeSOx, especially the smaller ones, were characterized by a regular spherical shape and smooth surface.
Samples of clay with 40% of the previously fired at 1050 °C clay (grog) were used as reference samples. In the blends studied, the grog amount was on the level of 50% or entirely replaced with OS ash or clinker dust.
A Setaram Labsys Evo 1600 thermoanalyzer (Setaram Instrumentation, Caluire, France) coupled with a Pfeiffer OmniStar Mass Spectrometer (Pfeiffer Vacuum Technology AG, Asslar, Germany) was used for carrying out the experiments under non-isothermal conditions by heating up to 1050 °C at heating rates of 1.25, 2.5, 5 and 10 °C min−1 in an oxidizing atmosphere containing 79% Ar and 21% O2. Standard 100-µL Pt crucibles were used. The mass of the samples was 12 ± 0.5 mg, and the gas flow was 60 mL min−1. For reproducibility, all experiments were performed twice. Prior to the experiments, the equipment was calibrated for temperature readings with calcium oxalate monohydrate.
The contraction-expansion behavior of the samples was studied using a Setaram Setsys 1750 CS Evolution dilatometer (Setaram Instrumentation, Calurie, France) with an alumina probe by heating up to 1050 °C at a heating rate of 5 °C min−1. Cylindrical pressed samples with a diameter of 7 mm and height of 10 mm were exploited.
FTIR analysis was performed with a Bruker ALPHA (Bruker Corporation, Karlsruhe, Germany) and XRD analysis with a Bruker D8 Advanced Diffractometer (Bruker Corporation, Karlsruhe, Germany) using Ni-filtered CuKα radiation and collecting data in the range of 2θ from 10 to 60°. The quantitative mineral composition was determined by full-profile Rietveld analysis using the SiroqantTM V4 software system [20,21].
The surface observations were carried out with a Jeol JMS-8404A scanning electron microscope (Joel Ltd., Tokyo, Japan). The particle size distribution was measured with a Partica LA-950V2 analyzer (Horiba Ltd., Kyoto, Japan), and the BET SSA and porosity values were measured with a Kelvin 1042 sorptometer (Costech International SRL., Pioltello, Italy).
The acid-alkali resistance test of the fired samples (1050 °C, 1 h) was performed in solutions of HNO3 (pH = 1.0) and NaOH (pH = 14) at room temperature for a GFL-3025 agitator (Gessellschaft für Labortechnik mbH, Burgwedel, Germany) (30 cycles per min). The mass of the samples was 500 mg in 100 mL of liquid. After filtration, the solutions were analyzed for their Ca2+, Mg2+ and K+ contents using a Spectra AA atomic absorption spectrophotometer (Varian Inc., Mulgrave, Australia) and their SO42− content using a SpectroDirect spectrophotometer (The Tintometer LDT., Dortmund, Germany).
The differential isoconversional Friedman method [22] was applied for calculating the kinetic parameters. After baseline correction and normalization of the TG signals obtained at different heating rates, the data were processed with the AKTS Advanced Thermokinetics software (AKTS AG TECHNOArk, Siders, Switzerland) [23].

3. Results and Discussion

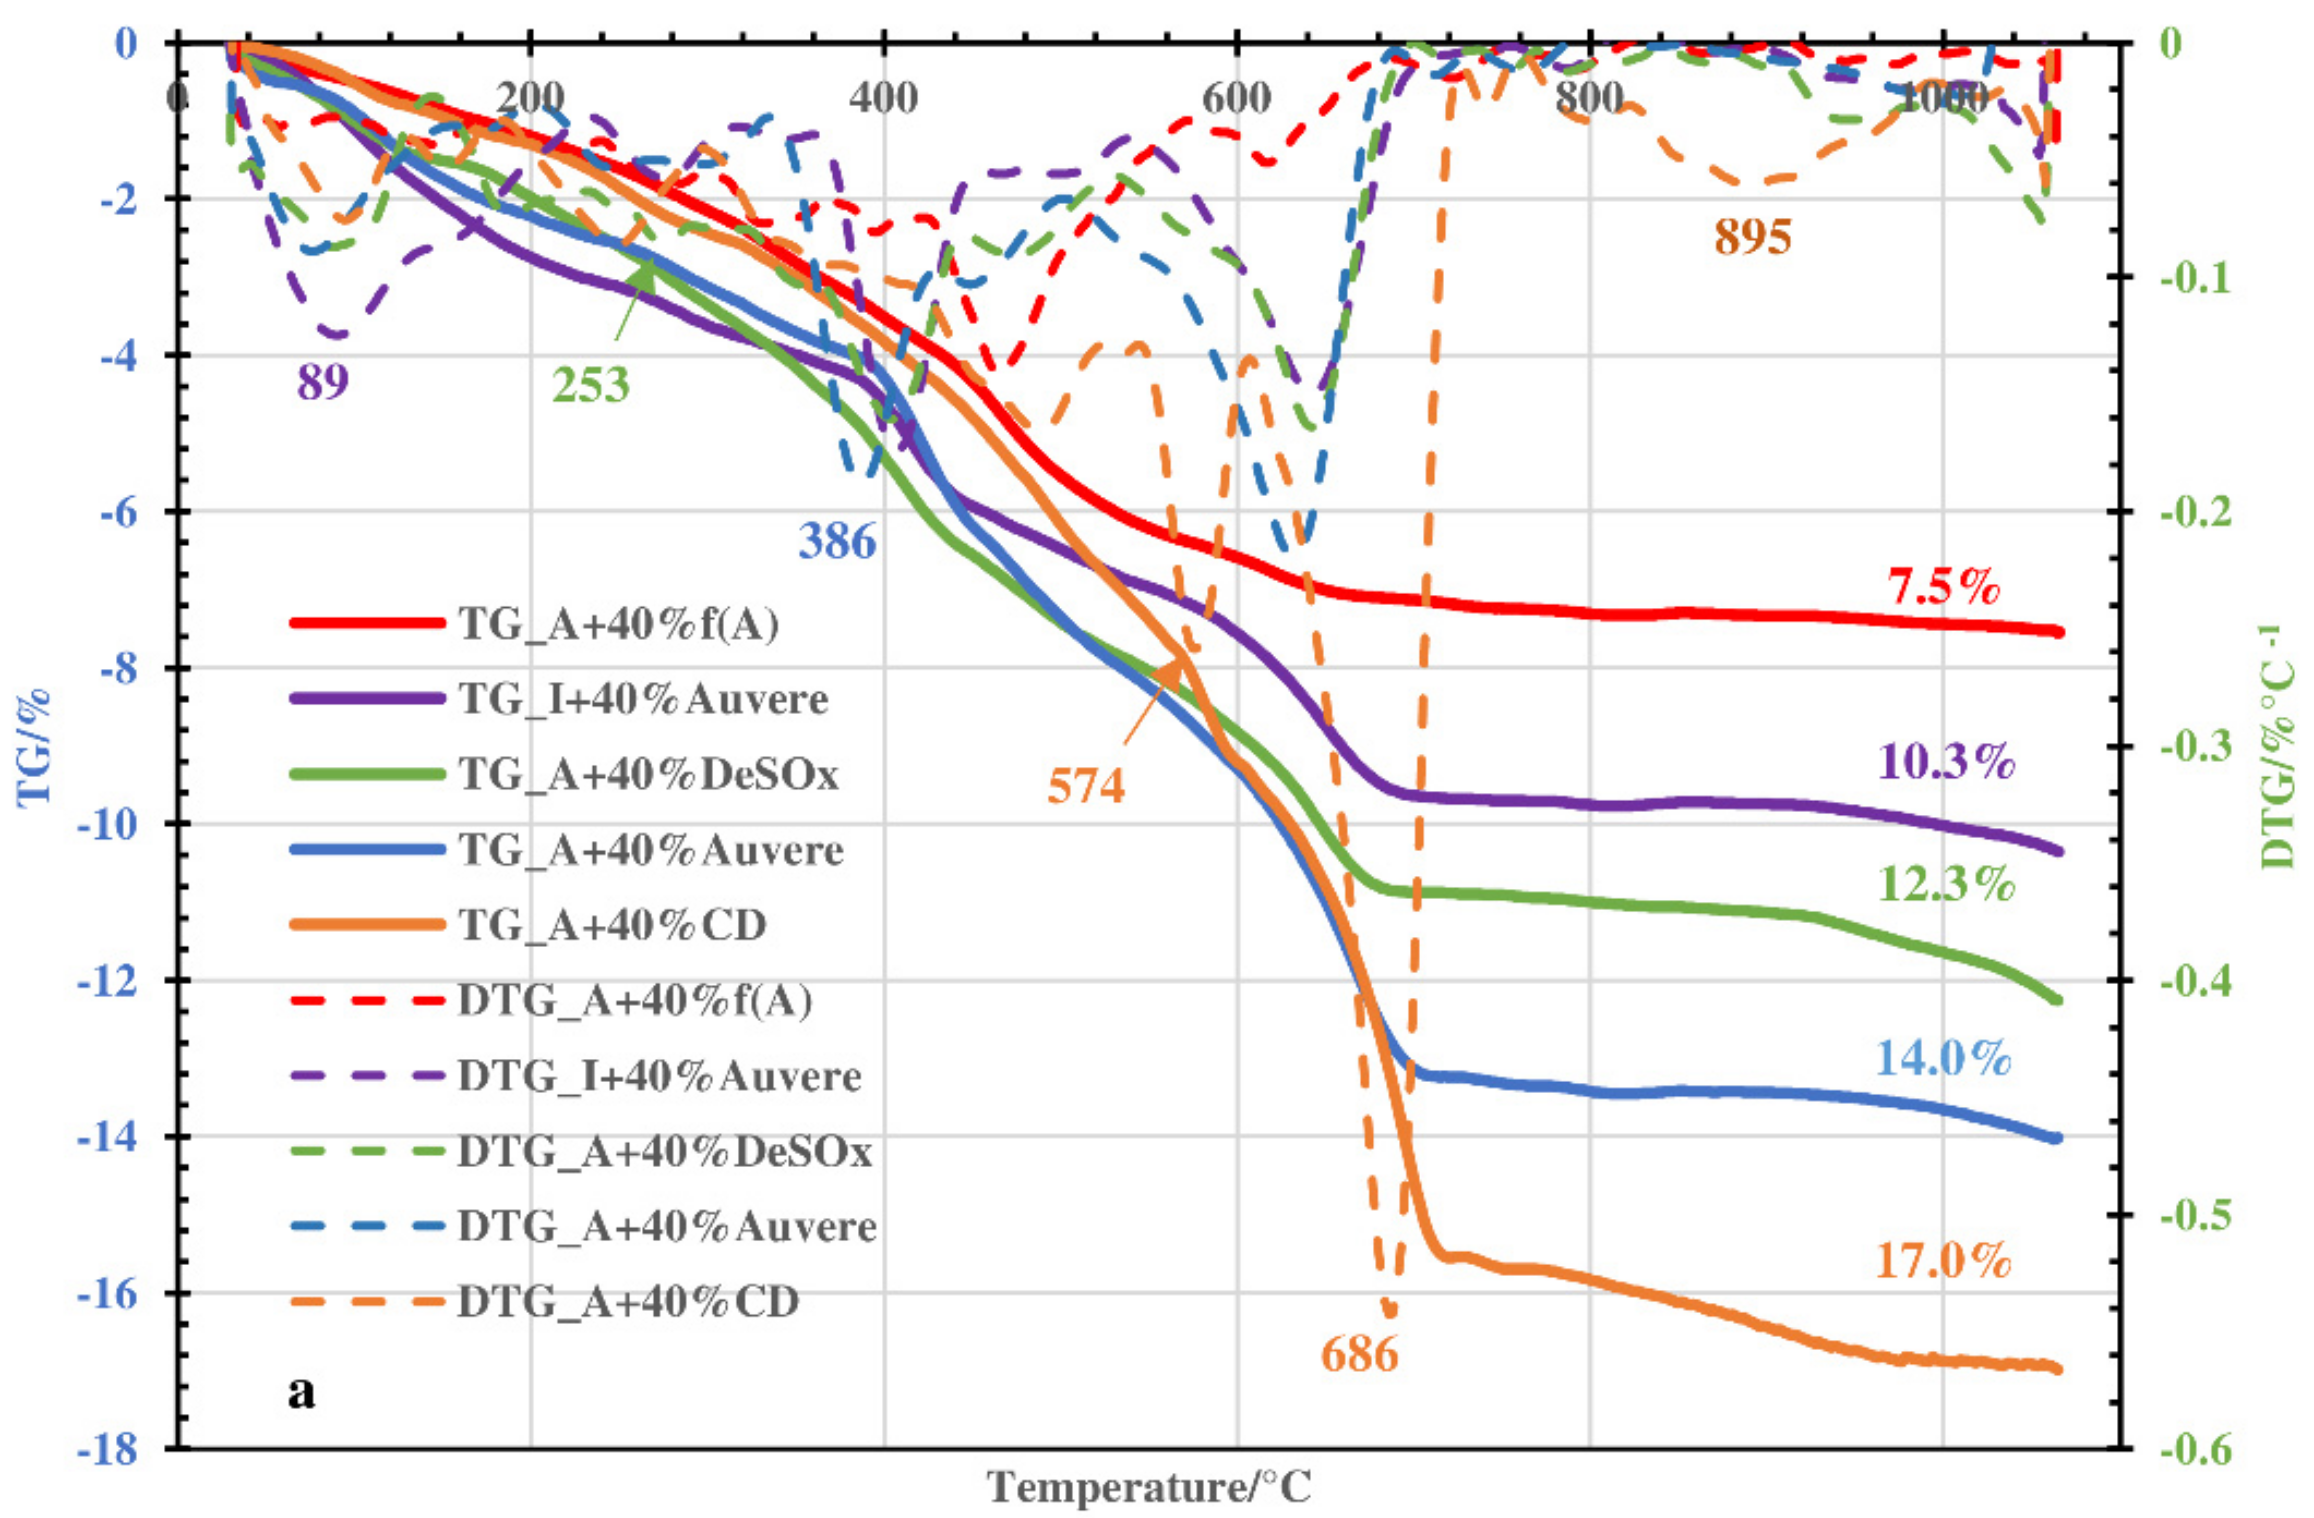
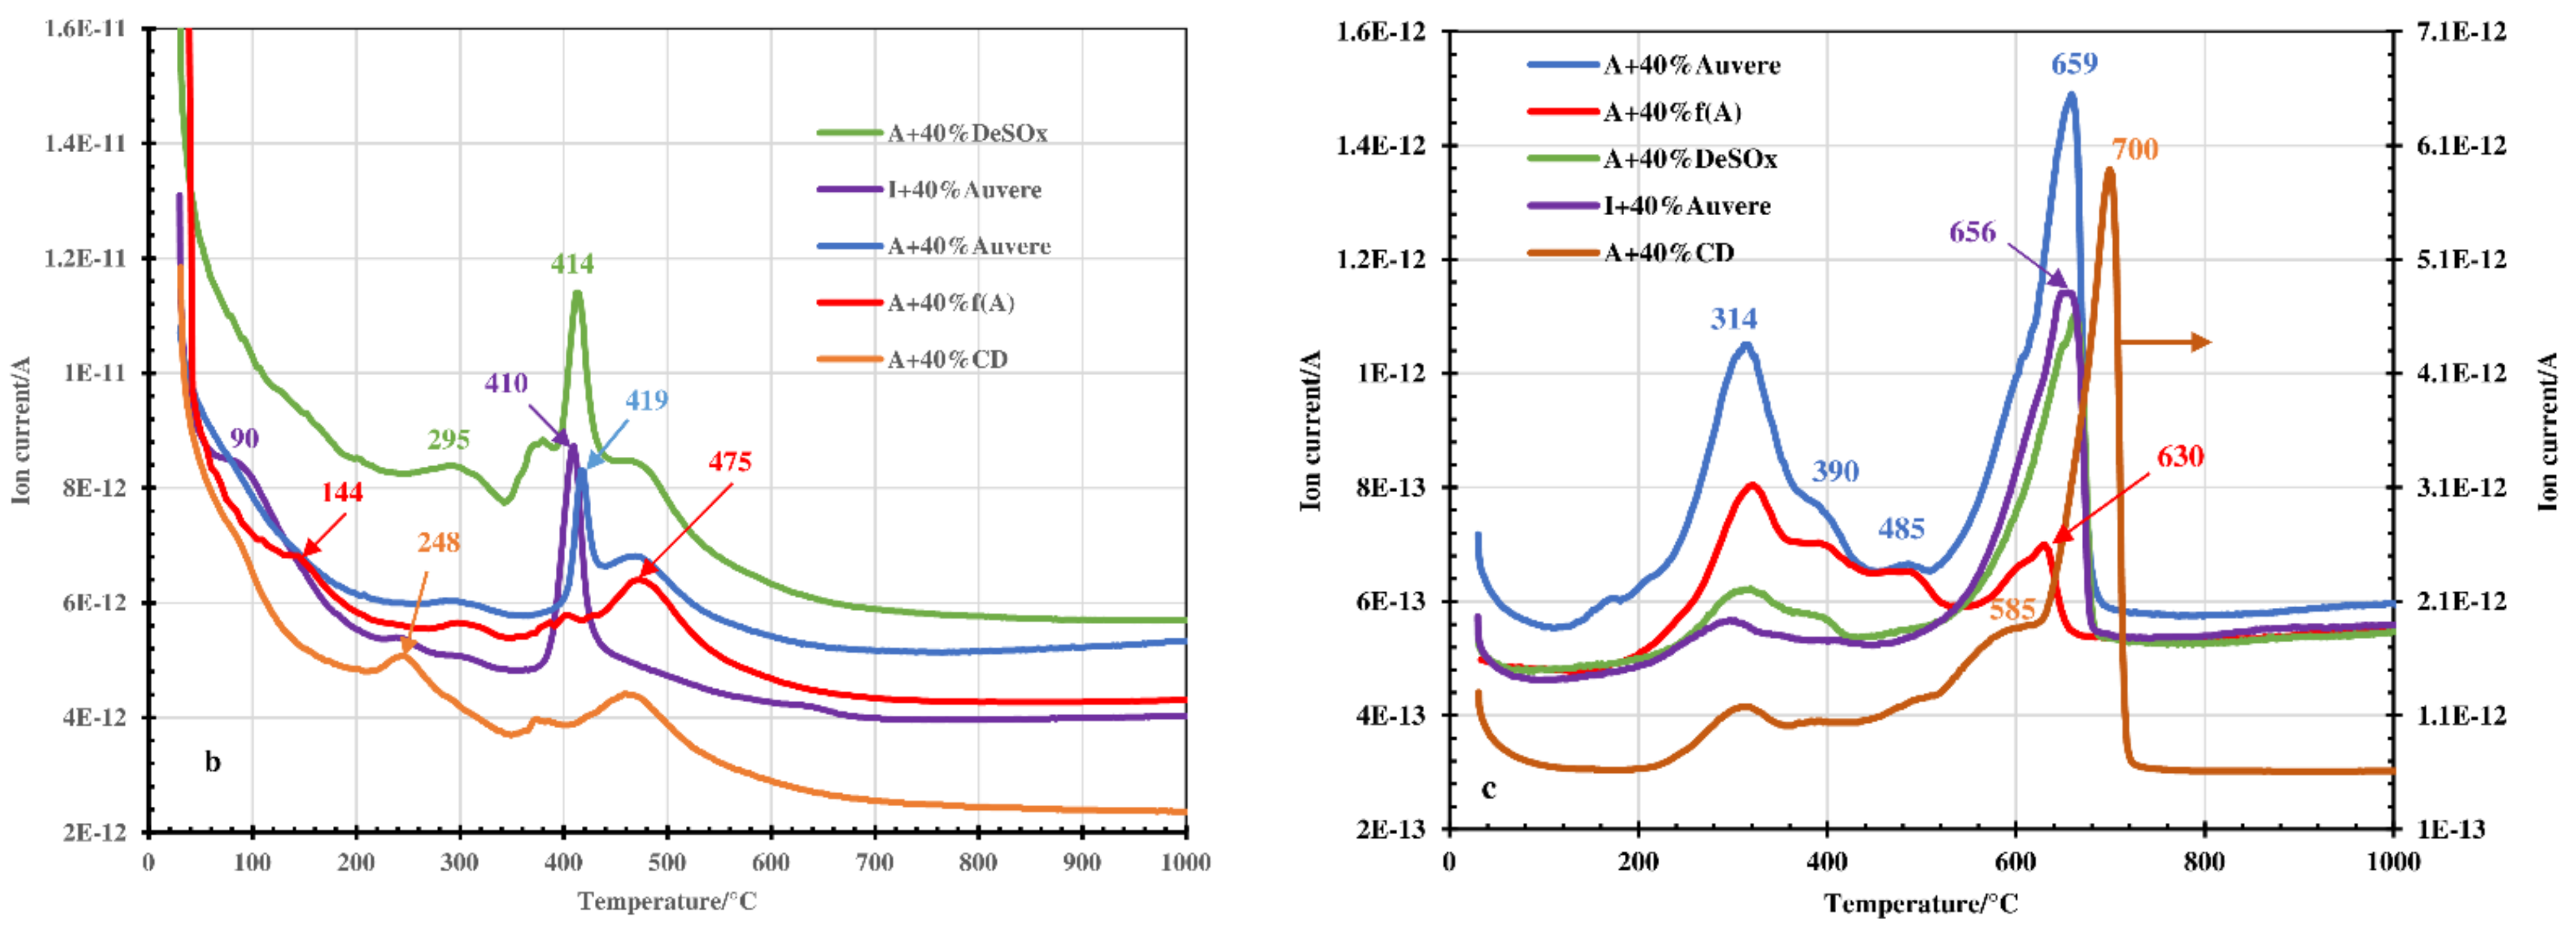
3.1. Thermal and MS Analysis

The results of the thermal analysis coupled with the mass-spectroscopic (MS) analysis of the evolved gaseous compounds indicated that the emission of hygroscopic and physically bound water at a heating rate of 5 °C per min occurred up to 220 °C, with corresponding peak minimums in the DTG curves at 86 °C and 98 °C and shoulders at 151 °C and 153 °C for the Arumetsa and illitic clay, respectively, (Figure 1a) and with corresponding maximums in the water emission profiles at 86 °C and 78 °C, respectively. The dehydroxylation of the clay minerals took place between 300 °C and 800 °C but was most intensive around 500 °C (Figure 1a), with corresponding peaks in the water emission profiles at 480 °C and 505 °C for the illitic and Arumetsa clay, respectively (Figure 1b).
The emission of water and, in addition, carbon dioxide up to 500–550 °C (Figure 1b) was partially caused by thermooxidation of the organic matter contained in clays. The emission of carbon dioxide was more intensive for the Arumetsa clay, in which the content of organic carbon was on the level of 0.32%, and less intensive for the illitic clay, with the content of organic carbon being 0.06% (Table 2).
The α → β quartz transformation [24,25] for the Arumetsa clay was fixed in the DTA curve, with the small endothermic minimum at 572 °C and with the shoulder for the illitic clay at 555 °C (Figure 1a).
Above ~600 °C, the decomposition of dolomite and calcite in the Arumetsa clay started, corresponding to the endothermic peak with the minimum in the DTA curve at 654 °C and the shoulder at 685 °C (Figure 1a), overlapping with the dehydroxylation processes of clay minerals also occurring at these temperatures. In Figure 1b, there is a well-exposed peak maximum at 688 °C in the carbon dioxide emission profile of the Arumetsa clay. The exothermic peak with a maximum in the DTA curve of the Arumetsa clay was at 975 °C, and the more modest one for the illitic clay at 924 °C (Figure 1a) characterizes mullite crystallization [25,26]. Upon heating up to 1050 °C, the total mass loss for the Arumetsa clay was 7.8%, and for illitic clay, it was 7.2% (Figure 1a).
For thermal treatment of blends with partial or total substitution of grog by ashes or clinker dust additive, certain differences in the thermal behavior could be followed at temperatures above 200–250 °C. In the DTG curves (Figure 2a and Figure 3a), peaks with minimums and with corresponding maximums in the water emission profiles around 380–420 °C could be fixed (Figure 2b and Figure 3b). The peaks were more intensive for blends with ash additives compared with clinker dust additive and more intensive when replacing the grog totally. This was caused by decomposition of the portlandite contained in the ashes on the level of 7–10%. In the clinker dust, portlandite was missing (Table 1).
The peak maximums in the CO2 emission profiles in the temperature range of 200–450 °C (Figure 2c and Figure 3c) resulting from thermooxidation of organic matter in the clays were, as a rule, less intensive compared with the pure clay samples (Figure 1b) and less intensive for blends based on illitic clay compared with blends based on Arumetsa clay (Figure 3c). The reasons for this are, first of all, that carbon dioxide formed there is partially bound into the solid by Ca(OH)2 or free CaO formed upon decomposition of portlandite, with the formation of secondary calcite [27,28], and second that the content of organics in the illitic clay was much lower than that in the Arumetsa clay (Table 2). At temperatures higher than 550 °C, on the contrary, the CO2 emission profiles were more intensive compared with those of the pure clays due to the decomposition of carbonates contained in the additives (Table 1) and of secondary CaCO3 formed at lower temperatures. Especially intensive was the CO2 profile for blends containing clinker dust additive (Figure 2c and Figure 3c), due to the very high content of calcite in the clinker dust (Table 1). Due to the high content of calcite (47.3%) in the clinker dust, the blends were also characterized with the highest mass loss upon heating up to 1050 °C: 15% (Figure 2a) and 17% (Figure 3a) for partial or full replacement of the grog with clinker dust, respectively.

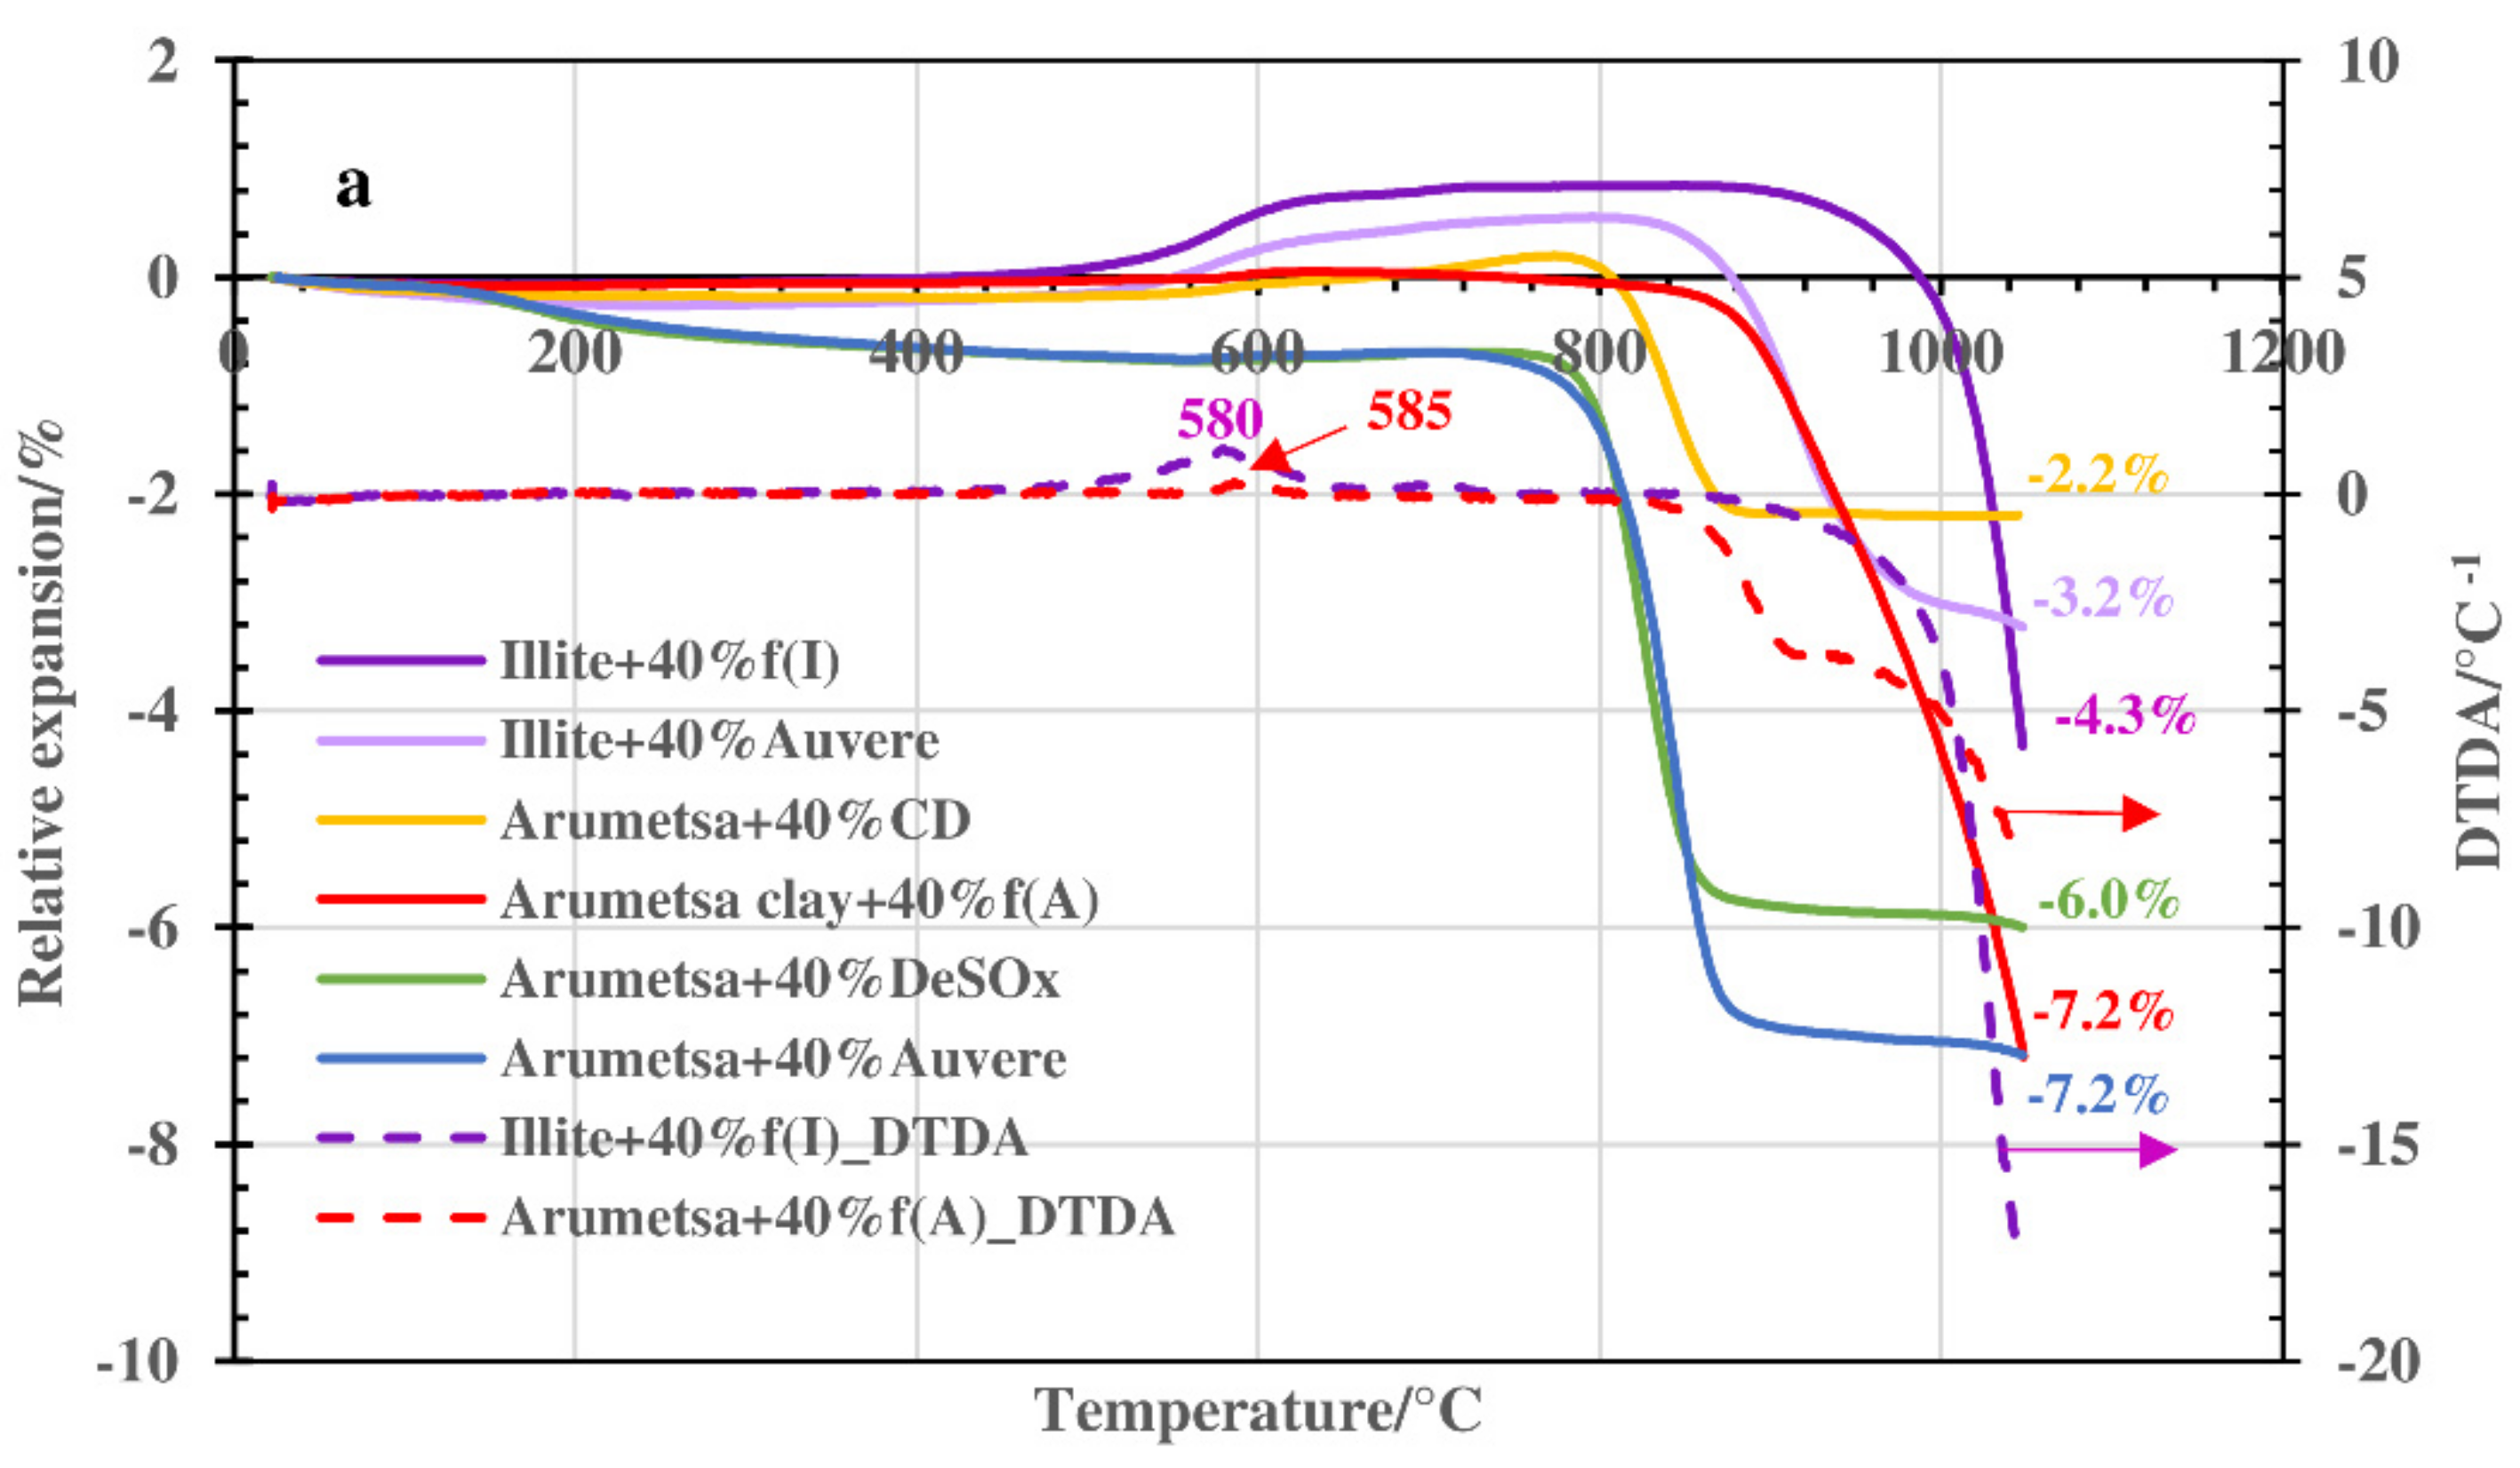
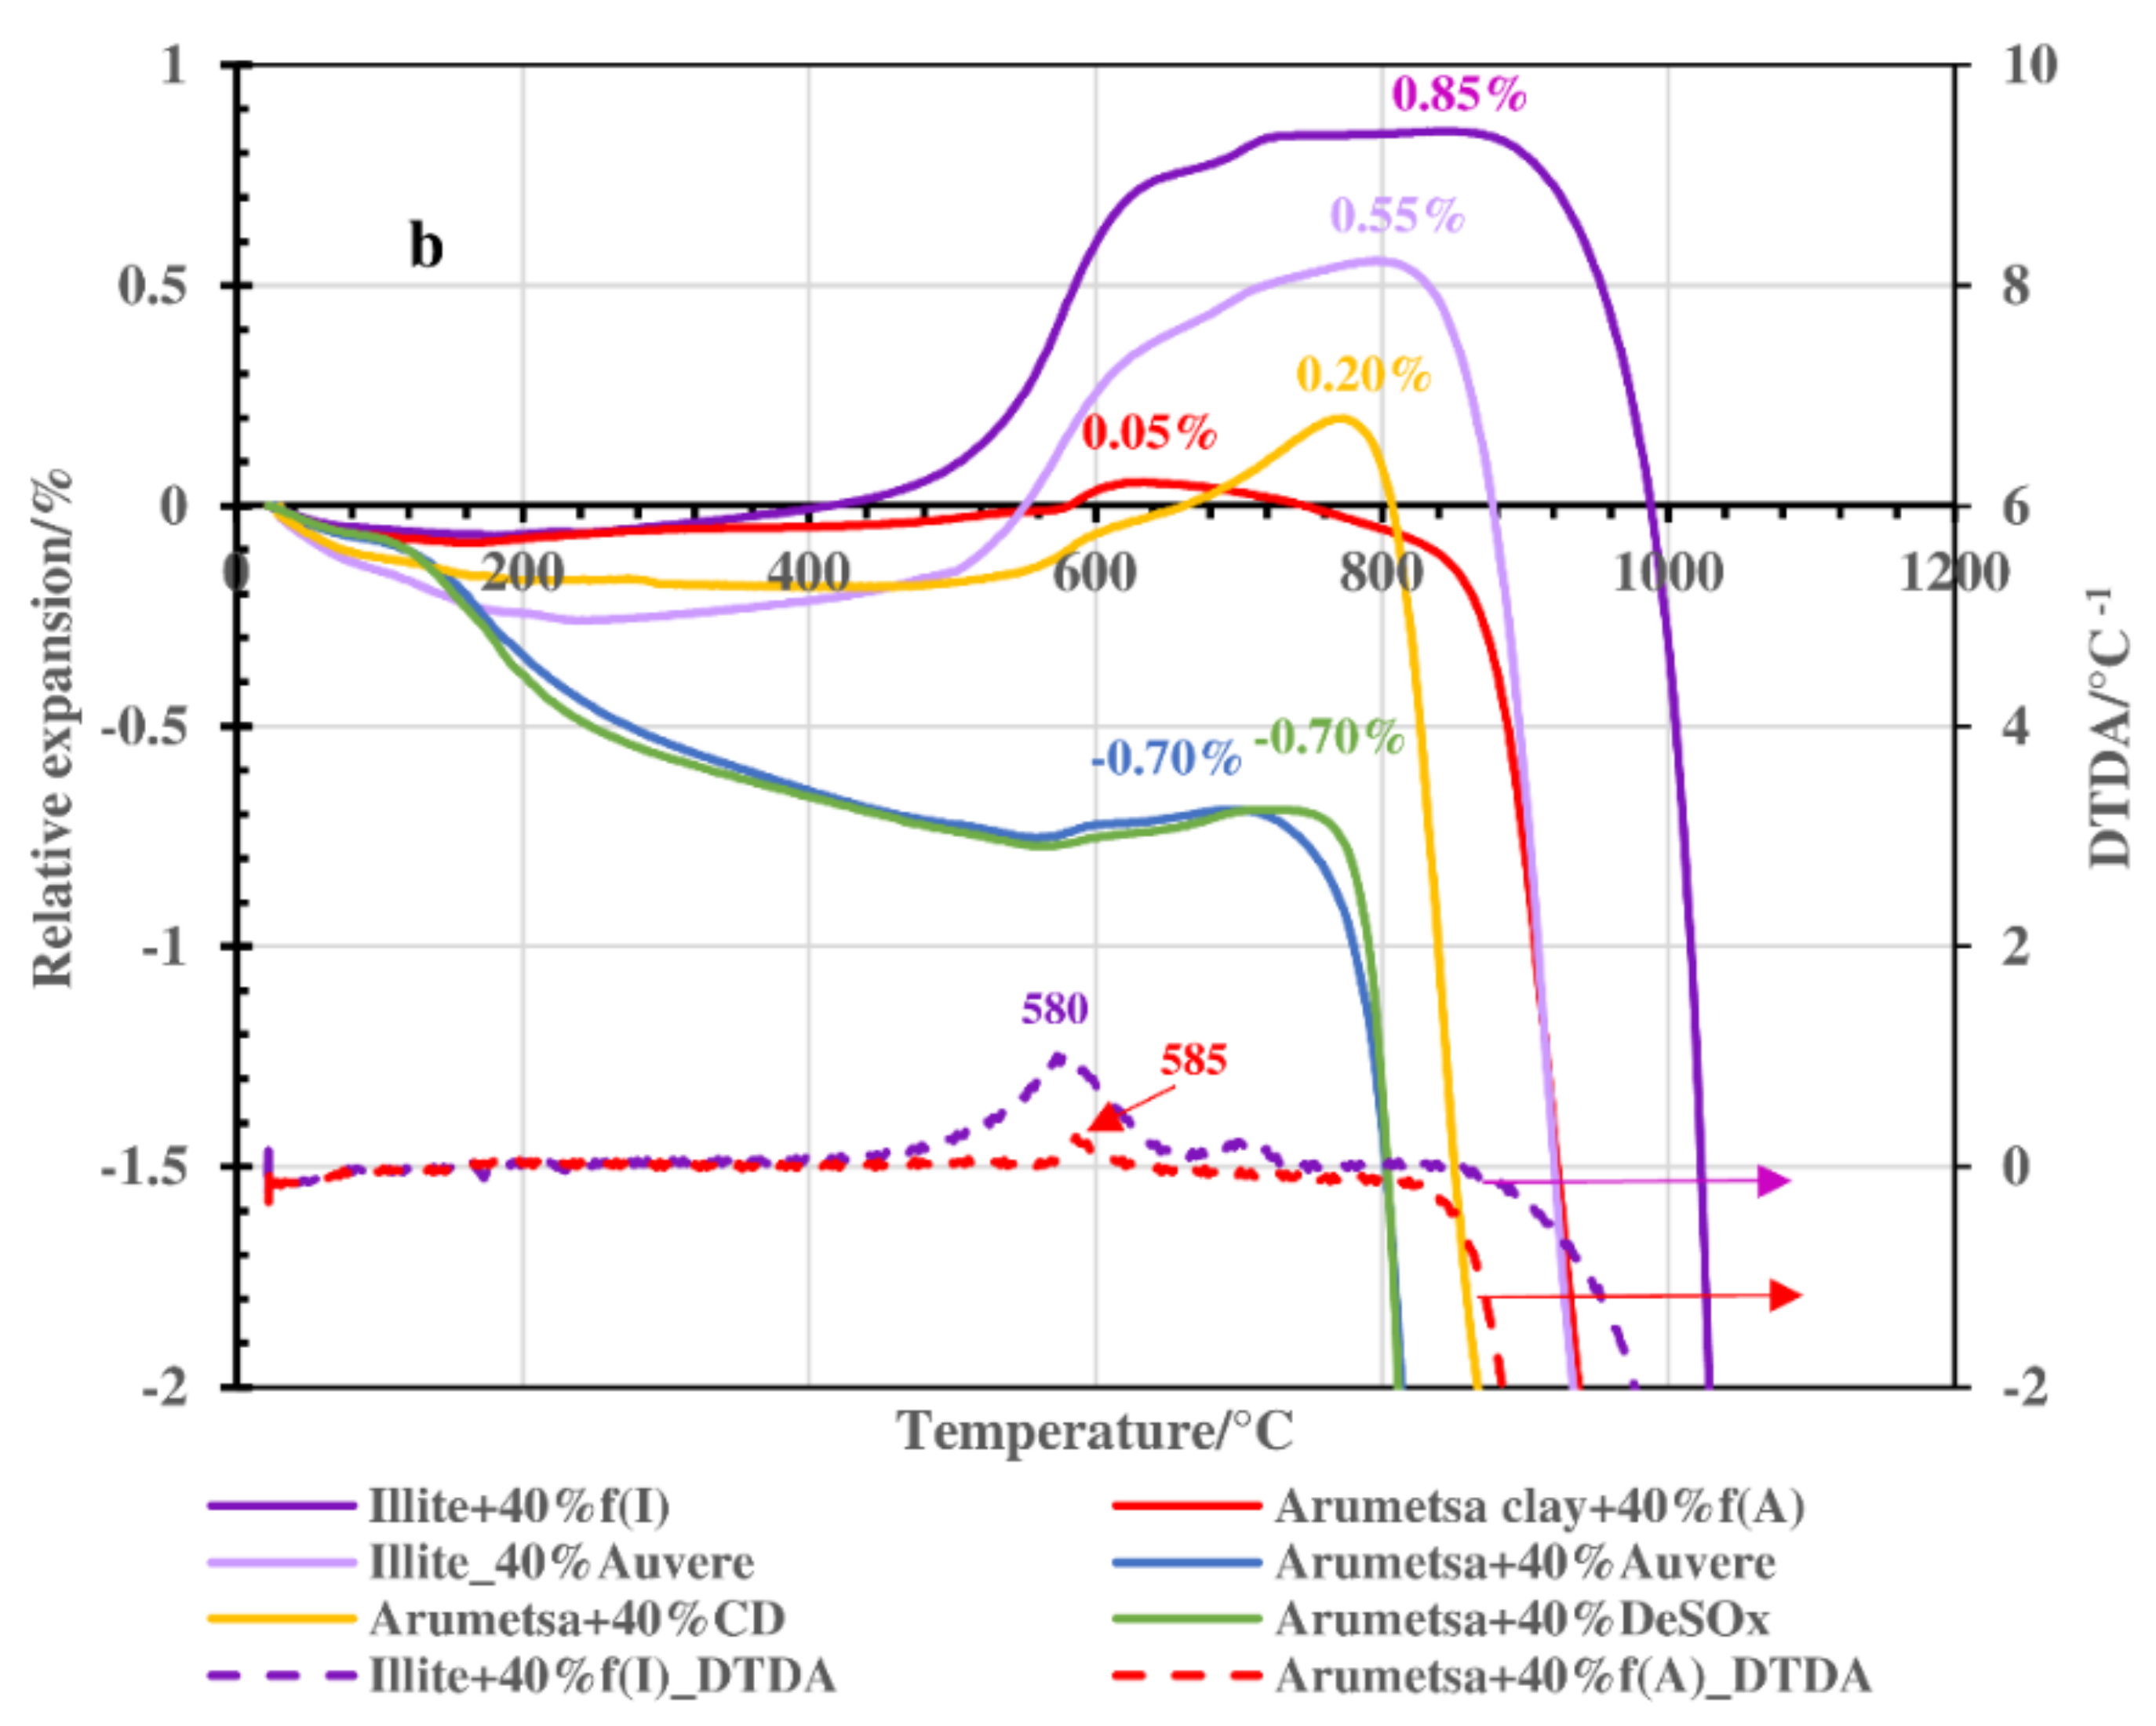
3.2. Thermodilatometry, Physical-Chemical Characteristics and Morphology

The results of the dilatometric measurements up to 1050 °C are presented in Figure 4a, with the enlarged one in Figure 4b. According to the line of the Arumetsa basic sample (Arumetsa clay + 40% grog), up to 180–200 °C, shrinkage of the sample of around −0.08% caused by the emission of physically bound water could be followed. Then, permanent expansion took place upon heating up to 580 °C (to the level of −0.01%). Between these temperatures, the dehydroxylation of clay minerals started and continued, and thermooxidation of the organic matter took place, causing an increase in the SSA and porosity of the samples together with the expansion of the ceramic body. A steeper increase (to the level of 0.05%) in the thermodilatometric line between 580–610 °C was caused by α—β transition of the quartz. Between 620 and 780 °C, contraction of the body took place, caused by the ongoing dehydroxylation processes of the clay minerals and decomposition of the carbonates. Then, at higher temperatures, a two-step contraction could be followed to the level of −7.2% at 1050 °C, caused by starting the formation of the liquid phase of the dehydroxylated clay minerals. The content of the amorphous phase in the thermally treated Arumetsa clay up to 1050 °C was 44.7%.
Auvere FA and DeSOx additives to Arumetsa clay similarly influenced the dilatometry results of these blends. There, a deeper shrinkage of the ceramic body compared with the basic blend upon heating up to 200–240 °C could be followed to the level of −0.42% and −0.40% for blends with DeSOx and Auvere FA, respectively (Figure 4b). Then, a slow but permanent shrinkage followed, with a small, deep increase at around 590 °C (α—β transition of the quartz) in the dilatometric line and, after that, a continuing increase leveling at −0.70% up to 700–720 °C for both blends. This can be explained by the quite similar contents of lime and portlandite in these ashes and lower organic contents compared with the basic blend, which are involved in different chemical reactions at these temperatures. Between 720 and 880 °C, deep contraction of the ceramic bodies took place to the level of −5.8% and −6.8% for the blends with DeSOx and Auvere FA, respectively. Then, only small additional contraction could be followed up to 1050 °C (Figure 4a).
The blend of Arumetsa clay with clinker dust had only slightly more extensive shrinkage upon heating up to 200 °C compared with the basic body (up to −0.21%) (Figure 4), caused by the emission of physically bound water. Between 200 and 500 °C, no changes were observed, but then a permanent expansion took place up to 780 °C to the level of 0.20%, with a small rapid one around 580 °C caused by the α—β transition of the quartz. Deeper expansion of the ceramic body at 600–780 °C was most likely caused by the dehydroxylation of clay minerals (Table 1). Between 800 and 900 °C, a deep shrinkage of the ceramic bodies (up to −2.2%) followed, with no additional changes up to 1050 °C.
Illitic clay with 40% grog heated up to 400 °C followed the pattern of Arumetsa clay + 40% grog, but between 400 °C and 750 °C, more intensive expansion of the body took place, being up to 0.85% with a shoulder in the dilatometric curve at around 700 °C caused by two-step dehydroxylation of the illitic clay minerals. Above 900 °C, a deep contraction of the ceramic bodies (−4.3% at 1050 °C) caused by destruction of the layered structure of the clay minerals took place, followed by formation of a liquid phase. These differences in the TDA curves of the blends based on Arumetsa and illitic clay could be explained by differences in the mineralogical compositions of the clays. Dehydroxylation of kaolin in the Arumetsa clay stopped at lower temperatures (around 700 °C) [29,30] compared with the illitic clay minerals (around 800–900 °C) [31,32,33].
Illitic clay with Auvere ash additive mainly follows the pattern of illitic clay + 40% grog, but up to 250–300 °C, a more intensive contraction of the ceramic bodies (−0.26%) could be followed compared with the basic blend (−0.08%), caused by the higher content of physically bound water in the previously hydrated Auvere ash. At these temperatures, the expansion of the ceramic bodies started reaching up to 0.55% at 800–820 °C, with the following deep contraction of the sample reaching up to −3.2% at 1050 °C, caused by the formation of a liquid phase (Figure 4a).
These results for the dilatometric measurements were in accord with changes in the SSA and porosity values of the samples treated thermally at different temperatures (Figure 5). For the blends based on Arumetsa clay treated at 250 °C, the changes in the SSA values were more extensive, being on the level of 7–11 units compared with those based on illitic clay (4–5 units) (Figure 5a). The changes in porosity were more modest for all samples except for the clinker dust additive, being on the level of 4–6 units (Figure 5b). The most extensive influence could be seen by replacing half of the grog with the clinker dust additive. For example, for Arumetsa clay with 20% clinker dust, the SSA decreased from 20.3 down to 10.4 m2g−1 (Figure 5a), and the porosity dropped from 32.1 to 20.6 mm3g−1 (Figure 5b). These changes were caused by the complete emission of physically bound water followed by tightening of the structure of the samples.
An increase in the treating temperature up to 550 °C brought about an increase in the SSA and porosity of the samples up to the level of the initial samples. This was caused by dehydroxylation of the clay minerals and the decomposition of portlandite, making the structure of the samples more porous. At 800 °C, the different additives studied caused a proportional decrease in the porosity of the samples, disappearing almost totally at 1050 °C (Figure 5a,b).
When replacing all the grog with clinker dust, the SSA and porosity changed differently compared with the other blends (Figure 5a,b), which was caused by the mineralogical composition of the clinker dust: a high content of carbonates and missing amorphous phase (Table 1).
Therefore, the changes in the SSAs and porosities of the studied blends depended on the differences in the characteristics of the origin clays but, first and foremost, on the origin of the additives used.
The particle surfaces of the Arumetsa (SSA: 0.34 m2g−1; porosity: 0.18 mm3g−1) (Figure 6a) and illitic clay (SSA: 0.59 m2g−1; porosity: 0.47 mm3g−1) (Figure 6e) treated thermally at 1050 °C were almost completely covered with a glassy phase. Auvere FA, DeSOx and clinker dust additives improved the structures of the samples treated at 1050 °C by increasing the melting points of the blends, with a following increase in the porosity and SSA values of the samples and a decrease in the melting points on the surfaces of the particles. For example, for the blend of Arumetsa clay with 40% Auvere FA (Figure 6b), the SSA and Vpores values were 1.06 m2g−1 and 1.18 mm3g−1 (these values for illitic clay with 40% Auvere FA were 1.02 m2g−1 and 1.20 mm3g−1, respectively (Figure 6f)), while those with 40% DeSOx were 0.65 m2g−1 and 0.90 mm3g−1 (Figure 6c) and those with 40% clinker dust were 0.90 m2g−1 and 0.99 mm3g−1 (Figure 6d), respectively.

3.3. FTIR and XRD Analysis: Acid-Alkali Resistance Test

For characterization of the influence of the OS ash and clinker dust additives on the mineralogical compositions of the initial blends as well as the influence of the treating temperature on it, the FTIR spectroscopic method was applied. The initial blends and samples thermally treated up to 1050 °C were also analyzed using XRD.
The differences in the intensities of the different absorption bands for the initial blends, depending on the compositions of the samples, can be followed in Figure 7a,b. There were fixed absorption bands characteristic to OH−1 (peak maximums at 3690 and 3618 cm−1) [34,35,36,37], H2O (1635 cm−1) [34,35], CO3−2 (1430 cm−1 and 875 cm−1) [38,39] and SO4 2− (1160 cm−1, 1130 cm−1, 679 cm−1 and 598 cm−1) [40]. Absorption bands characteristic to different vibrations in the silicate and alumosilicate groups were also exposed (Si-O(Si) (1090 cm−1) [36,37,38,40,41,42], Si-O(Al) (1000 cm−1) [37,40], Al-OH (914 cm−1) [36,40,41], Al-O-Si (522 cm−1) [35,39], O-Si-O (696 cm−1 and 465 cm−1) [35,39,40,42,43]) and a double band characteristic to quartz (798 cm−1 and 777 cm−1) [35,39,40,42,43]. Given that, the influence of the clinker dust additive was the most expressive, caused by the highest content of calcite and arcanite and also by the content of some clay minerals (Table 1).
All these bands were fixed in the FTIR spectra of the samples treated thermally at 250 °C, and only the band characteristic to the H2O group (1635 cm−1) was less intensive (Figure 8a). At 550 °C, the absorption bands characteristic to the H2O (1635 cm−1) groups were not present, and the intensities of those characteristic to OH−1 vibration (3690 cm−1 and 3618 cm−1) were remarkably lower.
According to the decomposition of carbonates between 600 and 800 °C, the bands characteristic to CO3−2 (1430 cm−1 and 875 cm−1) disappeared in the FTIR spectra. The decrease in the intensities of different silicate (alumosilicate) bands like Si-O(Al) (1000 cm−1), Al-O-Si (522 cm−1, where for the blend with clinker dust additive, only a shoulder remained) and O-Si-O bending vibration (465 cm−1) could also be followed, being especially remarkable at 1050 °C (Figure 8a,b). This was caused by the interactions between the primary silicates and periclase as well as the free CaO with the formation of secondary silicates. For the natural clays, a new band appeared at around 1050 cm−1, being characteristic to Si-O stretching vibration [36,37,42], and a band at 900 cm−1 for the samples with additives that was characteristic to Al-O(Si) vibration [41]. In the FTIR spectra, for all the samples studied, a shoulder at 1010 cm−1 characterizing the Si-O(Al) asymmetric stretching vibration in the aluminosilicate structure [38,41] was still exposed.
The results of the XRD analysis of the initial samples (clay + 40% fired clay) heated for 1 h at 1050 °C indicated the formation of an amorphous phase on the level of 44.7% and 50.3% based on Arumetsa and illitic clay, respectively. The formation of spinel to the level of 10.7% and 5.8%, mullite at 11.6% and 3.8%, sanidin at 6.6% and 18.5% and sillimanite at 0.8% and 2.3% in the samples based on Arumetsa and illitic clay, respectively, were fixed as the main secondary silicates. The content of quartz was on the level of 18.3% and 16.8% in the fired Arumetsa and illitic clay, respectively (Table 3). Some amount of leucite (0.9% in the fired Arumetsa clay) and wollastonite (0.5% in the illitic clay) was fixed, as well as periclase and hematite in the Arumetsa clay and enstantite in the illitic clay fired at 1050 °C (Table 3).
In the blends fired at 1050 °C, the formation of the amorphous phase decreased remarkably to the level of 14–24% and 18–22% based on the Arumetsa and illitic clay, respectively, in addition to decreasing the contents of sanidin, mullite and spinel compared with the fired clay samples. On the contrary, the formation of many new secondary silicates and alumosilicates like akermanite on the level of 11.4–18.5% and 9.4–15.3%, as well as leucite (6.9–12.4% and 13.9–19.8), diopside (5.7–9.4% and 1.4–2.1%), anorthite (4.5–7.2% and 11.5–21.0%), wollastonite (5.2–6.2% and 7.6–8.6%) and enstantite (4.9–6.0% and 5.6–5.9%) based on the Arumetsa and illitic clay, respectively, could be followed. The content of quartz decreased, being between 5.7% and 8.8% in the blends based on Arumetsa clay and between 6.1% and 10.0% for the illitic clay, caused by the active participation of it in the formation of different secondary silicates. The higher content of potassium in the clinker dust compared with DeSOx and Auvere FA assisted the formation of leucite (K(AlSi2O6)) and sanidin (KAlSi3O8) upon thermal treatment of the blends containing clinker dust (Table 3).
The content of anhydrite in the thermally treated samples decreased compared with the initial samples (Table 1), and the arcanite content was not fixed at all (Table 3). Missing SO2 in the evolved gases (Figure 3) indicated that anhydrite was transferred partially and the arcanite was transferred completely into the amorphous phase upon thermal treatment of the samples.
The results of the acid-alkali resistance test of the ceramic bodies fired at 1050 °C are presented in Table 4. The relative leachability values of Ca2+, Mg2+, K+ (presented as CaO, MgO and K2O) and SO42− were calculated according to the following equation:
Leachability, % = (mass in solution, mg/mass in solid, mg) × 100
In an acidic environment, the OS ash and clinker dust additives increased the relative leachability of the studied ions quite drastically, and as a rule, the leaching of Ca2+ and Mg2+ was more intensive, being on the level of 8.8–11.1% and 1.2–7.2%, respectively, from the ceramic bodies based on illitic clay, instead of 5.0–9.1% and 0.8–2.0%, respectively, for the blends based on Arumetsa clay. Leaching of K+ was practically on the same level for both clay compositions (between 11.1% and 16.3%), and that of SO42− varied depending on both the basic clays and additives (Table 4). A more considerable increase in the leachability of the ions studied was fixed for the blends with the clinker dust additive, differentiated by their mineralogical compositions from the other thermally treated blends: a higher content of diopside, leucide and akermanite and a lower content of the amorphous phase (Table 3).
In an alkaline environment, the relative leachability of Ca2+, Mg2+ and SO42− decreased for all the studied additives. The leaching of Mg2+ was especially poor, being on the level of 0.005% and 0.072% for all samples (Table 4). The decrease in the leachability of SO42− was remarkable, falling from 96.4% and 56. 2% in the Arumetsa and illitic clay, respectively, to the level of 0.57–4.32%. This was caused first by the low content of sulfur in the original clays (0.08% in both, expressed as SO3 (Table 2)), being quite soluble in alkali, and second by the high content of it in the additives—anhydrite and arcanite—which transformed mostly or completely into an amorphous phase (Table 3), being of poor solubility in an alkaline environment (Table 4).
The leachability of K+, especially in the case of the clinker dust additive, increased two (from 4.48% up to 8.05%) and four (from 2.16% up to 8.41%) times in the blends based on Arumetsa and illitic clay, respectively (Table 4). This was caused by the highest content of potassium-containing minerals—leucite and sanidin—being in these blends.
Therefore, the OS ash and clinker dust additives increased the solubility of the thermally treated samples in the acidic environment and decreased it (except for the potassium) in the alkaline environment.

3.4. Kinetic Calculations

The differential isoconversional Friedman method was applied for calculation of the kinetic parameters from the data obtained under non-isothermal conditions. The equation describing the isoconversional approach, derived from the Friedman differential method, can be expressed by the following equation:
ln(/dt) = ln[A(α)f(α)] − E(α)/RT
where α is the degree of conversion, A is the pre-exponential factor, characterising the frequency of the effective collisions, E is the activation energy in kJ/mol, R is the gas constant expressed as R = 8314 × 10−3 kJ/mol × K and T is the temperature (K).
The function dependent on the reaction model f (α) becomes a constant at each fixed conversion degree α, and the relationship between the logarithm of the reaction rate /dt and 1/T is linear with a slope of E(α)/R.
The values of the activation energy E, calculated in the range of a conversion level 0.1 < α < 0.9 for the Arumetsa and illitic clay, and for the blends with OS ash or clinker dust additives are presented in Figure 9 and Figure 10 and in Table 5.
For example, the value of the activation energy E for the Arumetsa as well as illitic clay with 40% grog followed similar pattern, varying for the illitic clay over a larger range (between 9 and 206 kJ mol−1 instead of 75 and 182 kJ mol−1 for the Arumetsa clay) (Figure 9), characterizing the different overlapping processes taking place in the thermal treatment of the clay samples: emission of physically bound water, thermooxidation of organic matter, dehydroxylation of different clay minerals and, at highest temperatures, different reactions with the formation of secondary silicates. In addition, for the Arumetsa clay, decomposition of the carbonates took place.
For the clay samples with OS ash or clinker dust additives, the decomposition of the blends took place in two steps. In the low-temperature region (step I, depending on a heating rate up to 600 °C), the emission of physically bound water, thermooxidation of organic matter and decomposition of portlandite contained in the OS ashes took place, and the dehydroxylation processes of the clay minerals started. Certain differences could be followed in the patterns of the kinetic parameters, depending on the clay used. For example, for the blend of Arumetsa clay with 40% Auvere FA, the value of the activation energy E in the range of the conversion level 0.1 < α < 0.5 increased slowly from 84 to 115 kJ mol−1, with a following sharp increase reaching around α = 0.62 to the level of 193 kJ mol −1 and then varying on this level up to α = 0.9 (Figure 10a).
For the blend of illitic clay with 40% Auvere FA, the activation energy up to α = 0.65 also followed a permanent slow increase from 175 up to 205 kJ mol−1, but then it decreased sharply to the level of 93 kJ mol −1 at α = 0.76 and varied after that between 90 and 130 kJ mol−1 until a reaction progress of 0.9 (Figure 10a).
In the high-temperature region (step II, between 550 °C and 900 °C), the dehydroxylation of the clay minerals continued. Decomposition of the carbonates started, and different high-temperature reactions with the formation of many new secondary silicates and alumosilicates occurred. Additionally, the formation of a liquid phase started. For this step, the activation energy E in the range of a conversion level α from 0.1 to 0.3 for the blend of Arumetsa clay with 40% Auvere FA increased from 240 to 340 kJ mol−1, followed by a permanent decrease to 15 kJ mol−1 at α = 0.74 and, thereafter, an increase up to 100 kJ mol−1 (at α = 0.9) (Figure 10b).
For the blend of illitic clay with 40% Auvere FA, the activation energy pattern was quite different compared with that based on Arumetsa clay, having a reaction progress between 0.1 and 0.7 which stayed constant on the level of 210–220 kJ mol−1 and then decreased sharply to 135 kJ mol −1 at α = 0.9 (Figure 10b).
The calculated kinetic parameters E and A for all the blends studied are presented in Table 5. The average values of the activation energy E calculated in the range of conversion level 0.1 < α < 0.9 were, as a rule, higher for the blends based on Arumetsa clay, which has a more complex chemical and mineralogical composition than illitic clay (Table 1 and Table 2).

4. Conclusions

The influence of oil shale ash and clinker dust additives on the thermal behavior of clays from the Arumetsa (Estonia) and Füzzérradvány (Hungary) deposits was studied, and the following conclusions can be drawn:
The decomposition of the blends occurred in two steps instead of one, which is characteristic of green clays. In addition to the emission of hygroscopic water, dehydroxylation of clay minerals and thermooxidation of organic matter, the decomposition of portlandite contained in the OS ashes took place at 550–600 °C (step I). During step II (between 550–600 °C and 1050 °C), the dehydroxylation processes continued, decomposition of the carbonates contained in the OS ashes and clinker dust took place, and different solid phase reactions with the formation of secondary silicates occurred.
Therefore, Arumetsa and illitic clay follow single-step decomposition, but their blends with OS ash or clinker dust follow two-step decomposition, shifting the formation of a liquid phase to higher temperatures.
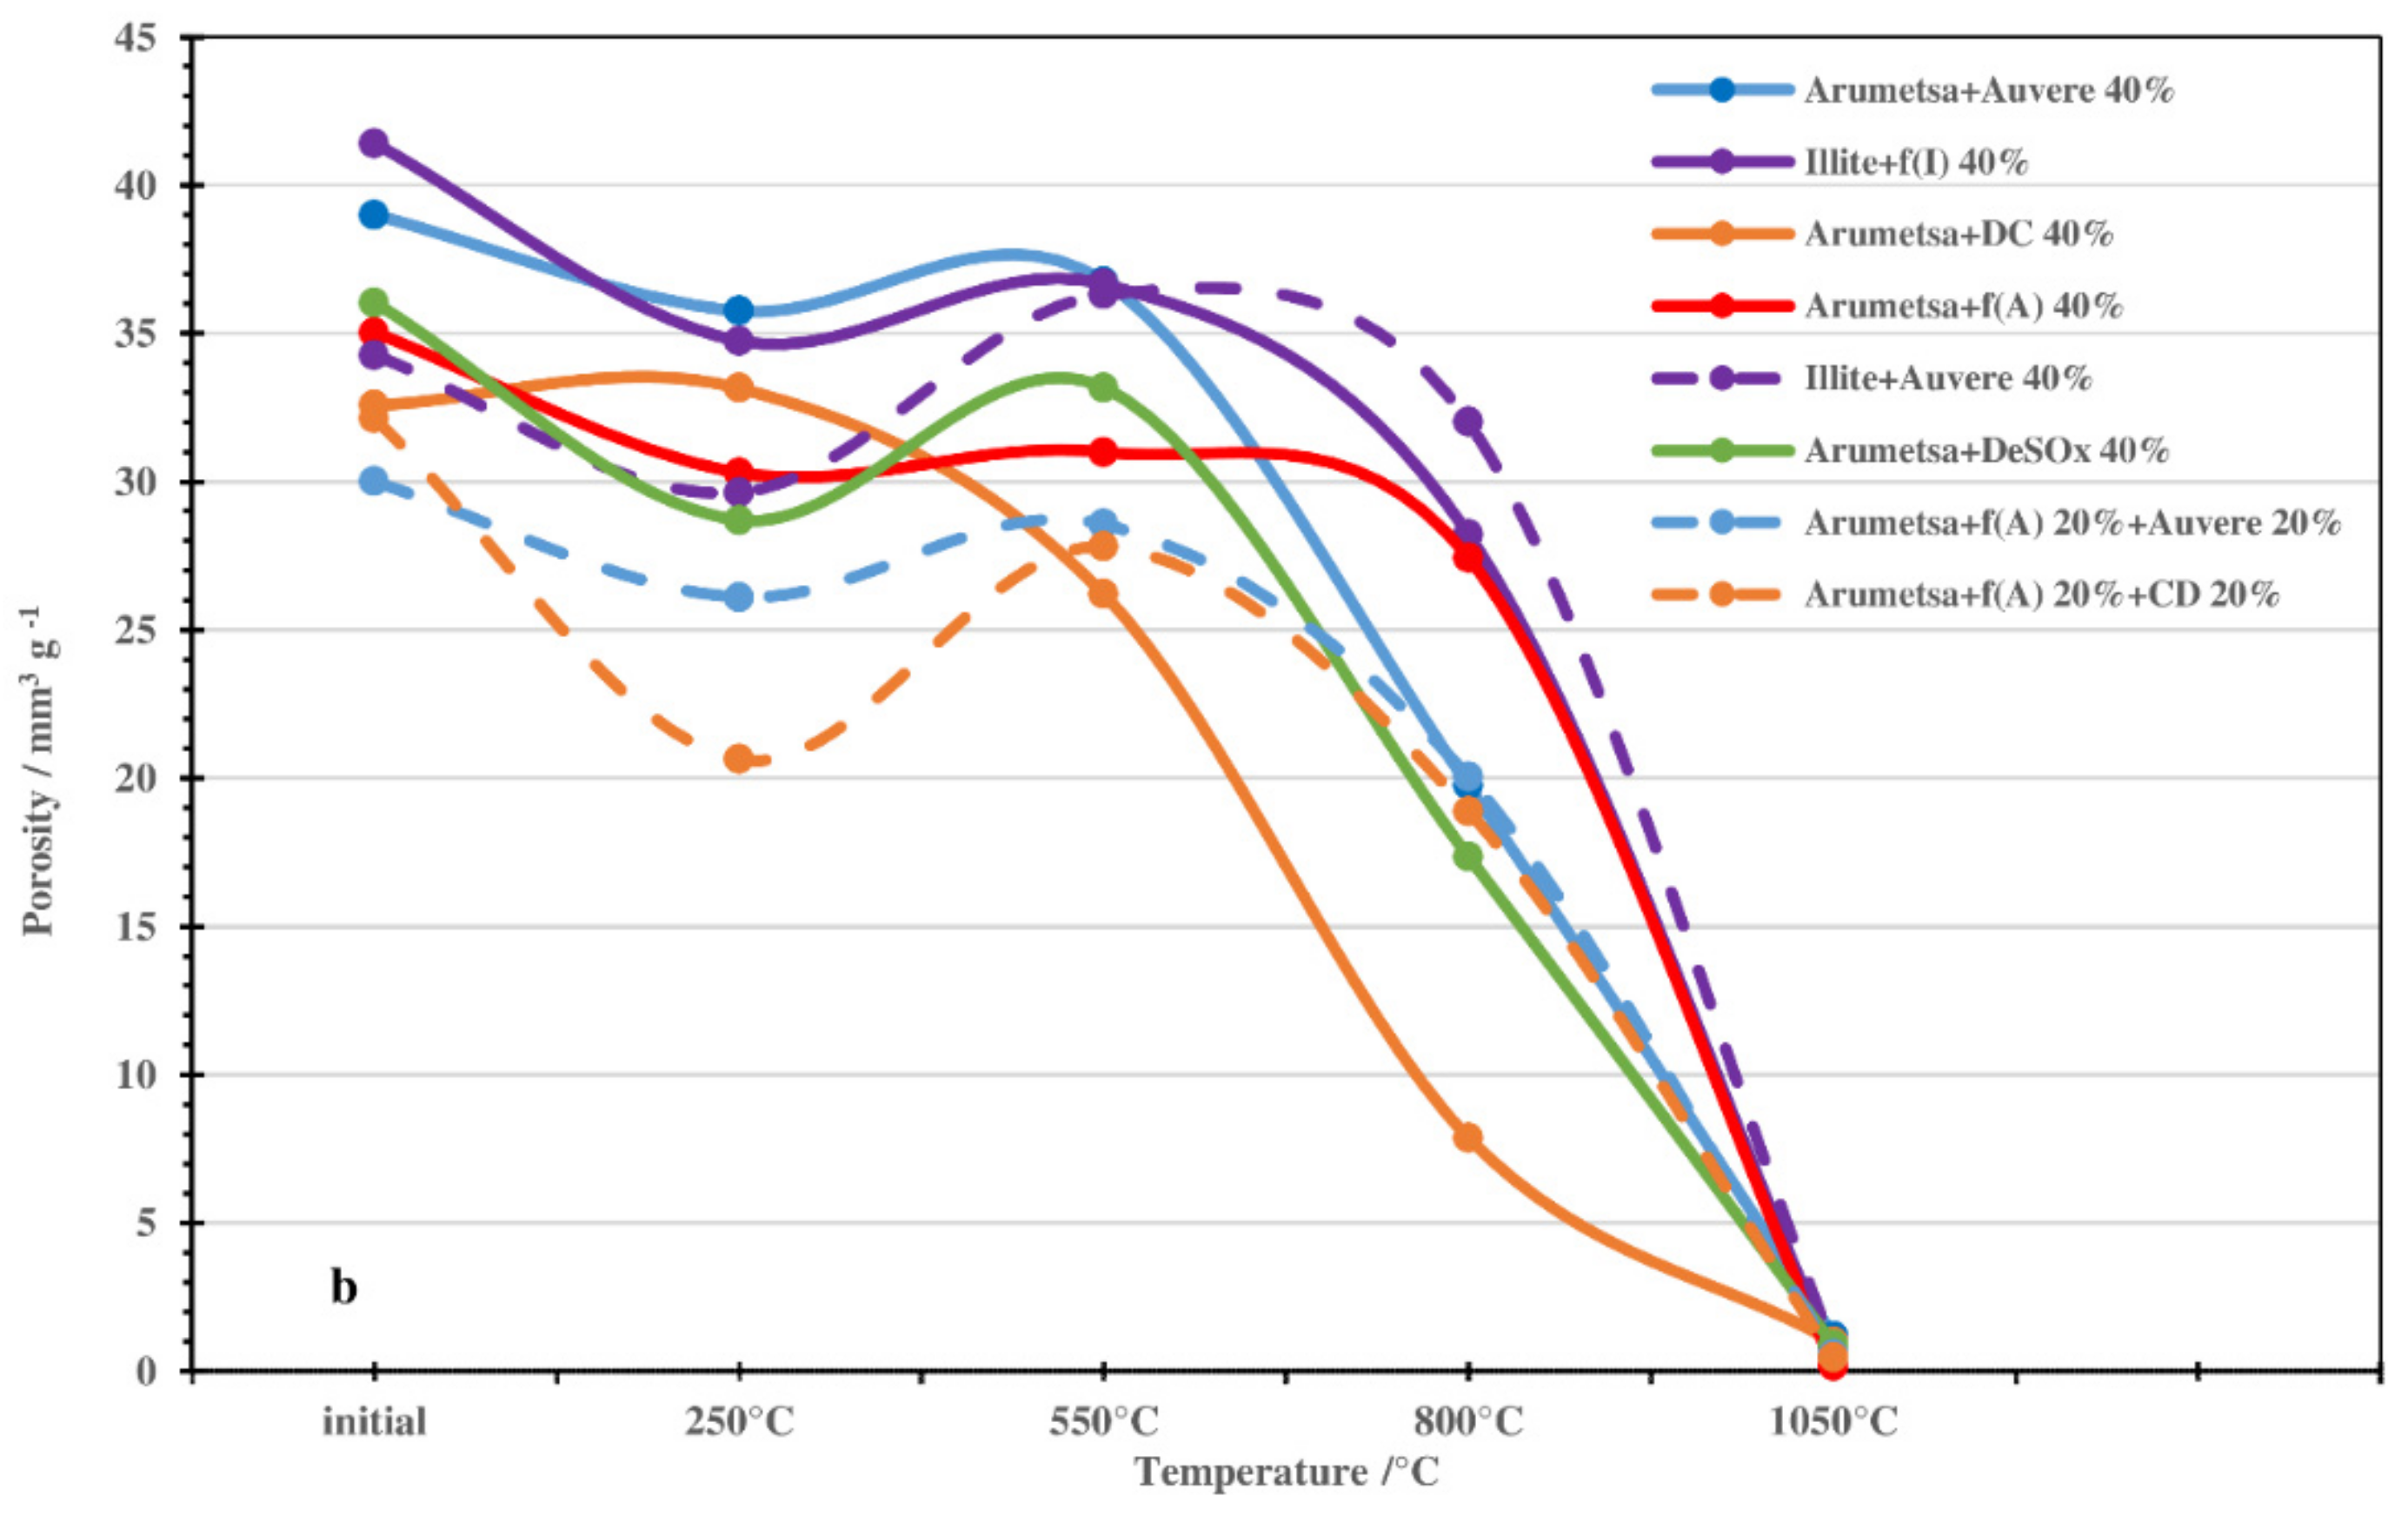
These processes are accompanied by contraction and expansion of the ceramic bodies, with the corresponding changes in the specific surface area and porosity values leading to remarkable changes in the structures of the ceramic bodies caused by the formation of a liquid phase. The OS ash and clinker dust additives shifted the formation of a liquid phase to higher temperatures.
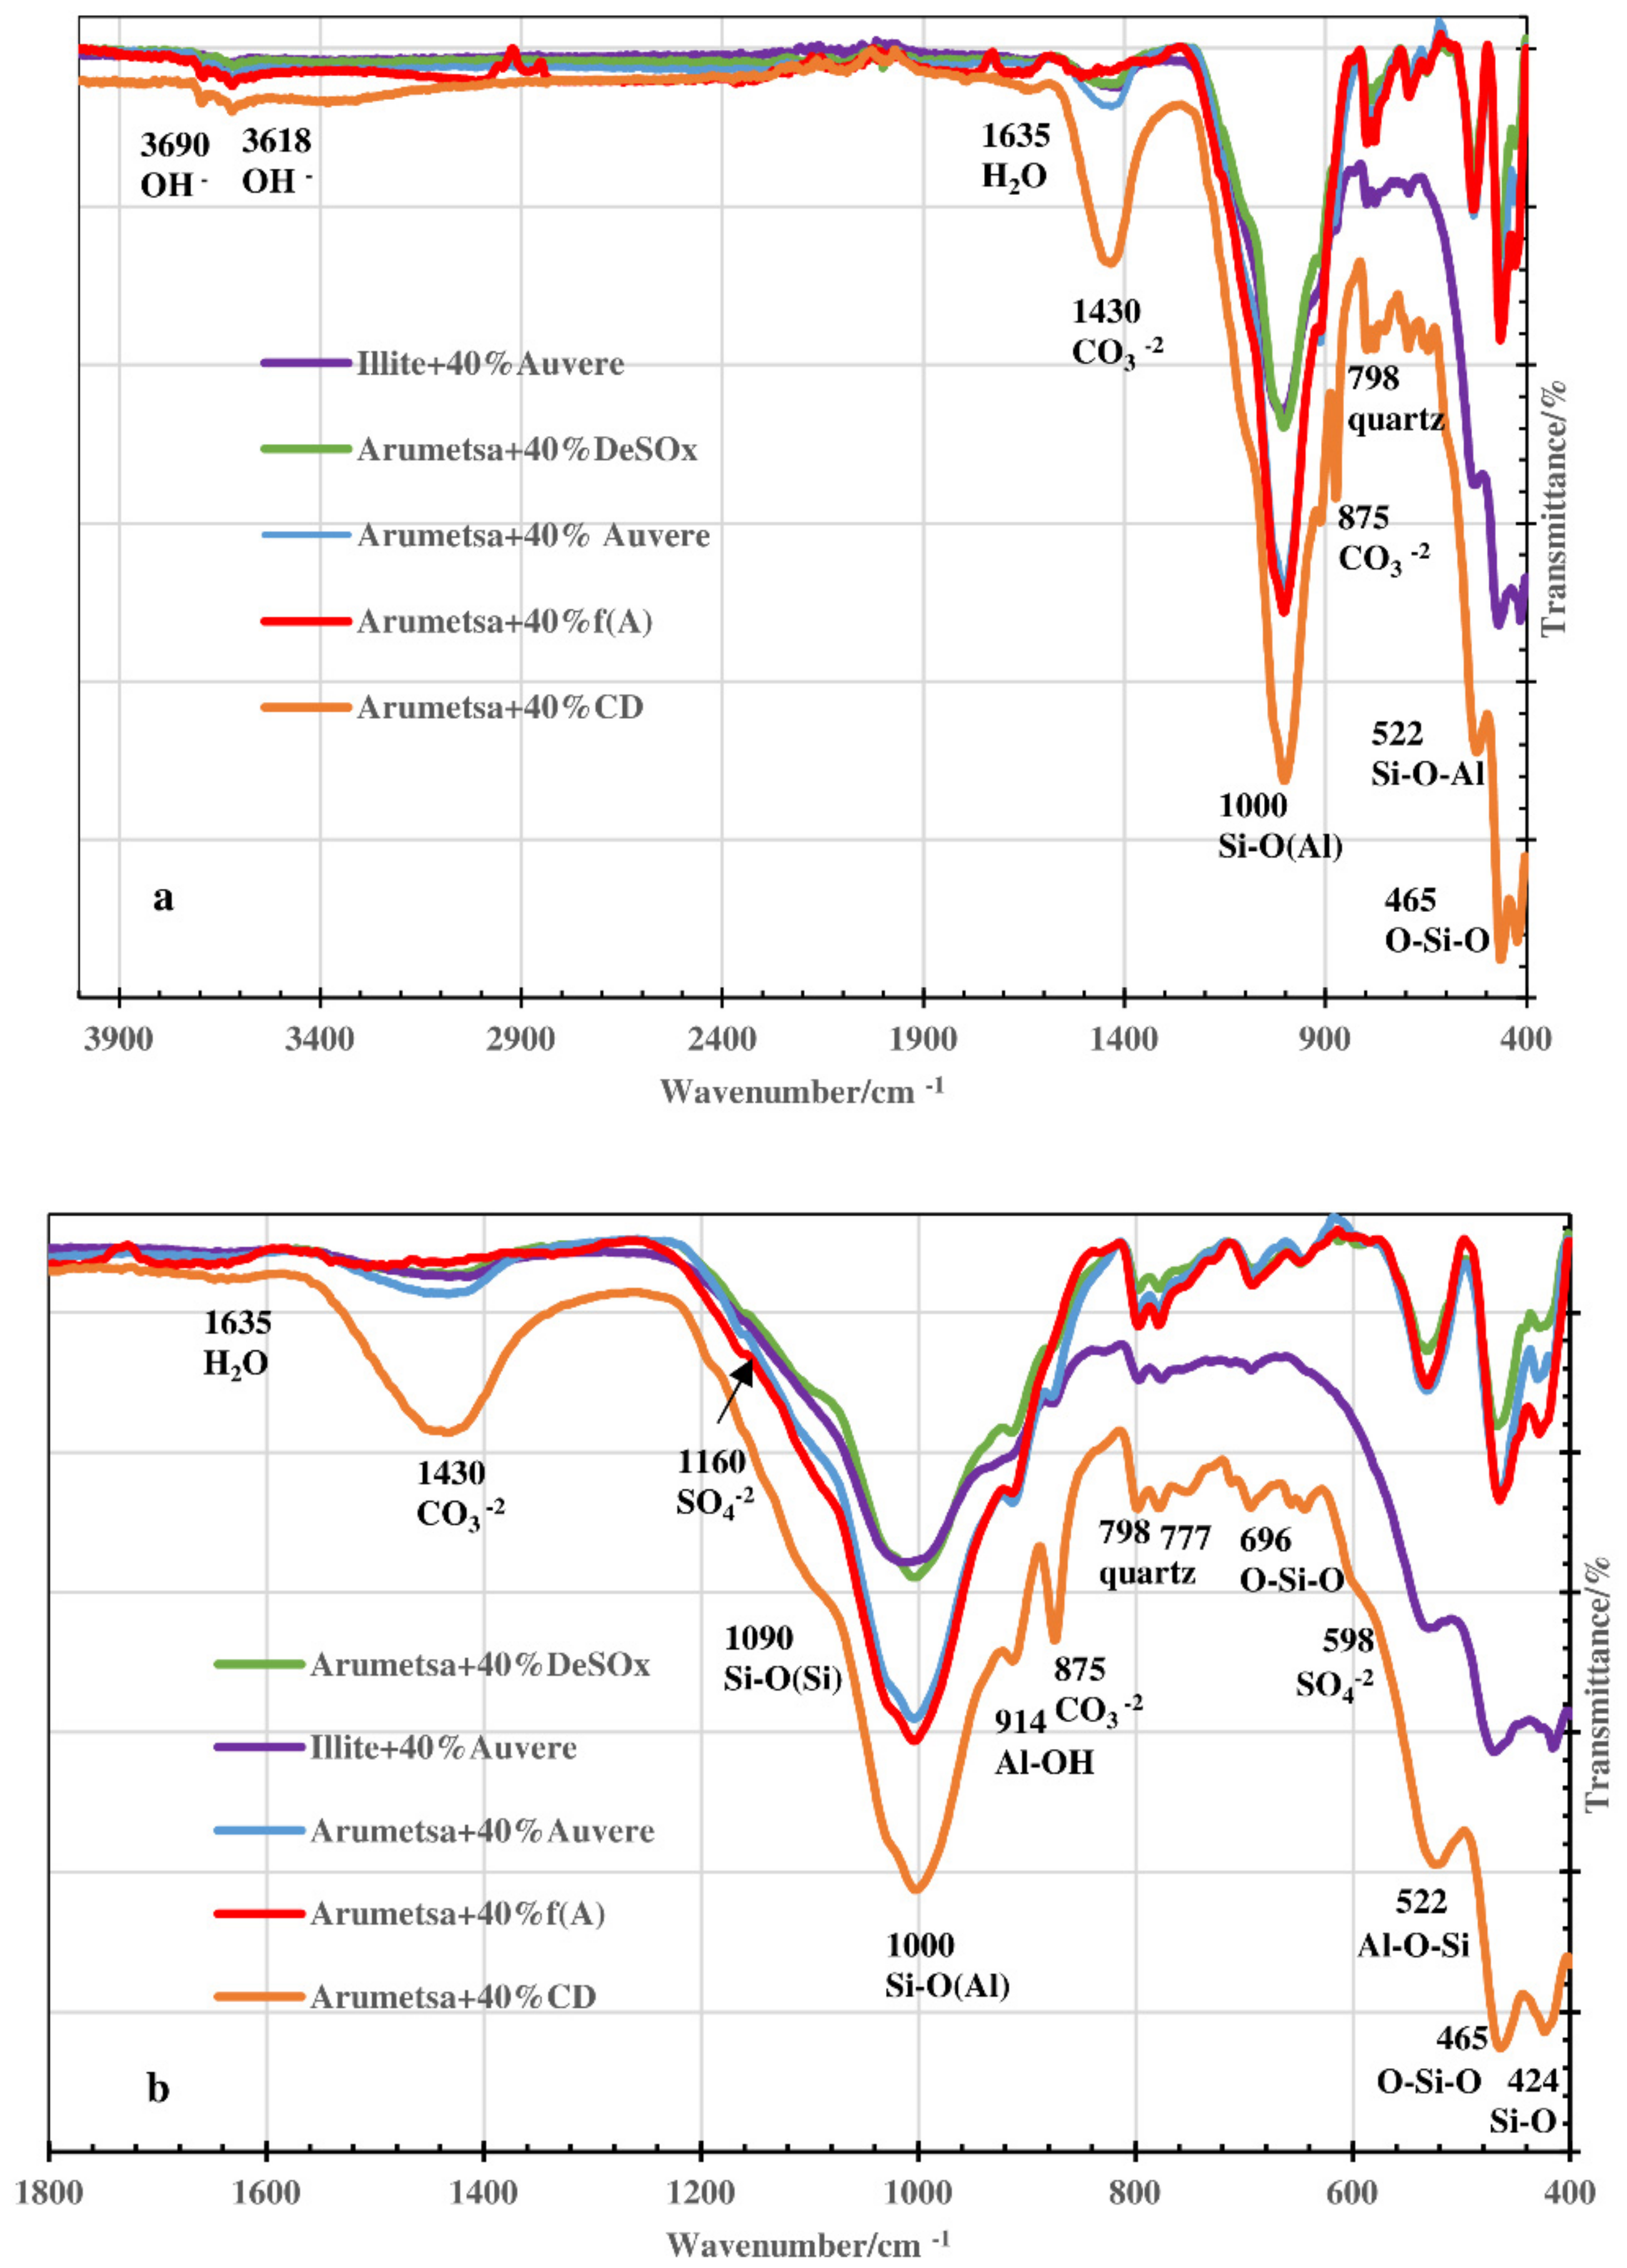
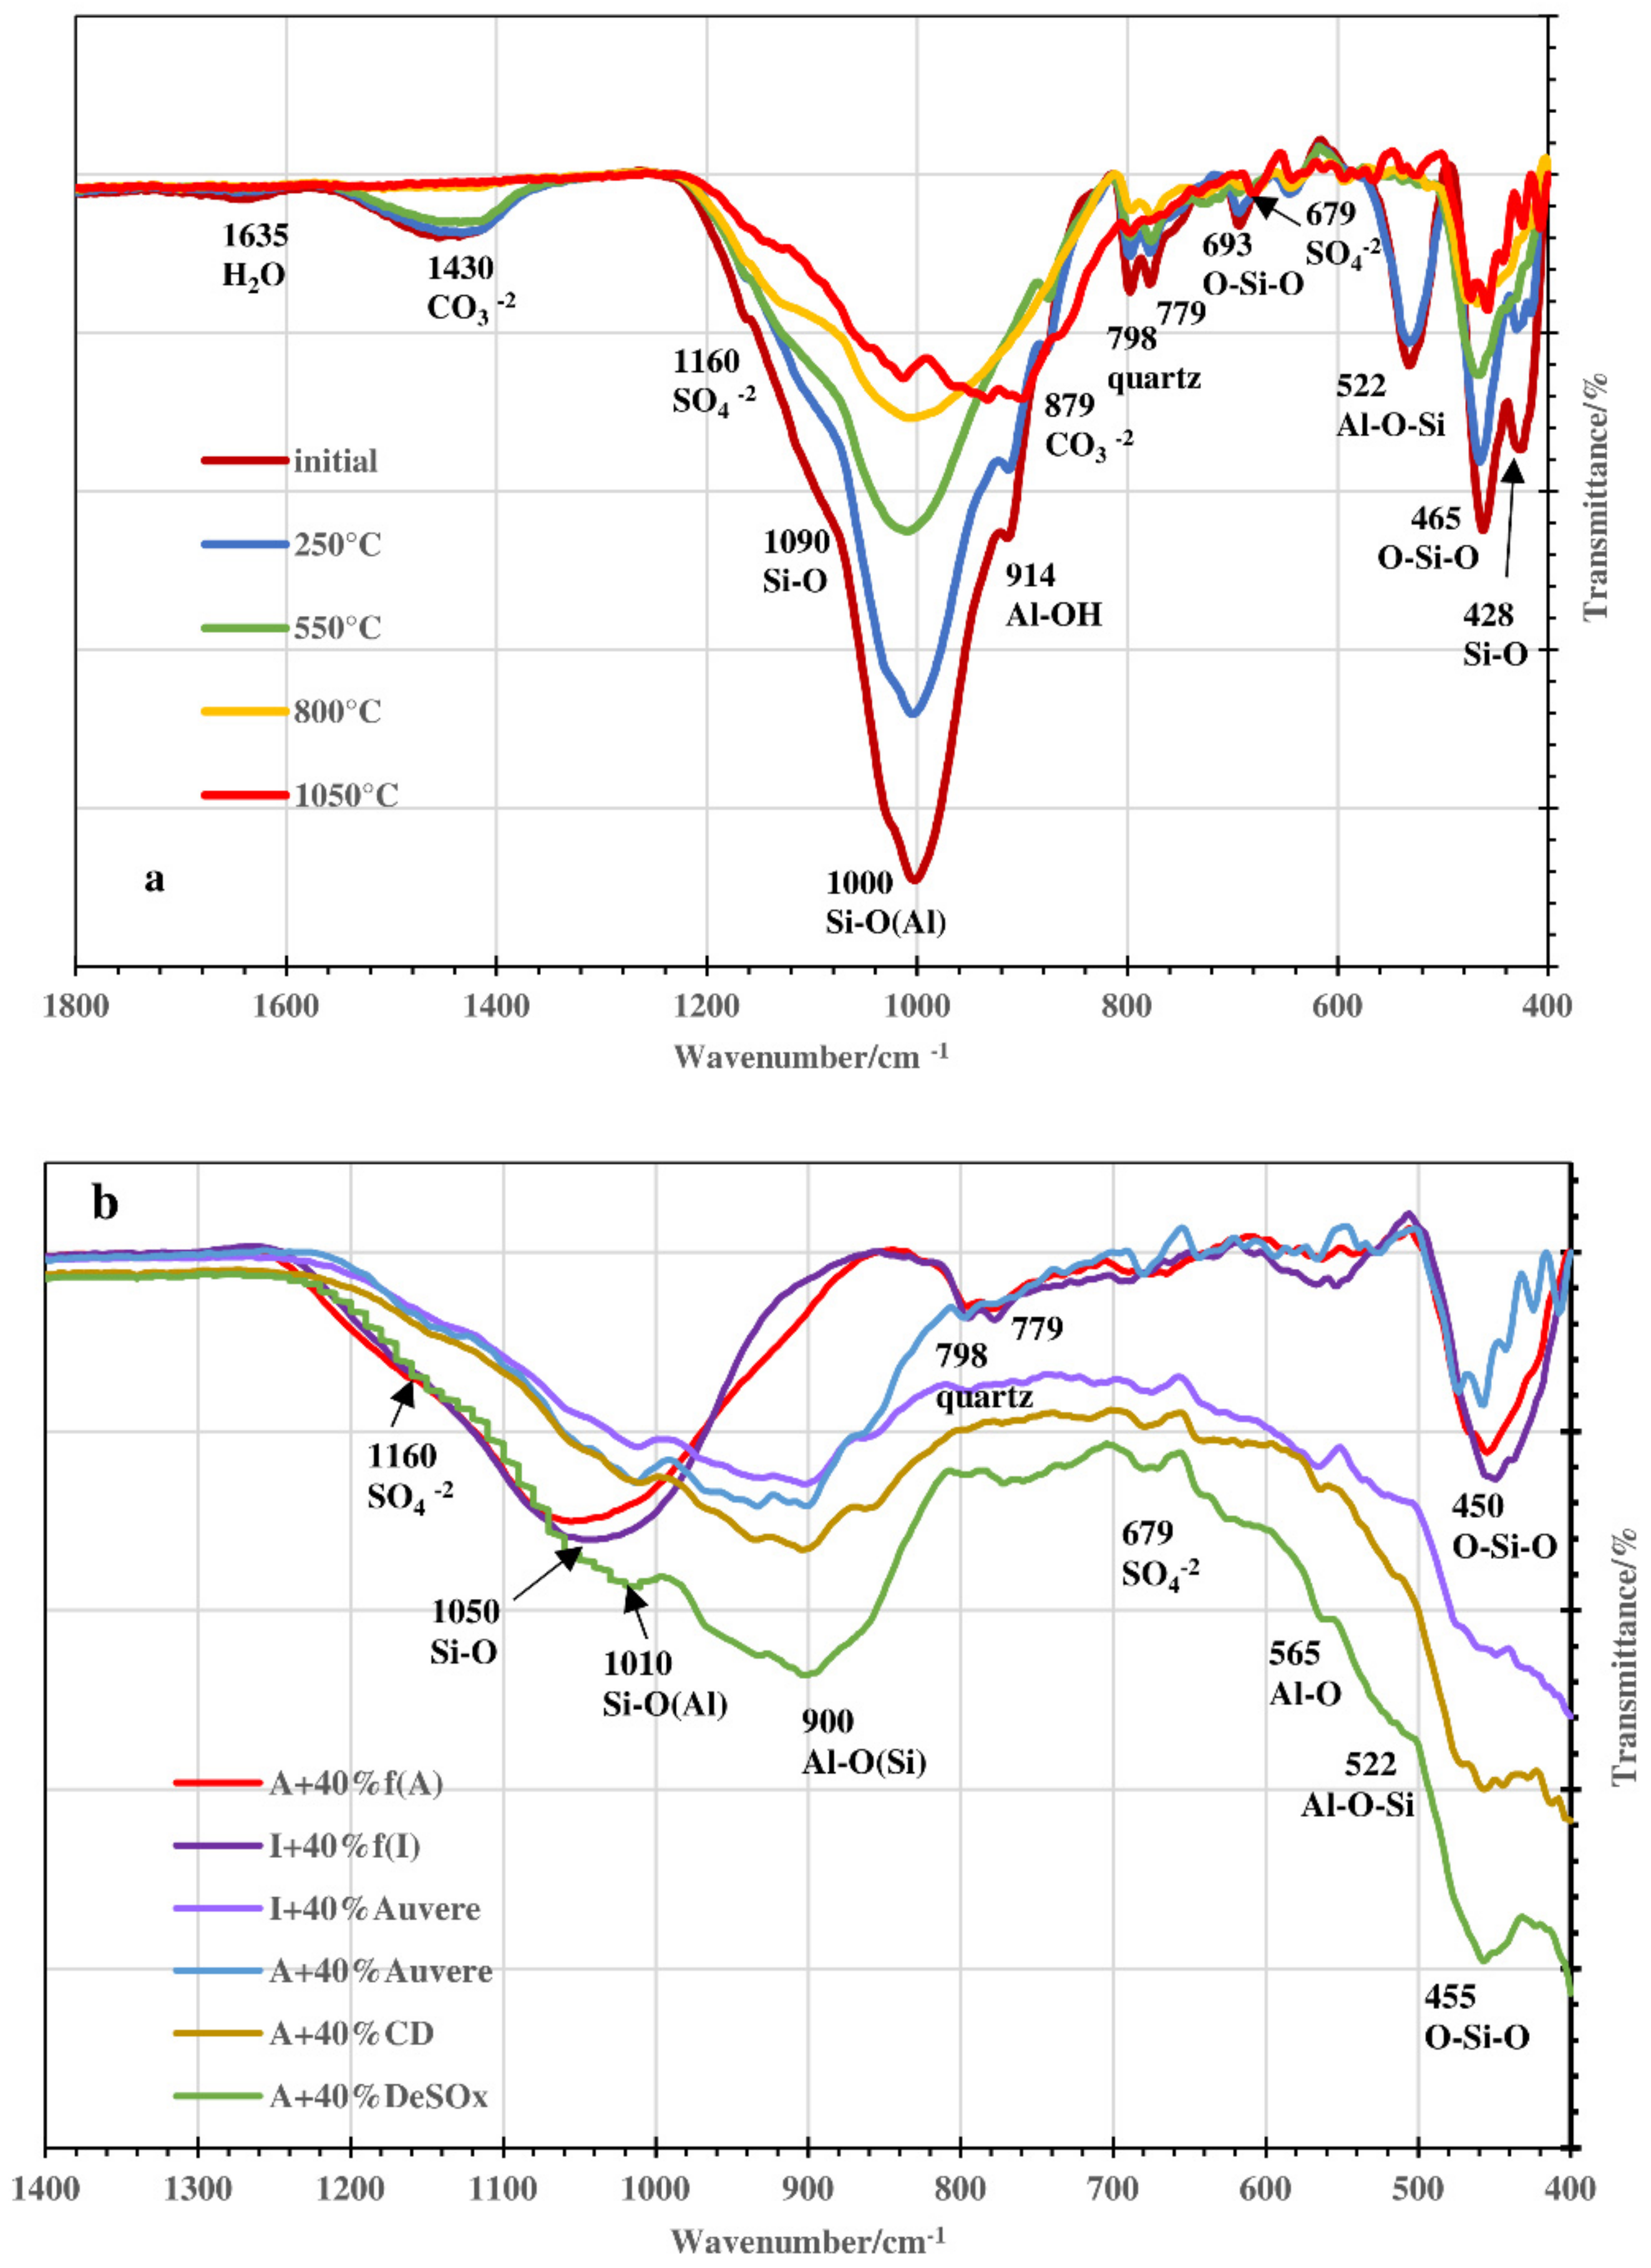
The acid-alkali resistance test of thermally treated ceramic bodies on the leachability of Ca2+, Mg2+, K+ and SO42− showed that in an acidic environment, the relative leachability of all cations increased remarkably. The leachability of the sulfate ions decreased in the case of OS ash additives but increased in the case of clinker dust. In an alkaline environment, the leachability of Ca2+, Mg2+ and especially SO42− decreased, but the leachability of K+ increased, particularly in the case of the clinker dust additive containing notably more arcanite compared with the OS ashes.
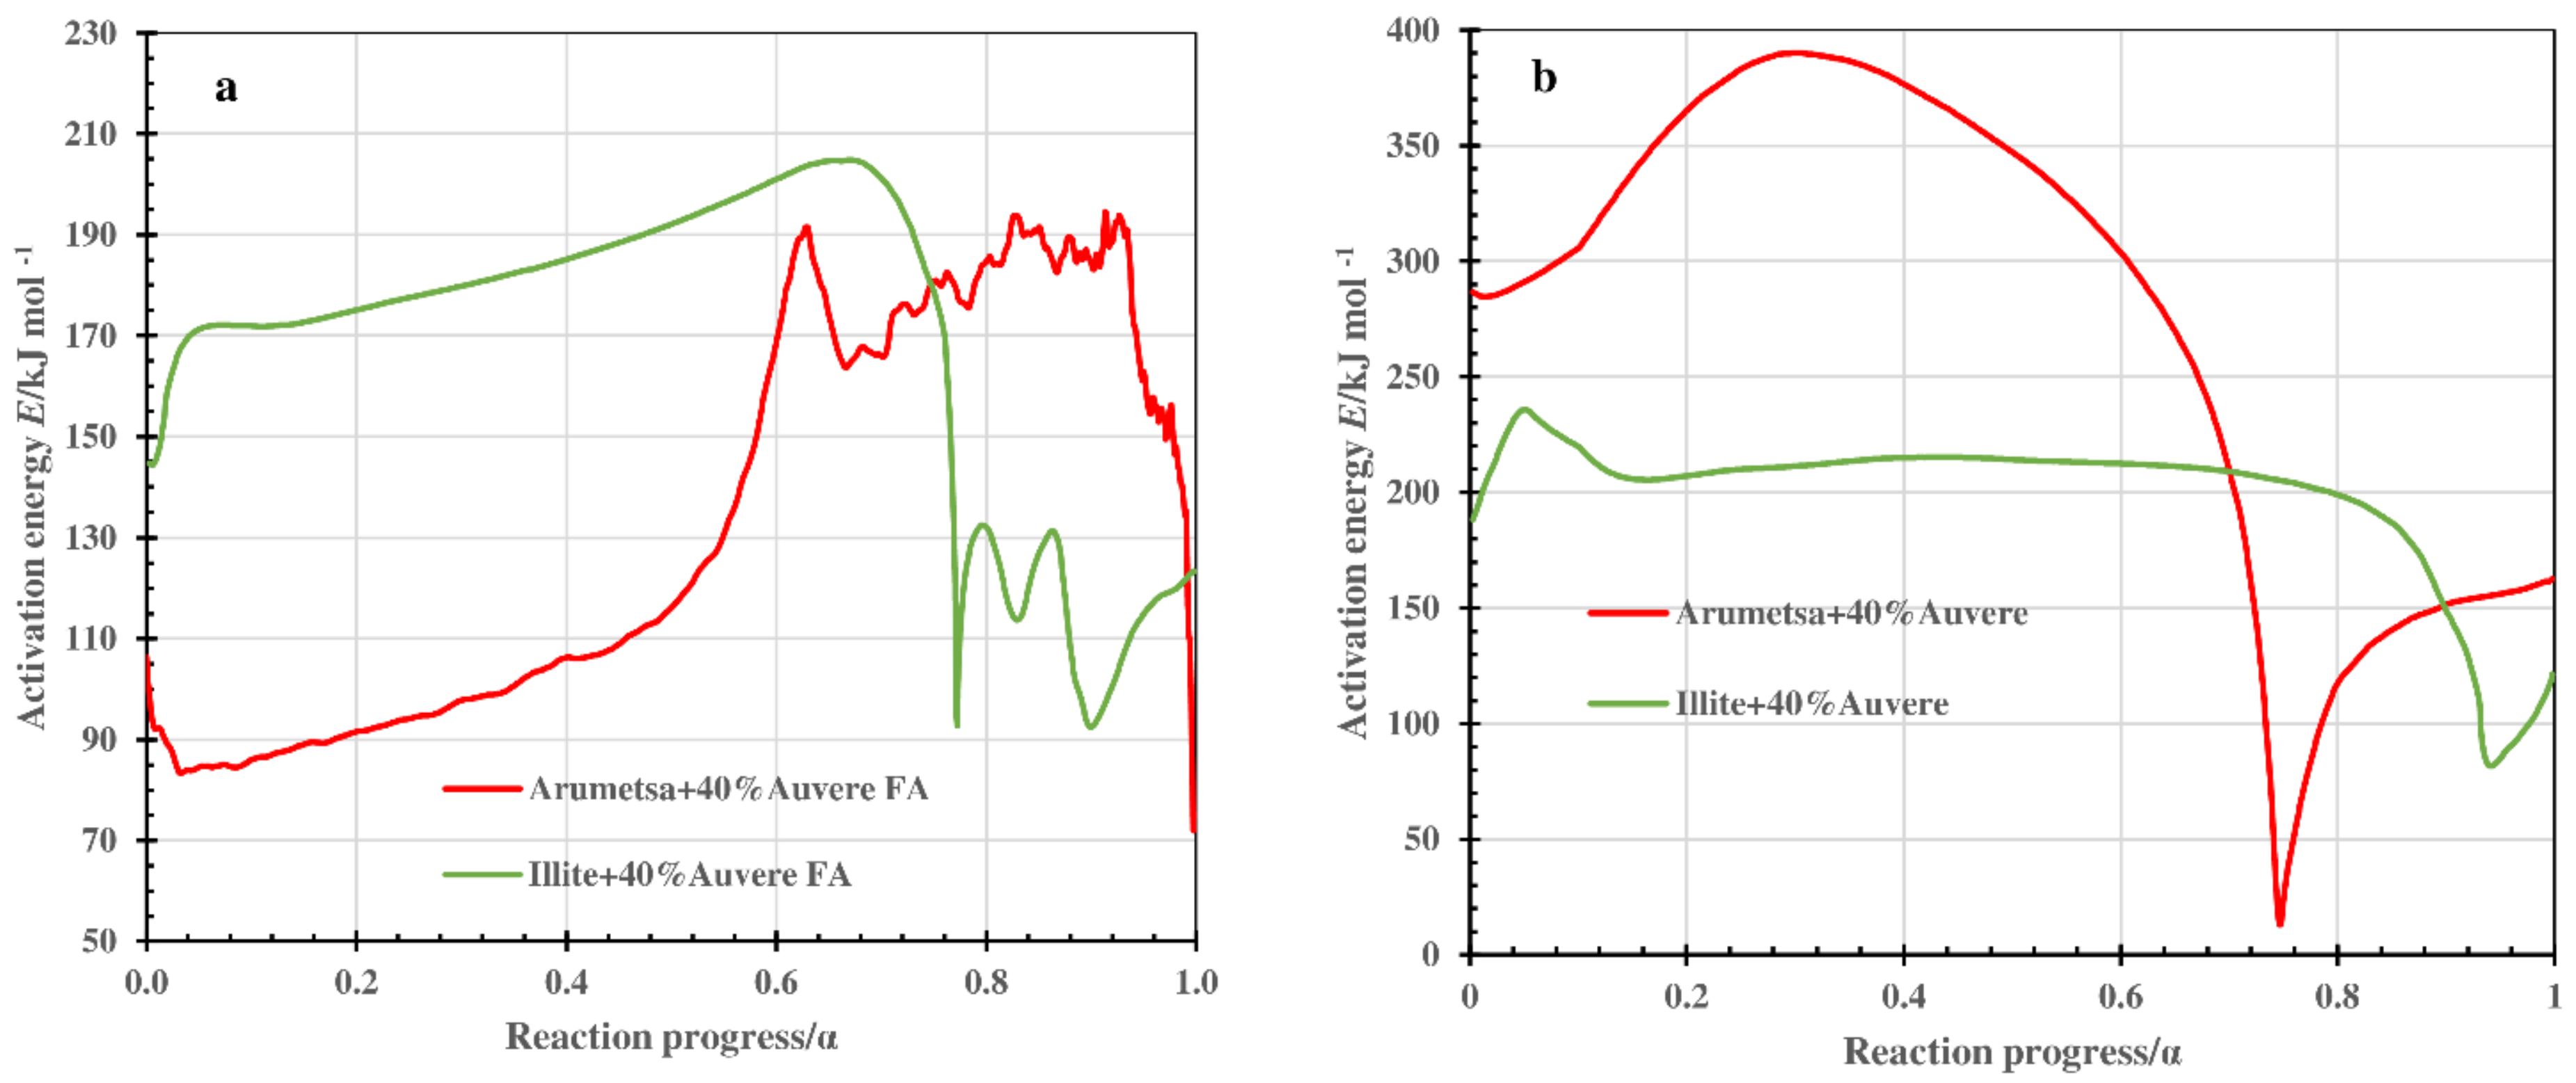
The value of the activation energy E changed in the reaction progress range of 0.1 < α < 0.9 within the large limits for clays, as well as for blends that indicated the complex character of the processes occurring in the thermal treatment of the clays and blends.

Author Contributions

Conceptualization: T.K., I.Š. and A.T.; formal analysis: M.U., M.E., R.T., M.V. and J.J.; methodology and interpretation: T.K., T.H., R.T. and M.V. All authors have read and agreed to the published version of the manuscript.

Funding

This study was partly supported by the Estonian Ministry of Education and Research (IUT33-19).

Data Availability Statement

These studies have no published or reported data in any open databases.

Conflicts of Interest

The authors declare no conflict of interest.

Abbreviations

CDClinker dust
CFBCCirculating fluidized bed combustion
DeSOxSemi-dry desulfurization system
DTADifferential thermal analysis
DTGDifferential TG
EGAEvolved gas analysis
ESPAElectrostatic precipitator ash
FAFly ash
FTIRFourier transform infrared
MSMass spectroscopy
OSOil shale
PFPulverized firing
BET SSABrunauer–Emmett–Teller specific surface area
TGThermomechanical analysis
TMAThermomechanical analysis
XRDX-ray diffraction

References

  1. Kaljuvee, T.; Štubňa, I.; Húlan, T.; Czáki, Š.; Uibu, M.; Jefimova, J. Influence of waste products from electricity and cement industries on the thermal behaviour of Estonian clay from Kunda deposit. J. Therm. Anal. Calorim. 2019, 138, 2635–2650. [Google Scholar] [CrossRef]
  2. Eesti Energia Annual Report. 2020. Available online: http://www.energia.ee/-/doc/8644186/ettevottest/Aastaaruanne/pdf/AA_2020_EST.pdf (accessed on 30 March 2021).
  3. Heidelbrg Cement Annual Report. 2018. Available online: https://www.heidelbergcement.com/en/report-and-presentations/annual_report_2018.pdf (accessed on 20 March 2019).
  4. Brunswick Social Value Review-No 1-2020. Available online: https://www.brunswickgroup.com/media/6645/bsvr_ellenmacarthurfoundation.pdf (accessed on 20 January 2020).
  5. Realizing the Value of Circular Economy in Real Estate. Available online: https://www.ellenmacarthurfoundation.org/assets/downloads/Realising-the-value-of-circulating-economy-in-real-estate.pdf (accessed on 26 February 2020).
  6. Bennhammou, A.; El Hafiane, Y.; Abourriche, A.; Abouliatim, Y.; Nibou, L.; Yaacoubi, A.; Tessier-Doyen, N.; Smith, A.; Tanouti, B. Effect of oil shale addition and sintering cycle on the microstructure and mechanical properties of porous cordierite-ceramic. Ceram. Inter. 2014, 40, 8937–8944. [Google Scholar] [CrossRef]
  7. Cobîrzan, N.; Thalmaier, G.; Balog, A.-A.; Constantinescu, H.; Timiş, I.; Streza, M. Thermophysical properties of fired clay bricks with waste ceramics and paper pulp as pore-forming agent. J. Therm. Anal. Calorim. 2018, 134, 843–851. [Google Scholar] [CrossRef]
  8. Furlani, E.; Tonello, G.; Maschio, S.; Aneggi, E.; Minichelli, D.; Bruckner, S.; Lucchini, E. Sintering and characterisation of ceramics containing paper sludge, glass cullet and different types of clayey materials. Ceram. Int. 2011, 37, 1293–1299. [Google Scholar] [CrossRef]
  9. Sutcu, M.; Akkurt, S. The use of recycled paper processing residues in making porous brick with reduced thermal conductivity. Ceram. Int. 2009, 35, 2625–2631. [Google Scholar] [CrossRef] [Green Version]
  10. Görhan, G.; Şimşek, O. Porous clay bricks manufactured with rice husks. Constr. Build. Mater. 2013, 40, 390–396. [Google Scholar] [CrossRef]
  11. Faria, K.C.P.; Gurgel, R.F.; Holanda, J.N.F. Recycling of sugarcane bagasse ash waste in the production of clay bricks. J. Environ. Manag. 2012, 101, 7–12. [Google Scholar] [CrossRef]
  12. Faria, K.C.P.; Holanda, J.N.F. Thermal behavior of ceramic wall tile pastes bearing solid wastes. J. Therm. Anal. Calorim. 2016, 123, 1119–1127. [Google Scholar] [CrossRef]
  13. Pérez-Villarejo, L.; Eliche-Quesada, D.; Iglesias-Godino, F.J.; Martínez-García, C.; Corpas-Iglesias, F.A. Recycling of ash from biomass incinerator in clay matrix to produce ceramic bricks. J. Environ. Manag. 2012, 95, 5349–5354. [Google Scholar] [CrossRef]
  14. Eliche-Quesada, D.; Leite-Costa, J. Use of bottom ash from olive pomace combustion in the production of eco-friendly fired clay brick. Waste Manag. 2016, 48, 323–333. [Google Scholar] [CrossRef]
  15. Fernández-Pereira, C.; de la Casa, J.A.; Gómez-Barea, A.; Arroyo, F.; Leiva, C.; Luna, Y. Application of biomass gasification fly ash for brick manufacturing. Fuel 2011, 90, 220–232. [Google Scholar] [CrossRef]
  16. Coletti, C.; Maritan, L.; Cultrone, G.; Mazzoli, C. Use of industrial ceramic sludge in brick production: Effect on aesthetic quality and physical properties. Constr. Build. Mater. 2016, 124, 219–227. [Google Scholar] [CrossRef]
  17. Cultrone, G.; Sebastián, E. Fly ash in clayey materials to improve the quality of solid bricks. Constr. Build. Mater. 2009, 23, 1178–1184. [Google Scholar] [CrossRef]
  18. Xu, L.; Guo, W.; Wang, T.; Yang, N. Study on fired bricks with replacing clay by fly ash in high volume ratio. Constr. Build. Mater. 2005, 19, 243–247. [Google Scholar]
  19. Sokolář, R.; Vodová, L. The effect of fluidized fly ash on the properties of dry pressed ceramic tiles based on fly ash—Clay body. Ceram. Int. 2011, 37, 2879–2885. [Google Scholar] [CrossRef]
  20. Taylor, J.C. Computer programs for standardless quantitative analysis of minerals using the full powder diffraction profile. Powder Diffr. 1991, 6, 2–9. [Google Scholar] [CrossRef] [Green Version]
  21. Ward, C.R.; Taylor, J.C.; Cohen, D.R. Quantitative mineralogy of sandstones by X-ray diffractrometry and normative analysis. J. Sed. Res. 1999, 69, 1050–1062. [Google Scholar] [CrossRef]
  22. Friedman, H.L. Kinetics of thermal degradation of char-forming plastics from thermogravimetry. Application to phenolic plastic. J. Polym. Sci. 1965, 6C, 183–195. [Google Scholar] [CrossRef]
  23. AKTS. Softwear and Setaram Instruments: A Global Solution for Kinetic Analysis and Determination of the Thermal Stability of Materials; AKTS AG: Siders, Switzerland, 2006; p. 88. [Google Scholar]
  24. Dweck, J. Qualitative and quantitative characterization of Brazilian natural and organophilic clays by thermal analysis. J. Therm. Anal. Calorim. 2008, 92, 129–135. [Google Scholar] [CrossRef]
  25. Shvarzman, A.; Kovler, K.; Grader, G.S.; Shter, G.E. The effect of dehydroxylation/amorphization on pozzolanic activity of kaolinite. Cem. Conc. Res. 2003, 33, 405–416. [Google Scholar] [CrossRef]
  26. Faria, K.C.P.; Holanda, J.N.F. Thermal study of clay ceramic pastes containing sugargrane bagasse ash waste. J. Therm. Anal. Calorim. 2013, 114, 27–32. [Google Scholar] [CrossRef]
  27. Kaljuvee, T.; Trikkel, A.; Kuusik, R. Decarbonization of natural lime-containing materials and reactivity of calcined products towards SO2 and CO2. J. Therm. Anal. Calorim. 2001, 64, 1229–1240. [Google Scholar] [CrossRef]
  28. Kaljuvee, T.; Kuusik, R.; Radin, M.; Bender, V. Carbon dioxide binding in the heterogeneous systems formed at combustion of oil shale: 4. Reactivity of ashes towards acid gases in the system fly ash-flue gases. Oil Shale 2004, 21, 13–26. [Google Scholar]
  29. Štubňa, I.; Trník, A.; Vozár, L. Thermomechanical and thermodilatometric analysis of green alumina porcelain. Ceram. Int. 2009, 35, 1181–1185. [Google Scholar] [CrossRef]
  30. Ptáček, P.; Frajkorová, F.; Šoukal, F.; Opravil, T. Kinetics and mechanism of three stages of thermal transformation of kaolinite to metakaolinite. Powder Technol. 2014, 264, 439–445. [Google Scholar] [CrossRef]
  31. Sánches-Soto, P.J.; Ruiz-Conde, A.; Bono, R.; Raigón, M.; Garzón, E. Thermal evolution of a slate. J. Therm. Anal. Calorim. 2007, 90, 133–141. [Google Scholar] [CrossRef]
  32. Knapek, M.; Húlan, T.; Minárik, P.; Dobroň, P.; Štubňa, I.; Stráská, J.; Chmelík, F. Study of mickrocraking in illite-based ceramics during firing. J. Eur. Ceram. Soc. 2016, 36, 221–226. [Google Scholar] [CrossRef]
  33. Húlan, T.; Trník, A.; Medved, I. Kinetics of thermal expansion of illite-based ceramics in the dehydroxylation region during heating. J. Therm. Anal. Calorim. 2017, 127, 291–298. [Google Scholar] [CrossRef]
  34. Cizer, Ö.; Rodrigues-Navarro, C.; Ruiz-Agudo, E.; Elsen, J.; Van Gemert, D.; Van Balen, K. Phase and morphology evolution of carbonate precipitated by carbonation of hydrated lime. J. Mater. Sci. 2012, 47, 6151–6165. [Google Scholar] [CrossRef] [Green Version]
  35. Eisazadeh, A.; Kassim, K.A.; Nur, H. Solid-state NMR and FTIR studies of lime stabilized montmorillonitic and lateritic clays. Appl. Clay. Sci. 2012, 67–68, 5–10. [Google Scholar] [CrossRef]
  36. Madejová, J. FTIR techniques in clay mineral studies. Vib. Spectrosc. 2003, 31, 1–10. [Google Scholar] [CrossRef]
  37. Davarcioğlu, B.; Ҫiftҁi, E. Investigation of Central Anatolian Clays by FTIR Spectroscopy (Arapli-Yesilhisar-Kayseri, Turkey). Int. J. Nat. Eng. Sci. 2009, 3, 167–174. [Google Scholar]
  38. Shoval, S.; Yadin, E.; Panczer, G. Analysis of thermal phases in calcareous Iron Age pottery using FT-IR and Raman spectroscopy. J. Therm. Anal. Calorim. 2011, 104, 515–525. [Google Scholar] [CrossRef]
  39. Alver, B.E.; Dikmen, G.; Alver, Ö. Investigation of the influence of heat treatment on the structural properties of illite-rich clay mineral using FT-IR, 29Si MAS NMR, TG and DTA methods. Anadolu Univ. J. Sci. Technol. A Appl. Sci. Eng. 2016, 17, 823–829. [Google Scholar]
  40. Mozgawa, W.; Król, M.; Dyczek, J.; Deja, J. Investigation of the coal fly ashes using IR spectroscopy. Spectrochim. Acta Part A 2000, 56, 1819–1823. [Google Scholar] [CrossRef] [PubMed]
  41. Frost, R.L.; Vassallo, A.M. The dehydroxylation of the kaolinite clay minerals using infrared emission spectroscopy. Clays Clay Miner. 1996, 44, 635–651. [Google Scholar] [CrossRef]
  42. Diko, M.; Ekosse, G.; Ogola, J. Fourier Transform Infrared Spectroscopy and thermal analysis of kaolinite clays from South Africa and Cameroon. Acta Geodyn. Geomater. 2016, 13, 149–158. [Google Scholar]
  43. Zhirong, L.; Uddin, M.A.; Zhanxue, S. FT-IR and XRD analysis of Natural Na-bentonite and Cu (II)-loaded Na-bentonite. Spectrochim. Acta Part A 2011, 79, 1013–1016. [Google Scholar] [CrossRef] [PubMed]
Figure 1. Thermoanalytical curves (a) and emission profiles of H2O and CO2 (b) emitted upon thermal treatment of Arumetsa and illitic clay.
Processes 10 00046 g001
Figure 2. TG and DTG curves (a) and emission profiles of H2O (b) and CO2 (c) upon thermal treatment of Arumetsa and illitic clay with different additives to the amount of 20%.
Processes 10 00046 g002
Figure 3. TG and DTG curves (a) and emission profiles of H2O (b) and CO2 (c) upon thermal treatment of Arumetsa and illitic clay with different additives to the amount of 40%.
Processes 10 00046 g003aProcesses 10 00046 g003b
Figure 4. Thermodilatometric curves of Arumetsa and illitic clay with different additives heated up to 1050 °C: (a) up to 1050 °C and (b) up to 1000 °C (enlarged).
Processes 10 00046 g004aProcesses 10 00046 g004b
Figure 5. Changes in SSA (a) and porosity (b) values of initial and thermally treated blends with different additives.
Processes 10 00046 g005aProcesses 10 00046 g005b
Figure 6. SEM photos of the samples thermally treated at 1050 °C: (a) Arumetsa + 40%f(A), (b) A + 40% Auvere FA, (c) A + 40%DeSOx, (d) A + 40%CD, (e) Illite + 40%f(I) and (f) I + 40%Auvere (magnification: ac,e,f = 1000x, d = 640x).
Processes 10 00046 g006
Figure 7. FTIR spectra of initial blends based on Arumetsa and illitic clay with 40% of different additives. (a) Wavenumber range of 4000–400 cm−1. (b) Wavenumber range of 1800–400 cm−1.
Processes 10 00046 g007
Figure 8. FTIR spectra of blend based on Arumetsa clay with 40% Auvere FA, H thermally treated at different temperatures (a) and blends based on Arumetsa and illitic clay with different additives thermally treated at 1050 °C (b).
Processes 10 00046 g008
Figure 9. Value of the activation energy E determined by Friedman analysis as a function of the conversion degree α for thermooxidative decomposition of Arumetsa and illitic clay with 40% grog.
Processes 10 00046 g009
Figure 10. Value of activation energy E determined by Friedman analysis as a function of the conversion degree α for thermooxidative decomposition of Arumetsa and illitic clay with 40% Auvere FA in step I (a) and step II (b).
Processes 10 00046 g010
Table 1. Mineralogical compositions (%) of initial samples.
Compound or
Formula
Arumetsa
Clay
Illitic ClayPF/
DeSOx
CFBC/
Auvere FA
Kunda NCF/
CD
Amorphous phase--24.620.0-
Kaolin, Al2Si2O5(OH)411.6----
Illite, illite-smectite, mica,
KAl2(AlSi3O10)(OH)2
48.976.4--7.2
Amphipole,
NaCa2(Fe2+,Fe3+)Si6Al2O22(OH)2
1.6----
Lime, CaO--6.98.70.9
Calcite, CaCO30.6-8.89.847.3
Dolomite, CaMg(CO3)22.1----
Anhydrite, CaSO4--10.76.00.4
Quartz, SiO218.517.57.810.711.4
Orthoclase, KAlSi3O83.85.85.813.51.8
Plagioclase, NaCaAlSi3O65.3----
Belite, Ca2SiO4--12.112.48.5
Merwinite, Ca3Mg(SiO4)2--4.41.83.0
Hematite, Fe2O31.2-1.33.6-
Periclase, MgO--3.51.60.6
Arcanite, K2SO4--0.41.015.9
Portlandite, Ca(OH)2--10.57.0-
Chlorite,
(Mg,Al,Fe)6(SiAl)4O10(OH)2
4.9----
Table 2. Chemical composition (%) and some physicochemical characteristics of initial samples.
ItemSample or Content (%)
Arumetsa
Clay
Illitic ClayPF,
DeSOx
CFBC,
Auvere FA
Kunda NCF,
CD
CaOtotal1.50.336.336.941.0
CaOfree--7.911.83.8
MgO2.71.24.72.56.5
CTC/CTIC
Corg *
0.39/0.07
0.32
0.06/
0.06
1.01/1.01
-
1.47/1.39
0.08
5.6/5.6
-
SiO256.557.028.524.214.6
Al2O318.425.07.311.23.5
Fe2O36.81.93.65.61.2
SO3total0.080.089.33.57.2
K2O4.58.53.63.88.2
Na2O0.580.020.320.10-
LOI 950 °C6.97.06.79.624.2
BET SSA
(m2g−1)
44.7148.791.434.683.00
Porosity (mm3g−1)77.6382.143.848.875.15
dmean (μm)12.717.349.621.941.1
* Corg = CTC − CTIC; TC = total carbon, TIC = total inorganic carbon.
Table 3. Mineralogical composition (%) of thermally treated samples at 1050 °C.
Compound or
Formula
Arumetsa(A) 60%
+ 40%f(A)
A60% + 40%
Auvere FA
A60% + 40%
DeSOx
A60%
+ 40%CD
Illite(I) 60%
+40%f(I)
I60% + 40%
Auvere FA
I60% + 40%
DeSOx
I60% + 40%
CD
Amorphous phase44.717.2023.7014.1050.3022.2021.9018.30
Quartz, SiO218.278.785.655.6716.7510.047.656.05
Sillimanite, Al2SiO50.77-0.231.292.290.620.78-
Diopside, CaMgSi2O6-5.805.579.36-1.401.592.06
Anhydrite, Ca(SO4)2-1.740.53--1.481.332.37
Wollastonite, CaSiO3-5.635.196.180.507.627.978.58
Akermanite, Ca2Mg(Si2O7)-14.1611.3718.47-15.339.3711.05
Periclase, MgO1.050.582.440.09----
Hematite, Fe2O35.355.465.041.290.552.853.513.07
Leucite, K(AlSi2O6)0.886.879.3812.38-14.3913.9019.77
Spinel, MgAl2O310.715.226.419.795.81---
Enstatite, MgSiO3-5.224.886.011.645.685.865.56
Plagioclase, NaCaAlSi3O6-0.75-1.80----
Mullite, Al6Si2O1311.5915.075.881.723.782.201.871.34
Sanidin, KAlSi3O86.572.906.567.2218.495.032.666.63
Anorthite, CaAl2Si2O8-4.647.174.47-11.5121.0115.20
Table 4. Relative leachability of CaO, MgO, K2O and SO4−2 (%) from thermally treated samples (1 h at 1050 °C) in 10% water solution of HNO3 and NaOH.
Sample10% HNO3
CaOMgOK2OSO4 −2
Arumetsa(A) + 40%f(A)0.830.180.037.47
A + 40%Auvere FA5.031.3211.070.44
A + 40%DeSOx6.040.8015.673.75
A + 40%CD9.112.0416.3317.81
Illite(I) + 40%f(I)2.260.150.077.52
I + 40%Auvere FA8.817.2311.680.45
I + 40%DeSOx8.661.2215.1114.00
I + 40%CD11.075.9115.0912.86
10% NaOH
Arumetsa(A) + 40%f(A)3.740.0144.4896.42
A + 40%Auvere FA0.350.0125.644.32
A + 40%DeSOx0.720.0085.390.57
A + 40%CD0.720.0058.050.93
Illite(I) + 40%f(I)0.930.0722.1656.18
I + 40%Auvere FA0.550.0293.512.93
I + 40%DeSOx0.570.0155.581.21
I + 40%CD0.670.0128.411.88
Table 5. The activation energy E/kJ mol−1 vs. reaction progress α (α between 0.1 and 0.9).
SampleE/kJ mol−1
Step IStep II
Variation/AverageVariation/Average
Arumetsa clay(A) + 40%fired(f)(A)75–182/128-
A + 20%f(A) + 20%Auvere FA, H164–193/202194–210/205
A + 20%f(A) + 20%DeSOx, H119–169/138190–201/197
A + 20%f(A) + 20%CD, H14–114/73201–213/207
A + 40%Auvere FA, H86–194/13515–390/236
A + 40%DeSOx, H78–158/119153–222/164
A + 40%CD, H77–148/117211–221/214
A + 20%CD, H + 20% Auvere FA, H111–168/130158–217/199
A + 20%CD, H + 20% DeSOx, H75–124/93189–203/193
Illitic clay(I) + 40%f(I)9–206/113-
I + 20%f(I) + 20%Auvere FA, H144–331/185194–235/212
I + 20%f(I) + 20%CD, H18–76/35206–220/213
I + 40% Auvere FA, H94–201/17085–220/204
I + 40%CD, H11–141/76154–220/208
I + 20%CD, H + 20% Auvere FA, H125–188/163186–223/207
Publisher’s Note: MDPI stays neutral with regard to jurisdictional claims in published maps and institutional affiliations.

