Article

Chemical Recycling of Mixed Plastics in Electronic Waste Using Solvent-Based Processing

Department of Plastics Engineering, University of Massachusetts Lowell, Lowell, MA 01854, USA
*
Author to whom correspondence should be addressed.
Processes 2022, 10(1), 66; https://doi.org/10.3390/pr10010066
Submission received: 29 November 2021 / Revised: 20 December 2021 / Accepted: 27 December 2021 / Published: 29 December 2021
(This article belongs to the Section Environmental and Green Processes)

Abstract

:
Currently, less than 20% of electronic waste (E-waste) produced in the U.S. is recycled. To improve the recycling rate of E-waste, the study aimed to: (1) identify the major plastics found within electronic shredder residue (ESR), (2) design solvents and processing conditions capable of separating out 90% of the plastic in ESR, and (3) estimate the energy efficiency of the solvent-based process developed. Preliminary screening showed 25 wt.% of the ESR was composed of plastics, with two polymers dominating the sorted plastic fraction—polystyrene (PS, 40 wt.%) and acrylonitrile butadiene styrene (ABS, 25 wt.%). Subsequently, solvents and anti-solvents were screened using Hansen Solubility Parameter Theory for PS, ABS, and ESR dissolution. The pre-screening results showed dichloromethane (DCM) and tetrahydrofuran (THF) as the most effective solvents for PS and ABS, with methanol (MeOH) and ethylene glycol (EG) as the most effective anti-solvents. By optimizing the dissolution time and the solvents used, the highest polymer dissolution yield (99 wt.%) was achieved using DCM for 48 h. Both MeOH and EG precipitated 71 wt.% of the polymer fraction of ESR. EG removed more phosphorus containing flame retardants (94 wt.%) than MeOH (69 wt.%). Energy analysis indicated that the solvent-based processes could save 25–60% of the embodied energy for PS and ABS. Characterization showed that the solvent-based processing could preserve the high molecular weight fraction of the polymers while removing flame retardants at the same time. The results from this study prove the potential of solvent-based processing to produce secondary plastic materials from E-waste for cross-industry reuse.

1. Introduction

Electronic waste (E-waste), containing computer equipment and consumer electronic components, is one of the fastest-growing waste streams (7–10% per year) globally [1,2]. Although E-waste embodies only 2% of America’s total municipal waste, it contains significant amounts of toxicants including heavy metals and flame retardants (FRs) [3]. These pose a significant threat to both human health and the environment given the current methods of disposal of it. Large amounts of E-waste are either incinerated or put into landfills [4]. When leached out from landfills, heavy metals found within E-waste including lead, cadmium, and mercury, pollute water sources and eventually the food chain. FRs are released uncontrollably into the environment when leached from landfill, with the added possibility of dioxin formation when incinerated [4].
FRs are additives used in plastics for the flammability standard in electronic applications. FRs, including alumina trihydrate, antimony oxides, and halogenated compounds, are added into plastics or composites to increase the thermal stability of flammable materials [5]. In the electronics market, FRs are used in key electrical and electronic components such as electronic housings, cables, connectors, and switches. More specifically, phosphorus and brominated FRs are often used in plastic components in and around electronics. These FRs have been found to be toxic and highly persistent in the environment when released [5,6]. Given this, effective recycling technologies should be developed to prevent the future release of FRs into the environment.
Currently, less than 20% of all E-waste is recycled. The low fraction can be attributed to the economic infeasibility of current processes to effectively produce high quality material for end-use markets. Mechanical recycling (e.g., sorting, shredding, and melt processing) is a widely used method to recycle E-waste [1,7,8,9]. However, the process cannot handle mixed plastics or remove hazardous additives such as FRs or pollutants (e.g., ceramics and metals from printed circuit boards) [6,10]. The sorting costs associated with separating out the metals and polymers are too high for the process to be economically viable for companies to adopt [11]. Moreover, plastics containing certain additives like brominated FRs at concentrations above set values cannot be used in new products due to regulations or consumer concerns [12,13].
Thermochemical conversion is also used to convert the plastic fractions of E-waste into energy or fuels [6,14,15]. However, it typically requires high temperatures and results in products unusable to be remanufactured into their original state that are of lower quality and value (i.e., down-cycling) [16,17]. In fact, it was found that the energy efficiency (defined as the total energy output divided by the energy input, which excludes the energy of the feedstocks; the energy output is the energy of fuels or the heating values of plastics) of the solvent-based processing is about two-times higher than pyrolysis and eight-times higher than incineration. In terms of reducing greenhouse gas emissions, literature also suggests that material recycling of plastics through solvent extraction would be two-times lower than pyrolysis and three-times lower than incineration [18]. Furthermore, thermochemical conversion processes break down the polymers into small molecules or monomers, resulting in the loss of much of their embodied energies [19]. Thermochemical conversions such as pyrolysis also cannot remove halogenated contents from the recycling products (pyrolytic oil in this case). For example, it was found that up to 99% of brominated contents were transferred into the oil products converted from brominated high-impact polystyrene (Br-HIPS, which is commonly used in electronics) via pyrolysis [15]. In addition, any precious metals present in E-waste are incorporated into char products and devalued [1]. This all results in a system that produces lower quality products that are worth less on the marketplace. There is also the continued need for new polymeric materials as high-end markets still need virgin polymers to create their products. To reduce the serious threat of E-waste to the environment, it is imperative to develop efficient and economical methods for recovering the plastic fraction and enriching the metallic fraction from E-waste.
To preserve the polymeric structure of plastics used in electronics, dissolution-precipitation, which involves dissolving a polymer in a solvent and then reclaiming it through precipitation (either by cooling, evaporation of solvent, or addition of anti-solvent/non-solvent), has been explored [20,21,22,23,24]. In general, dissolution-precipitation is applicable to a wide variety of polymers and can preserve the high molecular-weight compounds from plastic waste [23,25]. For instance, dichloromethane (DCM) and acetone (ACE) have been used to recover over 90% of PC with a similar molecular weight to that of virgin PC [25]. Similarly, DCM and N-methyl-2-pyrrolidone (NMP) have been used to recover PC from a cell phone plastic mixture containing PC and Polyamides [17]. Additionally, isopropanol and toluene have been used to remove brominated flame retardants from the plastic fractions in E-waste (including plastics used for modern Wi-Fi devices and printed circuit boards) by using Soxhlet or microwave-assisted extraction at the boiling point of solvents (132 and 153 °C) [6,26]. These studies mostly used pre-sorted or simulated electronic waste where flame retardants were added to the plastic mixture for experimental purposes. Few studies have attempted to remove flame retardants from real E-waste by using an energy advantageous method, suggesting a knowledge gap on tests carried out with real E-waste.
To achieve an effective dissolution-precipitation process, solubility parameters such as the Hansen, Kamlet-Taft, or Hildebrand solubility parameters have guided the selection of solvents [23,25,27,28]. Solubility parameters are numerical estimates used to characterize the degree of interaction between compounds. The Hildebrand solubility parameters, which describe the degree of solubility for nonpolar or slightly polar substances, were first introduced in 1936 [29]. Later, Charles Hansen developed the Hansen Solubility Parameters (HSP), which provide a surface energy-based system for predicting solubility phenomena. Three parameters are used to describe the surface energy of a chemical: dispersion forces (including dipole-dipole interactions, δD), polar forces (δP), and hydrogen bonding forces (δH) [28,30,31]. The famous rule of “like dissolves like” is mathematically described by these solubility parameters and used to predict the solubility phenomena of the molecule.
To produce secondary plastic materials from E-waste for cross-industry reuse, this study aimed to demonstrate the potential of a solvent-based dissolution-precipitation process to simultaneously recover and purify the plastic fraction from real E-waste. Feedstock consisting of a pre-sorted electronic shredder residue (ESR) was provided by a commercial E-waste scrapper and used during research. The specific tasks of this study were to: (1) determine the composition of a representative sample for ESR, (2) identify a list of plastics for recovery using a solvent-based process, (3) scientifically design solvents/anti-solvents to effectively recover the identified plastics using HSP, (4) optimize dissolution conditions for dissolving plastics from the ESR, (5) design an anti-solvent system to recover the polymers and remove FRs from the polymers simultaneously, and (6) evaluate the energy efficiency. The embodied energy of the secondary plastics recovered using solvents/anti-solvent selected from this study was also estimated. Discussion about the economics of the proposed solvent-based processing was also included.
The success of this project will hopefully lead to an increase in recycling rates of E-waste plastics. It is expected that the embodied energy loss from recycled E-waste plastics will significantly be reduced. In addition, the expectation is that solvent-based processing will promote cost parity for secondary materials. It is also envisaged that implementing similar solvent-based recycling technologies could be used to recover plastics from durable goods and auto shredder residue.

2. Materials and Methods

2.1. Materials

The electronic shredder residue (ESR) was supplied and presorted by a commercial E-waste recycler (Sunnking Inc., Brockport, NY, USA). During the pre-sorting processes, all batteries, toner cartridges, and anything else that could not be put through the shredder were manually removed. Next, the material went through a shredder that sized the material into strips (similar to how a paper shredder works). Afterwards, the material continued into a Hammer Mill that beat the material, creating cleaner streams of material. Furthermore, the mill had a screen approximately 2″ × 2″, so the material must have been small enough to drop through. After the Hammer Mill, the material went over an incline belt with a magnetic head pulley. Any material pulled by the head pulley went over another belt with a cross belt magnet to better sort the ferrous and non-ferrous materials. All of the non-ferrous materials then went over a picking conveyor where all aluminum was picked out as the metal refiners do not want aluminum in the material. That leaved copper, stainless steel, plastics, and precious metal bearing boards in the mix.
Once the presorted ESR arrived at Lowell, the plastic pieces were hand separated from the remaining non-polymeric components. The hand sorting process ensured that only plastics components would be present as copper wires would be excluded. Subsequently, the hand-picked plastic pieces were fed though a metallic eddy current separation device capable of detecting and removing any missed copper wires as well as any plastic pieces with metallic components (e.g., screws) built into or adhered to them.
Solvents and the 0.45-micron filter paper used in this study were purchased from Fisher Scientific (Waltham, MA, USA).

2.2. Hansen Solubility Parameters (HSPs)

Hansen Solubility Parameters (HSPs) were used to calculate the difference in dispersion (δD), polarity (δP), and hydrogen bonding (δH) forces of the polymers and solvents [27,28]. In general, solvents have an absolute HSP (with specific δD, δP, and δH values), while solutes (polymers) are represented by a sphere indicating a spatial region of likely solubility (with a radius, R0) [32]. The HSP distance from the center of the sphere to a solvent is Ra and can be calculated using Equation (1):
R a 2 = 4 ( δ D 2 δ D 1 ) 2 + ( δ P 2 δ P 1 ) 2 + ( δ H 2 δ H 1 ) 2
In Equation (1), δ D 2 and δ D 1 represent the dispersive forces for a selected solvent and a given polymer, respectively. Similar denotation is applied for δP (polarity) and δH (hydrogen bonding). With the values of Ra and R0, one can calculate the relative energy difference (RED) using Equation (2):
RED = T h e   H S P   d i s t a n c e   o f   a   s o l v e n t   t o   t h e   c e n t e r   o f   t h e   s o l u t e   s p h e r e T h e   r a d i u s   o f   t h e   s o l u t e   s p h e r e = R a R 0
Theoretically, an ideal solvent would be located at the sphere center with a RED of 0, with solvent effectiveness decreasing with increasing distance from this ideal solvent. Solvents that have a RED value smaller than 1 are located inside of the sphere and are suitable as possible solvents to dissolve the polymer. For solvents with further distance from the sphere center (i.e., RED values significantly > 1), they are suitable as possible anti-solvents to precipitate targeted polymers. More details can also be found from prior studies [27,28].

2.3. Designing Solvents and Anti-Solvents Based on HSPs

HSP theory was used to identify solvents that could theoretically dissolve the targeted polymers. Solubility testing was also performed to observe whether the solvent candidates would be suitable to dissolve the target plastics. Solvents and anti-solvents were selected for the targeted plastics (PS and ABS) based upon their cost-effectiveness and theoretical ability to dissolve/precipitate the polymers. For solvent testing, one gram of either ABS or PS was placed in 20 mL of a potential solvent with a 30-min dissolution time at room temperature [17,25,33]. For the anti-solvent screening, one gram of either ABS or PS was dissolved in dichloromethane (DCM) for 2 h. Afterwards, 10 mL of various anti-solvents were added into the solution to precipitate the target polymer for 30 min [17,33,34].
A summary of the dissolution-precipitation process is shown in Figure 1. As shown in Figure 1, flame retardants (FRs) were removed from ESR plastics via filtration. It is expected that FRs would partition into the anti-solvent.

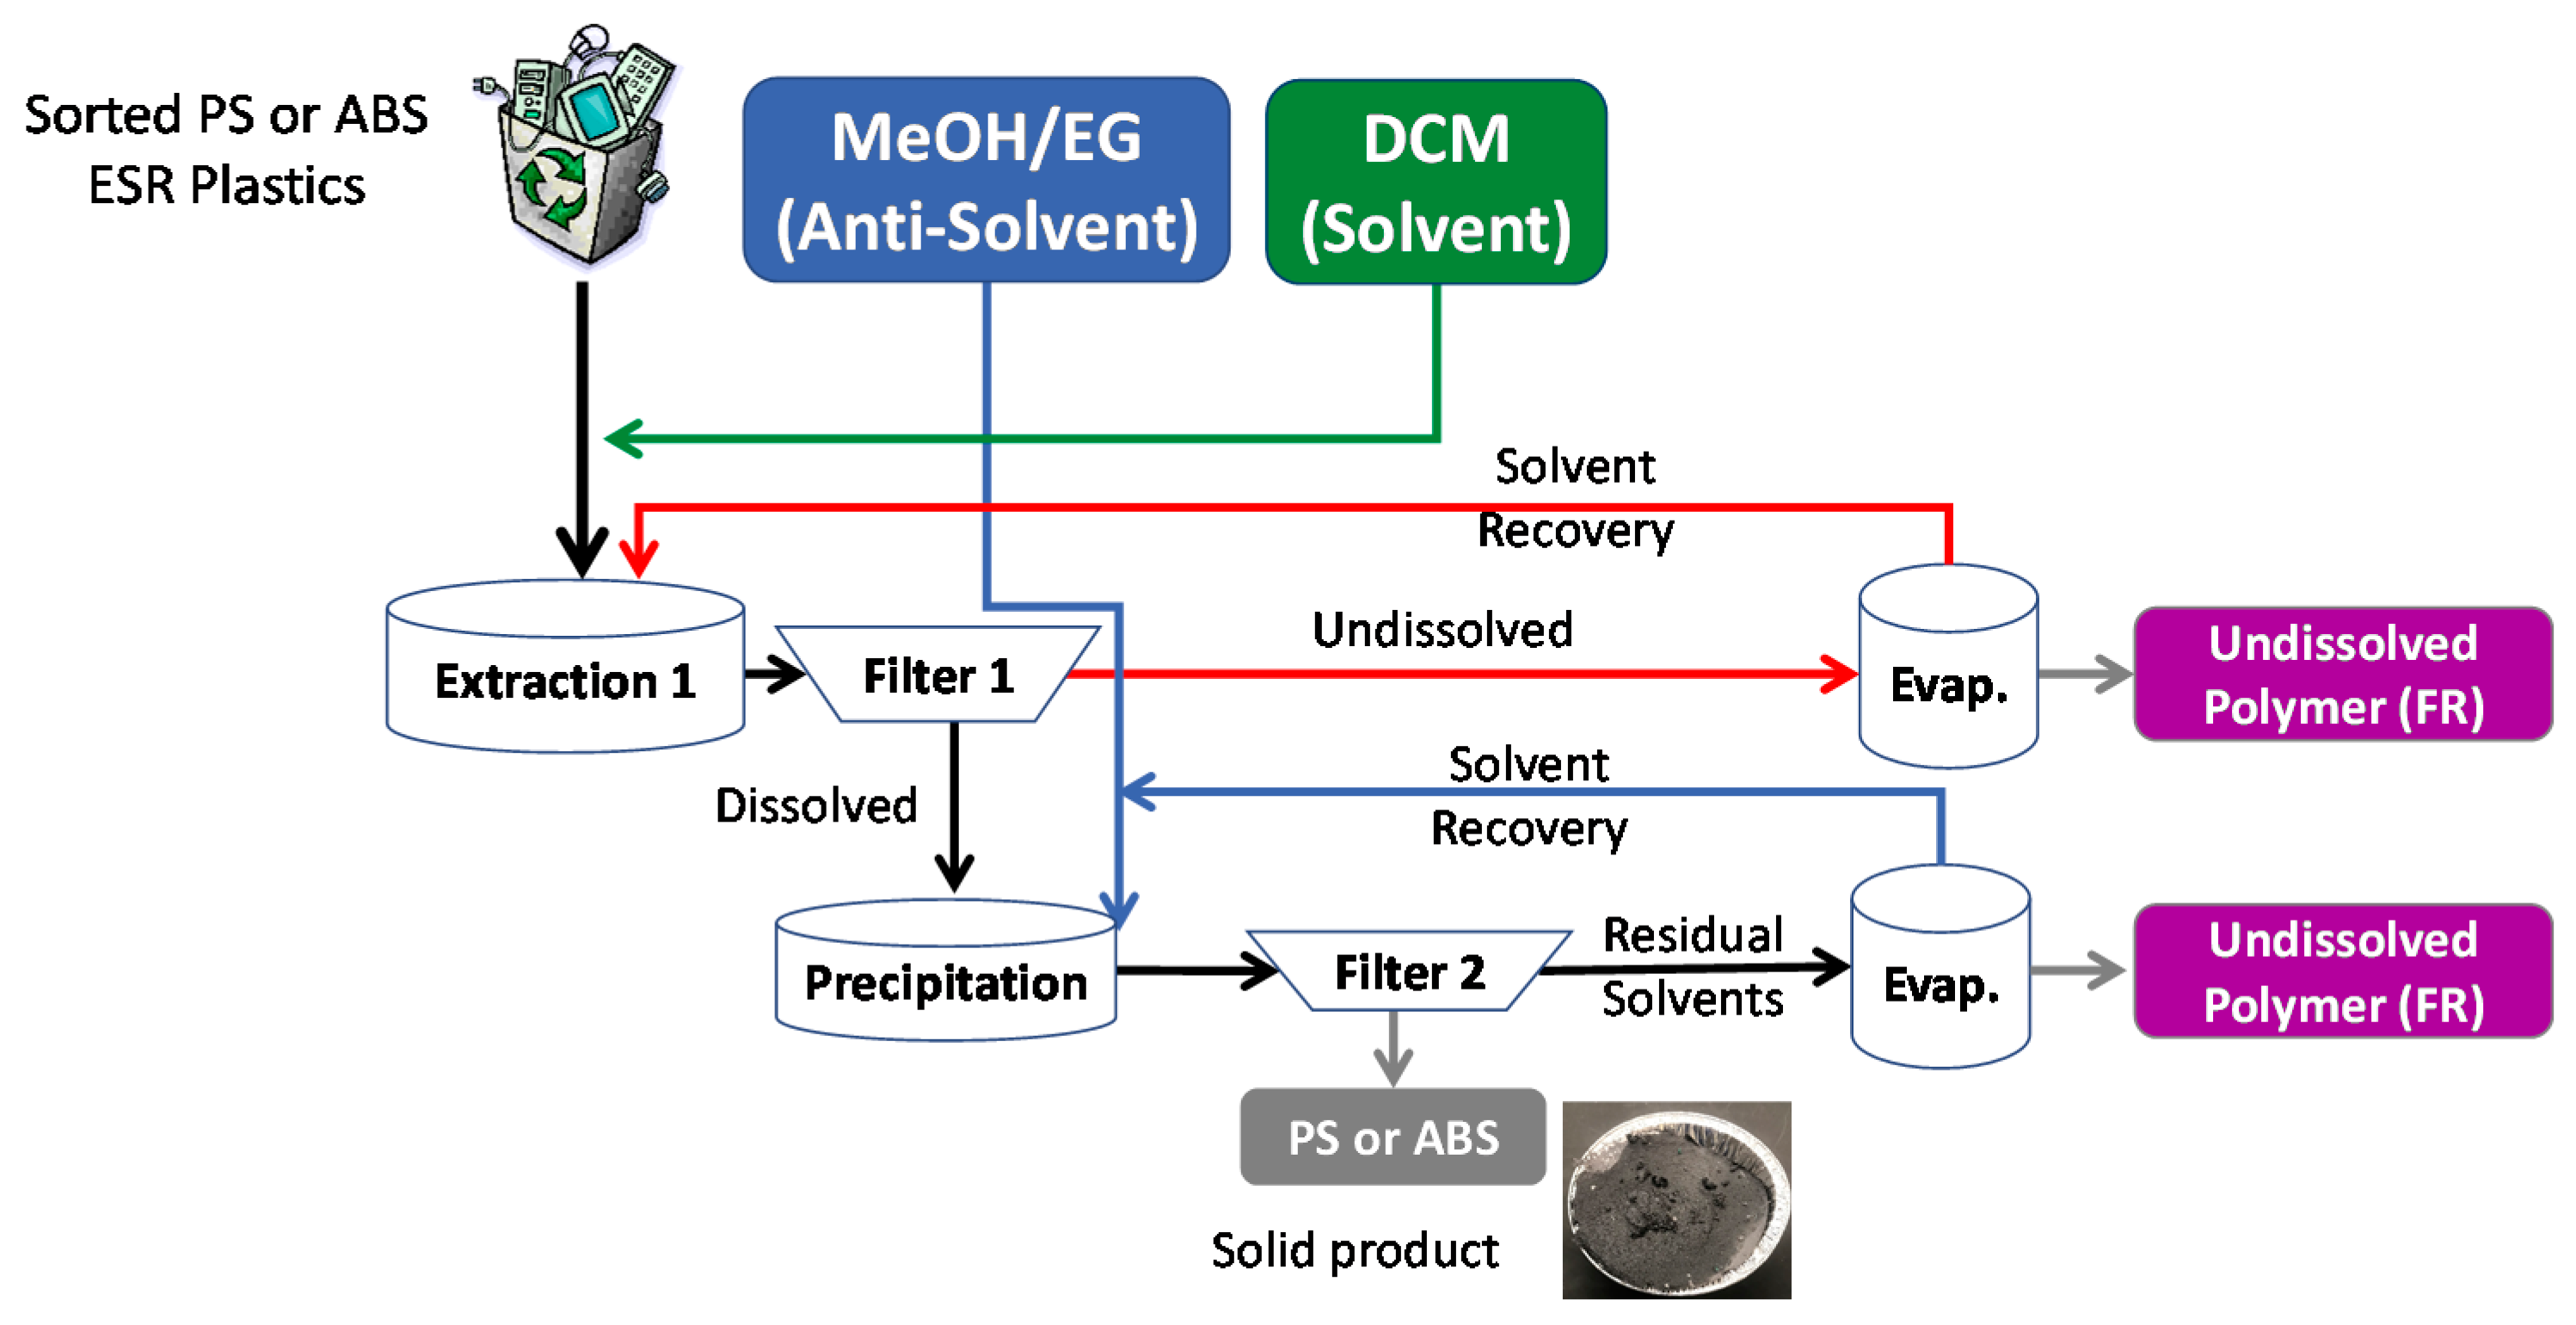
2.4. Dissolution-Precipitation of ESR

The solvent/anti-solvent pre-screening results were scaled up for dissolving the ESR feedstock. A ratio of 20 g ESR: 400 mL solvent: 200 mL anti-solvent was used. The four prescreened solvents (DCM, tetrahydrofuran (THF), toluene, and acetone) were used to dissolve ESR at dissolution times of 30 min and 2 h for the further down-selection of solvents capable of dissolving a high yield of ESR. Longer dissolution times of 6 and 48 h were then tested with the two most promising solvents (DCM and THF) with the goal of achieving >90 wt.% dissolution yield.
Considering productivity, a 6-h dissolution time was selected to evaluate the precipitation yield of the two down-selected anti-solvents (methanol and ethylene glycol). DCM was first used to dissolve the polymers for 6 h. Next, the two screened anti-solvents were used to precipitate the polymers for 1 h. Filtration was subsequently used to recover the precipitated polymers. To ensure that the solvents were mostly removed from the reclaimed polymers, the recovered samples were dried at ambient conditions under a chemical hood for one day. If the reclaimed polymers were still wet after drying, additional drying would continue for up to two days. If the samples were still not fully dried a conventional oven was used to accelerate the solvent removal. In the case that an oven was used, the reclaimed polymers were dried in a conventional oven at 50 °C for 1 h or until sufficiently dried. Then, characterizations (thermalgravimetric analysis (TGA) see more details in Section 2.5.3) were carried out to estimate any residual solvents in the reclaimed polymers. In addition, various amounts of anti-solvent (100, 150, and 200 mL) were also tested to determine if less anti-solvent could be used. All dissolution and precipitation tests were conducted at room temperature and repeated three times (n = 3).

2.5. Characterization

2.5.1. Fourier Transform Infrared Spectrometry

Fourier transform infrared spectrometry (FTIR, Nicolet iS50, Thermal Fisher Scientific, Waltham, MA, USA) was used to identify the major components of the ESR and determine any structural changes to the precipitated plastic recovered from solvent processing. More than 100 pieces of ESR plastic (around 124 g) were characterized using FTIR to understand their polymer composition.

2.5.2. Elemental Analysis

The brominated content of recovered plastics was determined using Schoniger Combustion. Recovered samples were weighed into ashless paper and inserted into a custom-made platinum stopper fitted in a separatory funnel charged with reagents. The resulting liquid was removed via washing with isopropyl alcohol and titrated using para-bromobenzoic acid as an indicator [35].
The phosphorus content was measured using spectrophotometry [36]. The contents were washed out and diluted, with the resulting mixture cooled and filtered. After treatment, the resulting unique golden-yellow colored complex was analyzed. The more phosphorus present in the complex, the greater intensity of the color. This determination of phosphorus followed Beer’s Law.

2.5.3. Thermogravimetric Analysis

Thermogravimetric analysis (TGA, TA Instruments, Discovery, New Castle, DE, USA) was carried out to evaluate the thermal properties of the plastic feedstock and recovered plastics. Samples (10–20 mg) were heated from 50 to 550 °C at a heating rate of 10 °C/min. A nitrogen flow rate of 60 mL/min was used to remove all gases evolved and prevent thermo-oxidative degradation. Weight loss of the samples over the duration of heating was recorded and analyzed.

2.5.4. Differential Scanning Calorimetry

Differential scanning calorimetry (DSC, TA Instruments, Discovery, New Castle, DE, USA) was carried out to analyze the thermal transition behavior of the feedstock and recovered polymers. For each test, about 5 mg of material was heated in an Aluminum hermetic pan from 50 to 300 °C before cooled back down to 50 °C at a ramp rate of 20 °C/min. The cycle was then repeated to erase the heating history of samples. Glass transition temperatures were determined from the thermogram obtained during the second heating cycle.

2.5.5. Thermal Desorption Gas Chromatography Mass Spectrometry

To understand the chemical structures of the flame retardants present, thermal desorption gas chromatography-mass spectrometry (GC-MS) analysis was carried out following protocols available in literature [17,37]. A 0.2 mg/mL polymer solution was prepared with ESR plastics and toluene at room temperature (RT). Toluene was used as an extraction solvent because most commercial FRs (especially brominated) dissolve well in toluene. Then, about 50 µL of the polymer solution was injected into a stainless cup and evaporated at RT prior to analysis. The sample was analyzed using a pyrolysis-GCMS system composed of a pyrolizer (PY-3030D, Frontier Laboratories Ltd., Fukushima, Japan), gas chromatograph (7890B, Agilent, Santa Clara, CA, USA), a mass selective detector (5977A, Agilent, Santa Clara, CA, USA), and auto-shot sampler (AS 1020E, Frontier Laboratories Ltd., Fukushima, Japan). Gas chromatography was performed with a metal capillary column (Ultra ALLOY-5, 0.25 mm i.d. × 30 m × 0.25 μm film thickness of immobilized-polydimethylsiloxane, Frontier Laboratories Ltd., Fukushima, Japan).
The thermal desorption (operated by the pyrolizer) and the GC oven were heated from 100 to 325 °C at a ramp rate of 40 °C/min and holding time of 2 min [37]. The interface temperature from the space between (1) the thermal desorption unit and the GC and (2) the MS and the column end, was set up at 300 and 280 °C, respectively. The ion source was kept at 230 °C. The injector split ratio used was 50:1. The helium carrier gas was kept at a constant flow rate of 1 mL/min. The mass spectrometer was used in positive electron impact (EI) mode with 69.9 eV ionization energy and a scan range of 30−800 m/z. The spectra of all chromatogram peaks were compared with electron impact mass spectrum libraries (F-Search and NIST17).

2.5.6. Gel Permeation Chromatography

Gel permeation chromatographic (GPC) analysis was performed with a Waters Alliance 2695 HPLC system equipped with PDA detector and refractive index detector. Waters Styragel HR columns were used for molecular weight determination of up to 600 kDa. The system used 100% tetrahydrofuran (THF) as the mobile phase at a flow rate of 0.9 mL/min. Each sample was dissolved in 100% THF for a few hours before being filtered through a 0.45-micron nylon or PTFE filter and analyzed at an injection rate of 10 to 20 mg/mL. Polystyrene standards from molecular weight of 500 Da to 400 kDa were used to create the calibration curve.

3. Results

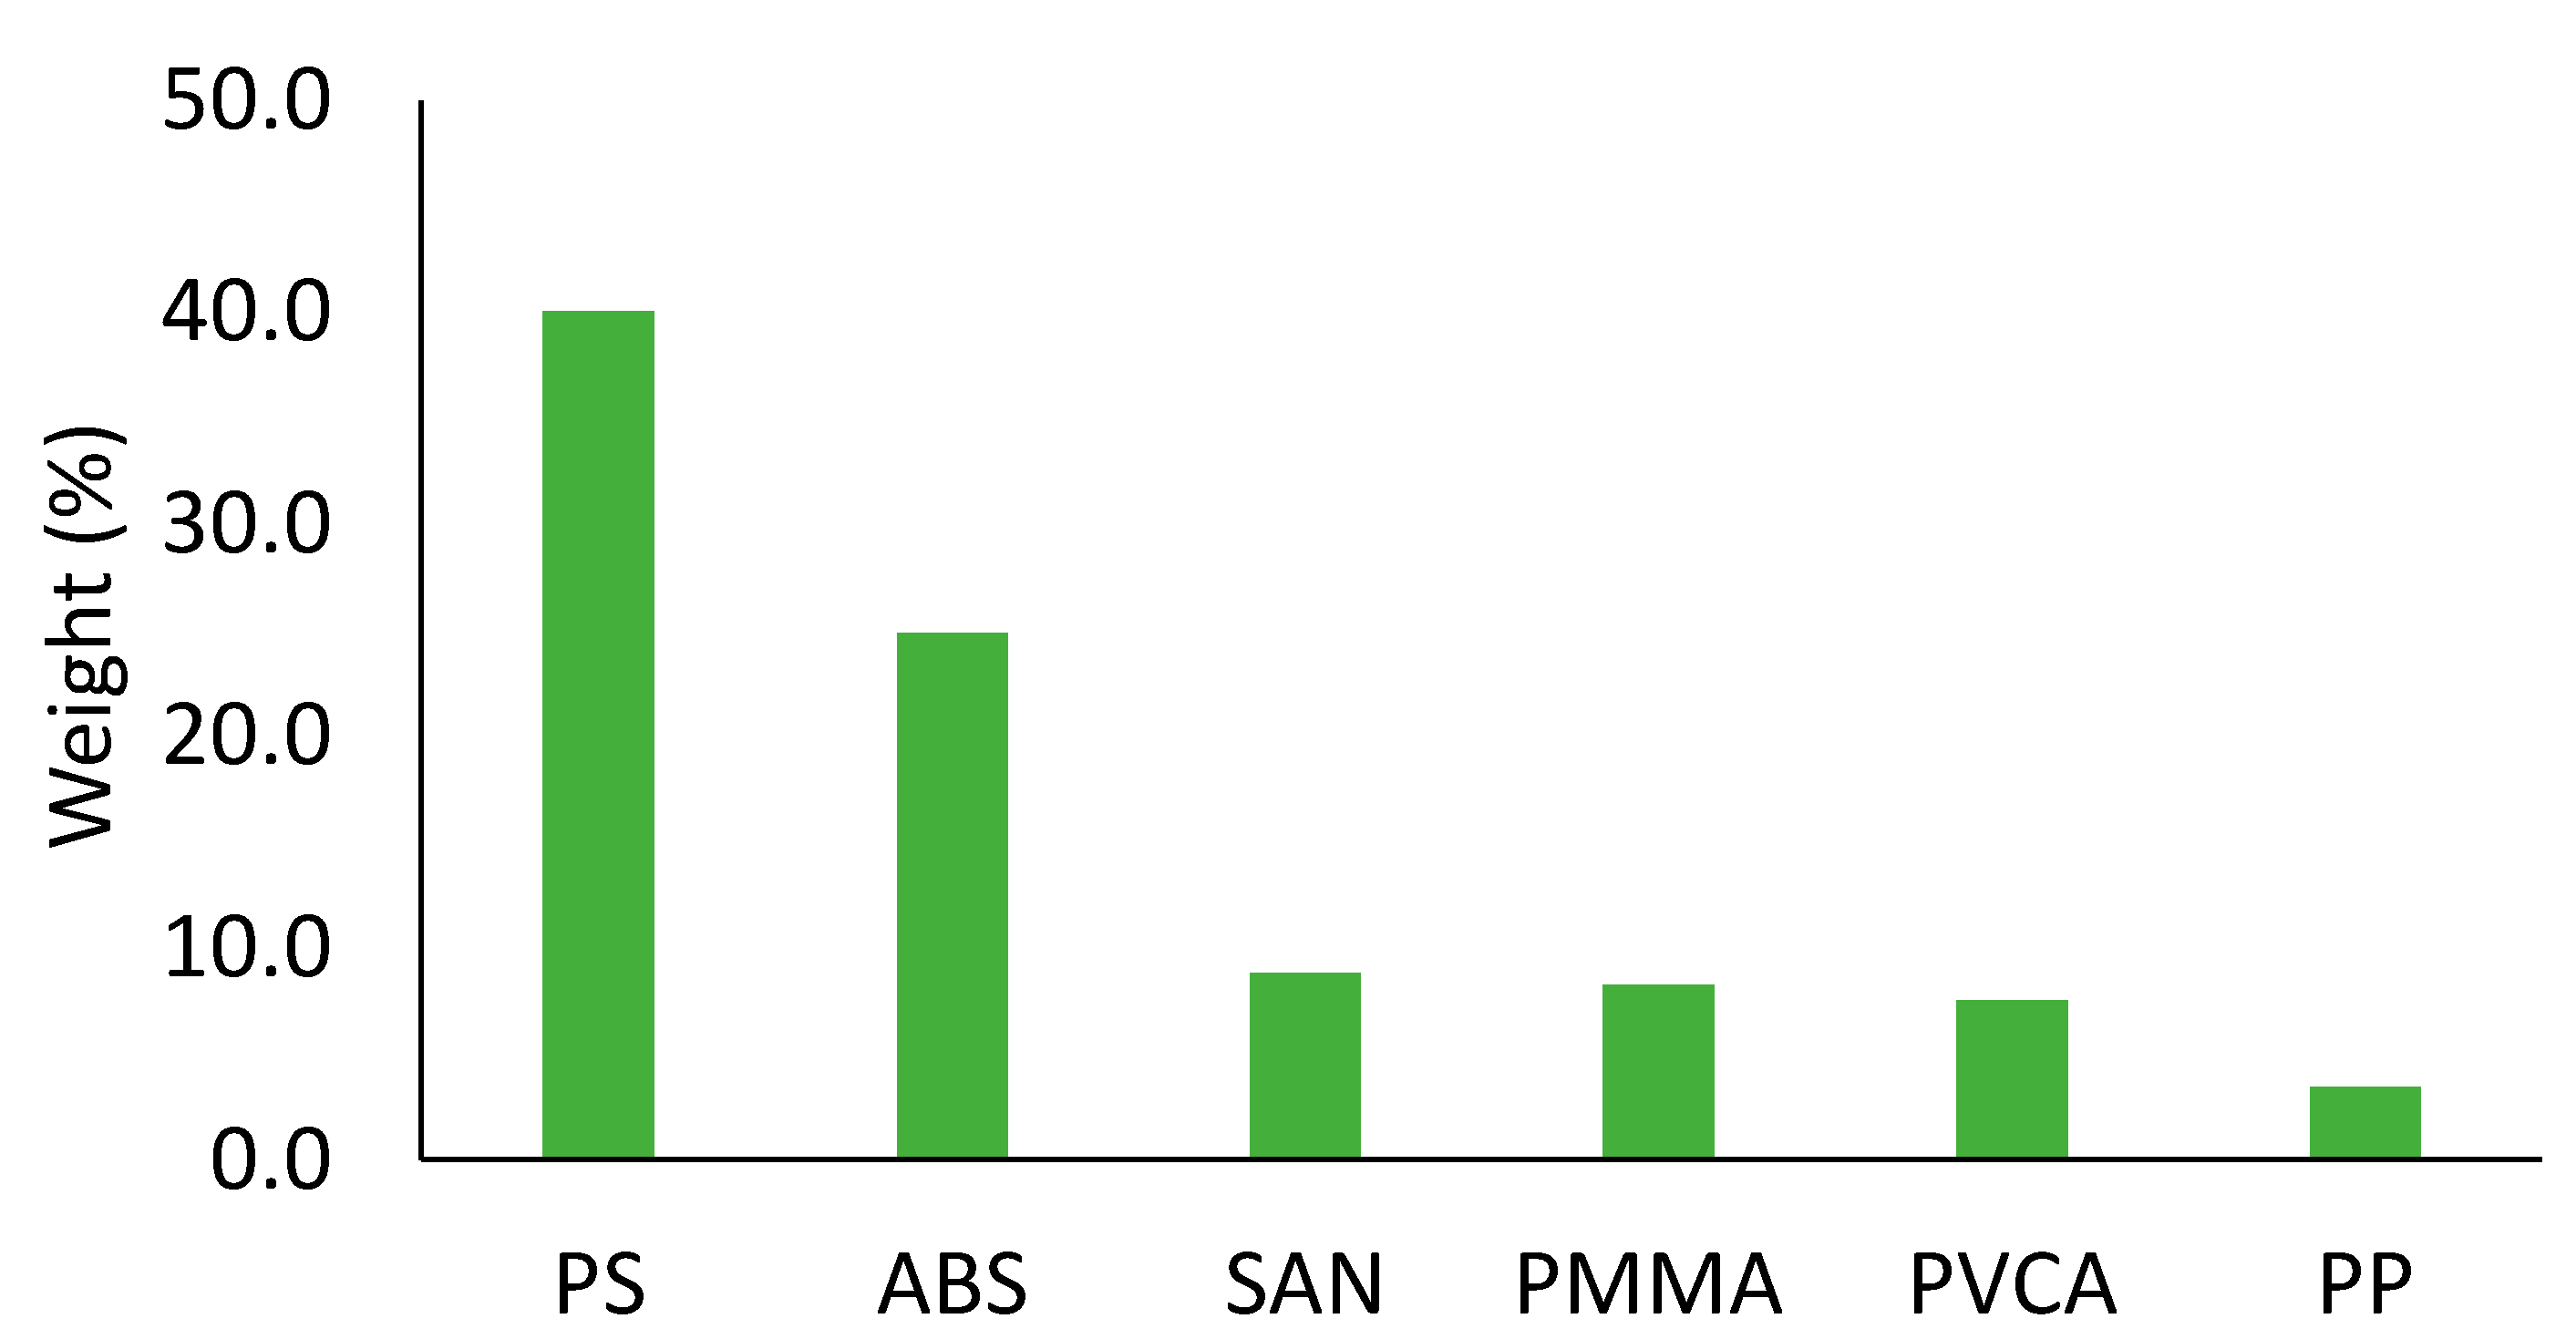
3.1. Composition of ESR Feedstock

The feedstock was hand sorted into the following categories: plastics, printed circuit boards, metals, wires, rubbers, metals, and capacitors (Figure S1 in Supplementary Data). As Figure S1 shows, the ESR was found to be highly heterogenous, composed of approximately 25% plastics, 27% printed circuit boards, 23% wires, and 18% metals. This indicates that ESR feedstock contains components from a variety of consumer electronics including TV sets, printers, computers, and CD players. Results from this study are similar to those reported in literature [25,38].
For the actual chemical recycling process (i.e., dissolution and precipitation documented in Section 3.2 Solvent Screening Process) in this study, only the hand-picked polymer fraction of the obtained ESR (i.e., presorted by E-waste recycler) was used. In other words, this study only focused on evaluating the polymeric fractions present in ESR. As a consequence, the polymeric composition of ESR was determined (Figure 2). Notably, 124 g of ESR feedstock (more than 100 pieces of ESR plastic) were characterized using FTIR to provide representative data, given that ESR is highly heterogenous. As shown in Figure 2, PS-based plastics (including HIPS and PS) and ABS were the most abundant plastic types found in ESR. Similar results were also reported in (Shen et al., 2016). Thus, PS and ABS were selected for the solvent screening testing.
Figure S2 (in Supplementary Data) compares the Bromine (Br) and Phosphorus (P) contents in the targeted feedstocks (PS, ABS, and ESR), both of which are associated with flame retardants within the samples. The phosphorus content presented in Figure S2 translates into a 6–12 wt.% phosphorus-based flame retardant (PFR) content within the feedstock (assuming PFR was triphenyl phosphate, identified by py-GCMS, see Figure S3 in the Supplementary Data), while the brominated content suggests a 1–6 wt.% brominated flame retardant (BFR) content within the feedstock (assuming BFR was poly(2,6-dibromophenol oxide), identified by py-GCMS, see Figures S3 and S4 in the Supplementary Data). This is within levels reported in literature [18]. Typically, 10–20 wt.% of flame retardants are added to plastics or fibers [18].

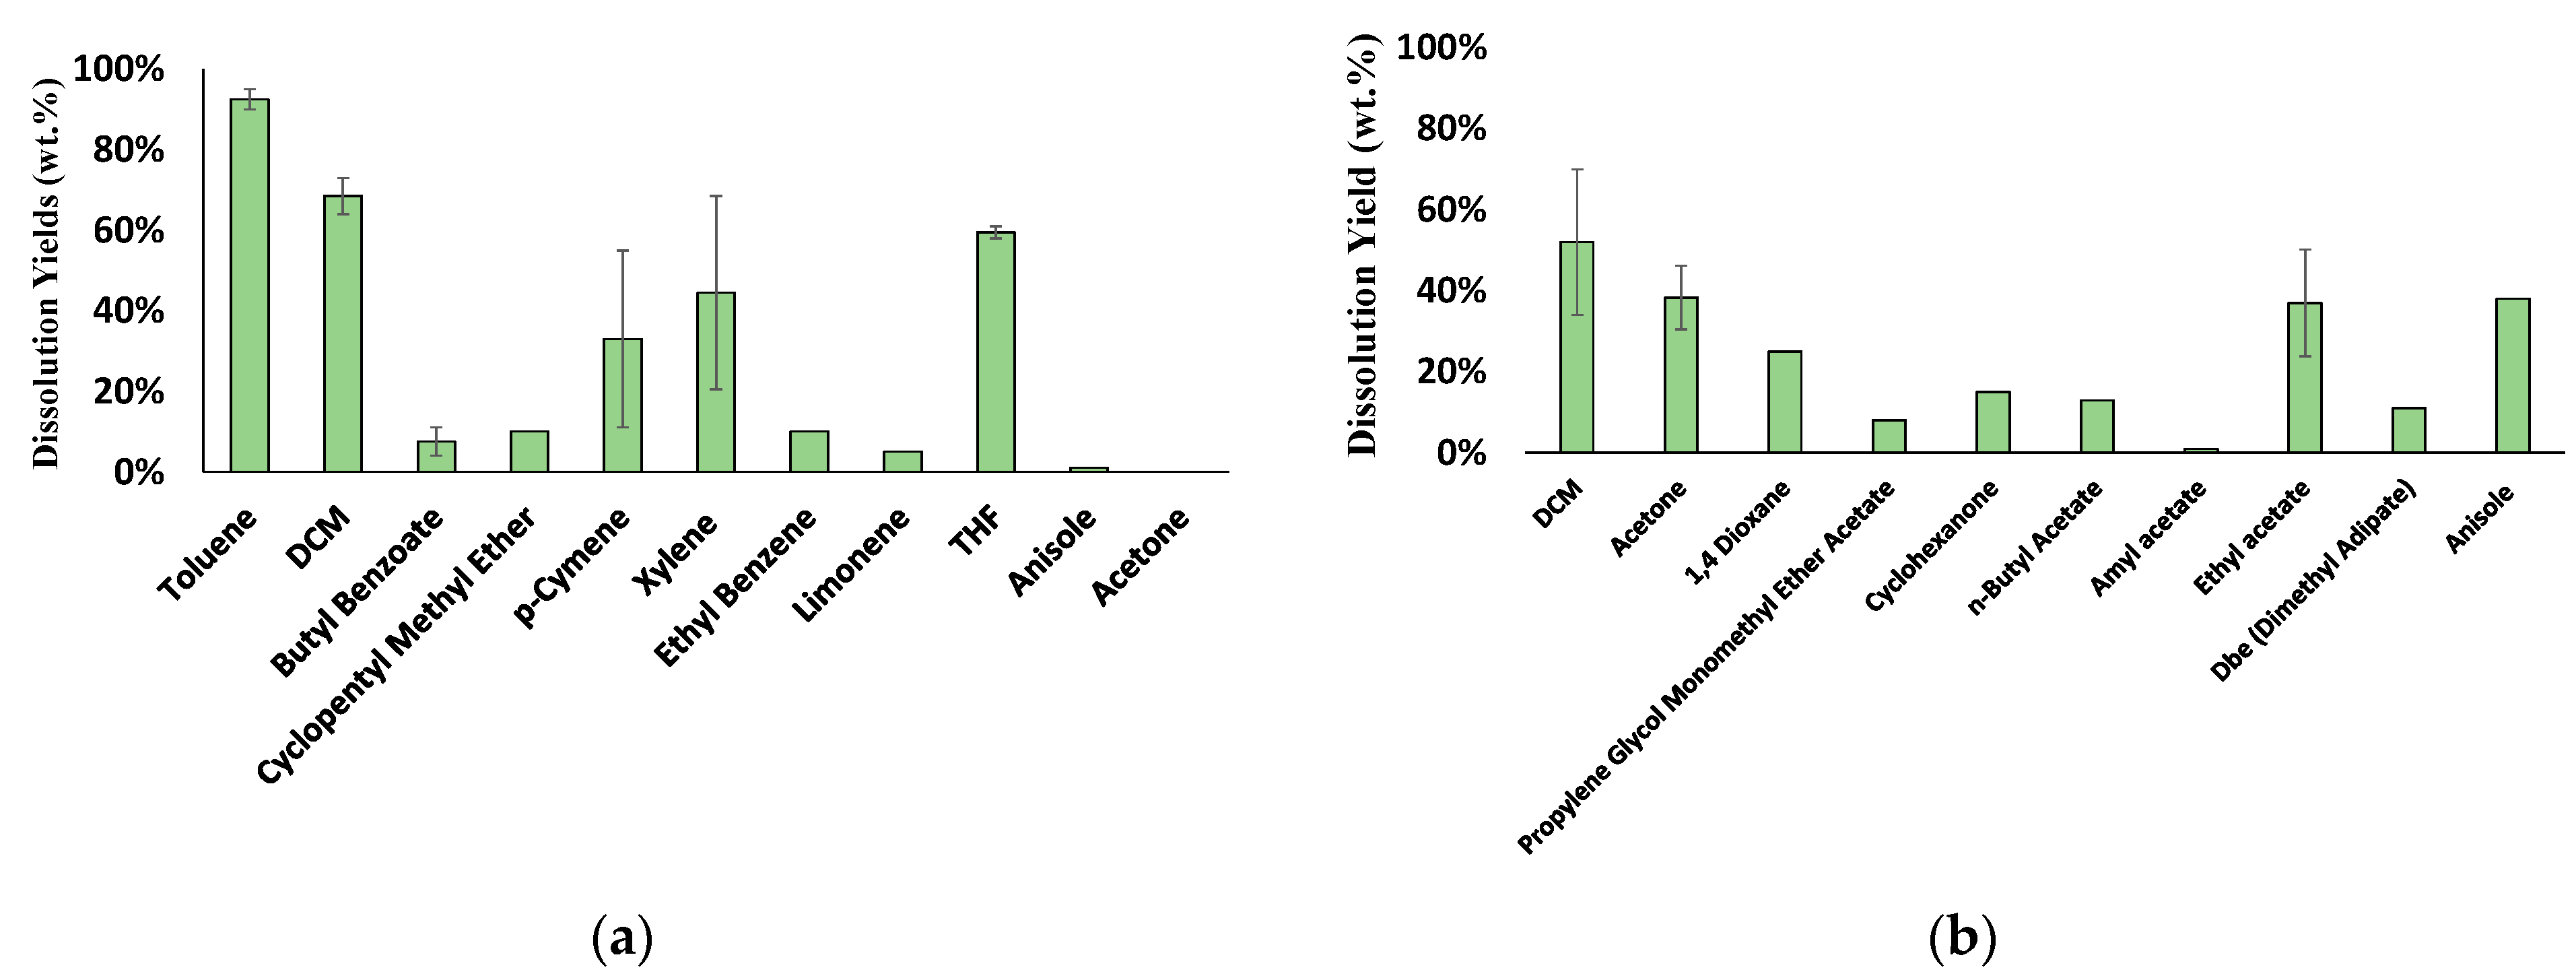
3.2. Solvent Screening Process

3.2.1. Solvent Screening for PS and ABS

Potential solvents that could theoretically dissolve PS and ABS were identified based on their HSP. Solvents that have a RED < 1 or have shown promising results in dissolving PS or ABS were tested [33]. Tables S1 and S2 (in Supplementary Data) list the solvents used in the experiment along with their known HSP values. Notably, some solvents were not tested due to their toxicity, availability, or high cost. A total of 20 solvents (10 for PS and 10 for ABS) were screened. More details are also available in the Supplementary Data (Section 3 Dissolution of Polymers in Solvents).
Using the solvents selected by HSP theory, the solubility of PS and ABS found in ESR was identified via dissolution testing. As Figure 3 shows, toluene, DCM, and THF showed the best potential to dissolve PS. Their average dissolution yields were 90%, 69%, and 60%, respectively (Figure 3a). DCM, acetone, and ethyl acetate showed the best potential to dissolve ABS. Their average dissolution yields were 52%, 38%, and 37%, respectively (Figure 3b). Based on the screening results from dissolving PS and ABS plastics sampled from ESR, toluene, DCM, THF, and acetone were further tested with ESR samples.
Not all solvents predicted by HSP theory worked consistently. This is probably because the solubility parameters available for PS and ABS in Hansen’s handbook are based off of a specific grade of PS or ABS not reflective of the grades being tested [32]. Moreover, PS and ABS present in ESR waste may contain different combinations of additives or contaminants, which may also affect their solubilities in solvents. Thus, HSP is not optimized well to predict the solubility of ESR plastics. To pursue a more accurate prediction of solubility parameters, quantifying the solubility of PS and ABS present in ESR waste is suggested. For instance, Lu et al. (2021) used this method to accurately measure the solubility of a new acrylic coating and enabled a scientific formulation of safer solvents for re-manufacturing electronics [28].

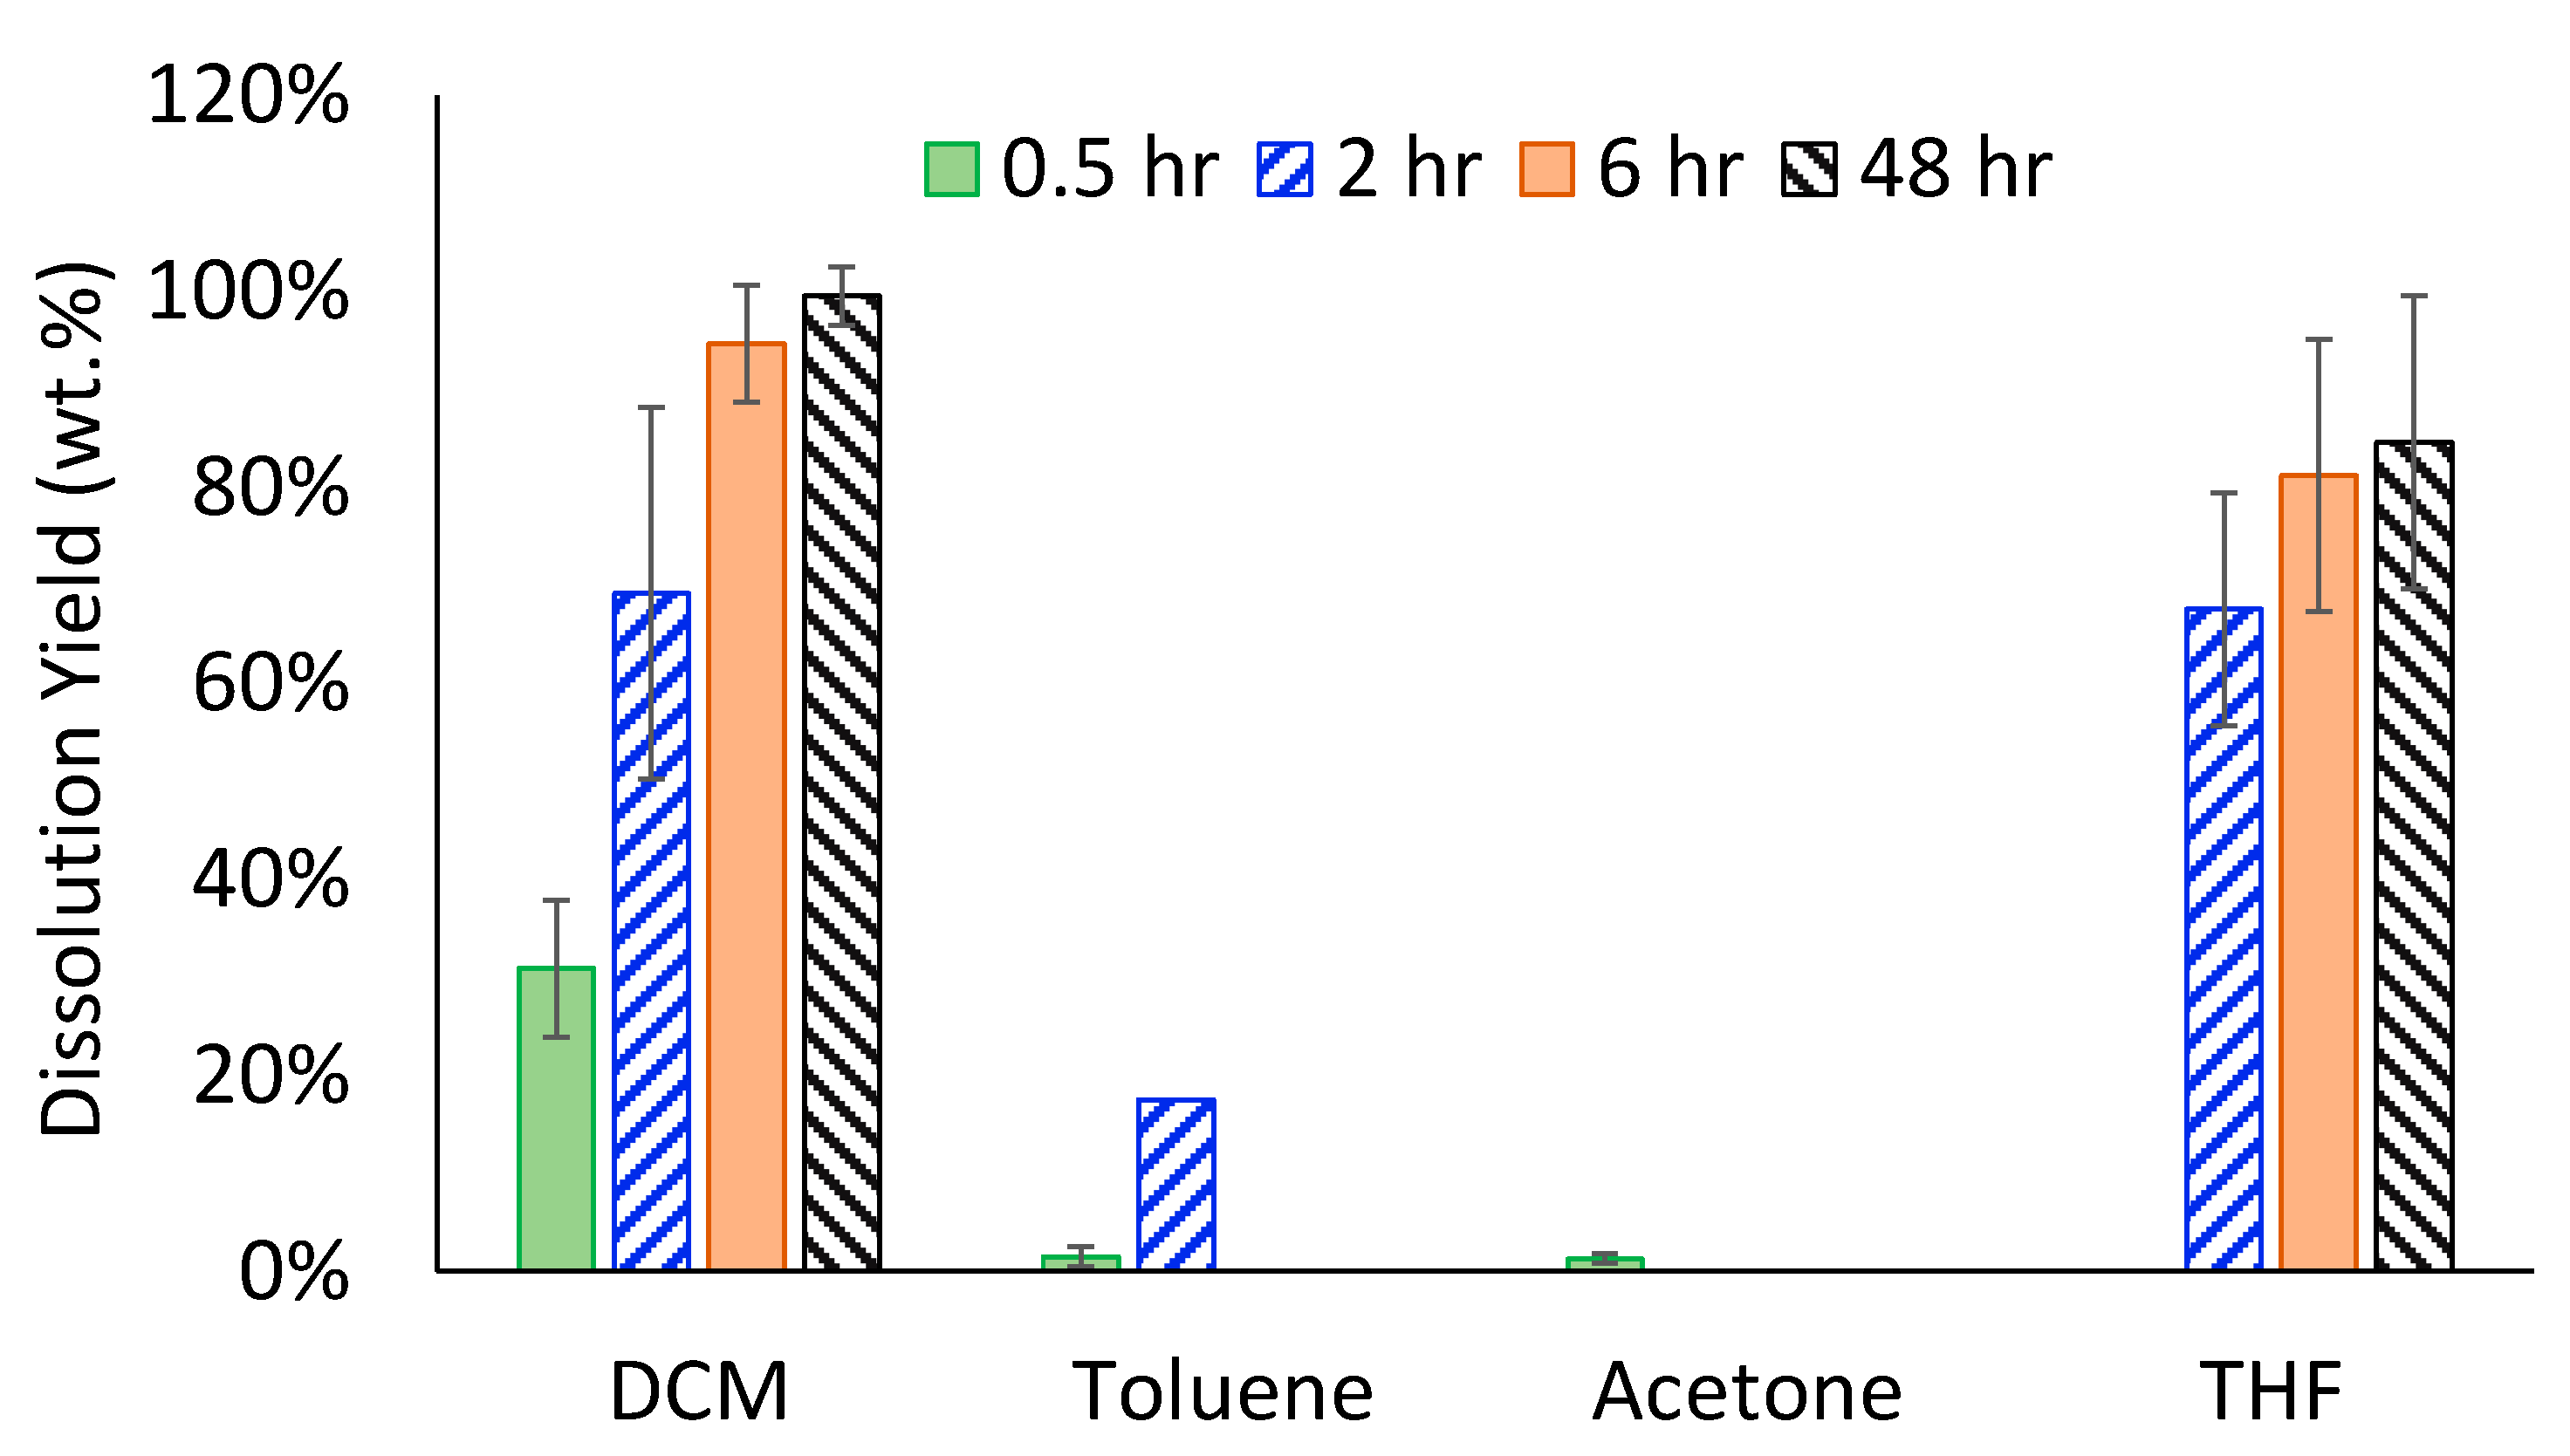
3.2.2. Optimizing Solvents for Dissolving ESR Waste

Four single solvents selected from solvent screening testing (see details in Section 3.2.1) were used to dissolve plastic mixtures sampled from ESR waste at ambient conditions (Figure 4). As Figure 4 shows, DCM and THF were able to dissolve a significantly greater amount of plastic material than toluene and acetone within 2 h. The heterogeneity of the ESR feedstock may explain the difference in dissolution power between the solvents. Many other types of plastic, such as PC, PMMA, and PVCA, were also present in the feedstock. However, the solvents tested were selected based on their dissolution abilities for PS and ABS specifically. Thus, the variability in dissolution between the solvents may be impacted by the ability of the solvents to dissolve plastic types not targeted.
To achieve higher dissolution yields, longer dissolution times (6 and 48 h) were also evaluated. As dissolution time was increased from 0.5 to 48 h, the dissolution yield increased from 31 to 99 wt.% with the use of DCM. However, Figure 4 also shows that extending the dissolution time from 6 to 48 h did not the improve dissolution yield significantly when using either DCM or THF. These results indicated that dissolving ESR plastic with DCM for 6 h would produce an optimum dissolution process.
It is important to understand that the dissolution of polymers is much more complex than that of other small chemicals. Polymer morphology often consists of long and tangled chains. To disentangle the polymer chains (i.e., dissolution), solvents are used. However, they typically have a hard time initially disentangling these bonds to start the dissolution process. As dissolution continues, the volume of the polymer expands due to sorption of the solvent into the plastic. This phenomenon is known as swelling, and it indicates that the polymer is close to being dissolved. As the polymer continues to sorb more solvents, the polymer chains untangle, allowing them to become surrounded by solvent and finally dissolve. (Figure S5 in Supplementary Data) [39,40,41,42].
For amorphous polymers (such as PS, ABS, and PC found in this study), actual dissolution occurs in two stages [39,40]. In the first stage, the induction period, swelling occurs. During this period, the rate of dissolution increases as the solvent penetrates the polymer structure. Once swollen, the second stage, or the steady state period, takes place. This is when the polymer dissolves into the solvent at a constant dissolution rate over a fixed time period [39,40]. This also explains why increasing dissolution time from 6 to 48 h did not greatly improve the dissolution yield.
Based on the dissolution yield obtained in Figure 4, DCM was selected for further tests. However, it is important to mention that both DCM and THF identified in Figure 4 are hazardous solvents and are highly regulated substances. For example, the use of DCM in new residential painting applications was recently banned by the U.S. EPA in 2019 [28]. To address this concern, relevant studies have been done in the past. For example, a safer solvent, N-methyl-2-pyrrolidone, has been used to recover 96% polycarbonate and 99% polyamide in mobile phone waste [17]. Anisole has also been identified as a green replacement to chlorobenzene, which is commonly used for printed electronics [43]. However, no safer solvents have been formulated for dissolving-precipitating the plastic fraction in real E-waste. Designing safer solvents to replace DCM would be critical for future research.

3.2.3. Solvent Screening Results for the Anti-Solvents

Anti-solvents capable of precipitating plastics from the polymer solution (i.e., the anti-solvents that have larger RED and are miscible with the selected solvent) were screened based on their theoretical solvent distance to the center of the Hansen solubility sphere of PS and ABS (Tables S3 and S4 in Supplementary Data). More details are also available in the Supplementary Data (Section 4 Screening of Anti-Solvents for Precipitating Polymers).
Methanol, propanol, and ethylene glycol (EG) were tested as anti-solvents to precipitate hand-sorted PS and ABS plastics for 30 min (Figure 5). Although water has the furthest theoretical solvent distance to the center of the Hansen solubility sphere of PS and ABS, water is not miscible with DCM and thus was not tested. DCM, which can dissolve the highest amount of ESR plastics (see Figure 4), was used to dissolve PS and ABS plastics for 2 h before precipitation (note: a 2-h dissolution was selected to ensure a decent dissolution yield within a relative short dissolution time). As Figure 5 shows, methanol resulted in the highest yield of precipitated PS, while EG recovered the most ABS. Thus, methanol and EG were selected to precipitate the ESR dissolution.
However, the use of EG could be an issue in future scale-up. EG is likely hard to be separated from the precipitated plastics due to its high viscosity. The boiling point of EG (197 °C) is much higher than that of MeOH (65 °C). In addition, the latent heat of vaporization (ΔHv) of EG (50.5 kJ mol−1) is also higher than that of MeOH (37.4 kJ mol−1). Further, the rate of evaporation rate for EG is low, probably due to the high viscosity of the chemical. In other words, removing EG from polymers would be challenging. As such, the authors note that EG was used as a comparison to the performance of MeOH in this study.

3.2.4. Optimization Results for Precipitating ESR Using Anti-Solvents

Based on the screening results from Section 3.2.2 and Section 3.2.3, DCM was used to dissolve ESR plastics for 6 h, while MeOH was used to precipitate the polymer for 1 h. Both MeOH and EG were able to achieve a precipitation yield of about 70 wt.%. It is important to note some of the polymer material was lost during filtration (e.g., stuck on the filtration apparatus). Other separation methods such as centrifugation is suggested to be explored in the future to improve polymer recovery. Alternatively, removing the solvents/anti-solvents by distillation may also improve the precipitation yield [17].
The precipitants recovered using MeOH and EG presented different morphologies. The precipitant recovered with MeOH was flaky and much easier to filter as compared to that recovered by EG. This could be due to the fact that MeOH has a lower viscosity than EG. By contrast, the precipitant reclaimed by EG was filmlike. Thus, MeOH was selected for further testing due to ease of separation and lower cost. In addition, the effect of the volume fraction of anti-solvents on precipitation yield was also investigated (Figure S6 in Supplementary Data). ESR plastics were first dissolved in DCM for 6 h then precipitated with 100–200 mL of MeOH, corresponding to a solvent to anti-solvent volumetric ratio of 2–4. It was found that halving the amount of anti-solvent significantly decreased the precipitation yield of ESR plastics by four times (the precipitation yield reduced from 52 to 13 wt.%), making the amount of anti-solvent a limiting factor towards recovering ESR plastics. This indicates that a specific amount of anti-solvent is needed for an effective polymer precipitation. The amount required depends on the strength of the anti-solvent being used, with stronger anti-solvents requiring less volume for high precipitation yields. Theoretically, a stronger anti-solvent can be designed using HSP theory. However, the miscibility between anti-solvents and solvents would also have to be taken into consideration as it limits the use of a single solvent as an anti-solvent. For instance, water could have been a stronger anti-solvent, but was not miscible with DCM.

3.3. Charactarization of Recycled Products

3.3.1. Molecular Weight Analysis

The molecular weight distribution of PS, ABS, and ESR waste before and after dissolution-precipitation was analyzed by gel permeation chromatography (GPC). A similar molecular weight distribution to virgin feedstocks was found for PS, ABS, and ESR recovered by the dissolution-precipitation process (Figure S7 in Supplementary Data). This shows that the solvent-based recycling can reserve the bulk molecular weight of the recovered material, particularly for the relatively high molecular weight fraction. A similar trend has also been reported when using organic solvents (DCM, acetone, or N-methyl-2-pyrrolidone) to extract polycarbonate from electronic housing waste [17,25].

3.3.2. Polymeric Composition Analysis by FTIR

Fourier-transform infrared spectroscopy (FTIR) was used to analyze the PS and ABS before and after the chemical recycling process as well as the ESR waste after recovery (Figures S8–S12 in Supplementary Data). Similar spectra were observed between virgin feedstock of PS and ABS that recovered by the dissolution-precipitation process. The spectra for ESR recovered using EG showed the presence of the OH functional group in the scanned polymer in the form of a wide peak at around 3300 cm−1 (Figure S12 in Supplementary Data). This indicated that EG from the precipitation process was trapped within the recovered material. The presence of EG suggests that it would not be an ideal anti-solvent as the viscous nature of EG makes it difficult to recover, thus leaving behind substantial amounts of solvent residue.

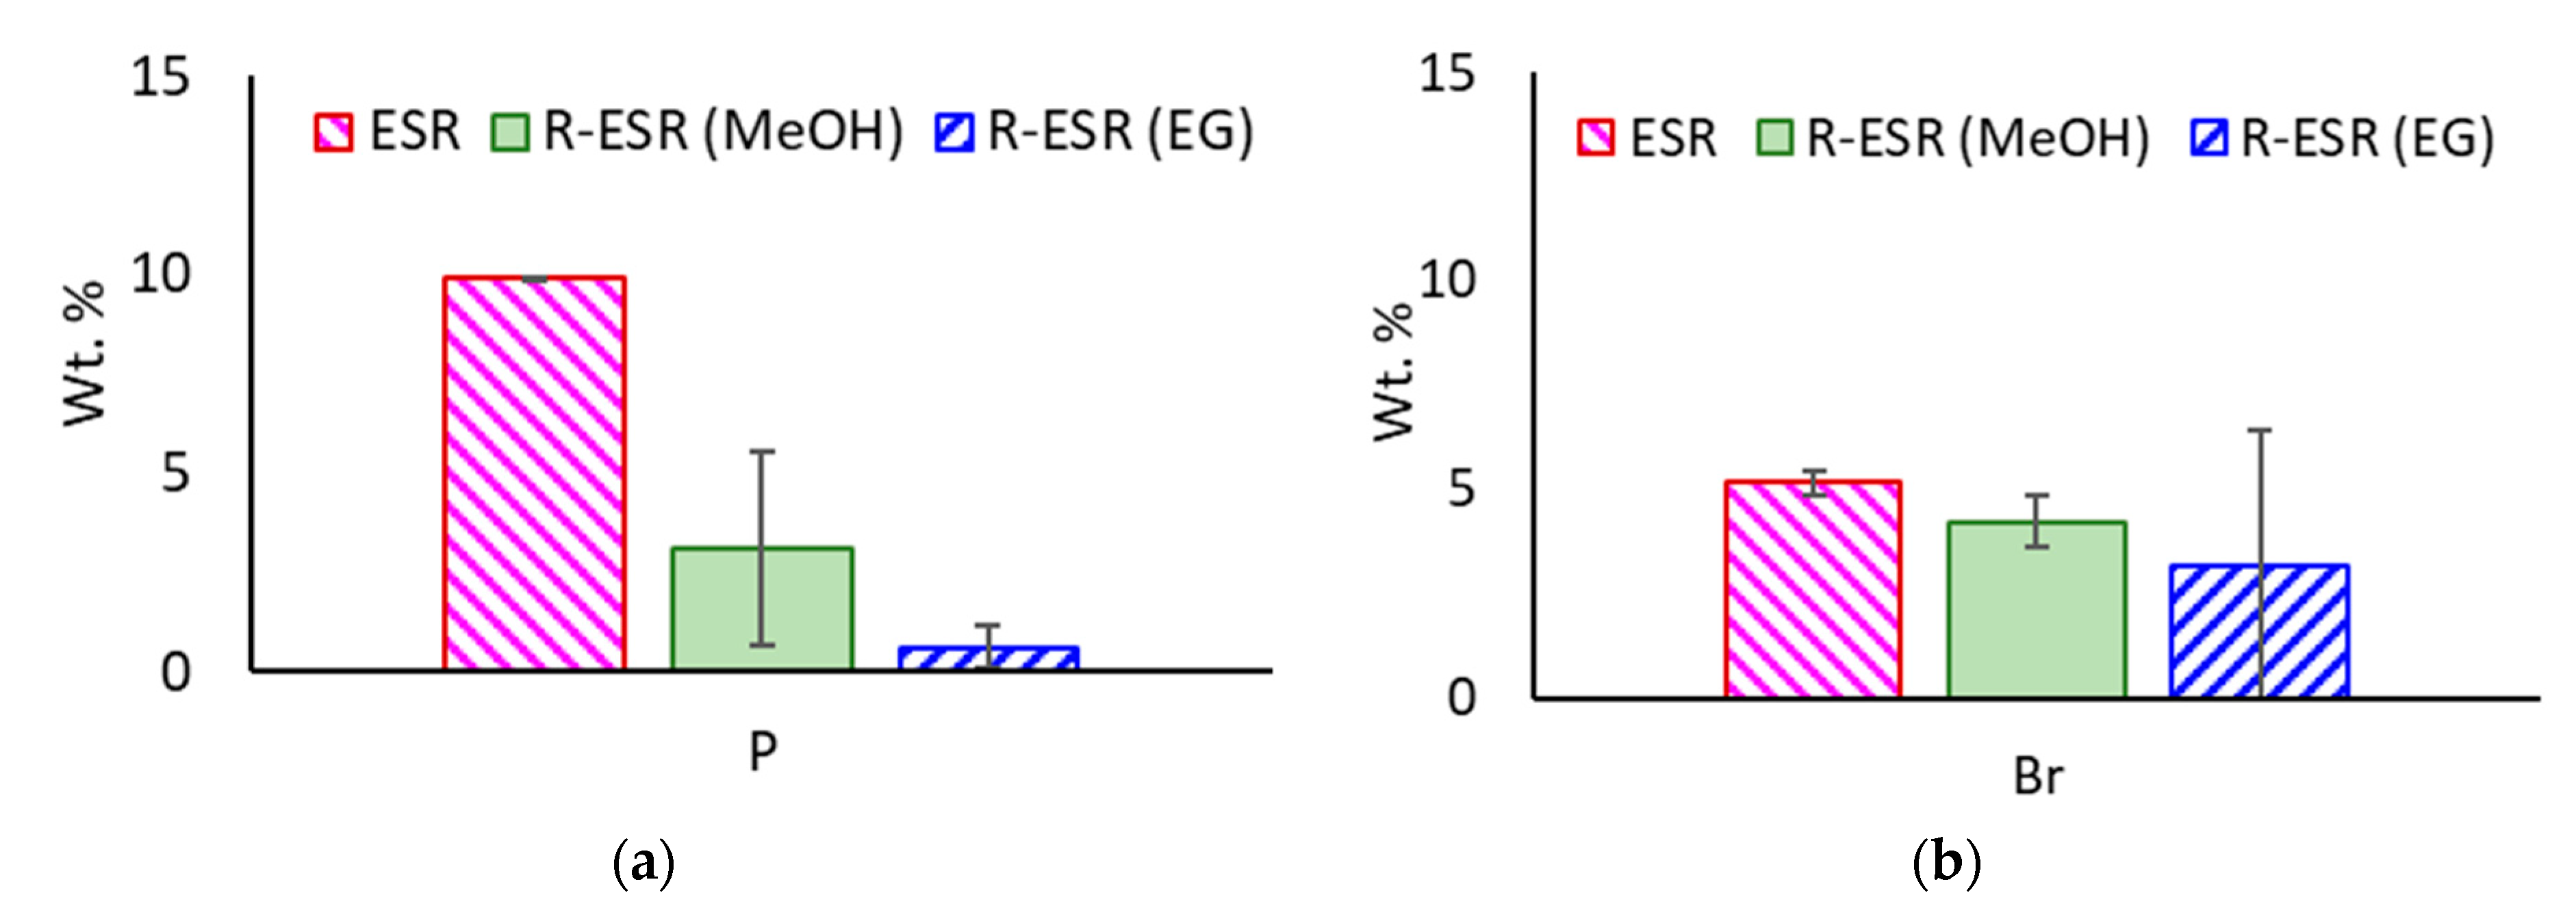
3.3.3. Halogen Content

To investigate if the anti-solvents were capable of separating polymers while leaving FRs in solution, the halogen content in the recycled products were analyzed. Figure 6 compares the bromine (Br) and phosphorus (P) contents in the plastic fraction of ESR and the reclaimed plastics (R-ESR) when using DCM as the solvent and MeOH or EG as the anti-solvent. As Figure 6 shows, the removal efficiency of P was significant—70% and 94% of PFR was removed when using MeOH or EG as the anti-solvent, respectively. This suggests that phosphorus-based flame retardants (PFRs) are relatively polar and are likely to dissolve in polar solvents like MeOH and EG [44,45]. Since the use of certain types of flame retardants are restricted in new plastic products, the proposed solvent-based recycling serves as a promising approach to remove PFRs. To further formulate effective solvents for removing PFRs, the solubility parameters of targeted PFRs are recommended to be measured in the future.
The removal efficiency of Br was ineffective by using the solvent-based recycling. This could indicate brominated flame retardants (BFRs) may have low solubility in the anti-solvents (MeOH and EG) used [46]. Additional purification steps using other solvents such as toluene to remove BFRs are suggested for future research [37].

3.3.4. Thermal Gravimetric Analysis

Thermal Gravimetric Analysis (TGA) was carried to identify the presence of any residual solvents in the reclaimed ESR products (Table S5 in Supplementary Data). The TGA results shows that the majority of the ESR feedstock and the reclaimed ESR degrades in the range of 340–550 °C, indicating that the thermal stability of the plastics was not changed by the solvent-based recycling process. In addition, TGA also shows that about 20% of EG was still trapped with the recovered ESR plastics. This suggests that using EG as an anti-solvent would make the separation and recovery of solvents difficult, despite its ability to remove more PFRs.

3.3.5. Differential Scanning Calorimetry

Differential Scanning Calorimetry (DSC) was conducted to evaluate the purity of the recovered ESR samples (Table S6 in Supplementary Data). The results from the second heating cycle of the feedstock and reclaimed ESR were evaluated and compared to those in literature. Multiple glass transition temperatures (116, 151, and 240 °C) were identified in the precipitated ESR by using MeOH as an anti-solvent, indicating that the precipitated products from ESR contained a mixture of individual polymers as well as polymer blends. This could be a result of DCM being a very strong solvent that can simultaneously dissolve PS, PS, ABS, SAN, or lower molecular weight fractions of other polymers present in ESR [22,25,33]. Although DCM can achieve a high dissolution yield, the purity of recycled products is sacrificed as a tradeoff. More research for designing selective solvents that only dissolve PS or ABS is therefore recommended.

3.3.6. Implications and Improvement for Future E-Waste Recycling

Based on the characterization results above, additional pre-sorting before the solvent-based recycling is highly recommended. For example, a mechanical sorting process such as float/sink density separation could be integrated with the solvent-based recycling process. Float/sink separation is capable of separating E-waste plastics into less heterogeneous polymer waste groups based on the density differences between different polymer types. These individual groups are then able to be processed using the solvent recycling process optimized for each polymeric group. Using these less heterogeneous material streams for solvent processing will improve the quality of the recycled products recovered, making them more valuable in the marketplace.

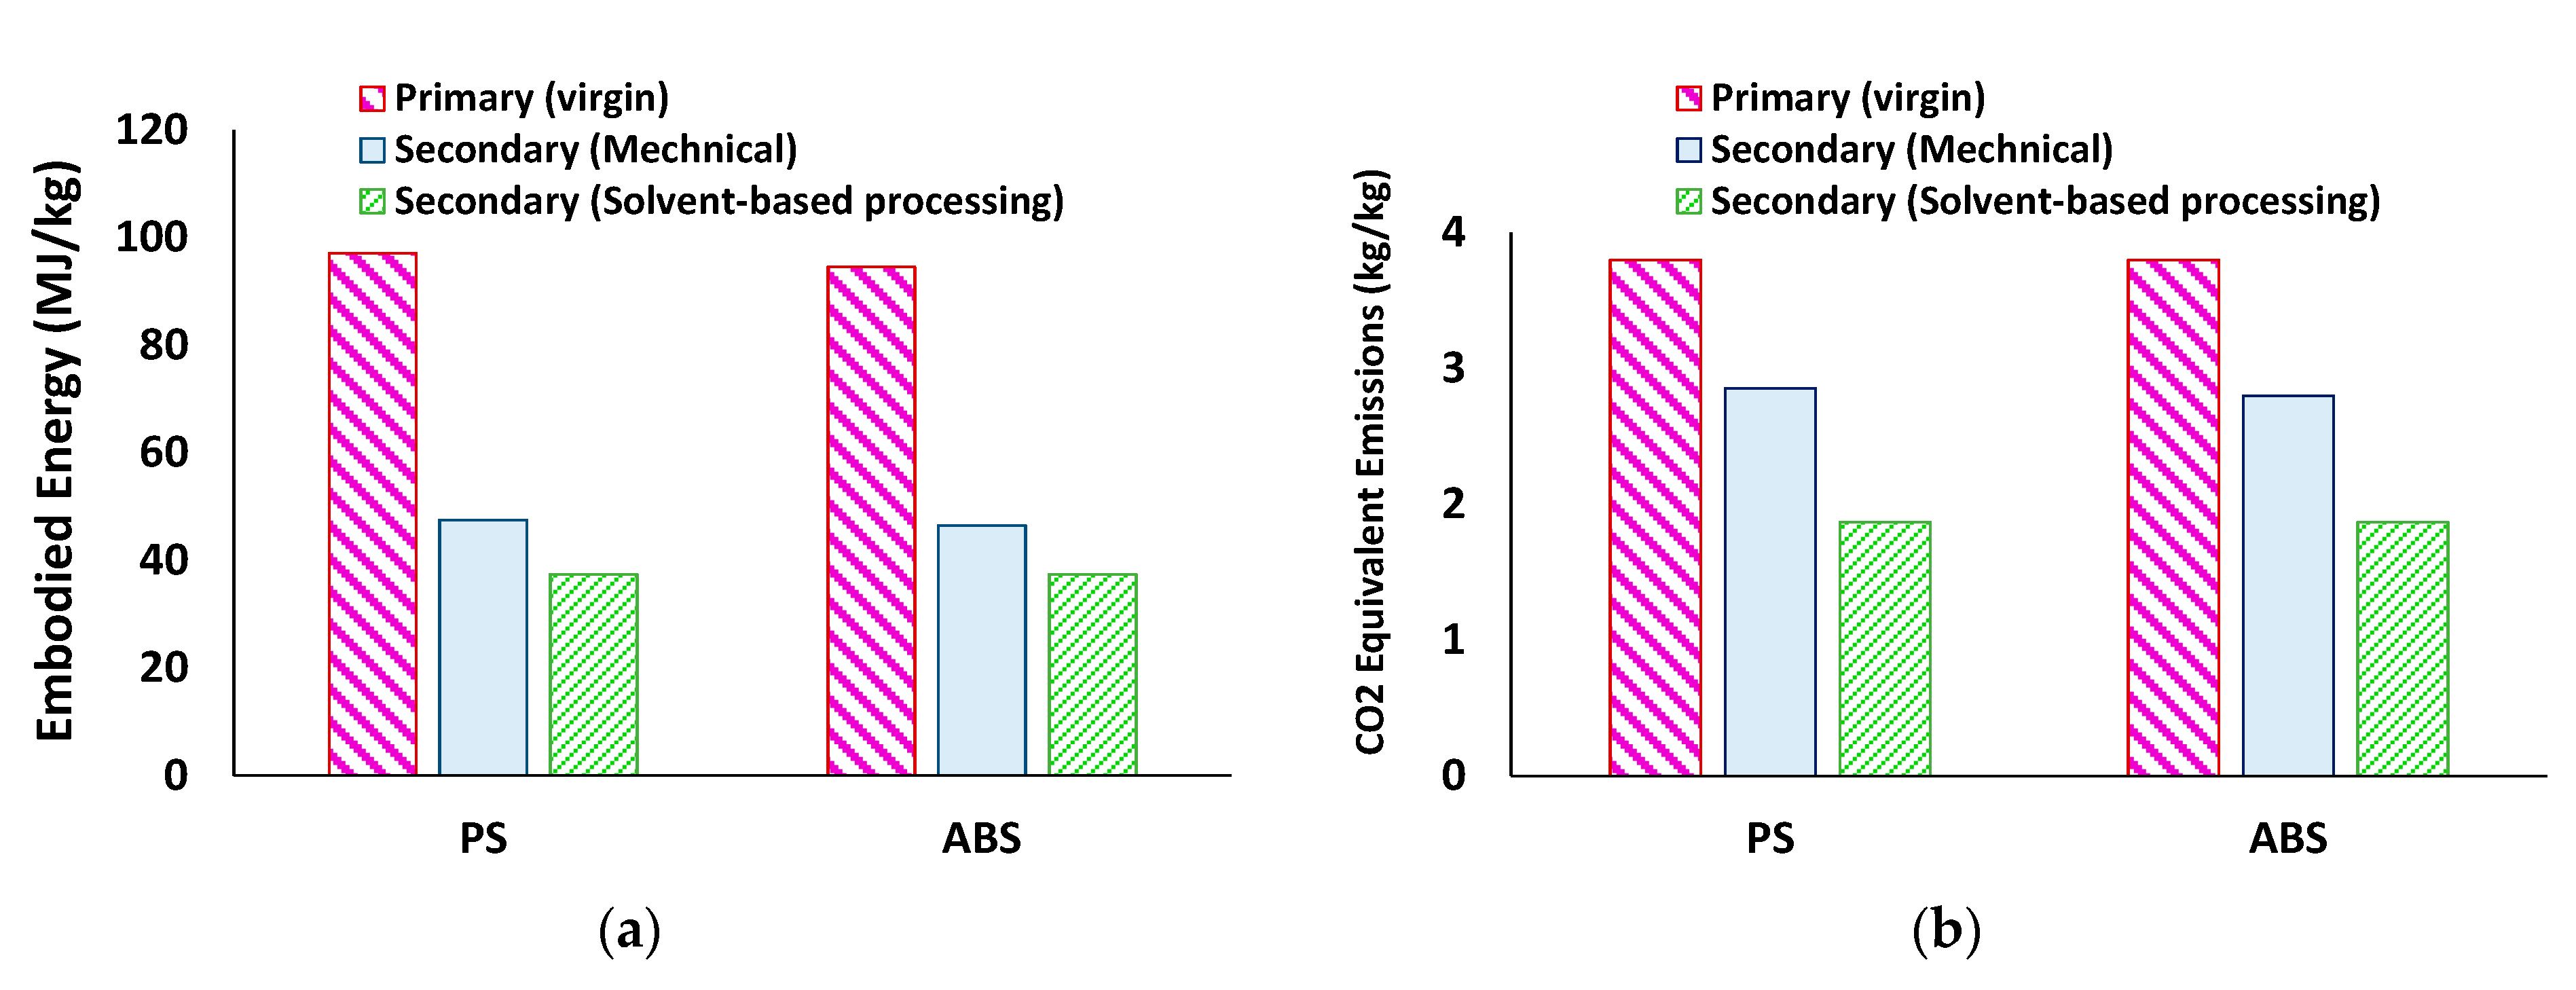
3.4. Energy Analysis

The energy required to reclaim polymers from E-waste using mechanical and the solvent-based processing was estimated and compared using a calculator that is publicly available online [47,48,49]. The embodied energy of polymers present in E-waste was also available in literature [19]. For mechanical recycling, the energy required for collection, sorting and material preparation (including size reduction, conveying, separation by screening or magnetic force, air separation or dry cleaning, wet density separation or cleaning followed by drying, and optical sorting), and extrusion and compounding was considered. For the solvent-based processing, the energy required during the stages of collection, sorting, and material preparation (including size reduction, conveying, and separations by screening and magnetic force), solvent-based recycling (embodied energy of solvent/anti-solvent used, energy to convey solution and filtrate insoluble, energy to recover solvent/anti-solvent, and energy to treat solvent/anti-solvents), and extrusion/compounding was considered. Energy required for the above mentioned processes was also documented in Table S7 (available in [48]). DCM was used as a solvent and MeOH as an anti-solvent; the quantity of solvent/anti-solvent and the dissolution-precipitation conditions considered was based on the optimal condition selected from this study. The CO2 emissions for mechanical recycling and solvent-based processing was accounted for by considering the same processes used for energy analysis (Figure 7).
Compared to virgin plastics production, the solvent-based processing could lead to a 60% reduction in embodied energy loss and 51% reduction in CO2 emissions for re-manufacturing secondary plastics (using PS, ABS, and PC as examples) for cross-industry use (Figure 7). The embodied energy and CO2 emissions from the solvent-based processing is also lower than those from mechanical recycling. This could be attributed to the fact that plastics need to be re-melted during the extrusion stage in mechanical recycling, while the solvent-based processing occurs at ambient conditions in this study [19].
In addition, Table S5 (in Supplementary Data) also shows that from the energy point of view, the use of DCM and MeOH is preferable when compared to THF and EG as solvent/anti-solvent. DCM has an extremely low boiling point and low heat capacity as compared to most organic solvents. EG has a three-times higher boiling point than MeOH. Finding a solvent or solvent blend that could be more energy efficient than DCM would be challenging.

3.5. Economics of the Solvent-Based Recycling of E-Waste

In terms of process economic viability, it is acknowledged that the value of metals is much higher than of polymers. However, currently the E-waste recycler in the U.S. ships ESR to a distant refiner who extract metals and pay a discounted amount for the extracted metals. Each shipment of ESR contains >50% non-metallic materials (e.g., plastics and printed-circuit boards) that are lost during the refining process and provide no value to the recycler. Using the solvent-based recycling process, a recycler obtains the value of the plastics and a more-concentrated mixture of metals for refining. The solvent-based recycling should result in lower shipping costs for the same amount of metal to be refined (from a more-concentrated mixture that is shipped) and could result in more value paid (i.e., less discounting) for the extracted metals. For example, Figure S13 (in Supplementary Data) shows a preliminary cost analysis for incorporating the proposed solvent-based processing with current E-waste recycling [25,50]. Assuming only three kinds of metals and one major polymer are recovered, the new process has 2.4 times the potential profit as compared to traditional E-waste recycling because the metal contents were purified by at least 25%. If the reduced shipping costs and increased value paid for the metal (per ton ESR) are sufficiently greater than the cost of the solvent process (per ton ESR), then the recycler would have a strong financial incentive to invest in the solvent-based recycling process. More research to further optimize the dissolution-precipitation process is therefore needed to determine the minimum amounts of solvent and anti-solvent needed to separate the plastics, as these solvents are the major operating costs when their recovery rate is <100% (see more details in Figure S14 in Supplementary Data).
Notably, a similar enrichment can be done by using thermochemical conversions such as pyrolysis, which usually converts the polymer fraction into oil and thus separate polymers from metals. Using techno-economic analysis approach to compare the economics between the solvent-based material recycling and thermochemical recycling of E-waste, which is identified as a research gap, is critically needed to make a valid economic comparison between the processes.

4. Conclusions

A pre-sorted heterogeneous ESR feedstock collected by an E-waste recycling facility was analyzed and found to contain 25 wt.% plastics. Using FTIR, polystyrene (PS, 40 wt.%), acrylonitrile butadiene styrene (ABS, 25 wt.%), and styrene-acrylonitrile (SAN, 9 wt.%) were identified as the major components within the plastic fraction. The results showed that methylene chloride (dichloromethane, DCM) and tetrahydrofuran (THF) could dissolve the most PS and ABS, while methanol (MeOH) could precipitate the most PS and ABS. By optimizing the dissolution time and the solvents used, the highest polymer dissolution yield (99 wt.%) was achieved by using DCM for 48 h. Both MeOH and EG showed a precipitation yield of 71 wt.%. EG had the highest phosphorus-containing flame retardant removal rate (up to 98%). Subsequent characterization showed that the proposed solvent-based processing could preserve the high molecular weight fraction of the polymers and effectively remove flame retardants. Finally, the energy analysis indicated that the proposed solvent-based processes could save 60% of the embodied energy used to manufacture plastics used in electronics. The results from this project prove the potential of solvent-based processing to produce secondary materials recovered from E-waste for cross-industry reuse.

Supplementary Materials

The following supporting information can be downloaded at: https://www.mdpi.com/article/10.3390/pr10010066/s1, Figure S1: The weight percentage of different components in the ESR (n > 3), Figure S2: Halogen contents in e-waste plastic feedstocks: (a) brominated (Br) and (b) phosphorus (P) contents (n = 4; ABS: ABS feedstock; PS: PS feedstock; ESR: ESR feedstocks), Figure S3: Chemical Structure of Triphenyl Phosphate, Figure S4: Chemical Structure of Poly(2,6-dibromophenol oxide), Figure S5: A visual representation of the induction period, Figure S6: The effect of the volume fraction of anti-solvents on the precipitation yield of ESR (n = 3 for both dissolution and precipitation yields recovered by one filtration), Figure S7: GPC analysis of (a) PS feedstock (F-PS) and precipitated PS (P-PS), (b) ABS feedstock (F-ABS) and precipitated ABS (P-ABS), and (c) ESR feedstock (F-ESR) and ESR recovered by MeOH (R-ESR-DCM-MeOH) and EG (R-ESR-DCM-EG), Figure S8: TGA analysis of (a) PS feedstock (F-PS) and precipitated PS (P-PS), (b) ABS feedstock (F-ABS) and precipitated ABS (P-ABS), (c) ESR feedstock (F-ESR) and ESR recovered by methanol (P-ESR), and (d) ESR feedstock (F-ESR) and ESR recovered by ethylene glycol (P-ESR), Figure S9: DSC analysis of (a) PS feedstock (F-PS) and precipitated PS (P-PS), (b) ABS feedstock (F-ABS) and precipitated ABS (P-ABS), and (c) ESR feedstock (F-ESR) and ESR recovered by MeOH (P-ESR), Figure S10: FTIR spectra of (a) PS feedstock (F-PS) and (b) precipitated PS (P-PS). Note: Three different pieces were scanned (i.e., Samples 1, 2, and 3), Figure S11: FTIR spectra of (a) ABS feedstock (F-ABS) and (b) precipitated ABS (P-ABS). Note: Three different pieces were scanned (i.e., Samples 1, 2, and 3), Figure S12: FTIR spectra of precipitated ESR with (a) MeOH and (b) EG. Note: Three different pieces were scanned (i.e., Samples 1, 2, and 3), Figure S13: Preliminary cost analysis of the potential future process of E-waste recycling: (a) current status, (b) potential future process, and (c) a case study of recovering only three kinds of metals and one polymer, Figure S14: The effects of solvent extraction efficiency on operational profits (USD$/Ton ESR, assuming the plastic extraction efficiency is 100%), and Table S1: Solvent that can theoretically dissolve PS based on their HSPs, Table S2: Solvents that can theoretically dissolve ABS based on their HSPs, Table S3: Anti-solvents that can theoretically precipitate PS based on their HSPs, Table S4: Anti-solvents that can theoretically precipitate ABS based on their HSPs, Table S5: Energy Requirements for Solvent Recovery, Table S6: Weight change of ESR feedstock and precipitated plastics by using MeOH and EG as the anti-solvent, Table S7: Glass transition temperature detected in the ESR feedstock and the ESR reclaimed by using MeOH as an anti-solvent, Table S8: Energy consumption estimation of the proposed dissolution-precipitation recycling process, Table S9: The parameters used in calculating the operating cost of using the solvent-based processing to recover plastics in real E-waste.

Author Contributions

Conceptualization, W.-T.C. and L.A.; methodology, W.-T.C. and L.A.; software, E.Y. and W.-T.C.; validation, W.-T.C., L.A. and E.Y.; formal analysis, W.-T.C., L.A. and E.Y.; investigation, W.-T.C., E.Y. and L.A.; resources, W.-T.C.; data curation, W.-T.C., E.Y. and L.A.; writing—original draft preparation, W.-T.C. and L.A.; writing—review and editing, E.Y., W.-T.C. and L.A.; visualization, W.-T.C. and E.Y.; supervision, W.-T.C.; project administration, W.-T.C.; funding acquisition, W.-T.C. All authors have read and agreed to the published version of the manuscript.

Funding

This material is based upon work supported by the U.S. Department of Energy’s Office of Energy Efficiency and Renewable Energy (EERE) under the Advanced Manufacturing Office Award Number DE-EE0007897 awarded to the REMADE Institute, a division of Sustainable Manufacturing Innovation Alliance Corp. This report was prepared as an account of work sponsored by an agency of the United States Government. Neither the United States Government nor any agency thereof, nor any of their employees, makes any warranty, express or implied, or assumes any legal liability or responsibility for the accuracy, completeness, or usefulness of any information, apparatus, product, or process disclosed, or represents that its use would not infringe privately owned rights. Reference herein to any specific commercial product, process, or service by trade name, trademark, manufacturer, or otherwise does not necessarily constitute or imply its endorsement, recommendation, or favoring by the United States Government or any agency thereof. The views and opinions of authors expressed herein do not necessarily state or reflect those of the United States Government or any agency thereof. The authors also would like to thank the University of Massachusetts Lowell for providing start-up funds.

Institutional Review Board Statement

Not applicable.

Informed Consent Statement

Not applicable.

Data Availability Statement

The data presented in this study are available upon request from the corresponding author.

Acknowledgments

The authors would like to thank Sunnking for supplying the E-waste feedstock and providing guidance about how E-waste is currently recycled in the U.S. The authors would also like to thank for Frontier Laboratory for consigning the pyrolysis gas-chromatography mass spectrometer (py-GCMS). The authors further would like to thank Taofeng Lu and David Wagger for helping with the characterization experiments and discussion for this paper. The authors also would like to thank Taofeng Lu for proofreading the paper.

Conflicts of Interest

The authors declare no conflict of interest.

References

  1. Ning, C.; Lin, C.S.K.; Hui, D.C.W.; McKay, G.J. Waste Printed Circuit Board (PCB) Recycling Techniques. Top. Curr. Chem. 2017, 375, 43. [Google Scholar] [CrossRef]
  2. Wakolbinger, T.; Toyasaki, F.; Nowak, T.; Nagurney, A. When and for whom would e-waste be a treasure trove? Insights from a network equilibrium model of e-waste flows. Int. J. Prod. Econ. 2014, 154, 263–273. [Google Scholar] [CrossRef] [Green Version]
  3. USEPA. Durable Goods: Product-Specific Data; EPA: Washington, DC, USA, 2018.
  4. Suresh, S.S.; Bonda, S.; Mohanty, S.; Nayak, S.K. A review on computer waste with its special insight to toxic elements, segregation and recycling techniques. Process Saf. Environ. Prot. 2018, 116, 477–493. [Google Scholar] [CrossRef]
  5. PINFA, the Phosphorus, Inorganic and Nitrogen Flame Retardants Association. In Flame Retardants in Electric and Electronic Applications; PINFA: Brussels, Belgium, 2017.
  6. Evangelopoulos, P.; Arato, S.; Persson, H.; Kantarelis, E.; Yang, W. Reduction of brominated flame retardants (BFRs) in plastics from waste electrical and electronic equipment (WEEE) by solvent extraction and the influence on their thermal decomposition. Waste Manag. 2019, 94, 165–171. [Google Scholar] [CrossRef]
  7. Riise, B. Recovering plastics from electronics waste. In Energy Technology 2020: Recycling, Carbon Dioxide Management, and Other Technologies; Springer: Berlin/Heidelberg, Germany, 2020; pp. 295–305. [Google Scholar]
  8. Gohatre, O.K.; Biswal, M.; Mohanty, S.; Nayak, S.K. An effective sustainable approach towards recycling and value addition of waste poly (vinyl chloride) and acrylonitrile butadiene styrene (ABS) recovered from electronic waste (e-waste). J. Polym. Res. 2021, 28, 328. [Google Scholar] [CrossRef]
  9. Balart, R.; Lopez, J.; García, D.; Salvador, M.D. Recycling of ABS and PC from electrical and electronic waste. Effect of miscibility and previous degradation on final performance of industrial blends. Eur. Polym. J. 2005, 41, 2150–2160. [Google Scholar] [CrossRef]
  10. Hopewell, J.; Dvorak, R.; Kosior, E. Plastics recycling: Challenges and opportunities. Philos. Trans. R. Soc. B Biol. Sci. 2009, 364, 2115–2126. [Google Scholar] [CrossRef] [Green Version]
  11. Kang, H.-Y.; Schoenung, J.M. Economic Analysis of Electronic Waste Recycling:  Modeling the Cost and Revenue of a Materials Recovery Facility in California. Environ. Sci. Technol. 2006, 40, 1672–1680. [Google Scholar] [CrossRef]
  12. Fromme, H.; Becher, G.; Hilger, B.; Völkel, W. Brominated flame retardants—Exposure and risk assessment for the general population. Int. J. Hyg. Environ. Health 2016, 219, 1–23. [Google Scholar] [CrossRef]
  13. Organization for Economic Co-operation and Development (OECD). Brominated Flame Retardants (BFRs): Hazard/Risk Information Sheets; OECD: Paris, France, 2008. [Google Scholar]
  14. Xiu, F.-R.; Qi, Y.; Zhang, F.-S. Co-treatment of waste printed circuit boards and polyvinyl chloride by subcritical water oxidation: Removal of brominated flame retardants and recovery of Cu and Pb. Chem. Eng. J. 2014, 237, 242–249. [Google Scholar] [CrossRef]
  15. Ma, C.; Yu, J.; Wang, B.; Song, Z.; Xiang, J.; Hu, S.; Su, S.; Sun, L. Chemical recycling of brominated flame retarded plastics from e-waste for clean fuels production: A review. Renew. Sustain. Energy Rev. 2016, 61, 433–450. [Google Scholar] [CrossRef]
  16. Khayyam Nekouei, R.; Maroufi, S.; Assefi, M.; Pahlevani, F.; Sahajwalla, V. Thermal isolation of a clean alloy from waste slag and polymeric residue of electronic waste. Processes 2020, 8, 53. [Google Scholar] [CrossRef] [Green Version]
  17. Chandrasekaran, S.R.; Avasarala, S.; Murali, D.; Rajagopalan, N.; Sharma, B.K. Materials and Energy Recovery from E-Waste Plastics. ACS Sustain. Chem. Eng. 2018, 6, 4594–4602. [Google Scholar] [CrossRef]
  18. Vollmer, I.; Jenks, M.J.F.; Roelands, M.C.P.; White, R.J.; van Harmelen, T.; de Wild, P.; van der Laan, G.P.; Meirer, F.; Keurentjes, J.T.F.; Weckhuysen, B.M. Beyond Mechanical Recycling: Giving New Life to Plastic Waste. Angew. Chem. Int. Ed. 2020, 59, 15402–15423. [Google Scholar] [CrossRef] [Green Version]
  19. Gandhi, N.; Farfaras, N.; Wang, N.-H.-L.; Chen, W.-T. Life Cycle Assessment of Recycling High-Density Polyethylene Plastic Waste. J. Renew. Mater. 2021, 9, 1463–1483. [Google Scholar] [CrossRef]
  20. Achilias, D.S.; Roupakias, C.; Megalokonomos, P.; Lappas, A.A.; Antonakou, E.V. Chemical recycling of plastic wastes made from polyethylene (LDPE and HDPE) and polypropylene (PP). J. Hazard. Mater. 2007, 149, 536–542. [Google Scholar] [CrossRef]
  21. Cella, R.F.; Mumbach, G.D.; Andrade, K.L.; Oliveira, P.; Marangoni, C.; Bolzan, A.; Bernard, S.; Machado, R.A.F. Polystyrene recycling processes by dissolution in ethyl acetate. J. Appl. Polym. Sci. 2018, 135, 46208. [Google Scholar] [CrossRef]
  22. Hadi, A.J.; Najmuldeen, G.F.; Yusoh, K.B. Dissolution/reprecipitation technique for waste polyolefin recycling using new pure and blend organic solvents. J. Polym. Eng. 2013, 33, 471–481. [Google Scholar] [CrossRef]
  23. Ügdüler, S.; Van Geem, K.M.; Roosen, M.; Delbeke, E.I.P.; De Meester, S. Challenges and opportunities of solvent-based additive extraction methods for plastic recycling. Waste Manag. 2020, 104, 148–182. [Google Scholar] [CrossRef] [Green Version]
  24. Reimonn, G.; Lu, T.; Gandhi, N.; Chen, W.-T.J. Review of Microplastic Pollution in the Environment and Emerging Recycling Solutions. J. Renew. Mater. 2019, 7, 1251–1268. [Google Scholar] [CrossRef] [Green Version]
  25. Weeden, G.S.; Soepriatna, N.H.; Wang, N.H.L. Method for efficient recovery of high-purity polycarbonates from electronic waste. Environ. Sci. Technol. 2015, 49, 2425–2433. [Google Scholar] [CrossRef]
  26. Vilaplana, F.; Ribes-Greus, A.; Karlsson, S. Microwave-assisted extraction for qualitative and quantitative determination of brominated flame retardants in styrenic plastic fractions from waste electrical and electronic equipment (WEEE). Talanta 2009, 78, 33–39. [Google Scholar] [CrossRef]
  27. Chen, W.-T.; Nien-hwa, L.W.; Jin, K. Method of Converting Plastic Waste into Useful Stock. U.S. Patent No. 10,894,870, 19 January 2021. [Google Scholar]
  28. Lu, T.; Reimonn, G.; Morose, G.; Yu, E.; Chen, W.-T. Removing Acrylic Conformal Coating with Safer Solvents for Re-Manufacturing Electronics. Polymers 2021, 13, 937. [Google Scholar] [CrossRef] [PubMed]
  29. Burke, J. Solubility parameters: Theory and application; AIC Book and Paper Group: Washington, DC, USA, 1984. [Google Scholar]
  30. Sanchez-Lengeling, B.; Roch, L.M.; Perea, J.D.; Langner, S.; Brabec, C.J.; Aspuru-Guzik, A. A Bayesian Approach to Predict Solubility Parameters. Adv. Theory Simul. 2019, 2, 1800069. [Google Scholar] [CrossRef]
  31. Sharma, A.; Yu, E.; Morose, G.; Nguyen, D.T.; Chen, W.-T. Designing Safer Solvents to Replace Methylene Chloride for Liquid Chromatography Applications Using Thin-Layer Chromatography as a Screening Tool. Separations 2021, 8, 172. [Google Scholar] [CrossRef]
  32. Hansen, C.M. Hansen Solubility Parameters: A User’s Handbook; CRC Press: Boca Raton, FL, USA, 2002. [Google Scholar]
  33. Zhao, Y.-B.; Lv, X.-D.; Yang, W.-D.; Ni, H.-G. Laboratory simulations of the mixed solvent extraction recovery of dominate polymers in electronic waste. Waste Manag. 2017, 69, 393–399. [Google Scholar] [CrossRef]
  34. Achilias, D.S.; Giannoulis, A.; Papageorgiou, G.Z. Recycling of polymers from plastic packaging materials using the dissolution–reprecipitation technique. Polym. Bull. 2009, 63, 449–465. [Google Scholar] [CrossRef]
  35. Microlab, M. Bromine Determination via Schoniger Combustion. Available online: https://midwestlab.com/elemental-analysis-services/bromine-testing/ (accessed on 2 June 2021).
  36. Microlab, M. Analysis of Phosphorus with Spectrophotometry. Available online: https://midwestlab.com/elemental-analysis-services/phosphorus-testing/ (accessed on 2 June 2021).
  37. Puype, F.; Samsonek, J.; Knoop, J.; Egelkraut-Holtus, M.; Ortlieb, M. Evidence of waste electrical and electronic equipment (WEEE) relevant substances in polymeric food-contact articles sold on the European market. Food Addit. Contam. Part A 2015, 32, 410–426. [Google Scholar] [CrossRef]
  38. Shen, Y.; Zhao, R.; Wang, J.; Chen, X.; Ge, X.; Chen, M. Waste-to-energy: Dehalogenation of plastic-containing wastes. Waste Manag. 2016, 49, 287–303. [Google Scholar] [CrossRef] [PubMed]
  39. Blackadder, D.; Le Poidevin, G. Dissolution of polypropylene in organic solvents: 1. Partial dissolution. Polymer 1976, 17, 387–394. [Google Scholar] [CrossRef]
  40. Blackadder, D.; Le Poidevin, G. Dissolution of polypropylene in organic solvents: 2. The steady state dissolution process. Polymer 1976, 17, 768–776. [Google Scholar] [CrossRef]
  41. Blackadder, D.; Le Poidevin, G. Dissolution of polypropylene in organic solvents: 4. Nature of the solvent. Polymer 1978, 19, 483–488. [Google Scholar] [CrossRef]
  42. Blackadder, D.; Le Poidevin, G. Dissolution of polypropylene in organic solvents: 3. Effect of molecular weight of polymer. Polymer 1977, 18, 547–550. [Google Scholar] [CrossRef]
  43. Larsen, C.; Lundberg, P.; Tang, S.; Ràfols-Ribé, J.; Sandström, A.; Mattias Lindh, E.; Wang, J.; Edman, L. A tool for identifying green solvents for printed electronics. Nat. Commun. 2021, 12, 4510. [Google Scholar] [CrossRef] [PubMed]
  44. Weeden, G.S.; Ling, L.; Soepriatna, N.H.; Wang, N.H.L. Size-exclusion simulated moving bed for separating organophosphorus flame retardants from a polymer. J. Chromatogr. A 2015, 1422, 99–116. [Google Scholar] [CrossRef] [Green Version]
  45. Yu, G.-M.; Wang, L.-S.; Sun, J.; Jiang, L.-K. Solubilities of Three Phosphorus Flame Retardants in Selected Organic Solvents. J. Chem. Eng. Data 2015, 60, 1803–1813. [Google Scholar] [CrossRef]
  46. Altwaiq, A.m.; Wolf, M.; van Eldik, R. Extraction of brominated flame retardants from polymeric waste material using different solvents and supercritical carbon dioxide. Anal. Chim. Acta 2003, 491, 111–123. [Google Scholar] [CrossRef]
  47. Ashby, M.F. Materials and the Environment: Eco-Informed Material Choice; Elsevier Science: Waltham, MA, USA, 2012. [Google Scholar]
  48. The REMADE Institute, REMADE Project Impact Caculator. Available online: https://remadeinstitute.org/project-impact-calculator (accessed on 5 November 2021).
  49. Althaus, H.; Chudacoff, M.; Hischier, R.; Jungbluth, N.; Osses, M.; Primas, A. Life Cycle Inventories of Chemicals; Swiss Center for Life Cycle Inventories: Dübendorf, Switzerland, 2007; Available online: www.ecoinvent.org (accessed on 5 November 2021).
  50. Tatariants, M.; Yousef, S.; Denafas, G.; Tichonovas, M.; Bendikiene, R. Recovery of gold, other metallic and non-metallic components of full-size waste random access memory. J. Clean. Prod. 2018, 172, 2811–2823. [Google Scholar] [CrossRef]
Figure 1. The dissolution-precipitation process used for recovering polymers and removing flame retardants. Notably, each solvent and anti-solvent was used separately. In a typical dissolution-precipitation process, an individual solvent would be added to dissolve the polymer sample first and then an individual anti-solvent would be added to precipitate the polymer solution.
Processes 10 00066 g001
Figure 2. The weight percentage of different plastics found in the ESR plastic waste (PS: polystyrene; ABS: Acrylonitrile butadiene styrene; SAN: Styrene Acrylonitrile; PMMA: poly(methyl methacrylate); PVCA: polyvinyl chloride acetate; PP: polypropylene; note: more than 100 pieces (124 g in total) were scanned, while about 7% of the plastics characterized were unknown by FTIR).
Processes 10 00066 g002
Figure 3. Dissolution yield of sorted plastics from ESR: (a) dissolution yield of PS-based plastics and (b) dissolution yield of ABS-based plastics. All tests were carried out at ambient conditions with a dissolution time of 30 min with a polymer to solvent ratio of 1:20. Notably, solvents that did not show promising results were only tested for once, while those can dissolve high amounts of PS or ABS (>50 wt.%) were tested 2–3 times. (a) n = 3, Xylene. n = 2, Toluene, DCM, Butyl Benzoate, p-cymene, THF, acetone. n = 1; Cyclopentyl methyl ether, ethyl benzene, limenene. (b) n = 3; DCM, acetone, ethyl acetate. n = 1; 1,4 Dioxane, propylene glycol monomethyl ether acetate, cyclohexanone, n-butyl acetate, amyl acetate, Dimethyl Adipate (DBE), Anisole.
Processes 10 00066 g003
Figure 4. The effect of dissolution time on the dissolution yield of ESR plastics. All tests were carried out with a polymer to solvent ratio of 1:20 (n ≥ 2).
Processes 10 00066 g004
Figure 5. The precipitation yields of PS and ABS (sorted from ESR).
Processes 10 00066 g005
Figure 6. (a) Phosphorus (P) and (b) brominated (Br) contents in the plastic fraction of ESR and the reclaimed plastics (n = 4; ESR: the plastic fraction of ESR; R-ESR (MeOH) and R-ESR (EG): ESR plastics dissolved in DCM for 6 h and precipitated by MeOH and EG, respectively). (a) P Content in ESR. (b) Br Content in ESR.
Processes 10 00066 g006
Figure 7. (a) The embodied energy and (b) the CO2 equivalent emissions from primary production (virgin plastics) and secondary production (mechanical recycling and the solvent-based processing) of PS and ABS (note: DCM was used as a solvent and MeOH was used as an anti-solvent for the solvent-based processing; the quantity of solvent/anti-solvent and the dissolution-precipitation conditions are based on the optimal condition selected from this study). More details can be found in Table S7 in Supplementary Data and an Excel-based impact calculator publicly available online (available in [48]).
Processes 10 00066 g007
Publisher’s Note: MDPI stays neutral with regard to jurisdictional claims in published maps and institutional affiliations.

