Abstract
One of the important factors determining the biochemical processes in bioreactors is the quality of the wastewater inflow to the wastewater treatment plant (WWTP). Information on the quality of wastewater, sufficiently in advance, makes it possible to properly select bioreactor settings to obtain optimal process conditions. This paper presents the use of classification models to predict the variability of wastewater quality at the inflow to wastewater treatment plants, the values of which depend only on the amount of inflowing wastewater. The methodology of an expert system to predict selected indicators of wastewater quality at the inflow to the treatment plant (biochemical oxygen demand, chemical oxygen demand, total suspended solids, and ammonium nitrogen) on the example of a selected WWTP—Sitkówka Nowiny, was presented. In the considered system concept, a division of the values of measured wastewater quality indices into lower (reduced values of indicators in relation to average), average (typical and most common values), and upper (increased values) were adopted. On the basis of the calculations performed, it was found that the values of the selected wastewater quality indicators can be identified with sufficient accuracy by means of the determined statistical models based on the support vector machines and boosted trees methods.
1. Introduction
The key factors having a significant impact on the operation of wastewater treatment plants, and thus the choice of setting values, include the quantity and quality of the influent wastewater [1,2]. They constitute independent variables in the process models for forecasting the operation of a treatment plant [3,4,5]. This is important in terms of the operation of the facilities, as having the values of wastewater quality indicators allows the simulation calculations of a biological reactor to be performed in advance using a process model. This allows optimization of the wastewater treatment process, reduction of operating costs, and obtaining high stability of the biological reactor [6,7,8,9].
The values of wastewater quality indicators at the inlet to the WWTP, as well as the amount of wastewater flowing into the WWTP, change over a wide range, e.g., as a result of heavy rains or uncontrolled discharges of pollutants into the sewage system. This has a significant impact on the treatment process in the biological reactor. Therefore, in order to obtain the required values of wastewater quality indicators at the outflow and to maintain high operational reliability of the treatment plant, it is necessary to constantly control the settings of the biological reactor. The operating parameters of the bioreactor can be determined in such a way that, regardless of the quantity and quality of wastewater in the inflow and for the season of the year, in the outflow from the treatment plant, the values of wastewater quality indicators will be below the limit values. However, this approach usually does not take into account the operating costs of the treatment plant, which should be the main criterion for assessing the efficiency of WWTP operation.
The WWTP collects large amounts of data that can be used to develop process models supporting the operation of the treatment plant. From the point of view of WWTP operation, it is interesting not only to forecast the wastewater treatment process but also its simulation. As mentioned above, it is very important to use modeling to control the treatment process, i.e., to determine such bioreactor settings to ensure the required quality of wastewater at the outlet of the treatment plant at the lowest operating costs.
Bearing in mind the benefits of simulating the quantity and quality of wastewater at the inflow to a treatment plant, this topic has become the basis of many analyses carried out by numerous researchers [3,10,11,12,13]. In most cases, the wastewater quality is modeled using hydrodynamic [14,15,16] or statistical [17,18,19] models. Due to the strong interaction between parameters, there are problems with the calibration of hydrodynamic models, which translates into unsatisfactory predictive abilities. Calibration is much simpler for statistical models. Additionally, depending on the needs, the scope of data covered by measurements can be limited, which allows for reducing the costs of field tests. Statistical models can be created using statistical methods, such as linear (ARMA, ARIMA, multiple regression, etc.) or nonlinear (polynomial, exponential, regression trees, random forests, boosted trees, neural networks, support vectors, etc.) models [12,20,21,22,23].
The statistical models for forecasting the quality of wastewater at the inflow to a wastewater treatment plant are created on the basis of collected measurement data [24,25,26]. On the basis of the values measured in the last measurements taken, the quality of wastewater is modeled in time t [27,28,29,30] or in the case of autoregressive models—in advance [31,32,33,34,35]. For small wastewater treatment plants, it has been shown that the values of selected wastewater quality indicators, i.e., BOD and COD, can be modeled on the basis of the amount of wastewater flowing into the treatment plant [36]. This approach seems interesting for building an expert system that allows for the simulation of wastewater quality based on daily measurements performed on-site and does not generate high operating costs. Taking into account the possibility of its implementation under operational conditions is very promising and viable due to the low costs associated with measuring only the amount of inflowing wastewater.
Considering the remarks above, in the article, the use of classification models to predict the variability of wastewater quality at the inflow to wastewater treatment plants, the values of which depend only on the amount of inflowing wastewater, was presented. The model assumes that the data at the inlet to the treatment plant is divided into three classes: typical daily variability of wastewater quality reduced due to heavy rainfall and thus increased inflow, increased due to a decrease in the dilution of wastewater entering the WWTP. Information on the quality of wastewater in advance makes it possible for the technologist to properly select the reactor settings to obtain optimal process conditions.
2. Materials and Methods
2.1. Research Object
The research subject is the Sitkówka—Nowiny mechanical-biological wastewater treatment plant (Figure 1), located in the southeastern part of the city of Kielce, in the Świętokrzyskie voivodship, in the southern part of Poland. The area of the city is 109 km2 and the average population density is 21.4 people/km2. Municipal wastewater is supplied to the plant by a wastewater distribution system from the city of Kielce, the Sitkówka—Nowiny commune, and parts of the Masłów commune. As far as the wastewater flowing into the treatment plant is concerned, 80% is municipal wastewater and 20% originates from industrial plants in the city. The nominal capacity of the treatment plant is 72,000 m3/d, which corresponds to a load of 27,500 PE.
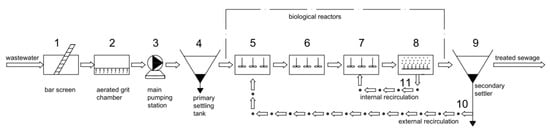
Figure 1.
Scheme of the Sitkówka—Nowiny mechanical-biological wastewater treatment plant.
The influent wastewater is pre-treated mechanically on step grates and aerated sand traps with separated fat removal, where coarser dirt and sand are captured. After the mechanical part, the wastewater flows into the reactor, where the purification process is based on the single-stage three-phase activated sludge (BARDENPHO) method. Next, the wastewater flows into the secondary settling tank, where the treated wastewater is separated from the activated sludge, from where it flows into the Bobrza River.
Monitoring in the Sitkowka-Nowiny WWTP includes measurements of the quantity and quality of the influent wastewater and the bioreactor operating parameters. The following reactor parameters are measured in an on-line mode with hourly resolution: oxygen concentration (DO) in the nitrification; denitrification and dephosphatation chambers; concentration (MLSS); settling rate of activated sludge in the chambers (SE); concentration and size of the recirculated sludge stream (RAS); the amount of the dosed external carbon source in the form of methanol (mMET); the amount of dosed coagulant (mCOAG); excess sludge stream (WAS); pre-sludge stream (QPRIM); redox potential in the dephosphatization chamber (ORP); wastewater inlet temperature (T) and temperature in the reactor; and pH. During the research period, a qualitative analysis of the influent wastewater was performed once or twice a week to determine its BOD, COD, TN, and TP. The organic compounds were determined as COD in accordance with PN–ISO 6060:2006 and as BOD5 with the method using the OXITOP, in accordance with PN–EN 1899–1:2002. TP was determined in accordance with PN–EN ISO 6878:2006. TN was determined in accordance with PN–C–04576–14:1973 [29]. Determination of the tested quality indicators in wastewater samples was made three times. The average values of the indexes were adopted for the analysis (standard deviation value was about 2%).
On the basis of the data on the wastewater quality at the inlet to the treatment plant (BOD5, TN) and the above-mentioned operational parameters, a model was created for the simulation of total nitrogen at the outlet from the treatment plant [29].
In the study period of 2012–2016, the annual rainfall was 537–757 mm, and the number of days with rainfall varied in the range of 155–266. The average annual air temperature varied from 8.1 °C to 9.6 °C, whereas the number of days with snowfall amounted to 36–84.
2.2. Expert System Methodology for Identifying the Quality of Wastewater to Treatment Plant
Taking into account the problems associated with monitoring and forecasting continuous values of wastewater quality indicators, a system methodology (Figure 2) that allows for identifying atypical states in the inflow with respect to selected indicators (BOD5, COD, TN, and TP) was proposed. This system is based on the models for identifying the states of selected wastewater quality indicators (reduced, typical, and elevated values) and the models simulating increased inflows to wastewater treatment plants.
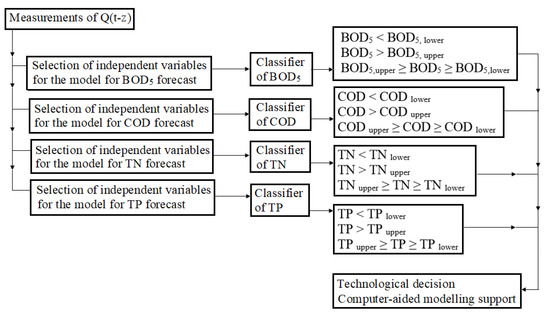
Figure 2.
Diagram of an expert system for identifying wastewater quality: BOD5, COD, TN, TP—“typical” values of wastewater quality indicators; BOD5,lower, CODlower, TNlower, TPlower—reduced values of wastewater quality indicators, BOD5,upper, CODupper, TNupper, TPupper—elevated values of wastewater quality indicators, Q(t)—inflow to the wastewater treatment plant at time t, z—delay values.
It was assumed in the calculations that 50% of all measurement values located within the median are “typical” values for the inflow to the treatment plant for the analyzed observation period. Other values of wastewater quality indicators located below the median were assumed to be “reduced”, and above as “increased”. From the point of view of wastewater treatment plant operation, the events are accompanied by an increased inflow, during which the values of indicators decrease, are particularly dangerous, and can potentially lead to disturbances in the operation of the reactor. In the presented diagram, the variability of selected wastewater quality indicators at the inflow at time t is identified based on the values of flow rate Q(t − z). The calculations provide the use of classification models (for a single quality indicator), described by the equations in the form:
- identifier of reduced values of wastewater quality indicators:
- identifier of increased values of wastewater quality indicators:where: f—the indicator depends on the inflow (Q) at different moments of time (t − 1, t − 2, …, t − z), Q(t)—inflow to the wastewater treatment plant at time t, z—delay values.
Independent variables in the classifier models were selected using the Chi-square test calculations. The first of the system classifiers in Figure 2 allows for forecasting the events when (identification of minimum values) and (identification of typical values). The advantage of this is the option to recognize cases where , which allows for determining three ranges of variability of selected wastewater quality indicators. For the models for flow classification, the median inflow is for the ranges and and .
On the basis of the results of quantity (Q) and wastewater quality (, , , ) measurements at the Sitkówka—Nowiny wastewater treatment plant from 2012–2016 (this gives 360 pieces of sets per single quality indicator), calculations of the models for identifying wastewater quality were carried out. The data covering individual wastewater quality indicators were collected as part of constant monitoring at the wastewater treatment plant. As part of the on-site monitoring, measurements are carried out once or twice a week for wastewater collection at the treatment plant inflow. Medium-day samples are representative of the day. A sampler was used to collect the wastewater samples. In the 2017–2018 period, the wastewater treatment plant was modernized, thus the data was not collected regularly. Therefore, the data would not be representative.
2.3. The Choice of Method to Identify the Quality of Wastewater at the Inflow to the Wastewater Treatment Plant
On the basis of the literature data [35,37,38,39], it can be stated that one of the commonly used methods for simulation of the biochemical processes at the wastewater treatment plant and at its inlet is the artificial neural network method. A review of the works in this area indicates that multilayer neural networks of the multilayer perceptron (MLP) type are used to simulate the quality of wastewater at the outlet and inlet, as well as the processes in the bioreactor and technological facilities (nitrification chambers, denitrification, dephosphatation, etc.). Perceptrons were first inspired by the human brain and introduced in Rosenblatt (1958) [40]. In this method, at the stage of learning, so-called values are the identified weights connecting neurons in successive layers for the assumed number of neurons in the hidden layer and assumed activation functions. If the results obtained using the MLP method are not satisfactory, it is possible to introduce modifications to the model consisting of the implementation of additional connections between successive layers (in this way cascaded neural networks are obtained), introducing feedback (the resulting model is the so-called recursive neural networks—RvNN).
Despite the fact that neural networks are an effective tool for process simulation and in many cases an alternative to physical models, they have a number of disadvantages that affect the obtained calculation results. First of all, the use of MLP neural networks raises reservations in the case of a limited amount of data for model creation. If the network architecture is not selected properly, an insufficient amount of data available for training may cause so-called overfitting. The model draws too far-fetched conclusions from the data used in training, which results in poor performance for any new, previously unseen data. Secondly, due to the fact that the value of the goal function in the form:
where: n—number of data points, ymesi—value for data point measured on the physical model, ysymi—value obtained for data point from the simulation is nonlinear with respect to optimized weights, the MLP network is characterized by many local minima and is sensitive to the initial values of optimized weights. Considering the above-mentioned disadvantages and limitations, a modification of the MLP method was developed, which resulted in the method of support vectors—SVM [41,42,43]. In the case of a non-linear relationship between the output from the model (y) and the explanatory variables , the transformation of -dimensional space to k-dimensional space of variable features is performed using the kernel function, where the relations are linear. Namely, the goal of the optimization, given data points in the form for , is:
subject to and .
C and are responsible for improving the model’s generalization. In the method of learning vectors, Vapnik [44] has developed a special calculation algorithm in which the identification of weight values (parameters and of the optimal hyperplane) has been reduced to the problem of square programming, which guarantees the occurrence of a single minimum of functions. Thus, a single global minimum of the goal function can be found. In this method, however, the predictive abilities of the obtained models also depend on the values of several hyperparameters: capacitance (), kernel function (), and insensitivity threshold (). Detailed information on the SVM method can be found in the industry literature on data mining and artificial intelligence methods [45]. MLPs and SVMs have been thoroughly analyzed and compared over the years, e.g., in [46] or [47].
In the work to assess the impact of model structure on simulation results, calculations were also made using the concept of regression trees. This method is much less complex than the SVM model and the results of calculations are simpler to interpret than SVM. However, the results of calculations in the regression tree method are stepwise, i.e., the model only uses a finite set of possible predicted values that can be assigned to any incoming data point. Thus, a small change in the value of one input variable can lead to a stepwise change in the value of the model output. This, in turn, weakens the model’s predictive ability. Hence, a method to modify the regression tree method, i.e., the boosted tree method (BT) was used in the presented work. This approach implemented the concept of stochastic gradient strengthening of created trees to improve the predictive capabilities of the model, which is a vital idea behind state-of-the-art prediction and classification models like XGBoost [48]. In the gradient strengthening algorithm, multiple trees are built one by one and the final prediction is obtained by adding the predictions of all individual trees in the ensemble. With this approach, it is believed that multiple models with mediocre predictive capabilities can, when combined, perform equally well or better than one, complex model. The subsequent trees are created based on a random sample from the entire data set. This solution aims to eliminate model overfitting (each subsequent regression tree in the model structure is built based on different data sets) and allows the models with generalization properties to be obtained, which improves their predictive ability.
As part of these analyses, the SVM method was used to identify the quality of wastewater at the inlet to the treatment plant. In the analyses, the measurement data were divided into training (50%), test (25%), and validation (25%) sets. STATISTICA 10 software was used to develop the prediction models described above for selected wastewater quality indicators, where the data for the training and test sets are selected at random. The cross-validation method has been adapted to optimize the training dataset of predictive models.
Optimal parameter values in individual models were sought in the respective ranges , , and [45]. The final selection of their values was iterative, because for the initially adopted values of calculations of the weight values were performed in the model; then, the values of the parameters listed above were changed until the best adjustment of the results of the calculations to measurements was obtained, which was determined on the basis of —sensitivity (expresses the correctness of data classification within a set comprising the data in the case BOD5/COD/TN/TP > (BOD5/COD/TN/TP)lower/upper) and —specificity (expresses the correctness of data classification within a set comprising the data in the case BOD5/COD/TN/TP < (BOD5/COD/TN/TP)lower/upper). In the boosted trees method, the maximum number of model trees is not more than 300 to prevent overfitting the model. This is one of the criteria that allows for obtaining a model with high generalization capabilities, i.e., that performs equally as well on new, unseen data (e.g., the test dataset), as on the training data.
3. Results and Discussion
3.1. Variability of Wastewater Quantity and Quality Inflow to the Treatment Plant
On the basis of the results of the quantity and quality measurements of selected wastewater quality indicators (BOD5, COD, TN, and TP), statistical characteristics (minimum, average, maximum, and standard deviations) were determined with a breakdown into winter and autumn-spring periods (Table 1). On the basis of the data in Table 1, it can be stated that in the winter and autumn-spring periods, the amount of wastewater flowing into the treatment plant varied widely.

Table 1.
Variation in the quantity and quality of selected wastewater quality indicators (BOD5, COD, TN, TP) at the analyzed wastewater treatment plant.
The highest flow values were recorded in the autumn and spring period, during intense rainfall events, which resulted in an increased inflow to the considered object. At the same time, the standard deviation values in relation to the measured values indicate a smaller variability of the inflow to the wastewater treatment plant in the winter (due to thaws) than in autumn and spring (caused by rainfall).
In addition, based on Table 1, it can be stated that in winter the average values of selected wastewater quality indicators were lower than in the autumn and spring period, which may be caused first of all by a change in the kinetics of processes occurring in the wastewater flowing through channels due to a decrease in air temperature [49,50,51]. Secondly, it may also result from the seasonal nature of the functioning of various types of services in the city, including industrial plants. Within the city, there are food industry plants, the operation of which is seasonal; moreover, in the autumn and spring period, the amount of wastewater generated with their share is greater than in winter. Lower values of wastewater quality indicators recorded in autumn and spring may be due to dilution of wastewater flowing into the treatment plant during intense rainfall events, which is also confirmed by the works of other authors [18,32].
Following the described methodology, based on the measurement data, the lower and upper limits for the analyzed wastewater quality indicators were determined, which allowed setting ranges of typical, reduced, and elevated values. The results of the analyses are presented in Figure 3. The results indicate significant variations of the measured parameters. Similar variations in total ammonium nitrogen (TAN) are indicated by Kerrio and Bae [9], who also showed that these changes did not affect the stability of WWTP.
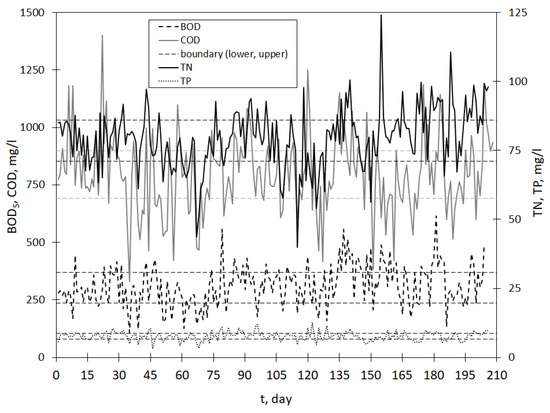
Figure 3.
Variability of , , , and values, taking into account the limit values constituting the basis for their division into classes (reduced, typical, increased values).
On the basis of the obtained curves, it can be stated that the lower and upper values for selected quality indicators are equal to:
- and ;
- and ;
- and ;
- and
On the basis of the lower and upper values given above, the measurement data were classified into binary, i.e., zero–one form. For example, when creating the model for the classification of reduced values (), it was assumed that when the value of , otherwise () . In the model for the classification of increased values () it was assumed that when , , otherwise .
3.2. Selection of Independent Variables for Classification Models
On the basis of the measurement results of selected wastewater quality indicators (, , , ) and daily flow values () using the Chi test—the square for the assumed confidence level α = 0.05—independent variables for classification models were selected to identify the minimum and maximum values; the obtained test probability values are presented in Table 2 and Table 3.
Table 2.
List of Chi-squared test values and p-test probabilities for variables describing wastewater quality indicators (, , , ) in models for identifying minimum values for the Sitkówka-Nowiny wastewater treatment plant.
Table 3.
List of Chi-squared test values and p-test probabilities for variables describing wastewater quality indicators (, , , ) in models for identifying maximum values for the Sitkówka-Nowiny treatment plant.
On the basis of the data in the tables below, it can be concluded that the variability of wastewater quality for and in the maximum range is described by the independent variables , in turn for , based on − and − . In the above-mentioned cases, it was found that the variability in the quality of selected wastewater quality indicators can be described using only four independent variables covering flow values. The variability of the minimum values of selected wastewater quality indicators is more complicated than the maximum values, which is indicated by the greater number of independent variables obtained from the Chi test—square (Table 2 and Table 3). This relationship is confirmed by the work of numerous authors [18,35,52] dealing with the impact of the amount of wastewater flowing into the treatment plant on the quality of wastewater. However, the relationships given by the aforementioned researchers related to the entire range of variability of the wastewater quality indicators examined by them (—Dogan et al. [52], —Ahnert et al. [36]), which is a much simpler task than this work.
The literature review [18,32,36] indicates the lack of analyses related to the study of the impact of selected groups of independent variables (wastewater quality indicators, flows, weather conditions, etc.) on the variability of wastewater quality at the inlet to municipal wastewater treatment plants divided into classes (typical values, minimum, maximum).
3.3. Designation of Classification Models for Forecasting the Quality of Selected Wastewater Indicators
On the basis of specific independent variables for classification models to identify the wastewater quality (, , , ) at the inlet to the wastewater treatment plant, mathematical models were determined using the support vector method and boosted tree. Table 4 gives the parameters describing the structure of the developed models () and measures of matching the calculation results to the measurements for the test and validation set (). On the basis of the data in the table, it was found that the parameter values were in the range , and . In addition, based on the data in the table below, it can be stated that the determined models are characterized by satisfactory predictive capabilities, which is confirmed by the calculated and values. Out of the mathematical models determined, the smallest values of errors in wastewater quality identification were obtained in the case of size, which is confirmed by and values close to 100% correct classification. In the models obtained by using the reinforced trees method, it was found that the maximum calculated trees in the model are not greater than 300. This indicates that the obtained models are not overlooked. The highest number of classification errors was made when identifying , as indicated by and At the operational stage, this means that in 11.21% of cases, , and 11.90% when mg/L will be incorrectly identified, which may lead to these episodes; for example, to non-optimally selected set values in the aeration system, which is related to higher costs and the amount of air supplied to the system by the blowers. The values of the determined matching measures using BT are 4–10% lower than in the SVM method. As a result, this may lead to an increase in the number of incorrect decisions at the stage of the wastewater treatment plant operation. Therefore, in order to achieve the highest possible efficiency of the wastewater treatment plant from a technological point (obtaining the required reduction of wastewater pollution), it is advisable to implement a model that conditions smaller calculation errors.
Table 4.
List of determined parameters () describing the structure of SVM models for the classification of wastewater quality at the inflow to the treatment plant and measures of matching the calculation results to the measurement ( ) for the training set and test set for the Sitkówka—Nowiny plant.
While analyzing the results obtained above (Table 4), it can be stated that compared to the simulations carried out by other researchers, they are far-reaching simplifications. Ansari et al. [53] showed the possibility of modeling the quality of wastewater at the inlet to a treatment plant on the basis of flow rate and rainfall depth obtaining R > 0.87. However, the object they analyzed was a relatively small wastewater treatment plant in Kuala Lumpur with a size of PE = 10,000. At the same time, the model they used was a complicated tool (ANFIS + PSO), the implementation of which would not be a simple task. These results confirmed the analyses of Rousseau et al. [54] and Ahnert et al. [36], who showed the possibility of COD forecasting based on flow rate by analyzing facilities in Germany and Belgium. Ebrahimi et al. [55] analyzed a single object and showed that it is possible to model TP based on BOD5, TSS or BOD5, TSS, COD or BOD5, TSS, TN, obtaining the values of the determination coefficient R2 > 0.87. However, the performance of analytical determinations of the above-mentioned wastewater quality indicators in a short time (less than 1 day) is limited. Thus, the model they proposed has limited application. The problem of forecasting the wastewater quality at the inflow from the treatment plant was also raised by Dogan et al. [52], who showed a significant impact of COD, TSS, TN, and TP on the BOD5 value. The amount of input data necessary to determine BOD5 compared to the one proposed in the research generates higher costs of determining wastewater quality indicators and extends the time of performing their determinations. In addition to the above-mentioned solutions, the quality of wastewater at the inlet to the wastewater treatment plant was modeled using autoregressive models in which the values of wastewater quality indices were determined based on previous measurement results. This solution requires maintaining the continuity of measurement data in a time series, in the absence of which the model has limited application [12]. Harmonic analysis was also used to model the quality of wastewater [56]. The simulation results have been normalized and depend on the size of the wastewater treatment plant. Nevertheless, these values are arithmetic means, which may condition the uncertainty of the selected settings in the bioreactor at the simulation stage of the treatment plant operation. As a result, process control at the treatment plant, selection of optimization strategies, and control of biochemical transformations requires the implementation of stochastic control algorithms.
The fact that the ranges of variability of selected wastewater quality indicators (BOD5, COD, TN) can be modeled on the basis of flows may be applied at the stage of facility operation. Namely, using the measurement data collected in the city of Kielce [57], it seems appropriate to develop a model for forecasting the flow based on their variability. The same data obtained can be an input to the designated model for forecasting the wastewater quality. From the point of the facility operation, it is important that the variability of wastewater quality (BOD5, COD, TN) at the facility inlet could be identified 24 h in advance. The results obtained in this way can be an input to the designated model for the forecast of total nitrogen [58]. Therefore, in the case under consideration, it would be possible to identify the operational parameters of the bioreactor settings (MLSS, DO, WAS) in advance [4,57,59,60].
This system would operate in such a way that for the determined value of wastewater quality indicators at the inlet on the basis of the classification model and the assumed TN value at the outlet, the bioreactor setting values would be calculated. This would allow for the control and continuous monitoring of the wastewater quality at the inlet and outlet of the treatment plant, as well as the selection of bioreactor setpoints to also reduce electricity consumption.
4. Conclusions
The results obtained in this work confirm that it is possible to identify the quality of selected indicators of wastewater quality on the basis of the results of measurements of the inflow to the treatment plant. The proposed solution is a simplification in relation to the models where the quality of wastewater at the inlet to the treatment plant was modeled on the basis of many wastewater quality indicators, the measurement time of which is long and the costs of their implementation are high.
On the basis of the simulation results, it can be stated that in the case of unsatisfactory results of modeling wastewater quality indicators, the classification model developed gives the opportunity to identify the ranges of variations of BOD5, COD, TN, and TP (reduced, typical and elevated values) at the inlet. This is an important advantage of the expert system given in the work. The presented model allows for the identification of typical states in the inflow to the wastewater treatment plant and makes it possible to forecast incidental states that affect the disturbance of the bioreactor’s operation.
The simulation results obtained in this work may be helpful in making the technologist’s decision at the stage of operation of the wastewater treatment plant and constitute the basis for choosing the value of settings in the biological reactor.
At the same time, further analyses are needed to assess the possibilities of using the models obtained in the work for optimization and control of wastewater treatment plants using the process models in which the data is uncertain and is subject to measurement errors.
Author Contributions
Conceptualization, B.W., A.B., E.Ł., and J.S.-C.; methodology, B.W., A.B., E.Ł., and J.S.-C.; software, validation and formal analysis, E.Ł. and J.S.-C.; investigation, J.D. and A.B.; resources, A.B.; data curation, A.B. and E.Ł.; writing—original draft preparation, All; writing—review and editing, All; visualization, A.B. and E.Ł.; supervision, All; project administration, J.S.-C. and A.B.; funding acquisition, J.S.-C. and E.Ł. All authors have read and agreed to the published version of the manuscript.
Funding
This research was funded by the Polish Ministry of Education and Science.
Institutional Review Board Statement
Not applicable.
Informed Consent Statement
Not applicable.
Data Availability Statement
Not applicable.
Acknowledgments
The authors thank the management of the Sitkówka-Nowiny wastewater treatment plant for the access to data.
Conflicts of Interest
The authors declare no conflict of interest.
References
- Henze, M.; Harremoes, P.; Arvin, E.; Lacour, J. Wastewater Treatment, Biological and Chemical Processes, 3rd ed.; Springer: Berlin/Heidelberg, Germany, 2002. [Google Scholar]
- Bayo, J.; López-Castellanos, J. Principal factor and hierarchical cluster analyses for the performance assessment of an urban wastewater treatment plant in the Southeast of Spain. Chemosphere 2016, 155, 152–162. [Google Scholar] [CrossRef]
- Mąkinia, J. Mathematical Modelling and Computer Simulation of Activated Sludge Systems, 1st ed.; IWA Publishing: London, UK, 2010. [Google Scholar]
- Drewnowski, J.; Makinia, J.; Szaja, A.; Łagód, G.; Kopeć, Ł.; Aguilar, J.A. Comparative study of balancing SRT by using modified ASM2d in control and operation strategy at full-scale WWTP. Water 2019, 11, 485. [Google Scholar] [CrossRef]
- Wang, R.; Pan, Z.; Chen, Y.; Tan, Z.; Zhang, J. Influent quality and quantity prediction in wastewater treatment plant: Model construction and evaluation. Polish J. Environ. Stud. 2021, 30, 4267–4276. [Google Scholar] [CrossRef]
- Alex, J.; Benedetti, L.; Copp, J.; Gernaey, K.V.; Jeppsson, U.; Nopens, I.; Pons, M.N.; Rieger, L.; Rosen, C.; Steyer, J.P.; et al. Benchmark Simulation Model no, 1 (BSM1); Technical Report; Department of Industrial Electrical Engineering and Automation, Lund University: Lund, Sweden, 2008; LUTEDX/(TEIE7229)/162/(2008. [Google Scholar]
- Drewnowski, J.; Zmarzły, M. The use of mathematical models for diagnosis of activated sludge systems in WWTP. E3S Web Conf. 2017, 22, 37. [Google Scholar] [CrossRef]
- Shourjeh, M.S.; Kowal, P.; Drewnowski, J.; Szeląg, B.; Szaja, A.; Łagód, G. Mutual Interaction between Temperature and DO Set Point on AOB and NOB Activity during Shortcut Nitrification in a Sequencing Batch Reactor in Terms of Energy Consumption Optimization. Energies 2020, 13, 5808. [Google Scholar] [CrossRef]
- Keerio, H.A.; Bae, W. Experimental investigation of substrate shock and environmental ammonium concentration on the stability of ammonia-oxidizing bacteria (AOB). Water 2020, 12, 223. [Google Scholar] [CrossRef]
- Gernaey, K.; Mussati, M.; Yuan, Z.; Nielsen, M.K.; Jørgensen, S.B. Control strategy evaluation for combined N and P removal using a benchmark wastewater treatment plant. IFAC Proc. Vol. 2002, 15, 381–386. [Google Scholar] [CrossRef]
- Ingildsen, P.; Rosen, C.; Gernaey, K.V.; Nielsen, M.K.; Gulldal, T.; Jacobsen, B.N. Modelling and control strategy testing of biological and chemical phosphorus removal at Avedøre WWTP. Water Sci. Technol. 2006, 53, 105–113. [Google Scholar] [CrossRef]
- Martin, C.; Vanrolleghem, P.A. Analysing, completing, and generating influent data for WWTP modelling: A critical review. Environ. Model. Softw. 2014, 60, 188–201. [Google Scholar] [CrossRef]
- Szeląg, B.; Mehrani, M.; Drewnowski, J.; Majewska, M.; Łagód, G.; Kumari, S.; Kumari, S.; Bux, F. Assessment of wastewater quality indicators for wastewater treatment influent using an advanced logistic regression model. Desalin Water Treat 2021, 232, 421–432. [Google Scholar] [CrossRef]
- Freni, G.; Mannina, G.; Viviani, G. Uncertainty in urban stormwater quality modelling: The effect of acceptability threshold in the GLUE methodology. Water Res. 2008, 42, 2061–2072. [Google Scholar] [CrossRef] [PubMed]
- Freni, G.; Mannina, G.; Viviani, G. Urban runoff modelling uncertainty: Comparison among Bayesian and pseudo-Bayesian methods. Environ. Model. Softw. 2009, 24, 1100–1111. [Google Scholar] [CrossRef]
- Łagód, G.; Sobczuk, H.; Suchorab, Z.; Widomski, M. Advection-dispersion pollutant and dissolved oxygen transport as a part of sewage biodegradation model. Environ. Prot. Eng. 2009, 35, 305–317. [Google Scholar]
- Gernaey, K.V.; Flores-Alsina, X.; Rosen, C.; Benedetti, L.; Jeppsson, U. Dynamic influent pollutant disturbance scenario generation using a phenomenological modelling approach. Environ. Model. Softw. 2011, 26, 1255–1267. [Google Scholar] [CrossRef]
- Szeląg, B.; Barbusiński, K.; Studziński, J. Activated sludge process modelling using selected machine learning techniques. Desalin. Water Treat. 2018, 117, 78–87. [Google Scholar] [CrossRef]
- Młyński, D.; Bugajski, P.; Młyńska, A. Application of the mathematical simulation methods for the assessment of the waste water treatment plant operation work reliability. Water 2019, 11, 873. [Google Scholar] [CrossRef]
- Ansari, M.; Othman, F.; Abunama, T.; El-Shafie, A. Analysing the accuracy of machine learning techniques to develop an integrated influent time series model: Case study of a sewage treatment plant, Malaysia. Environ. Sci. Pollut. Res. 2018, 25, 12139–12149. [Google Scholar] [CrossRef]
- Boyd, G.; Na, D.; Li, Z.; Snowling, S.; Zhang, Q.; Zhou, P. Influent forecasting for wastewater treatment plants in North America. Sustainability 2019, 11, 1764. [Google Scholar] [CrossRef]
- Najafzadeh, M.; Zeinolabedini, M. Prognostication of waste water treatment plant performance using efficient soft computing models: An environmental evaluation. Meas. J. Int. Meas. Confed. 2019, 138, 690–701. [Google Scholar] [CrossRef]
- Belanche, L.; Valdés, J.J.; Comas, J.; Roda, I.R.; Poch, M. Prediction of the bulking phenomenon in wastewater treatment plants. Artif. Intell. Eng. 2000, 14, 307–317. [Google Scholar] [CrossRef]
- Szelag, B.; Barbusiński, K.; Studziński, J.; Bartkiewicz, L. Prediction of wastewater quality indicators at the inflow to the wastewater treatment plant using data mining methods. E3S Web Conf. 2017, 22, 00174. [Google Scholar] [CrossRef]
- Zhang, Q.; Li, Z.; Snowling, S.; Siam, A.; El-Dakhakhni, W. Predictive models for wastewater flow forecasting based on time series analysis and artificial neural network. Water Sci. Technol. 2019, 80, 243–253. [Google Scholar] [CrossRef] [PubMed]
- Kim, M.; Kim, Y.; Kim, H.; Piao, W.; Kim, C. Evaluation of the k-nearest neighbor method for forecasting the influent characteristics of wastewater treatment plant. Front. Environ. Sci. Eng. 2016, 10, 299–310. [Google Scholar] [CrossRef]
- Lakner, G.; Lakner, J.; Hajnal, É.; Belafi-Bako, K. Mathematical modelling of real-time control system for industrial wastewater management. Desalin. Water Treat. 2017, 75, 268–273. [Google Scholar] [CrossRef]
- Yu, P.; Cao, J.; Jegatheesan, V.; Du, X. A real-time BOD estimation method in wastewater treatment process based on an optimized extreme learning machine. Appl. Sci. 2019, 9, 523. [Google Scholar] [CrossRef]
- Szeląg, B.; Drewnowski, J.; Łagód, G.; Majerek, D.; Dacewicz, E.; Fatone, F. Soft sensor application in identification of the activated sludge bulking considering the technological and economical aspects of smart systems functioning. Sensors 2020, 20, 1941. [Google Scholar] [CrossRef] [PubMed]
- Wang, X.; Ratnaweera, H.; Holm, J.A.; Olsbu, V. Statistical monitoring and dynamic simulation of a wastewater treatment plant: A combined approach to achieve model predictive control. J. Environ. Manage. 2017, 193, 1–7. [Google Scholar] [CrossRef] [PubMed]
- Abyaneh, H.Z. Evaluation of multivariate linear regression and artificial neural networks in prediction of water quality parameters. J. Environ. Health Sci. Eng. 2014, 12, 6–13. [Google Scholar] [CrossRef]
- Jurik, L.; Kaletova, T.; Sedmakova, M.; Balazova, P.; Cervenanska, A. Comparison of service characteristics of two town’s WWTP. J. Ecol. Eng. 2017, 18, 61–67. [Google Scholar] [CrossRef][Green Version]
- Gawdzik, A.; Gawdzik, J.; Gawdzik, B.; Gawdzik, A.; Rybotycki, M. Prediction of bod5 content of the inflow to the treatment plant using different methods of black box—The case study. Desalin. Water Treat. 2020, 196, 58–66. [Google Scholar] [CrossRef]
- Häck, M.; Köhne, M. Estimation of wastewater process parameters using neural networks. Water Sci. Technol. 1996, 33, 101–115. [Google Scholar] [CrossRef]
- Kusiak, A.; Verma, A.; Wei, X. A data-mining approach to predict influent quality. Environ. Monit. Assess. 2013, 185, 2197–2210. [Google Scholar] [CrossRef] [PubMed]
- Ahnert, M.; Marx, C.; Krebs, P.; Kuehn, V. A black-box model for generation of site-specific WWTP influent quality data based on plant routine data. Water Sci. Technol. 2016, 74, 2978–2986. [Google Scholar] [CrossRef]
- Cristea, V.M.; Pop, C.; Serban Agachi, P. Artificial Neural Networks Modelling of PID and Model Predictive Controlled Waste Water Treatment Plant Based on the Benchmark Simulation Model No.1; Elsevier: Amsterdam, The Netherlands, 2009; Volume 26, ISBN 9780444534330. [Google Scholar]
- Bagheri, M.; Mirbagheri, S.A.; Bagheri, Z.; Kamarkhani, A.M. Modeling and optimization of activated sludge bulking for a real wastewater treatment plant using hybrid artificial neural networks-genetic algorithm approach. Process Saf. Environ. Prot. 2015, 95, 12–25. [Google Scholar] [CrossRef]
- Abba, S.I.; Elkiran, G. Effluent prediction of chemical oxygen demand from the astewater treatment plant using artificial neural network application. Procedia Comput. Sci. 2017, 120, 156–163. [Google Scholar] [CrossRef]
- Rosenblatt, F. The Perceptron: A Probabilistic Model for Information Storage and Organization in the Brain. Psychol. Rev. 1958, 65, 386. [Google Scholar] [CrossRef]
- Boser, B.E.; Guyon, I.M.; Vapnik, V.N. Training algorithm for optimal margin classifiers. Proc. Fifth Annu. ACM Work. Comput. Learn. Theory 1992, 144–152. [Google Scholar] [CrossRef]
- Cortes, C.; Vapnik, V. Support-vector network. Mach. Learn. 1995, 20, 273–297. [Google Scholar] [CrossRef]
- Burges, C.J.C. A tutorial on support vector machines for pattern recognition. Data Min. Knowl. Discov. 1998, 2, 121–167. [Google Scholar] [CrossRef]
- Vapnik, V. Statistical Learning Theory, 1st ed.; John Wiley and Sons: New York, NY, USA, 1998. [Google Scholar]
- Osowski, S. Neural Networks for Information Processing; Publishing House of the Warsaw University of Technology: Warszawa, Poland, 2013. (in Polish) [Google Scholar]
- Collobert, R.; Bengio, S. Links between perceptrons, MLPs and SVMs. In Proceedings of the 21st International Conference on Machine Learning, Banff, AB, Canada, 4–8 July 2004; Association for Computing Machinery: New York, NY, USA, 2004; Volume 23. [Google Scholar] [CrossRef]
- Zanaty, E. Support Vector Machines (SVMs) versus Multilayer Perception (MLP) in data classification. Egypt. Inform. J 2012, 13, 177–183. [Google Scholar] [CrossRef]
- Chen, T.; Guestrin, C. XGBoost: A Scalable Tree Boosting System. In Proceedings of the 22nd ACM SIGKDD International Conference on Knowledge Discovery and Data Mining, San Francisco, CA, USA, 13–17 August 2016; pp. 785–794. [Google Scholar] [CrossRef]
- Kaczor, G. Influence of air temperature on sewage temperature in sewerage system and in biological reactor. Infrastruct. Ecol. Rural. Areas 2008, 3, 129–137. [Google Scholar]
- Dymaczewski, Z.; Krajewski, P. Wpływ wybranych enzymów i bakterii na efektywność podczyszczania ścieków w kanalizacji. In Polska Inżynieria Środowiska. Prace, Tom II; Dudzińska, M.R., Pawłowski, A., Eds.; Komitet Inżynierii Środowiska PAN: Lublin, Poland, 2012; Volume 100, pp. 135–150. [Google Scholar]
- Dymaczewski, Z.; Komorowska-Kaufman, M.; Krajewski, P.; Michałkiewicz, M.; Jeż-Walkowiak, J. Determination of potential possibility of organic compounds removal in a sewer system. Rocz. Ochr. Sr. 2016, 18, 518–529. [Google Scholar]
- Dogan, E.; Ates, A.; Yilmaz, E.C.; Eren, B. Application of Artificial Neural Networks to Estimate Wastewater Treatment Plant Inlet Biochemical Oxygen Demand. Environ. Prog. 2008, 27, 439–446. [Google Scholar] [CrossRef]
- Ansari, M.; Othman, F.; El-Shafie, A. Optimized fuzzy inference system to enhance prediction accuracy for influent characteristics of a sewage treatment plant. Sci. Total Environ. 2020, 722, 137878. [Google Scholar] [CrossRef]
- Rousseau, D.; Ve9rdonck, F.; Moerman, O.; Carrette, R.; Thoeye, C.; Meirlaen, J.; Vanrolleghem, P.A. Development of a risk assessment based technique for design/retrofitting of WWTPs. Water Sci. Technol. 2001, 43, 287–294. [Google Scholar] [CrossRef]
- Ebrahimi, M.; Gerber, E.L.; Rockaway, T.D. Temporal performance assessment of wastewater treatment plants by using multivariate statistical analysis. J. Environ. Manage. 2017, 193, 234–246. [Google Scholar] [CrossRef] [PubMed]
- Langergraber, G.; Alex, J.; Weissenbacher, N.; Woerner, D.; Ahnert, M.; Frehmann, T.; Halft, N.; Hobus, L.; Plattes, M.; Spering, V.; et al. Generation of diurnal variation for influent data for dynamic simulation. Water Sci. Technol. 2008, 57, 1483–1486. [Google Scholar] [CrossRef]
- Szeląg, B.; Barbusiński, K.; Studziński, J. Application of the model of sludge volume index forecasting to assess reliability and improvement of wastewater treatment plant operating conditions. Desalin. Water Treat. 2019, 140, 143–154. [Google Scholar] [CrossRef]
- Barbusiński, K.; Szeląg, B.; Studziński, J. Simulation of the influence of wastewater quality indicators and operating parameters of a bioreactor on the variability of nitrogen in outflow and bulking of sludge: Data mining approach. Desalin. Water Treat. 2020, 186, 134–143. [Google Scholar] [CrossRef]
- Bayo, J.; Angosto, J.M.; Serrano-Aniorte, J.; Cascales-Pujalte, J.A.; Fernández-López, C.; López-Castellanos, J. Evaluation of physicochemical parameters influencing bulking episodes in a municipal wastewater treatment plant. WIT Trans. Ecol. Environ. 2006, 95, 531–540. [Google Scholar] [CrossRef]
- Makinia, J.; Rosenwinkel, K.H.; Spering, V. Long-term simulation of the activated sludge process at the Hanover-Gümmerwald pilot WWTP. Water Res. 2005, 39, 1489–1502. [Google Scholar] [CrossRef]


Publisher’s Note: MDPI stays neutral with regard to jurisdictional claims in published maps and institutional affiliations. |
© 2022 by the authors. Licensee MDPI, Basel, Switzerland. This article is an open access article distributed under the terms and conditions of the Creative Commons Attribution (CC BY) license (https://creativecommons.org/licenses/by/4.0/).