Article

Development of a Semi-Empirical Model for Droplet Size Determination of a Three-Channel Spray Nozzle for Pellet Coating Based on the Optical Method Concept

1
Faculty of Pharmacy, University of Ljubljana, Aškerčeva 7, 1000 Ljubljana, Slovenia
2
Sandoz Development Center, Lek Pharmaceuticals d.d., Verovškova 57, 1526 Ljubljana, Slovenia
3
Lek Pharmaceuticals d.d., Kolodvorska 27, 1234 Menges, Slovenia
4
Faculty of Mechanical Engineering, University of Ljubljana, Aškerčeva 6, 1000 Ljubljana, Slovenia
*
Author to whom correspondence should be addressed.
Processes 2022, 10(1), 86; https://doi.org/10.3390/pr10010086
Submission received: 13 December 2021 / Revised: 27 December 2021 / Accepted: 29 December 2021 / Published: 1 January 2022
(This article belongs to the Section Pharmaceutical Processes)

Abstract

:
The purpose of this study was to investigate the droplet size obtained with a three-channel spray nozzle typically used in fluid bed devices and to construct a semi-empirical model for prediction of droplet size. With the aid of a custom-made optical method concept, the impact of the type of polymer and solvents used through dispersion properties (viscosity, density, and surface tension), dispersion flow rate, atomization pressure, and microclimate pressure on droplet size was investigated. A semi-empirical model with adequate predictability for calculating the average droplet size (R2 = 0.90, Q2 = 0.73) and its distribution (R2 = 0.84, Q2 = 0.61) was constructed by employing dimensional analysis and design of experiments. Newtonian and non-Newtonian dispersion and process parameters on laboratory and on production scale were included, thereby enabling constant droplet size irrespective of the scale. Based on the model results, it would be possible to scale-up the atomization process (e.g., coating process) from laboratory to production scale in a systematic fashion, regardless of the type of solvent or polymer used. For the system investigated, this can be performed by understanding the dispersion properties, such as viscosity, density, and surface tension, as well as the following process parameters: dispersion flow rate, atomization, and microclimate pressure.

1. Introduction

During product development, it is essential to identify the appropriate critical material attributes (CMAs) and critical process parameters (CPPs) that ensure the safety, efficacy, and quality of a final product. Identification of CMAs and CPPs ensures that the desired critical quality attributes (CQAs), such as assay, drug dissolution, stability, and so on, are within the desired specification criteria, and, therefore, that the intended performance of the product is continuously ensured [1,2,3,4,5]. Pellet coating is generally considered a critical process step, and it could have a significant influence on CQAs, such as drug dissolution (semi-permeable membrane or enteric coatings), stability of the product (coating with moisture-protective polymers), or even assay and content uniformity, when coating with an active pharmaceutical ingredient (API; i.e., layering) [6,7,8,9]. Furthermore, a coating can be used to mask an unpleasant or bitter taste and therefore improve patient compliance [6,7,8,9,10,11].
A successful coating process depends on a controlled and efficient atomization process, which results in a reproducible and predictable droplet size distribution [10,12,13]. Droplet characteristics impact the uniformity of the barrier membrane thickness as well as the agglomeration tendency [10,14]. Among other parameters, such as product temperature, droplet size is a crucial scale-independent coating process parameter [13,15,16,17]. If droplet size is kept constant, one of the scale-up impacts is omitted, and, consequently, a reproducible scale-up of the coating process is made possible [12].
Droplets are formed during the atomization step: a process by which the liquid is dispersed into droplets. First, a filament is formed, which is subsequently disintegrated into droplets due to liquid-gas instability. The shape and distribution of droplets depends on the properties of the dispersion being sprayed, as well as on the operating conditions and the spray nozzle being used [12,16,18,19,20,21,22]. Based on literature data, several factors influence droplet formation. Surface tension pulls the liquid into a sphere to minimize the surface energy. Similarly, the liquid viscosity exerts a stabilizing influence by opposing any change in system geometry [7,23]. In contrast, aerodynamic forces promote the disruption of the liquid. A new droplet forms when the disruptive forces exceed the consolidating surface tension force [7,22,23].
Various methods can be used to determine droplet characteristics according to the literature. Most of the techniques are based on: laser diffraction [24,25,26], phase-Doppler interferometry [27,28], high resolution photographs and holography [29], particle image velocimetry [30,31], collection of droplets on coated glass [32,33], and light scattering [34]. Laser diffraction yields an overall droplet size distribution across a wide area of a spray cone, whereas the single droplet characteristics, velocities, and directions of the droplets are not measured. Phase-Doppler interferometry results in precise single droplet measurements in a very limited volume of interest in the spray cone. The spatial results are obtained with sequential repositioning of the volume of interest. The benefits of using optical spray patternators and their comparison with a phase-Doppler interferometer are reported by Scheer and Beaumont [35] and Muliadi et al. [36], respectively. However, the results are limited to the integral spraying characteristic of a spray cone cross-section and do not include single droplet information. The spray cone analysis shown in Smyth et al. [37] focuses on the spray nozzle’s geometric design effect, whereas our study is designed to determine the effect of operating conditions on the spraying droplet size and the overall size distribution. A similar technique was presented by Fischer et al. [38], however we have additionally added a high-speed camera and a microscope to the experimental setup, which allows for the recognition of droplets with higher velocities and smaller sizes.
Due to the importance of droplet formation across various industries, several attempts have been made to construct charts, equations, or even a model that predict droplet size based on defined input parameters. One of the first was the study conducted by Nukiyama and Tanasawa [32], which resulted in the widely used Nukiyama–Tansawa (N–T) equation. Later on, a study from 1954 by Shafer and Bovey [18] was published that evaluated the spray nozzle used for atomization of liquid fuels in turbine-type engines using dimensional analysis (DA). Afterward, several studies compared the appropriateness of the N–T equation for the spray nozzles chosen [39,40]. In all cases, overestimation of the N–T equation compared to the experimental results was reported. For example, Canals and Hernandis [40] showed that the equation overemphasizes the role of viscosity. In general, the overestimation of droplet size can be related to the technique for droplet size measurement, which prevented collection of the finer fraction of the aerosol [40].
The absence of a generally applicable equation led to several studies that sought to develop semi-empirical models for the system chosen (Table 1) [7,10,12,16,17,19,20,22]. For example, Thybo et al. [20] were able to construct a model for a single Newtonian dispersion; however, extrapolation to other dispersions was not possible. Petit et al. [22] were able to construct two appropriate models for a bi-fluid nozzle at different distances from the nozzle. According to these models, droplet formation is primarily dependent on operating conditions in the vicinity of the nozzle, whereas dispersion properties prevail further from the nozzle. The influence of distance from the nozzle on droplet size was also confirmed in a study by Aliseda et al. [7]. The model constructed included Newtonian as well as non-Newtonian dispersions; however, the influence of process conditions was not examined. A study by Colorcon [10], which utilized the phase-Doppler technique, showed that process conditions—dispersion flow rate (M) and atomization air pressure (pa)—accounted for more than 60% of the effects on droplet size. The process parameters (M, pa) varied in a broad range, covering both the laboratory and production scale; however, only one dispersion was examined, and only the portion of solids in the dispersion described its properties. Although useful, none of the studies examined included Newtonian and non-Newtonian dispersions (including different polymers) and simultaneously varied the process parameters used on laboratory as well as production scale to thoroughly describe the spraying process upon scale-up.
Despite the limitations described, the N–T empirical equation is still widely used in the pharmaceutical industry today to estimate the average droplet size produced by spray nozzles [12,15,32]:
d = 585 v [ λ ρ ] 0.5 + 597 [ η λ ρ ] 0.45 [ 100 φ l φ g ] 1.5  
where d is the Sauter mean diameter (SMD) of droplets in micrometers, ρ is density in g/cm3, η is viscosity in cP, and λ is surface tension in dyn/cm. The volume flux of air (φg) and the solution (φl) are in cm3/s, and v is the relative velocity between gas and liquid in m/s in the nozzle.
In this study, a semi-empirical model was developed for the pellet coating process in either a laboratory or a production scale Hüttlin device. The first part of the study focuses on the experimental part of drop capturing, and then uses DA and design of experiments (DoE), which allowed the generation of the mathematical model. The controlled and varied quantities are the dispersion characteristics (viscosity (η), density ( ρ ), and surface tension (λ)), as well as process parameters such as dispersion flow rate (M), atomization air pressure (pa), and microclimate air pressure (pm). The ranges and combinations of variables in the experiments are typically adjusted at the laboratory scale and at the production scale. Based on the data collected from droplet sizes concerning the factors investigated, in the next step we focused on developing a semi-empirical model for predicting droplet size and its distribution. The purpose of the model will be predicting the coating process when scaling up from laboratory to production scale, irrespective of the dispersion used. Comparable droplet size on both scales can be achieved by the adjustment of the following parameters: dispersion flow rate (M), atomization air pressure (pa), and microclimate air pressure (pm).

2. Materials and Methods

2.1. Materials: Polymeric Dispersions and Their Rheology

Eight different fluids (Table 2) with different rheological properties were used for the design of experiment (DoE) model construction and testing the model: demineralized water (in-house supply); acetone (Carlo Erba, Milano, Italy); hypromellose (Pharmacoat® 606, Shin-Etsu Chemical Co., Ltd., Chiyoda City, Tokyo, Japan) in ethanol (ethanol 96%, Győr Distillery and Refinery Co. Ltd., Győr, Hungary) and in a mixture of ethanol and water; ethylcellulose (AqualonTM EC N10, Ashland, Wilmington, DE, USA) in ethanol; copolymer of acrylic and methacrylic acid (Eudragit® S, Evonik, Essen, Germany) in ethanol; and hypromellose in water. All dispersions containing a polymer had 20 w/w% of talc (Imerys S.A., Paris, France; based on polymer content) included, whereas for the Eudragit S dispersion, alongside with talc, 10 w/w% of triethyl citrate (Vertellus, Indianapolis, IN, USA) was included as per the manufacturer’s recommendations.

2.1.1. Surface Tension

The measurements of surface tension were performed by the Wilhelmy plate method on a Kruss K100 PL01 tensiometer (Hamburg, Germany). The surface detection speed was 10 mm/min with a sensitivity of 0.005 g and an immersion depth of 5 mm.

2.1.2. Viscosity

The dynamic viscosities of the dispersions were measured on an Anton Paar Physica MCR 301, installed with a CC-27 measuring system. As expected for the Newtonian dispersions, the measured values were constant across all values of shear rate tested (5–250 s−1). However, for the dispersion of 9.3 w/w% of hypromellose in ethanol and water (9:1), the measurements were dependent on the shear stress used, confirming that the dispersion is non-Newtonian. Because the flow in the spray nozzle can be approximated with high shears used in the measurements of viscosity [7], the measured value of viscosity at a high shear rate was used in the model.

2.1.3. Density

The volume displacement measurements of density were performed on a Kruss K100 (Hamburg, Germany), with a DE0601 measuring system. The surface detection speed was 12 mm/min, the surface detection sensitivity was 0.001 g, and the dipping distance was 15 to 25 mm.

2.2. Design of Experiment and Dimensional Analysis to Support the Experimental Setup

In this study, DoE was used to simultaneously investigate multiple potential influences and determine the relationship between factors affecting the droplet size in ranges frequently used in the pharmaceutical industry.
The dispersions used during experiments were characterized by determining the three well-established thermodynamic properties that influence droplet formation: viscosity, surface tension, and density. To include both Newtonian and non-Newtonian dispersions, a diverse range of polymers and solvents is included. The following factors were varied:
-
Solvents: water, acetone, ethanol, and mixture of ethanol and water
-
Polymer used and its w/w%:
Hypromellose: 6.5–9.3
Ethylcellulose: 4.0
Copolymer of acrylic and methacrylic acid: 1.8–10.0
The combinations of solvents and polymers mentioned above resulted in dispersions with a broad range of thermodynamic properties, which were used for construction of the model:
-
Viscosity (η): 0.3–225 mPas
-
Surface tension (λ): 23.7–72.0 mN/m
-
Density ( ρ ): 790–1030 kg/m3
Alongside varying dispersion properties, a broad range of spray nozzle and dispersion flow operating conditions were used to support the development of a universal model for the chosen spray nozzle, which could be applied for different pharmaceutical products across different scales. Moreover, the operating conditions chosen covered the typical conditions found at laboratory and production scale:
-
Dispersion flow (M): 12–160 g/min
-
Atomization air pressure (pa): 1.1–3.1 bar
-
Microclimate air pressure (pm): 0.1–2.6 bar
The spray nozzle diameter (D) was 1.2 mm and was kept constant in this study. Nevertheless, spray nozzle diameter was used as one of the factors in the dimensionless numbers. When using a spray nozzle with a different diameter, this can easily be implemented in the new model creation. All experiments were carried out at room temperature (25 °C).
These material properties and process parameters impact the process of droplet formation and can be expressed by a general equation with eight quantities:
F   ( M , p a , p m , ρ , λ , η , d , D ) = 0
where F merely denotes “function of” and d denotes droplet diameter, hereafter referred to as droplet size. By applying Buckingham’s Pi theorem [22,41,42] for the three fundamental dimensions of time, mass, and length, Equation (2) can be described by 8 − 3 = 5 reduced quantities:
ϑ = d D
α = M D 2   · p a · ρ
β = D ρ · λ η 2
γ = p m p a
δ = λ D · p a
where M = dispersion flow, D = diameter of spray nozzle, pa = atomization air pressure, ρ = density, λ = surface tension, η = viscosity, and pm = microclimate air pressure.
The dimensionless numbers defined are based on other published literature, investigating spray nozzle performance [18] and historically established dimensionless numbers in fluid dynamics. All dimensionless quantities, apart from γ and ϑ , can be expressed by various combinations of Euler, Reynolds, and Weber numbers, whereas γ and ϑ reflect the specific geometry and setup of the three-channel nozzle.
Using DoE, the following functional form was studied:
ϑ = F ( α ,   β ,   γ ,   δ )  
Two sets of experimental designs were constructed with the aid of MODDE 12 software (Umetrics, Umeå, Sweden). Initially, a 24 full factorial design was employed to screen the significant factors (linear and interaction model). Three experiments were replicated at the center point (N17, N18, and N19) for the determination of repeatability, resulting in 19 experiments. Based on the analysis of the full factorial design, a complete D-optimal design was then applied to augment the initial design and allow estimation of the quadratic terms. In summary, nine additional experiments were performed.

2.3. Droplet Size Measurements

A high-speed visualization system equipped with diffuse back illumination and a microscope was utilized, because it allows a relatively large area of observation with a possibility of determining the characteristics of single micron-sized droplets traveling at high velocities. The assembled experimental setup allows for measurement of droplet size, velocity, and movement direction, which makes possible an in-depth assessment of the spray cone (refer to Section 3.1 Definition of Measuring Conditions for further details). The size of the visualized area in the spray cone was 3.30 × 2.64 mm, and the location of visualization was determined in the axis of the spray cone with a 30 mm distance from the nozzle outlet. Approximately 1000 high-speed images were recorded after an appropriate back illumination was set and steady-state spraying conditions were achieved.

2.3.1. Experimental Setup

The experimental setup presented in Figure 1 is comprised of the following components: a magnetic stirrer for agitating the working dispersion, a peristaltic pump to provide the required dispersion flow, a spray nozzle, a compressed air container, pressure sensors (denoted with p1 and p2) and volumetric flow sensors (denoted with q1 and q2) for atomizing and microclimate air flows, a high-speed camera mounted on a microscope, and a spraying chamber with an outlet fan. The high-speed camera and the measuring sensors are electrically connected to separate computers, which allow reliable and precise measurements of the pressure and volumetric flow along with a high-speed visualization of the droplets exiting the spray nozzle.
Various polymeric dispersions with different compounds and their ratios were prepared (Table 2), and, afterward, the visualization experiments were carried out with the experimental setup presented in Figure 1. The dispersions were mixed in the transport container and poured into the glass container on top of the magnetic stirrer to ensure a homogeneous sample. A calibration curve was made for the flow rate achieved with the peristaltic pump used during the experiments.
The three-channel spray nozzle used (Hüttlin, GmbH, Schopfheim, Germany) had three inlet ports: one for the spray dispersion and two for the nebulizer air inlet flows (Figure 2). Compared to a two-channel fluid nozzle, it provides a stabilizing protecting microclimate around the spray.
The same spray nozzle design is used in laboratory (Hüttlin HKC-5-TJ, Hüttlin GmbH, Schopfheim, Germany) and production scale equipment (Hüttlin HKC 200/200, Hüttlin GmbH, Schopfheim, Germany), with the differences in the length of the spray nozzle and the number of spray nozzles used (two at the laboratory scale and 12 spray nozzles at the production scale). The pressurized air flowed coaxially while the dispersion was injected in a capillary tube in the axis of the spray nozzle. Because the volumetric flow through the spray nozzle depends on the pressure, as well as on the spray nozzle and tubing pressure drops, we also incorporated volumetric flow sensors to have all the relevant operating conditions measured. The microscope was equipped with a high-speed camera and an illumination source and positioned to visualize the desired area of interest in the spray cone. The spraying chamber has an outlet fan mounted at the back to minimize the potential pressure rise in the chamber at high dispersion and air flow.

2.3.2. Image Analysis

A high-speed Photron Fastcam Mini UX100 camera was used at 4000 fps and a shutter speed of 3.91 µs. The shutter speed corresponds to 255,000 fps; however, a lower frame rate was set to observe droplets during a larger time span. The high-speed visualizations were made after the spray cone achieved a steady state. The analysis of the images acquired was performed with a computer algorithm if the quality of the visualization was sufficient. Some of the operating conditions resulted in the formation of very small droplets with a high velocity, both of which are difficult with respect to the visualization quality. The high-speed images acquired from such unfavorable conditions were analyzed with visual recognition only. The originally acquired images and both analyses are presented in Figure 3.
The droplets in the spray cone are presented as lines in the high-speed images analyzed, due to fact that the high velocity of the droplets and the shutter speed used result in blurring the droplets in the direction of their movement. However, the droplets were confirmed to be spherical in preliminary testing. Therefore, the used experimental equipment and analysis are adequate to analyze not only the droplet size, but also their velocity and direction of travel, which provided additional insight into the spraying properties of the nozzle. The visual recognition is presented in Figure 3b and was performed by determining four points for each droplet, which allowed the calculation of the three droplet properties. The computer algorithm developed was used to acquire the same droplet quantities (size, velocity, and direction) and made possible better consistency and a larger number of droplets analyzed if the visualization resulted in high-quality images, as seen in Figure 3c. The upper row of images in Figure 3 are the originally acquired images with the size of 3.3 × 2.6 mm, whereas the bottom row is magnified approximately three times.

3. Results and Discussion

3.1. Definition of Measuring Conditions

As described in the literature, the size and velocity of the droplets change with the distance from the spray nozzle [12,18,22,23]. Therefore, the influence of the position relative to the spray nozzle (distance from the nozzle and from the spraying axis) was first inspected by measuring the average droplet size, velocity, and size distribution. For this purpose, a dispersion of 6.5 w/w% of hypromellose in ethanol was used with an atomization pressure of 2.5 bar, the microclimate pressure was 1.1 bar, and the dispersion flow was set to 70 g/min. The positions tested were chosen based on experiments performed in other studies [7,18,22,23] and expected experimental conditions, taking into account the experimental limitations (wetting of the lens). Hence, the distance from the spray nozzle varied from 20 to 40 mm, and the distance from the spraying axis varied from 0 to 20 mm (Figure 4).
Similar to the study by Mueller and Kleinebude [12], there was no significant effect of droplet position detected in the scope of the droplet size (in either the radial or axial direction). In our study, the average droplet sizes ranged from 10.4 to 14.4 µm across the positions studied. However, these observations are contrary to some published studies [7,18,23]. This could be attributed to the much smaller distance examined when compared to the cases of Aliseda et al. [7] (0–140 mm) or Thybo et al. [20] (20–150 mm), who showed an increase in droplet size at the vicinity of the spraying nozzle, whereas the size remained constant further away. Having a constant droplet size in the ranges tested confirms that the measurements performed were inside the constant part of the spray zone. In contrast to the findings regarding droplet size, the results of droplet velocities at nine different positions observed varied, confirming the findings by Vesey et al. [10] and Mueller and Kleinebudde [12]. Hence, the velocities of droplets were higher near the axis of the spray cone and lower toward the edge of the cone. Based on literature survey, the distribution of droplet sizes with respect to the position in the spray cone has not been investigated in the publications currently available. In our case, the distribution of droplet sizes was comparable irrespective of the position within the spray cone, similar to the findings for average droplet size.
A similar distribution of droplet sizes within the spray cone was confirmed by Levene’s test of equal variances, the nonparametric Mood’s median, and the Kruskal–Wallis test for equal medians. Because there were no significant differences, neither for the average droplet size nor for the droplet size distribution, that could be attributed to the position of monitoring, all further experiments were conducted in the axis of the spray cone at a 30 mm distance from the spray nozzle.
It must be noted that, alongside the position of monitoring, an important factor that must be taken into account is the spray nozzle quality. Defects such as poor surface finish, orifice imperfections, plugged or contaminated flow passages, and eccentric alignment of key spray nozzle components may significantly impact the spray pattern and droplet size [23]. To minimize these influences, the same spray nozzle was used throughout the study.
The process parameters used were chosen based on practical experience with numerous products and processes developed at the laboratory and production scale.

3.2. Statistical Analysis

Dimensional analysis was used to reduce the number of experiments needed to successfully evaluate all potential factors [21,22,41,42], as explained in Section 2.2. The experiments conducted (physicochemical properties of dispersions used; process parameters), corresponding reduced quantities, and results (average droplet size, calculated as the average of ln(d10/D) and standard deviation of droplet size, which is also equivalent to the standard deviation of ln(d10/D) of the complete D-optimal design of DoE, are shown in Table 3. The two droplet size parameters, E[ln(d10/D)] and SD(ln(d10/D)), were defined on a logarithmic scale due to the expected log-normal size distribution of the droplets.
In the majority of studies only average droplet size was determined [10,12,16], which does not offer a complete understanding of the process because a range of droplet sizes is present in the spray. The droplets sprayed have various sizes, resulting in different distributions (Figure S5).
For example, even though an average droplet size is determined, the distribution and resulting percent of potential spray drying or agglomeration can be vastly different. The extent of spray drying is greatly influenced by the amount of smaller droplets present. In the case of coating with API, spray drying can result in a lower assay, whereas in the case of enteric coating, an inadequate drug-release profile can be a consequence of ineffective membranes [7,15,43,44]. The potential for spray drying is greater in the case of organic solvents, which are frequently used in the case of pellet coatings, as compared to aqueous-based dispersions [43,44]. Alternatively, if a great amount of larger droplets, with larger volume, is present, this can result in a higher extent of agglomeration or, in extreme cases, the over-wetting or dissolving of the substrate being coated [10,14,44]. Therefore, insight regarding the entire distribution can offer a better understanding of the process investigated.
Assumption of a log-normal distribution was the basis used for model creation. The obtained droplet size distribution data supports this assumption (Figure S6). A log-normal distribution of droplets was also determined by other studies [7,13,17], although some studies report normal [13], unimodal [21] and upper-limit distributions [45].
An additional advantage of characterizing the droplet size distribution within a spray cone with a chosen distribution function is the representation of the entire distribution with a few parameters. In the majority of cases, these are the average ( μ ) and the spread of sizes (σ) [17,23]. Because droplet size followed a log-normal distribution in our case, the following quantities were modeled:
μ = E [ ln ( d 10 D ) ]
and
σ = S D [ ln ( d 10 D ) ]
Based on measurements, it can be concluded that, although average droplet size is the same, the size distribution of droplets can be significantly different (Figure S5a). Furthermore, the same σ results in different distributions, if the average differs (Figure S5c). Therefore, both μ and σ have to be kept constant during scale-up of the process in order to obtain a similar distribution of droplets at the laboratory and production scale.
In addition to the distribution of the droplet diameter, the distribution of volume is also important (Figure S5b,d) and is frequently used in other studies because this quantity is significant for the amount of dispersion material that the droplets are carrying and is the output parameter from measurements made with laser diffraction.

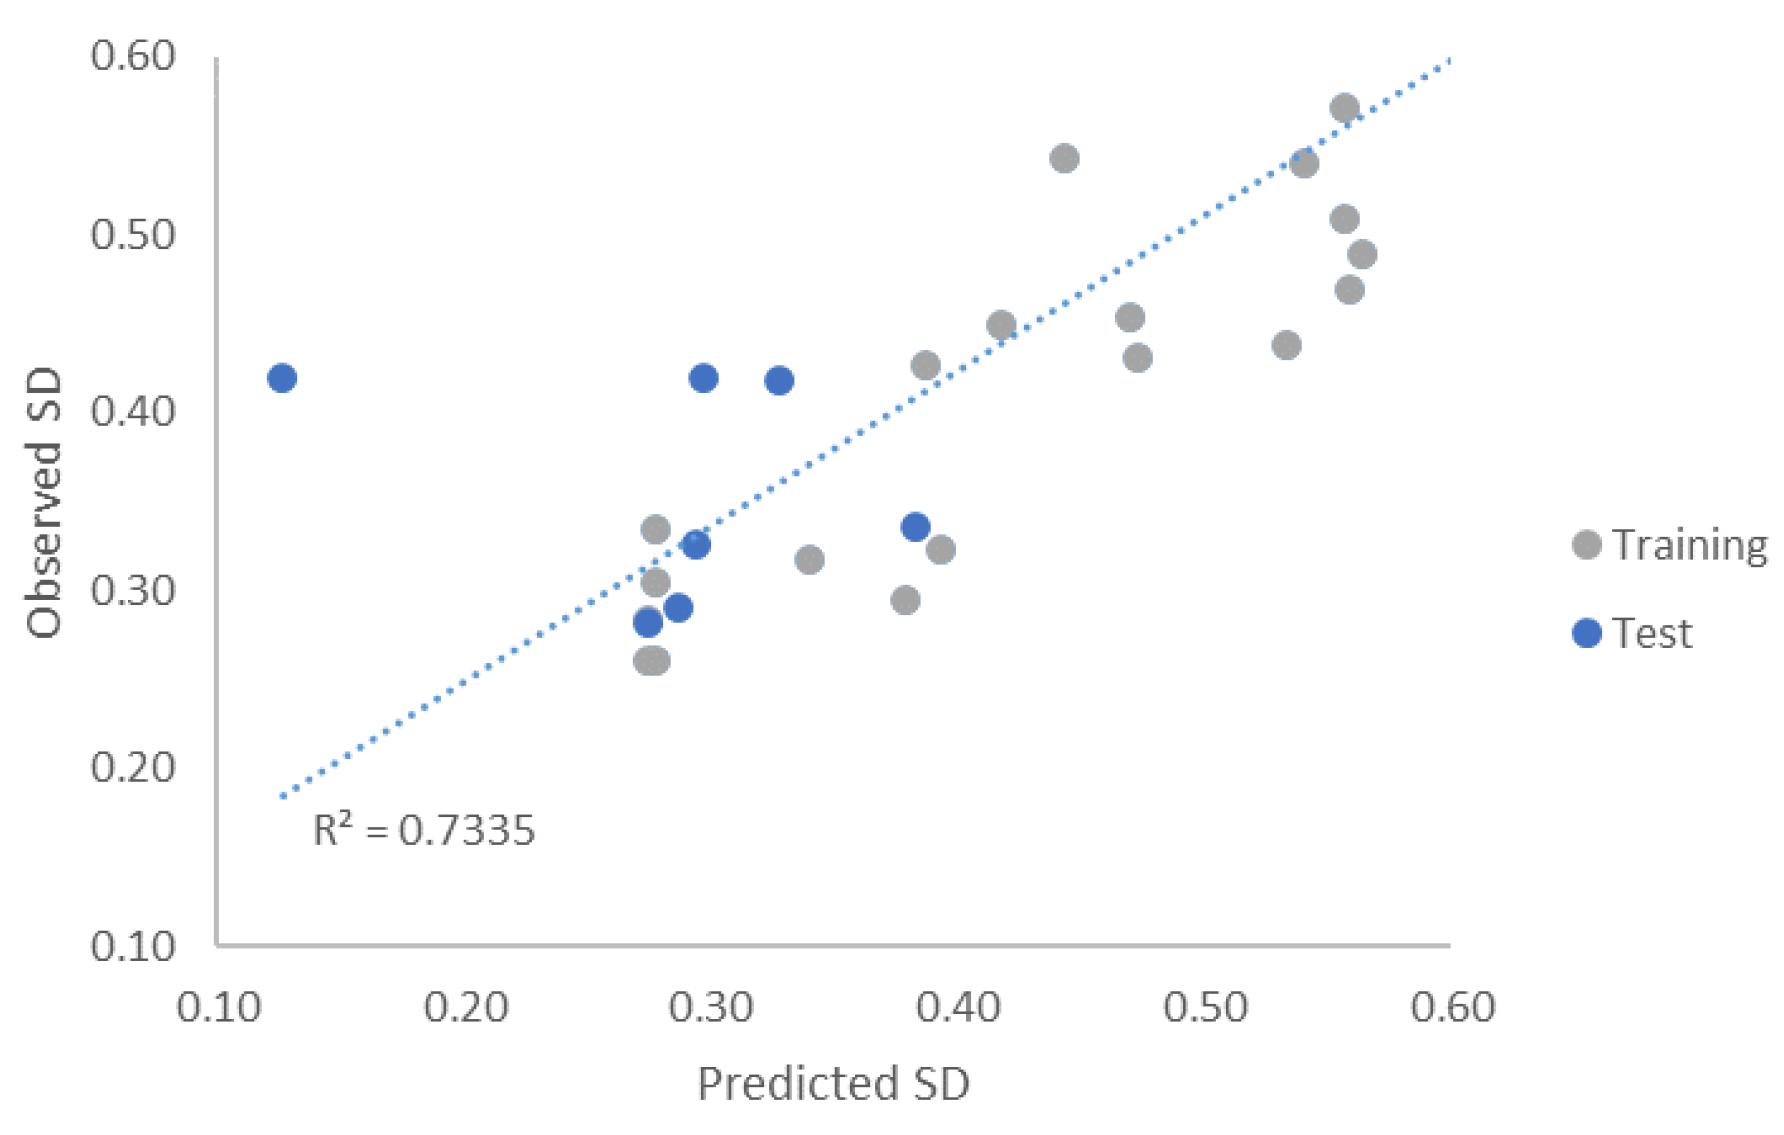
3.3. Model Construction

In our study, the final model for average droplet size was established for the arithmetic average diameter (d10), or number-based diameter, as other diameters provided a lower coefficient of determination (R2) and a lower cross-validation coefficient of determination (Q2) (please refer to the Supplementary Section S1 for further details regarding model construction and model properties). Models constructed for the average droplet size and their standard deviation can be estimated as good (Figures S1 and S3). All reduced factors (lnα, lnβ, lnγ, and lnδ) contribute to the average droplet size and their distribution. Based on these factors and their relation to the underlying physical quantities, we confirmed that the process of droplet formation is complex and dependent on various mechanisms, as discussed in the published literature [10,12,16,22,40]. The influence of the process parameters can be deduced with the aid of Figures S2 and S4.
Because reduced quantities were used for the DoE, the interpretation of influences of basic physiochemical properties and process parameters is demanding. Therefore, alongside the basic model properties presented in the Supplementary Section S1, the final equations for the average and the standard deviation of droplet size were extracted from MODDE software by scaling and centering the responses included as significant in the models constructed (Table 4):
μ = E [ ln ( d 10 D ) ] = k 1 · ln α + k 2 · ln β + k 3 · ln γ + k 4 · ln δ + k 5 · ( ln β ) 2 + k 6 · ( ln γ ) 2 + k 7 · ( ln δ ) 2 + k 8 · ln α · ln δ + k 9 · ln β · ln γ + k 10 = ln [ k 10 · α k 1 + k 8 · ln δ · β k 2 + k 5 · ln β + k 9 ln γ · γ k 3 + k 6 · ln γ · δ k 4 + k 7 · ln δ ]
ln σ = ln ( SD [ ln ( d 10 D ) ] ) = c 1 · ln α + c 2 · ln β + c 3 · ln γ + c 4 · ln δ + c 5 · ( ln α ) 2 + c 6 · ( ln γ ) 2 + c 7 · ( ln δ ) 2 + c 8 · ln β · ln δ + c 9 = ln [ c 9 · α c 1 + c 5 · ln α · β c 2 + c 8 · ln δ · γ c 3 + c 6 · ln γ · δ c 4 + c 7 · ln δ ]
The scale-up of the fluid bed coating process is simplified because the distribution of droplet size can be kept constant when transferring from laboratory to production scale, thereby eliminating one of the various influences on the overall fluid bed coating process. First, using Equation (11), by inputting the dispersion properties and process parameters used on the laboratory scale, the average droplet size on the laboratory scale is determined. Second, a similar procedure is repeated with Equation (12), where the standard deviation is calculated. With this, insight into the overall droplet size distribution is gained. Finally, for scale-up, the droplet size can be kept constant if process parameters are adapted according to the equations above. However, in this case, droplet size and its distribution are known in Equations (11) and (12), and the process parameters (dispersion flow, atomization air pressure, microclimate air pressure, and nozzle diameter) are adapted.
In addition to the model validation performed at model construction, supplementary testing of the model was performed with the experiment presented in Table 5.
Despite the work done by Thybo et al. [20] and Lefebvre [46,47], who were unable to develop a single equation for correlation of all experimental data, our study shows a good fit for the average droplet size for the investigated non-Newtonian, as well as for Newtonian, dispersions at different process parameters (Table 5, Figure 5). Such an observation confirms the usefulness of our model within the defined ranges. In addition, it is enhanced by the high values of the model quality diagnostic parameters, as demonstrated in Figure S1. Nevertheless, extrapolation outside of the tested range results in a high error and is therefore not justified.
Alongside prediction of the average droplet size by the model developed in this study, predictions of SMD by the N–T equation, as well as calculation of SMD from experimental data and calculation of SMD based on the model constructed, were conducted (Table 5). Comparison of both calculations reveals that the predictions by the N–T equation deviate markedly from the experimental SMD results, verifying the findings published in other research [39,40] that the N–T equation is not appropriate for predicting droplet size in our range of experimental conditions because it overestimates the droplet size. Similarly as concluded by Canals and Hernandis [40], we confirmed that the N–T equation overemphasizes the role of viscosity because the greatest gap between experimental and predicted results was obtained in Experiment D2, in which a non-Newtonian dispersion was used. Nevertheless, the N–T equation can still be a helpful tool for relative comparison of droplet sizes at different conditions, where absolute values are not essential.
In addition, an evaluation of predicting the SD of the average droplet size was made and is presented on an observed versus predicted graph (Figure 6). Similarly, as in the case of prediction of droplet size, a satisfactory trend is achieved. Lower fit can be attributed to the non-optimal determination of droplet sizes (as described in Section 2.3.2), which can introduce biases into the distribution measured.

3.4. Simplification of Generated Models, Extraction of Basic Physio Chemical Influences, and Comparison with N–T

Finally, to see the trends of changing physical quantities on droplet size, Equations (11) and (12) were simplified and transformed from d10 to SMD with the aid of Equation (13).
S M D = d 32 = 0 x 3 P ( x ) d x 0 x 2 P ( x ) d x = e 3 μ + 9 2 σ 2 e 2 μ + 4 2 σ 2 = e μ + 5 2 σ 2
The following approximations were taken into account: SD of droplet size was taken to be close to zero, and, because the range for the quantities lnα, lnβ, lnγ, and lnδ is not wide, the average values for those quantities were taken into account. The following equation was obtained:
S M D = k 10 · D 3.67 · λ 3.11 · p a 2.90 · p m 0.38 · M 0.35 · η 0.26 · ρ   0.04 · ( D · ρ · λ η 2 ) 0.00927 ln ( D · ρ · λ η 2 )  
As expected, surface tension and atomization air pressure exert the greatest influence on droplet size. The influence of atomization air pressure is anticipated, and an increase in the pressures leads to a lower droplet size, which is in accordance with literature [7,10,13,21,22,43]. A dominant effect of atomization air pressure confirms the theoretical proposition that atomization air is responsible for the disintegration of filaments into liquids, whereas microclimate air pressure forms a protection cover around the spray cone. Based on theory and experimental results [7], the influence of microclimate air pressures should be minimal. However, following the manufacturer’s recommendations, this was changed proportionally with the atomization air, and, therefore, its influence was also detected, while being significantly lower in comparison to atomization air pressure. Surface tension counteracts the process of stretching and is thus opposed to the creation of new liquid surfaces subsequent to droplet formation. In line with this, based on experimental results, a positive correlation was confirmed between surface tension and droplet size, similarly as in the vast majority of the published literature [20,21,22,23,40]. Surprisingly, the influence of nozzle diameter is deemed high, despite the fact that it was kept constant throughout all the experiments conducted. The published literature presents contradictory findings regarding nozzle diameter: in some instances this influence was confirmed [20,21], whereas in others a lack of influence was observed [7,19,43]. This gap could be attributed to the different designs of the nozzles investigated. Similarly, the influence of viscosity is not in line with expectations or the majority of the published literature [32,48,49] because it shows a negative correlation with droplet size. Uncertainty regarding viscosity was also reported in studies conducted by Mandato et al. [21] and Aliseda et al. [7], where the definite influence of viscosity on droplet size could not be determined because it was dependent on surface tension and vice versa. Combining Newtonian and non-Newtonian dispersions could also be a contributing factor to the unexpected results. For non-Newtonian dispersion, viscosity was measured at a shear stress of 250 s−1; however, shear stress in the nozzle can be even higher, and, consequently, the actual viscosities are even lower. Despite the discrepancy with the majority of the published literature, as shown in Figure 5, the prediction of droplet size complies with the actual values observed on the test set. The influence of dispersion flow is investigated simultaneously with atomization air pressure in the majority of the published studies; increasing the air–liquid velocity difference, for instance, by lowering the liquid flow rate, results in smaller droplet size [14,19,20,22,32,34], as is the case in our study. The influence of density on droplet formation has not been totally elucidated yet, which can be connected to the similar density values of various dispersions [23]. Some were unable to quantify the influence of density on droplet size formation [22], whereas others suggest that increasing the density leads to more compact sprays that are less exposed to frictional forces, and, consequently, larger droplets are formed [21,48,49]. In our study, the density of the dispersions had an insignificant effect on the droplet formation, as its exponent value in Equation (14) is close to 0 (−0.04).
When comparing the N–T Equation (1) and Equation (14) derived from experimental results and the consequent model constructed, the following conclusions can be drawn:
  • The majority of the influences of the parameters are comparable: M and λ exhibit a positive correlation, whereas ρ , pa, and pm show a negative correlation with droplet size.
  • The influence of viscosity has a negative correlation with droplet size based on our results and has a positive correlation with droplet size based on the N–T. However, based on the experimental results in this study, the influence of viscosity is much lower compared with the N–T equation, which was also emphasized by other authors [39].
  • Similarly, as for viscosity, compared with the N–T equation, an opposite relationship was established in our model for surface tension. Increasing the surface tension leads to a larger droplet size, which is in line with the published literature [20,21,22,23,40].

4. Conclusions

To scale-up a pellet coating process in a Hüttlin fluid bed coater from laboratory to production scale, a three-channel nozzle was evaluated by the measurements of droplet size and droplet size distributions with a high-speed camera in the experimental setup described.
Various dispersion properties and process parameters, as well as experimental set-up conditions, were tested. The study confirmed findings from other authors that droplet size formation is a complex process and is dependent on all the factors investigated: dispersion properties (viscosity, density, and surface tension), dispersion flow rate, atomization pressure, and microclimate pressure.
A semi-empirical model for predicting the average diameter of droplet size and its standard deviation was developed, simultaneously including laboratory and production scale. Furthermore, the model constructed successfully describes the change in average droplet size and the standard deviation for both Newtonian and the investigated non-Newtonian dispersion. By determining the basic properties of the dispersion, such as viscosity, density, and surface tension, irrespective of the polymer or solvent used, the average droplet size can be kept constant during scale-up.
In addition, exploration of the influence of physicochemical properties and process parameters was extracted from the model, and a comparison was made with theoretical findings and the published research. Conformity to both was confirmed for atomization and microclimate air pressure, surface tension, and dispersion flow.
In summary, the model obtained confirms that a universal model can be built for the spray nozzle chosen. This model will contribute to higher predictability of the scale-up process, directly from laboratory to production scale, because one of the important scale-independent parameters in the coating process, droplet size, can be kept constant.

Supplementary Materials

The following supporting information can be downloaded at: https://www.mdpi.com/article/10.3390/pr10010086/s1, Section S1: Model construction, Figure S1: Overview of the model for average droplet size. (a) summary of regression analysis: Column 1: R2 = model fit, Column 2: Q2 = model predictability, Column 3: model validity, and Column 4: model reproducibility; (b) factor effect plots.; Figure S2: 4D response contour plots for E [ ln ( d 10 D ) ] in correlation with reduced quantities lnα, lnβ, lnγ, and lnδ. lnα and lnδ are presented at minimum, middle, and maximum value, and lnβ and lnγ are presented throughout the entire range tested; Figure S3: Overview of the model for standard deviation of diameter of droplet size. (a) summary of regression analysis: Column 1: R2 = model fit, Column 2: Q2 = model predictability, Column 3: model validity, and Column 4: model reproducibility; (b) factor effect plots; Figure S4: 4D response contour plots for the standard deviation of average diameter of droplet size in correlation with reduced quantities lnα, lnβ, lnγ, and lnδ. lnα and lnδ are presented at minimum, middle, and maximum value, and lnβ and lnγ are presented throughout the entire range tested; Figure S5: Size and volume distribution of droplets at different averages (µ = E[ln(x)]) and standard deviations (σ = SD[ln(x)]). Droplets in the top row have the same log-scale mean size but different spread of sizes. Droplets in the bottom row have the same log-scale spread of sizes, but different mean size; Figure S6: Representation of the empirical droplet size distribution of Experiment N2 after logarithmic transformation as a normal probability plot. The transformed distribution follows the normal distribution (red line with confidence bands).

Author Contributions

Conceptualization, S.V., A.B., A.S., M.H., B.J. and I.G.; data curation, S.V., A.B. and A.S.; investigation, S.V., A.B. and A.S.; methodology, S.V., A.B., A.S. and M.H.; supervision, M.H., B.J. and I.G.; visualization, S.V., A.B. and A.S.; writing—original draft, S.V., A.B. and A.S.; writing—review & editing, S.V., A.B., A.S., M.H., B.J. and I.G. All authors have read and agreed to the published version of the manuscript.

Funding

This research received no external funding.

Institutional Review Board Statement

Not applicable.

Informed Consent Statement

Not applicable.

Data Availability Statement

The data presented in this study are available in this article.

Acknowledgments

The authors express special thanks to Luka Peternel and all coworkers from Lek Pharmaceuticals d.d., who greatly contributed to this study. The authors acknowledge financial support from the Slovenian Research Agency (research core funding project Nr. P2-0223). Moreover, special thanks to Odon Planinšek and Žiga Urlep for their contributions and reviewing the manuscript. The authors are thankful to Lek Pharmaceuticals d.d. for the financial support and materials supplied for this study.

Conflicts of Interest

The authors declare no conflict of interest.

References

  1. Gabrielsson, J.; Lindberg, N.O.; Lundstedt, T. Multivariate methods in pharmaceutical applications. J. Chemom. 2002, 16, 141–160. [Google Scholar] [CrossRef]
  2. Huang, J.; Kaul, G.; Cai, C.; Chatlapalli, R.; Hernandez-Abad, P.; Ghosh, K.; Nagi, A. Quality by design case study: An integrated multivariate approach to drug product and process development. Int. J. Pharm. 2009, 382, 23–32. [Google Scholar] [CrossRef] [PubMed]
  3. Korakianiti, E.; Rekkas, D. Statistical thinking and knowledge management for quality-driven design and manufacturing in pharmaceuticals. Pharm. Res. 2011, 28, 1465–1479. [Google Scholar] [CrossRef]
  4. Mitchell, M. Determining criticality—Process parameters and quality attributes part III: Process control strategies—Criticality throughout the lifecycle. BioPharm Int. 2014, 27, 26–35. [Google Scholar]
  5. Juckers, A.; Knerr, P.; Harms, F.; Strube, J. Advanced process analytical technology in combination with process modeling for endpoint and model parameter determination in lyophilization process design and optimization. Processes 2021, 9, 1600. [Google Scholar] [CrossRef]
  6. Missaghi, S.; Fassihi, R. A novel approach in the assessment of polymeric film formation and film adhesion on different pharmaceutical solid substrates. AAPS PharmSciTech 2004, 5, 32–39. [Google Scholar] [CrossRef] [Green Version]
  7. Aliseda, A.; Hopfinger, E.J.; Lasheras, J.C.; Kremer, D.M.; Berchielli, A.; Connolly, E.K. Atomization of viscous and non-newtonian liquids by a coaxial, high-speed gas jet. Experiments and droplet size modeling. Int. J. Multiph. Flow 2008, 34, 161–175. [Google Scholar] [CrossRef] [Green Version]
  8. Marković, S.; Poljanec, K.; Kerč, J.; Horvat, M. In-Line NIR monitoring of key characteristics of enteric coated pellets. Eur. J. Pharm. Biopharm. 2014, 88, 847–855. [Google Scholar] [CrossRef] [PubMed]
  9. Hîrjau, M.; Miron, D.S.; Anut, V.; Lupuliasa, D.; Ghica, M.V.; Jinga, V.; Dinu-Pîrvu, C.E. Evaluation of experimental multi-particulate polymer-coated drug delivery systems with meloxicam. Coatings 2020, 10, 490. [Google Scholar] [CrossRef]
  10. Vesey, C.; Cronlein, J.; Breuer, A.; Gerstner, S. Fluid Bed Nozzle Spray Characterization of an Aqueous Ethylcellulose Dispersion for Particle Taste-Masking Applications. AAPS Poster Reprint. 2014. Available online: https://www.colorcon.com/es/products-formulation/all-products/download/312/2928/34?method=view (accessed on 13 September 2020).
  11. Zhang, R.; Hoffmann, T.; Tsotsas, E. Novel technique for coating of fine particles using fluidized bed and aerosol atomizer. Processes 2020, 8, 1525. [Google Scholar] [CrossRef]
  12. Mueller, R.; Kleinebudde, P. Comparison of a laboratory and a production coating spray gun with respect to scale-up. AAPS PharmSciTech 2007, 8, E21–E31. [Google Scholar] [CrossRef] [Green Version]
  13. Ehlers, H.; Larjo, J.; Antikainen, O.; Räikkönen, H.; Heinämäki, J.; Yliruusi, J. In Situ droplet size and speed determination in a fluid-bed granulator. Int. J. Pharm. 2010, 391, 148–154. [Google Scholar] [CrossRef]
  14. Seo, A.; Holm, P.; Schafer, T. Effects of droplet size and type of binder on the agglomerate growth mechanisms by melt agglomeration in a fluidised bed. Eur. J. Pharm. Sci. 2002, 16, 95–105. [Google Scholar] [CrossRef]
  15. Debevec, V.; Ljubin, T.S.; Jeraj, Ž.; Peterka, T.R.; Bratuž, B.; Gašperlin, D.; Srčič, S.; Horvat, M. Step-Wise approach to developing a scale-independent design space for functional tablet coating process. Drug Dev. Ind. Pharm. 2020, 46, 566–575. [Google Scholar] [CrossRef] [PubMed]
  16. Dennison, T.J.; Smith, J.; Hofmann, M.P.; Bland, C.E.; Badhan, R.K.; Al-Khattawi, A.; Mohammed, A.R. Design of experiments to study the impact of process parameters on droplet size and development of non-invasive imaging techniques in tablet coating. PLoS ONE 2016, 11, e0157267. [Google Scholar] [CrossRef]
  17. Gauno, M.H.; Larsen, C.C.; Vilhelmsen, T.; Moller-Sonnergaard, J.; Wittendorff, J.; Rantanen, J. Evaluation of droplet size distributions using univariate and multivariate approaches. Pharm. Dev. Technol. 2013, 18, 926–934. [Google Scholar] [CrossRef] [PubMed]
  18. Shafer, M.R.; Bovey, H. Applications of Dimensional Analysis to Spray-Nozzle Performance Data. J. Res. Natl. Bur. Stand. 1954, 52, 141–147. [Google Scholar] [CrossRef]
  19. Schoefer, O.; Worts, T. Control of fluidized bed granulation, estimation of droplet size of atomized binder solution. Arch. Pharm. Chem. Sci. 1977, 2, 178–193. [Google Scholar]
  20. Thybo, P.; Hovgaard, L.; Andersen, S.K.; Lindeløv, J.S. Droplet size measurements for spray dryer scale-up. Pharm. Dev. Technol. 2008, 13, 93–104. [Google Scholar] [CrossRef] [PubMed]
  21. Mandato, S.; Rondet, E.; Delaplace, G.; Barkouti, A.; Galet, L.; Accart, P.; Ruiz, T.; Cuq, B. Liquids’ atomization with two different nozzles: Modeling of the effects of some processing and formulation conditions by dimensional analysis. Powder Technol. 2012, 224, 323–330. [Google Scholar] [CrossRef] [Green Version]
  22. Petit, J.; Méjean, S.; Accart, P.; Galet, L.; Schuck, P.; Le Floch-Fouéré, C.; Delaplace, G. A dimensional analysis approach for modelling the size of droplets formed by bi-fluid atomisation. J. Food Eng. 2015, 149, 237–247. [Google Scholar] [CrossRef]
  23. Lefebvre, A.H.; Mcdonell, V.G. Atomization and Sprays; CRC Press: Boca Raton, FL, USA, 2017. [Google Scholar]
  24. Dumouchel, C.; Yongyingsakthavorn, P.; Cousin, J. Light multiple scattering correction of laser-diffraction spray drop-size distribution measurements. Int. J. Multiph. Flow 2009, 35, 277–287. [Google Scholar] [CrossRef]
  25. Medendorp, J.; Bric, J.; Connelly, G.; Tolton, K.; Warman, M. Development and beyond: Strategy for long-term maintenance of an online laser diffraction particle size method in a spray drying manufacturing process. J. Pharm. Biomed. Anal. 2015, 112, 79–84. [Google Scholar] [CrossRef]
  26. Bian, J.; Zhang, D.; Sun, R.; Wu, Y.; Tian, W.; Su, G.H.; Qiu, S. Experimental study on spray characteristics of pressure-swirl nozzle in China advanced PWR containment. Nucl. Eng. Des. 2019, 350, 158–175. [Google Scholar] [CrossRef]
  27. Song, J.G.; Cain, J.; Lee, C.C. Liquid Jets in Subsonic Air Crossflow at Elevated Pressure. J. Eng. Gas Turbines Power 2015, 137, 041502. [Google Scholar] [CrossRef]
  28. Kong, L.; Lan, T.; Chen, J.; Wang, K.; Sun, H. Breakup processes and droplet characteristics of liquid jets injected into low-speed air crossflow. Processes 2020, 8, 676. [Google Scholar] [CrossRef]
  29. Lee, K.; Sallam, K.A.; Faeth, G.M.; Diez, F.J.; Aalburg, C. Primary Breakup of Turbulent Round Liquid Jets in Uniform Crossflows. AIAA J. 2007, 45, 1907–1916. [Google Scholar] [CrossRef]
  30. Lee, K.H.; Lee, C.H.; Lee, C.S. An experimental study on the spray behavior and fuel distribution of GDI injectors using the entropy analysis and PIV method. Fuel 2004, 83, 971–980. [Google Scholar] [CrossRef]
  31. Wu, Z.; Zhu, Z.; Huang, Z. An experimental study on the spray structure of oxygenated fuel using laser-based visualization and particle image velocimetry. Fuel 2006, 85, 1458–1464. [Google Scholar] [CrossRef]
  32. Nukiyama, Y.; Tanasawa, S. Experiments on the atomization of liquids in an air stream. Trans. Soc. Mech. Eng. Jpn. 1939, 5, 68–75. [Google Scholar]
  33. Lefebvre, A.H.; Miller, D. The Development of an Air Blast Atomizer for Gas Turbine Application; College of Aeronautics Report Aero 193; College of Aeronautics Cranfield: Cranfield, UK, 1966. [Google Scholar]
  34. Rizkalla, A.H.; Lefebvre, A. The influence of air and liquid properties on air blast atomization. ASME J. Fluids Eng. 1975, 97, 316–320. Available online: http://ir.obihiro.ac.jp/dspace/handle/10322/3933 (accessed on 13 September 2020). [CrossRef]
  35. Scheer, I.W.; Beaumont, C. A New Quality Methodology and Metrics for Spray Pattern Analysis. At. Sprays 2011, 21, 189–202. [Google Scholar] [CrossRef]
  36. Muliadi, A.R.; Sojka, P.E.; Sivathanu, Y.R.; Lim, J. A comparison of Phase Doppler Analyzer (dual-PDA) and optical patternator data for twin-fluid and pressure-swirl atomizer sprays. J. Fluids Eng. Trans. ASME 2010, 132, 0614021. [Google Scholar] [CrossRef]
  37. Smyth, H.; Brace, G.; Barbour, T.; Gallion, J.; Grove, J.; Hickey, A.J. Spray pattern analysis for metered dose inhalers: Effect of actuator design. Pharm. Res. 2006, 23, 1591–1596. [Google Scholar] [CrossRef]
  38. Fischer, C.; Jaskulski, M.; Tsotsas, E. Inline method of droplet and particle size distribution analysis in dilute disperse systems. Adv. Powder Technol. 2017, 28, 2820–2829. [Google Scholar] [CrossRef]
  39. Groom, S.; Schaldach, G.; Ulmer, M.; Walzel, P.; Berndt, H. Adaptation of a new pneumatic nebulizer for sample introduction in ICP spectrometry. J. Anal. At. Spectrom. 2005, 20, 169–175. [Google Scholar] [CrossRef]
  40. Canals, A.; Hernandis, V.; Browner, R.F. Experimental evaluation of the Nukiyama-Tanasawa equation for pneumatic nebulisers used in plasma atomic emission spectrometry. J. Anal. At. Spectrom. 1990, 5, 61–66. [Google Scholar] [CrossRef]
  41. Gupta, G.S.; Sarkar, S.; Chychko, A.; Teng, L.D.; Nzotta, M.; Seetharaman, S. Process Concept for Scaling-Up and Plant Studies. Treatise Process Met. 2014, 3, 1100–1144. [Google Scholar] [CrossRef]
  42. Sonin, A.A. A generalization of the ∏-theorem and dimensional analysis. Proc. Natl. Acad. Sci. USA 2004, 101, 8525–8526. [Google Scholar] [CrossRef] [Green Version]
  43. Enßlin, S. Development and Characterization of High Dosed Layered Pellets with Polyvinyl Based Film Coats for Modified Release Applications in Waiblingen. Martin-Luther-Universität Halle-Wittenberg. 2009. Available online: http://d-nb.info/1024937887/34 (accessed on 13 September 2020).
  44. Melegari, C. Study of Different Technologies for Film Coating of Drug Layered Pellets Using Ethylcellulose as Functional Polymer. 2016. Available online: https://core.ac.uk/download/pdf/76520468.pdf (accessed on 13 September 2020).
  45. Aulton, M.; Cole, G.; Hogan, J. Solution properties and atomization in film coating. In Pharmaceutical Coating Technology; CRC Press: London, UK, 1995. [Google Scholar] [CrossRef]
  46. Lefebvre, A.H. Some recent development in twin-fluid atomization. Part. Part. Syst. Charact. 1996, 13, 205–216. [Google Scholar] [CrossRef]
  47. Lefebvre, A.H. Twin-Fluid Atomization: Factors Influencing Mean Drop Size. At. Sprays. 2014, 2, 101–119. [Google Scholar] [CrossRef]
  48. Lefebvre, A.H. Airblast atomization. Prog. Energy Combust. Sci. 1980, 6, 233–261. [Google Scholar] [CrossRef]
  49. Hede, P.D.; Bach, P.; Jensen, A.D. Two-Fluid spray atomisation and pneumatic nozzles for fluid bed coating/agglomeration purposes: A review. Chem. Eng. Sci. 2008, 63, 3821–3842. [Google Scholar] [CrossRef]
Figure 1. Experimental setup for measuring droplet characteristics.
Processes 10 00086 g001
Figure 2. Schematic representation of the three-channel spray nozzle used in this study (airm = microclimate air, aira = atomization air).
Processes 10 00086 g002
Figure 3. High-speed visualization and analysis of droplets: (a) original image, (b) enhancement and visual recognition, and (c) enhancement and computer algorithm recognition. In all columns, the original image is presented in the upper row and an approximately three times magnification of the image is shown in the lower row.
Processes 10 00086 g003
Figure 4. Schematic representation of the measuring positions relative to the spray nozzle.
Processes 10 00086 g004
Figure 5. Observed vs. predicted graph for average droplet size for the training set used for model construction and test set used for model testing.
Processes 10 00086 g005
Figure 6. Observed vs. predicted graph for standard deviation of droplet size for the training set used for model construction and test set used for model testing.
Processes 10 00086 g006
Table 1. Outline of published semi-empirical model characteristics. DA = dimensional analysis, MLR = multilinear regression, DoE = design of experiments, ANOVA = analysis of variance, and PCA = principal component analysis.
Ref. Statistical ApproachNo. of FactorsDispersion PropertiesType of NozzleExp. ScaleNo. of Exp.Method for Droplet Size DeterminationField of ResearchDrawbacks
Thybo et al. (2008)Least squares analysis5Newtonian2 Pilot, production166Malvern laser diffraction, volume-basedPharmacy, spray drying
-
Only Newtonian dispersions
-
Correlation between water and ethanol-based dispersions could not be made
Petit et al. (2015)DA + MLR7 (DA)NewtonianGEANo data134Spraytec laser diffraction, volume-basedFood engineering
-
Only Newtonian dispersions
-
Non-pharmaceutical system and liquids evaluated
Aliseda et al. (2008) No dataNo dataNon-NewtonianPF28100NBNo dataNo dataPhase-Doppler particle analyzer, volume-basedPharmacy, film coating
-
Lack of detailed data
-
Only non-Newtonian dispersions
-
Variability in process parameters not studied
-
Experimental confirmation of theoretical model
Vesey et al. (2014)DoE3Non-NewtonianSchlick 970, 0/4Laboratory, production34Phase-Doppler, volume-basedPharmacy, film coating
-
Only one polymer and solvent tested
-
The % of polymer used as factor instead of basic physicochemical properties
-
Two individual models developed
-
Only average droplet size, not distribution
-
No model developed
Mueller and Kleinebudde (2007)DoE4Newtonian970/7-1 S75 ABC,
930/7-1 S35 ABC
Laboratory, production27Phase-Doppler particle analyzer, volume-basedPharmacy, film coating
-
Only one polymer and solvent tested
-
Only viscosity used as a factor; surface tension and density not investigated
-
Only Newtonian dispersions
-
Only average droplet size, not distribution
-
Two individual models developed
Gauno et al. (2013) ANOVA + PCA3NewtonianGlatt 1-050-00190 X171Laboratory48Malvern laser diffraction, volume-basedPharmacy, film coating (Wurster)
-
Only one polymer and solvent tested
-
The % of polymer used as factor instead of basic physicochemical properties
-
Only Newtonian dispersions
-
Only laboratory scale
-
No model developed
Dennison et al. (2016)DoE3Newtonian1/8 JJAU-SSLaboratory17Real time laser diffraction, volume-basedPharmacy, film coating
-
Only one polymer and solvent tested
-
The % of polymer used as factor instead of basic physicochemical properties
-
Only average droplet size not distribution
-
Only laboratory scale
-
Only Newtonian dispersions
Schoefer and Worts (1977)Not used, single experiments compared4Newtonian *941-943/7Pilot160Photo-micrographs of droplets collected on oil-covered slidesPharmacy, fluid bed granulation
-
Only one solvent (water) used
-
Models suitable only to viscosities up to 50 cP
-
Only Newtonian dispersions
-
Obsolete measuring technique
-
Only average droplet size, not distribution
* Two dispersions showed a slight tendency to exhibit pseudo-plastic behavior, whereas no remarkable deviations from ideal viscous behavior were observed for the other solutions examined.
Table 2. Overview of dispersions used and their properties investigated: viscosity, surface tension, and density (6.5 w/w% of hypromellose in water was used only for testing the model constructed and not in the DoE experiments).
Viscosity [mPas] Surface Tension (1) [mN/m]Density (1) [kg/m3]
Acetone0.30624.5 ± 0.11790 ± 0
Water0.89472.01000
9.3 w/w% hypromellose in ethanol and water (9:1)22526.9 ± 0.17880 ± 20
6.5 w/w% hypromellose in ethanol75.225.8 ± 0.13830 ± 0
10.0 w/w% copolymer of acrylic and methacrylic acid in ethanol1624.0 ± 0.06840 ± 0
1.8 w/w% copolymer of acrylic and methacrylic acid in ethanol2.223.7 ± 0.02810 ± 10
4.0 w/w% ethylcellulose in ethanol10.624.3 ± 0.04830 ± 20
6.5 w/w% hypromellose in water50.447.0 ± 0.441030 ± 0
(1) mean ± SD; triplicate measurement (with the exception of surface tension and density measurement of water).
Table 3. Experiments conducted for construction of the semi-empirical model for prediction of droplet size and its standard deviation. ( ρ = density, η = viscosity, λ = surface tension, M = dispersion flow, pa = atomization air pressure, pm = microclimate air pressure, lnα, lnβ, lnγ, and lnδ–reduced quantities, d–experimentally determined average droplet size; E[ln(d10/D)] = average of natural logarithms of experimentally determined droplet sizes; SD(ln(d10/D)) = standard deviation of natural logarithms of experimental determined droplet sizes).
Exp. Name ρ
[kg/m3]
η
[Ns/m2]
λ
[N/m]
M
[g/min]
pa
[bar]
pm
[bar]
lnαlnβlnγlnδd
[µm]
E[ln(d10/D)]SD[ln(d10/D)]
N18800.2250.0269202.60.2−4.18−0.579−2.55−9.366.99−5.370.658
N108800.2250.02691131.30.1−2.10−0.579−2.54−8.6711.0−4.870.626
N117900.0003060.0245121.10.2−4.2112.4−1.72−8.617.17−5.250.509
N127900.0003060.02451001.10.1−2.0912.4−2.48−8.6113.5−4.930.822
N138800.2250.0269141.31.3−4.19−0.579−0.0038−8.675.96−5.400.449
N148800.2250.02691131.31.3−2.11−0.579−0.0123−8.678.87−5.050.543
N157900.0003060.0245121.11.1−4.2112.42−0.00274−8.5912.9−4.850.838
N178300.07520.0258703.10.9−2.991.51−1.24−9.589.32−4.2670.305
N188300.07520.0258703.10.9−2.991.51−1.24−9.588.25−4.440.261
N198300.06860.026703.10.9−2.991.71−1.23−9.5718.0−4.260.335
N28800.2250.02691602.60.2−2.10−0.579−2.56−9.369.65−5.000.592
N2010000.0008940.07201131.30.1−2.1711.6−2.58−7.6824.8−4.120.701
N37900.0003060.0245182.20.2−4.1512.4−2.57−9.297.11−5.280.540
N47900.0003060.02451412.20.2−2.1012.4−2.55−9.3012.2−4.770.611
N58800.2250.0269202.62.6−4.18−0.579−0.00653−9.366.29−5.360.469
N68800.2250.02691602.62.6−2.10−0.579−0.00769−9.3610.9−4.920.613
N77900.0003060.0245182.22.2−4.1512.4−0.00226−9.298.50−5.050.453
N87900.0003060.02451412.22.2−2.0812.40.0128−9.2817.1−4.350.438
N98800.2250.0269141.30.1−4.19−0.579−2.56−8.666.58−5.300.431
C198400.0160.02395202.60.2−4.164.55−2.57−9.4829.0−3.820.445
C208100.00220.02366202.62.0−4.148.47−0.276−9.4918.9−4.250.427
C218700.2160.027091131.30.2−2.10−0.50−1.88−8.6718.7−4.210.295
C227900.0003060.024481131.30.6−2.0512.42−0.868−8.7734.2−3.730.571
C238400.0160.023951131.31.3−2.084.550−8.7919.5−4.230.489
C2410000.0008940.07197601.30.1−2.7911.6−2.55−7.6713.9−4.490.323
C2510000.0008940.07197301.31.3−3.4911.60.00766−7.6815.3−4.390.318
C268300.01060.02426401.30.4−3.115.37−1.18−8.7717.3−4.280.283
C278300.01060.02426401.30.4−3.115.37−1.18−8.7719.2−4.170.260
Table 4. Coefficients corresponding to Equations (11) (kx) and (12) (cx).
k 1 = 2.13 k 6 = 0.287 c 1 = 1.06 c 6 = 0.0887
k 2 = 0.156 k 7 = 0.267 c 2 = 0.296 c 7 = 0198
k 3 = 0.749 k 8 = 0.207 c 3 = 0.204 c 8 = 0.0323
k 4 = 5.41 k 9 = 0.0195 c 4 = 3.74 c 9 = 16.4
k 5 = 0.00927 k 10 = 22.8 c 5 = 0.167
k 10 = 8.07 × 10 9 c 9 = 7.60 × 10 17
Table 5. Additional experiments performed for testing the semi-empirical model for average droplet size performance ( ρ = density, η = viscosity, λ = surface tension, M = dispersion flow, pa = atomization air pressure, pm = microclimate air pressure, Exp. d = experimentally determined average droplet size).
Exp. name ρ
[kg/m3]
η
[Ns/m2]
λ
[N/m]
M
[g/min]
pa
[bar]
pm
[bar]
Exp. d
[µm]
Model Prediction Diameter
[µm]
Model Prediction SMD
[µm]
Exp. SMD
[µm]
Calculation of SMD by N-T
[µm]
D28700.216 #0.0271702.490.417.811.814.625.3138
D58400.01600.0240702.510.4119.218.321.845.651.5
D108300.01060.0243702.50.4120.118.722.225.545.4
X28300.06860.0260100.50.114.212.512.919.429.4
X710300.05040.0470702.510.416.115.818.719.354.9
X810300.05040.04701402.490.417.420.627.623.5132
X910300.05040.0470703.110.916.217.019.719.154.9
# Non-Newtonian dispersion.
Publisher’s Note: MDPI stays neutral with regard to jurisdictional claims in published maps and institutional affiliations.

