1. Introduction
The extraction of cannabinoids from cannabis flowers is becoming increasingly popular, due to their potential therapeutic effects, medicinal benefits, and potential for utilization in patients’ pain management [
1,
2,
3,
4]. Recently, the supercritical fluid extraction (SFE) technique has gained interest and has been used for various extraction applications [
5,
6,
7,
8,
9]. In addition, SFE is also used to extract the bioactive components and essential oils on a pilot scale [
10,
11]. Due to the tunable properties of CO
2, it is used as the main solvent to extract these components. The density of CO
2 can be altered by making very minor changes to temperature and pressure [
12]. SFE is considered a greener technique because of its low impact on the environment, and it does not require the use of hazardous organic solvents [
13]. SFE has already been commercialized for the extraction of cannabis and related products. However, because of the lack of knowledge of how SFE affects the parameters, the interactions of the testing materials, and in-depth fluid dynamics, it is considered a black box design [
14].
The factorial design is frequently used for the screening of different processing parameters in experiments, especially for the improvement of extraction efficiency and chromatographic separations; the most effective procedure is to evaluate the main contributing factors [
15] because, theoretically, the number of experimental factors contributes to systematically resolving the issue. Additionally, a factorial design study significantly reduces the resources, time and effort needed to solve problems [
16]. Therefore, factorial design studies are considered an efficient and information-rich technique for the analysis of analytical data and to obtain valid results [
17,
18].
In the reported literature studies, the extraction conditions were focused on high pressure and temperature [
19,
20,
21]. In addition, these studies consider the density of CO
2 as a resulting parameter, with a change in pressure and temperature to extract the cannabinoids. However, a single factor cannot produce sufficient data to address all problems. By optimizing the main contributing parameters in SFE, the extractability and sensitivity of the process can be modified. Therefore, a careful study of SFE’s tunable properties is needed to understand the effects of all participating parameters. Additionally, by optimizing the SCF extraction ability, a higher degree of freedom can be acquired, compared to the conventional techniques.
The SFE design of experimentation in any study depends on the various objectives, such as time consumption, cost-effectiveness, the feasibility of the experiment, and investigators’ intention. There are three common screening stages to achieve the best results from any experimental design, including interpretation and data analysis, experimental trials, and the proper design of the software. For the screening of important SFE factors that affect the experiment, the most commonly used designs for experiments are the Plackett–Burman design, fractional factorial design, and the full factorial design [
14]. This study aims to design a half-fractional factorial study to determine the best factors for the selective extraction of cannabinoids from cannabis.
2. Materials and Methods
2.1. Chemical and Reagents
The solvent (methanol, ethanol, and phosphoric acid) and cannabinoid reference standards, named as delta 9-tetrahydrocannabinol acid (THCA-A; Lot: FE12121601; with 99.18% purity), cannabichomere (CBC; lot: FE10011502; with 97.60% purity), delta 8-tetrahydrocannabinol (Δ8-THC), delta 9-tetrahydrocannabinol (Δ9-THC) with 97.66% purity (lot: FE1041701), cannabinol (CBN; lot: FE06131701; with 99.37% purity), cannabigerol (CBGA), cannabidiolic acid (CBDA; lot: FE12011601; with 98.3% purity), cannabigerolic acid (CBG; lot: FE06241604; with 98.98% purity), cannabidiol (CBD; lot FE08071702; with 99.66% purity), tetrahydrocannabivann (THCV), and cannabidivann (CBDV), were purchased from Sigma Aldrich Ltd. and Novachem Pty. Ltd., Victoria, Australia. Liquid-vapor CO2 was supplied by BOC (Sydney, Australia). The dried cannabis flowers were a generous gift from PreveCeutical Medical Inc., Vancouver, BC, Canada.
2.2. Sample Preparation
The cannabis strain, “tower” (cannabidiol-dominant), with the sativa genotype was planted on 4 May 2017 under ideal growing conditions (12–18 h light exposure at 23 °C). The flowers of the cannabis sample were collected at the fluorescence stsgeand dried for 5 to 8 days at 20 °C. According to the certificate of analysis, the flower material had around 15% w/w of CBD and CBDA, whereas THC and THCA levels were around 0.517% w/w. After drying (with total moisture < 10%), samples were crushed to obtain a particle size < 2.7 mm. The samples were then pulverized in short pulses (to avoid warming) for two min (Breville coffee grinder, model BCG200), to further reduce particle size and increase the surface area, as well as for the efficiency of cannabinoid extraction.
2.3. SFE Equipment and Setup
The supercritical carbon dioxide (scCO
2) extraction of cannabis was performed using a Helix supercritical fluid extraction (SFE) unit (Applied Separations, Allentown, PA, USA) of the cannabis sample. The maximum sample-holding capacity of the reactor was 100 mL. The backpressure was directly regulated by a preconditioning chamber from the liquid-vapor CO
2 (liquid-vapor equilibrium) cylinder, as shown in
Figure 1. The desired internal temperature was controlled through a heating jacket on the sample-holding chamber. The pulverized cannabis sample was placed in the bottom of the chamber. The CO
2 stream entered from the bottom inlet of the chamber and extraction was carried out according to the conditions listed in coming sections. The liquid-vapor CO
2 dissolved the matrix from the sample according to its density. After extraction, the CO
2 with the dissolved matrix entered the separation chamber, where the pressure was around 50 bar to avoid the throttling effect of dry ice. The extract was collected in the sample-collecting vessel, attached to the bottom of the separating chamber. The sample was washed with a continuous flow of CO
2 for 10 min, and dry ice was collected in the sample-collecting vessel. After the collection of 1st extract, the reactor was refilled again with fresh CO
2, and extraction was performed for 10 min to avoid the supersaturation of CO
2.
2.4. Parameters for the Factorial Design
The experimental domain factors of the fractional factorial study are shown in
Table 1, including temperature (F1), pressure (F2), processing time (F3), and the amount of plant material (F4) at lower, central, and higher levels. To attain the various supercritical regions of CO
2 (scCO
2), the pressure and temperature ranges were employed from 150 to 250 bar and 35 to 45 °C, respectively. The processing time for the design of the experiment ranged from 30 to 180 min, and the quantity of plant material used was 0.5 to 1 g.
2.5. Experimental Matrix
The factorial design of 2
4−1 was employed to give an 8-run experimental plan with two center points, positioned at a medium level between the sets of low and high levels. Center points were used as a reference point to determine the factor–response linearity and experimental error. The experimental matrix is given in
Table 2, together with the factors for F1, F2, F3 and F4. The relationship between pressure, temperature and density are also described in [
12] and provided in
Table 2.
2.6. Resolution
In this study, the resolution level of the half-fractional factorial design study plot for the cannabis sample was generated as 4. This demonstrates that the experimental matrix from F1 to F3 was considered a full factorial design. By using generators or statistical modeling, factor F4 was assessed. This was formed by multiplying the previous three-factor value; that is, F4 = F1 × F2 × F3
2.7. Regression Modeling
The multiple regression analysis for the selected independent factors, and between the responses of these factors, can be represented by Equation (1), as follows.
where
Ɛ = Experimental error term
Χ1 to X4 = Variable effect
β0 = Coefficient constant of the average experimental response
β1 to β3 = Variable main effects estimation
β4 to β12 = Variable interaction effects estimation
Y = Experiment j response estimation.
2.8. Statistical Analysis of the Experimental Design
The cannabis experimental design (DOE) for data analysis and factorial runs was obtained with Minitab 17. The confidence levels of 90% (p < 0.01) and 95% (p < 0.05) were considered statistically significant.
2.9. Conventional Extraction
Organic solvent extraction was also performed to compare the results and the efficiency of scCO2 extraction. The ethanolic extract of the cannabis ground material was obtained at a ratio of 1:10 (w/w). This mixture was sonicated for 15 min and stirred (with a magnetic stirrer) for 24 h in a dark, cold room at 4 °C to avoid any kind of degradation. This mixture was filtered using a Whatman filter paper and the obtained extract was dried using a nitrogen evaporator. After that, the extract was dissolved in 2 mL methanol and centrifuged at 10,000 rpm for 15 min. Further dilutions were performed to quantify the number of cannabinoids in the extract, using HPLC.
2.10. HPLC Quantification: Mobile Phase Elution Program
The reverse-phase HPLC quantification and separation of 11 cannabinoids was performed using a C18 chromatographic column (Shim-pack XR-ODSII, spherical silica particles, 2.2 µm particle size (Shimadzu Scientific) and Lab Solutions software or a Cannabis Analyzer (Shimadzu Scientific Instruments, NSW, Australia) were used to standardize the method.
The mobile phase A and B was a mixture of MilliQ water and methanol, with phosphoric acid (99.93/0.07% v/v). Both mobile phases were sonicated for 15 min and, after that, the pH of the mobile phases was monitored (the pH of mobile phase A was around 2.22 to 2.26, and B was around 2.43 to 2.48). The column oven temperature was attuned to 50 °C and the flow rate was 1.0 mL/min, to maintain the column pressure (~5400 to 5600 psi). The volume of injection was 10 µL and the total runtime was 45 min. Initially, mobile phase B (v/v) was at 65% for 1 min. Then, it gradually increased to 72% over 25 min; after that, it increased to 95% for 5 min. After maintaining these conditions for 2 min, the initial ratio of mobile phases was adjusted and the column was re-equilibrated for 12 min.
2.11. Standard Solution Preparation
The cannabinoid standard solution, with a concentration of 1000 µg/mL, was diluted in methanol to make 250 µg/mL as a stock solution. The calibration curve of mixed standards with 11 cannabinoids was prepared at a concentration range from 1.0 to 25.0 µg/mL in methanol, using the cannabinoids stock solution. All standards solutions were stored at −80 °C.
2.12. Sample Preparation for Cannabinoid Quantification
The obtained solvent-free scCO2 extract was dissolved in 2 mL methanol, sonicated for 15 min, and centrifuged at 10,000 rpm for 10 min to prepare the primary extract. Then, 50 µL of this supernatant was transferred into a new centrifuged tube and made up to 1000 µL by adding 950 µL of methanol (20-times dilution, as a secondary extract). This extract was vortex-mixed at 1000 rpm for 1 min to dissolve the cannabinoids properly into the methanol. Then, 100 µL of this secondary extract was transferred into HPLC vials directly for HPLC quantification or diluted again to establish the area under the curve, respectively. All extract solutions were stored at −80 °C, until ready for testing.
3. Result and Discussion
In this study, a high yield and the selective extraction of 11 cannabinoids were achieved via the SFE method. The association between the SFE main parameters (pressure and temperature) and the experimental domain of cannabis (processing time and amount) were screened to obtain an effective extraction of cannabinoids. The mathematical modeling was performed via a 2
4−1 factorial design study. This factorial design revealed the efficiency of the selected main parameters and their simultaneous effect on the scCO
2 extract. The selection of scCO
2 as an extraction solvent was due to its intrinsically non-polar behavior, because the chemical nature of cannabinoids is oily, and they easily dissolve in a non-polar medium [
22].
3.1. Model Response for Extract Yield and Total Cannabinoids
The results of the half-fraction factorial design, with a resolution of 4 for the total extract yield from the original pulverized cannabis material, are represented in
Table 3 and
Table 4. The percentage yield of the scCO
2 extract was studied using 0.5 to 1.0 g of the cannabis sample; because of sample sensitivity (having a high amount of CBA + CBDA), a low amount of cannabis was used to avoid the super-saturation of scCO
2 under experimentation.
The effect of pressure and temperature during scCO
2 extraction on the yield of extract was also investigated because, previously, Span and Wagner [
12] found that minor changes in pressure and temperature have a great influence on the density of scCO
2. The variation in the density of CO
2 on selected experimental conditions is shown in
Table 2. The minor changes in the density of CO
2 also change its diffusivity, as a result of the solvation power of the CO
2 effects. Therefore, in this study, small variations in temperature and pressure were implemented to monitor the effect of scCO
2 density on experimentation.
From the results, it was found that the maximum yield of the scCO2 extraction of cannabis was obtained from run 7 (around 148.4 mg/g, when the processing temperature was 35 °C, the pressure was 250 bar, processing time was 3 h, and sample amount was 500 mg), showing that low temperature and high pressure provided a higher amount of scCO2 extract, whereas the lowest yield (38.3 mg/g) of scCO2 extract was obtained at a low temperature and pressure (at runs 1 and 5) when the processing time and sample amount were higher. This shows that high pressure is a key parameter for obtaining a good yield of extract.
From the Pareto chart (
Figure 2a), it can be seen that, at a 90% confidence level, all independent parameters and their interactions did not show any significant effect (
p > 0.09) on the extract yield. A full regression model equation with respect to the extract yield (Equations (2) and (3)) and statistical analysis (
Table 4) also represented that no independent and interaction parameters showed any profound effect. It is suggested that these findings were observed due to the selected low amount of cannabis loading material.
The results of the HPLC analysis of total cannabinoids in the scCO
2 extract show that standard order 8 provided a higher number of cannabinoids in the extract (853.12 µg/mL). From the Pareto charts (
Figure 2d) and the estimated regression model (Equations (4) and (5)), it was revealed that high temperature, pressure, amount, and long processing time are the main contributing factors for ensuring the high quantity of cannabinoids in the extract. The regression model for total yield and cannabinoids are provided in Equations (2) and (3):
A simplified model for total yield and cannabinoids is presented in Equations (4) and (5):
3.2. Model Response for CBD and CBDA
The relationship between selected experimental parameters and the extraction of CBD and CBDA was also determined by a half-fractional factorial design study. The goal of the study was to selectively extract the major cannabinoids CBD and CBDA from cannabis. The HPLC data for CBD and CBDA (presented in
Table 3) showed that the standard order 8 yields a higher amount of these cannabinoids (195.26 and 603.37 µg/mL). As the original cannabis flower material was extracted without decarboxylation (the conversion of acidic cannabinoids into their neutral form), this resulted in a comparatively higher quantity of CBDA, compared to CBD. From the Pareto chart of CBD and CBDA (
Figure 2b,c), it was found that a long processing time (F3) had a strong influence on the solubility of CBD and CBDA in scCO
2. Similarly, statistical analysis (
p ≤ 0.09) also showed that processing time strongly affected the extraction of CBD and CBDA, as shown in
Table 5. Additionally, the two-way interaction between high pressure (250 bar) and a long processing time (3 h) demonstrated a profound effect on the extraction of CBDA. Previously, Perrotin-Brunel and van Roosmalen [
23] also reported that high pressure (200 bar) increases the molar solubility of cannabinoids (CBD and THC) during scCO
2 extraction modeling.
The regression model for CBD and CBDA is presented in Equations (6) and (7):
A simplified model for CBD and CBDA is provided in Equations (8) and (9):
3.3. Model Response for THC and THCA
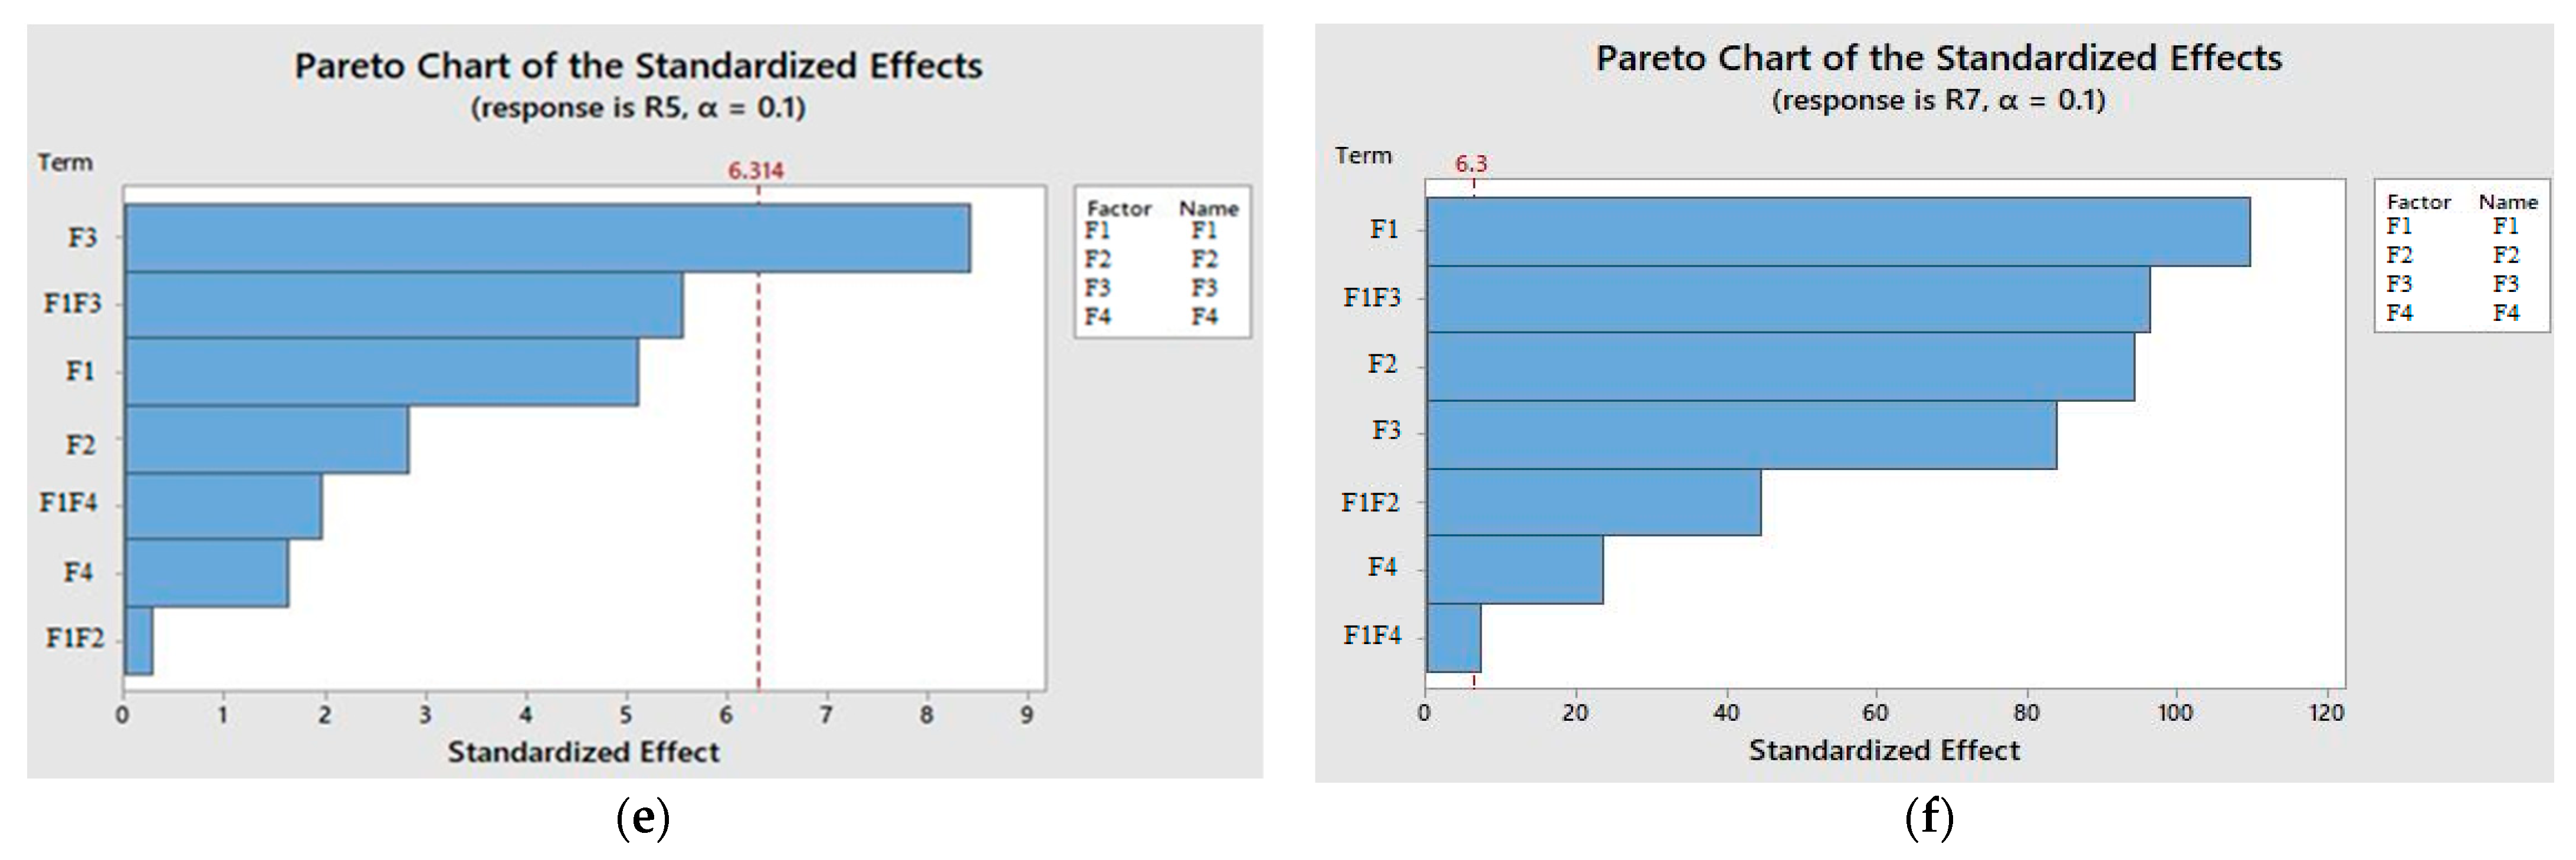
The effect of scCO2 extraction at selected parameters on the solubility or extraction ability of Δ9-THC, Δ8-THC, and THCA was also investigated; THC is considered to be a major and psychoactive cannabinoid in cannabis.
From the obtained scCO
2 extraction data, it was found that the high temperature (45 °C) and pressure (250 bar) with 845 Kg/m
3 density of scCO
2 dissolved a higher amount of Δ
9-THC and THCA (
Table 6). Previously, Rovetto and Aieta [
20] identified that high pressure and temperature increased the percentage of THC and THCA in the scCO
2 extract. Similarly, in another study, it was also found that high pressure (200 bar) and temperature (52 °C) increased the solubility of THC (above 1 × 10
−4) in scCO
2 [
24]. This study also suggested that at a low pressure of around 150 bar, the solubility of THC in scCO
2 decreases. These findings correlated with our study and confirmed that low temperature (35 °C) and pressure (150 bar) decreased the yield of Δ
9-THC in the extract. Conversely, in the case of THCA, it was suggested that the combination of low temperature and high pressure (run 2) produced the lowest amount. The low quantity of THC and THCA, compared to CBD and CBDA, in the extract was due to the nature of the plant material. However, no Δ
8-THC was found in the obtained extracts. This might be due to the absence of Δ
8-THC in the original plant material.
The statistical analysis of the module (shown in
Table 7), Pareto chart (
Figure 2e,f), and regression equation for the THC showed that only a long processing time was the main factor regarding obtaining a high yield from the extract. Conversely, in the case of THCA, it was suggested that all main parameters and their two-way interactions were contributing to producing a good yield in terms of extract (shown in
Table 7). Currently, due to the lack of mathematical modeling study on the percentage yield, or the solubility of THC in the scCO
2, the findings of this work do not correlate with the literature.
The full regression model for THC and THCA are shown in the following equations (Equations (10)–(13)), showing the influence of statistical parameters. The factorial design study generated from SFE-processing conditions also revealed that processing time is one of the most significant parameters for THC, whereas, in the case of THCA, all main factors contributed effectively.
3.4. Regression Model for THC and THCA
Regression eqution for THC and THCA of FFD model are provided in Equations (10) and (11).
3.5. A Simplified Model of THC and THCA
Regression equations for THC and THCA of simplified FFD model are provided in Equations (12) and (13).
3.6. Model Response for Other Selected Minor Cannabinoids
From the composition of other cannabinoids (presented in
Table 8) in the extract, it can be seen that CBD, CBDA, THC and THCA were the main cannabinoids in the selected cannabis strain. Other micro-cannabinoids, such as CBDV, THCV, CBG, CBGA, CBN and CBC were found in trace amounts. The results have shown that the extracts obtained from runs 6 and 8 showed a considerable quantity of these micro-cannabinoids. However, another experimental run did not show a significant extraction rate. Similarly, conventional organic solvent extraction mirrored the findings regarding micro-cannabinoids.
3.7. Model Validation
After plotting the factorial design, it was identified that processing time was the main contributing factor that influences the extraction of cannabinoids. The prediction of the module for validation is represented in
Table 9. The two center points were also used to determine module curvature response and repeatability. Additionally, a statistical module summary, such as the residual standard deviation (S.D.
res), the coefficient of determination (
R2), and the adjusted coefficient of determination (
R2adj) of each cannabinoid were also verified, to determine the response of the module. However, due to the short supply of cannabis material, and the consideration of processing time only as a statistically significant influencing parameter, extraction at both low and high levels was not performed.
3.8. Conventional Extraction
Cannabinoids from cannabis material are freely soluble in organic solvents. They can be easily extracted using alcohols with a 90% yield [
25]. However, due to their toxic behavior and flammable properties, a promising alternative extraction technique is required. The results for the conventional extraction of cannabis are shown in
Table 10.
The organic solvent extraction of cannabis material was performed to determine the efficiency of scCO
2 extraction. From the comparative study, it was observed that the extract obtained from organic solvent extraction had a relatively higher percentage of the main cannabinoid than with scCO
2 extraction. Previously, Omar et al. [
26] also reported that the organic solvent extraction process of cannabinoids is more efficient than the scCO
2 extraction method. However, scCO
2 extraction provides a solvent-free extract with the advantage of selective extraction (it does not dissolve pigments, including chlorophyll). In terms of purity, scCO
2 also had a relatively high percentage of cannabinoids, compared to the conventional extract, and the process does not need an additional purification step.
The organic solvent extraction of cannabis leftover material (obtained after the factorial design experiment) was also performed (represented in
Table 11), to determine the retained number of cannabinoids after scCO
2 extraction. It was found that samples obtained from the standard order run 8 demonstrated a very low quantity of cannabinoids, compared to other runs. Only a trace amount of CBDA was left after scCO
2 extraction, whereas a high number of cannabinoids were found in extracts obtained from run 1. The scCO
2 extraction for the standard order run 1 was performed at a low temperature (35 °C), pressure (150 bar), processing time (30 min), and amount (0.5 g). This run gives a very low number of cannabinoids with scCO
2 extraction.
Therefore, it was suggested that the collection of the low number of cannabinoids with scCO2, compared to organic solvent extraction, might be due to the limitations of the instrument. It might be the case that during the separation of the extract from the Helix extraction chamber, a pressure effect (throttling effect) occurred that affected the yield of cannabinoids. Additionally, scCO2 extract was collected in a glass chamber; as a result, volatile components from the extract evaporated, which may also have decreased the yield of cannabinoids.
4. Conclusions
The supercritical fluid extraction technique is growing in popularity as a solvent to selectively dissolve and extract non-polar components from raw materials. By applying the half-fractional factorial design study, the effectiveness of four main factors on the extraction of cannabinoids using scCO2 was determined. The key finding identified from this study was that high pressure and temperature together generate the highest yield of cannabinoids, when using scCO2 as the extraction solvent. In addition, a longer processing time was the most dominant factor aiding the dissolution of cannabinoids in scCO2. From the mathematical model prediction, it was determined that the dry flower weight was a key factor to determine any associations between parameters. It was identified that the optimal temperature, pressure, and processing time were 250 bar, 45 °C, and 180 min, respectively. Due to the selection of a lesser amount of cannabis material for the factorial design study (low, medium, and high levels), the model response did not show a significant variation. Another possible reason for this was the density of CO2, as the variation that was trialed was not adequate to produce appreciable interaction effects across the selected parameters. The quality of the model was also verified by regression analysis and selected central points. In addition, the study further identified that scCO2 extraction at high pressure and temperature provided the highest yield of cannabinoids.


