Article

Assessment of Wine Adulteration Using Near Infrared Spectroscopy and Laser Backscattering Imaging

by
Anita Hencz
1,
Lien Le Phuong Nguyen
1,2,
László Baranyai
1,* and
Donatella Albanese
3
1
Institute of Food Science and Technology, Hungarian University of Agriculture and Life Sciences, 1118 Budapest, Hungary
2
Institute of Biotechnology and Food Technology, Industrial University of Ho Chi Minh City, Ho Chi Minh 700000, Vietnam
3
Department of Industrial Engineering, University of Salerno, 84084 Salerno, Italy
*
Author to whom correspondence should be addressed.
Processes 2022, 10(1), 95; https://doi.org/10.3390/pr10010095
Submission received: 6 December 2021 / Revised: 27 December 2021 / Accepted: 30 December 2021 / Published: 4 January 2022

Abstract

:
Food adulteration is in the focus of research due to its negative effect on safety and nutritional value and because of the demand for the protection of brands and regional origins. Portugieser and Sauvignon Blanc wines were selected for experiments. Samples were made by water dilution, the addition of sugar and then a combination of both. Near infrared (NIR) spectra were acquired in the range of 900–1700 nm. Partial least squares regression was performed to predict the adulteration level. The model including all wines and adulterations achieved a prediction error of 0.59% added sugar and 6.85% water dilution. Low-power laser modules were used to collect diffuse reflectance signals at wavelengths of 532, 635, 780, 808, 850, 1064 nm. The general linear model resulted in a higher prediction error of 3.06% added sugar and 20.39% water dilution. Instead of classification, the present study investigated the feasibility of non-destructive methods in the prediction of adulteration level. Laser scattering successfully detected the added sugar with linear discriminant analysis (LDA), but its prediction accuracy was low. NIR spectroscopy might be suitable for rapid non-destructive estimation of wine adulteration.

1. Introduction

Due to increasing population and demand, product quality, effectiveness and cost of food production have become a key issue. Especially for wine, origin and nutritional value are the focus of consumers. Wines of designated origins, such as Tokaji Aszú (Tokaj, Hungary), are also attracting interest in the food industry because of their high polyphenol content [1]. The enrichment of wine with sugar (before or during fermentation) and the addition of ethanol may occur during production to increase market price [2]. Only natural sweeteners might be acceptable in limited cases to balance the lack of natural sugar as a result of inappropriate weather conditions. The addition of natural sweeteners may be considered based on the country, region and wine type [3]. Adulteration to mislead customers with an improved sweet taste or a decreased valuable content may occur after fermentation. Prohibited practices in oenology have so far been detected with analytical techniques, such as carbon-13 and oxygen-18 isotope analysis [4], chromatography and spectrometry [4,5,6,7,8], pigment analysis [9] and evaluation of headspace volatile compounds [7,10]. Wine adulteration with differences in grape variety, geographical origin and addition of sugar, water, sweetener, and coloring agent has been detected successfully with high-performance analytical methods [7]. Flavor changes were successfully detected for adulterated food samples using an electronic tongue [11]. This electronic tongue technique is promising and works well on liquid samples or solutions. Its disadvantage is that measurement takes a few minutes for one sample. The near infrared (NIR) spectroscopy has proved its ability to discriminate adulterated tomato paste samples beyond 0.5% concentration [12] and whiskey above 1% v/v [13]. Recent technical developments allow for the application of small and handheld spectroscopy devices [14] and advanced imaging techniques [15], as well as diffuse reflectance [16]. Laser-beam-induced diffuse reflectance is primarily used in the quality assessment of solid foods, but there are a limited number of applications for liquid products, such as yoghurt [17].
The main goal of the presented work was to evaluate the applicability of the optical methods of near infrared spectroscopy and laser-induced backscattering imaging for the detection of wine adulteration. Adulteration of water dilution and the addition of sugar were evaluated, as well as their combinations.

2. Materials and Methods

2.1. Materials

Bottled wine samples produced in Hungary were used in the experiment. Two wines were selected to represent both red and white types: a Portugieser (2009, Tóth, Szekszárd, Hungary) and a Sauvignon Blanc (2009, Nyakas, Etyek-Buda, Hungary). Adulteration was performed using water and sugar. The materials were added in 5 steps, making a dilution sequence on the basis of 100 mL wine. The addition of sugar was performed with approximately 3.7 g portions of sugar cubes (Magyar Cukor Zrt, Kaposvár, Hungary). The adulteration levels and the corresponding concentrations are introduced in Table 1. Level of 0 denotes the original wine sample.
Mixed samples were also prepared to test whether combined adulteration could be detected. The concentrations for the mixed samples are presented in Table 2. The evaluation of the mixed adulteration, with both dilution and added sugar, was based on the adulteration level in order to balance different ranges of concentrations. In this approach, the adulteration level represents dissimilarity and can be considered the normalized distance from the original wine sample (level 0). In the case of mixed samples, the adulteration level was calculated as the Euclidean distance based on the independent factors of water dilution and added sugar. This proposed technique can describe multiple adulterations with a single value.

2.2. Near Infrared Spectroscopy

The Near Infrared (NIR) spectra of the samples were collected using a DLP® NIRscan™ Nano (Texas Instruments, Dallas, TX, USA) device. Spectral readings were acquired in triplicates in the wavelength range of 900–1700 nm. The temperature was adjusted to 25 ± 0.1 °C during the measurement. The data were subjected to standard normal variate (SNV) preprocessing to facilitate normalized comparison of independent measurements.
Prediction models for partial least squares regression (PLSR) were constructed using spectral information. The statistical software of R (version 4.0.3, R Foundation for Statistical Computing, Vienna, Austria) was used to fit the model and evaluate the results. The water dilution and added sugar concentrations were predicted. In the case of mixed samples, the adulteration level was used as an independent variable. The quality of the model was evaluated using the coefficient of determination (R2) and the root mean square error (RMSE).

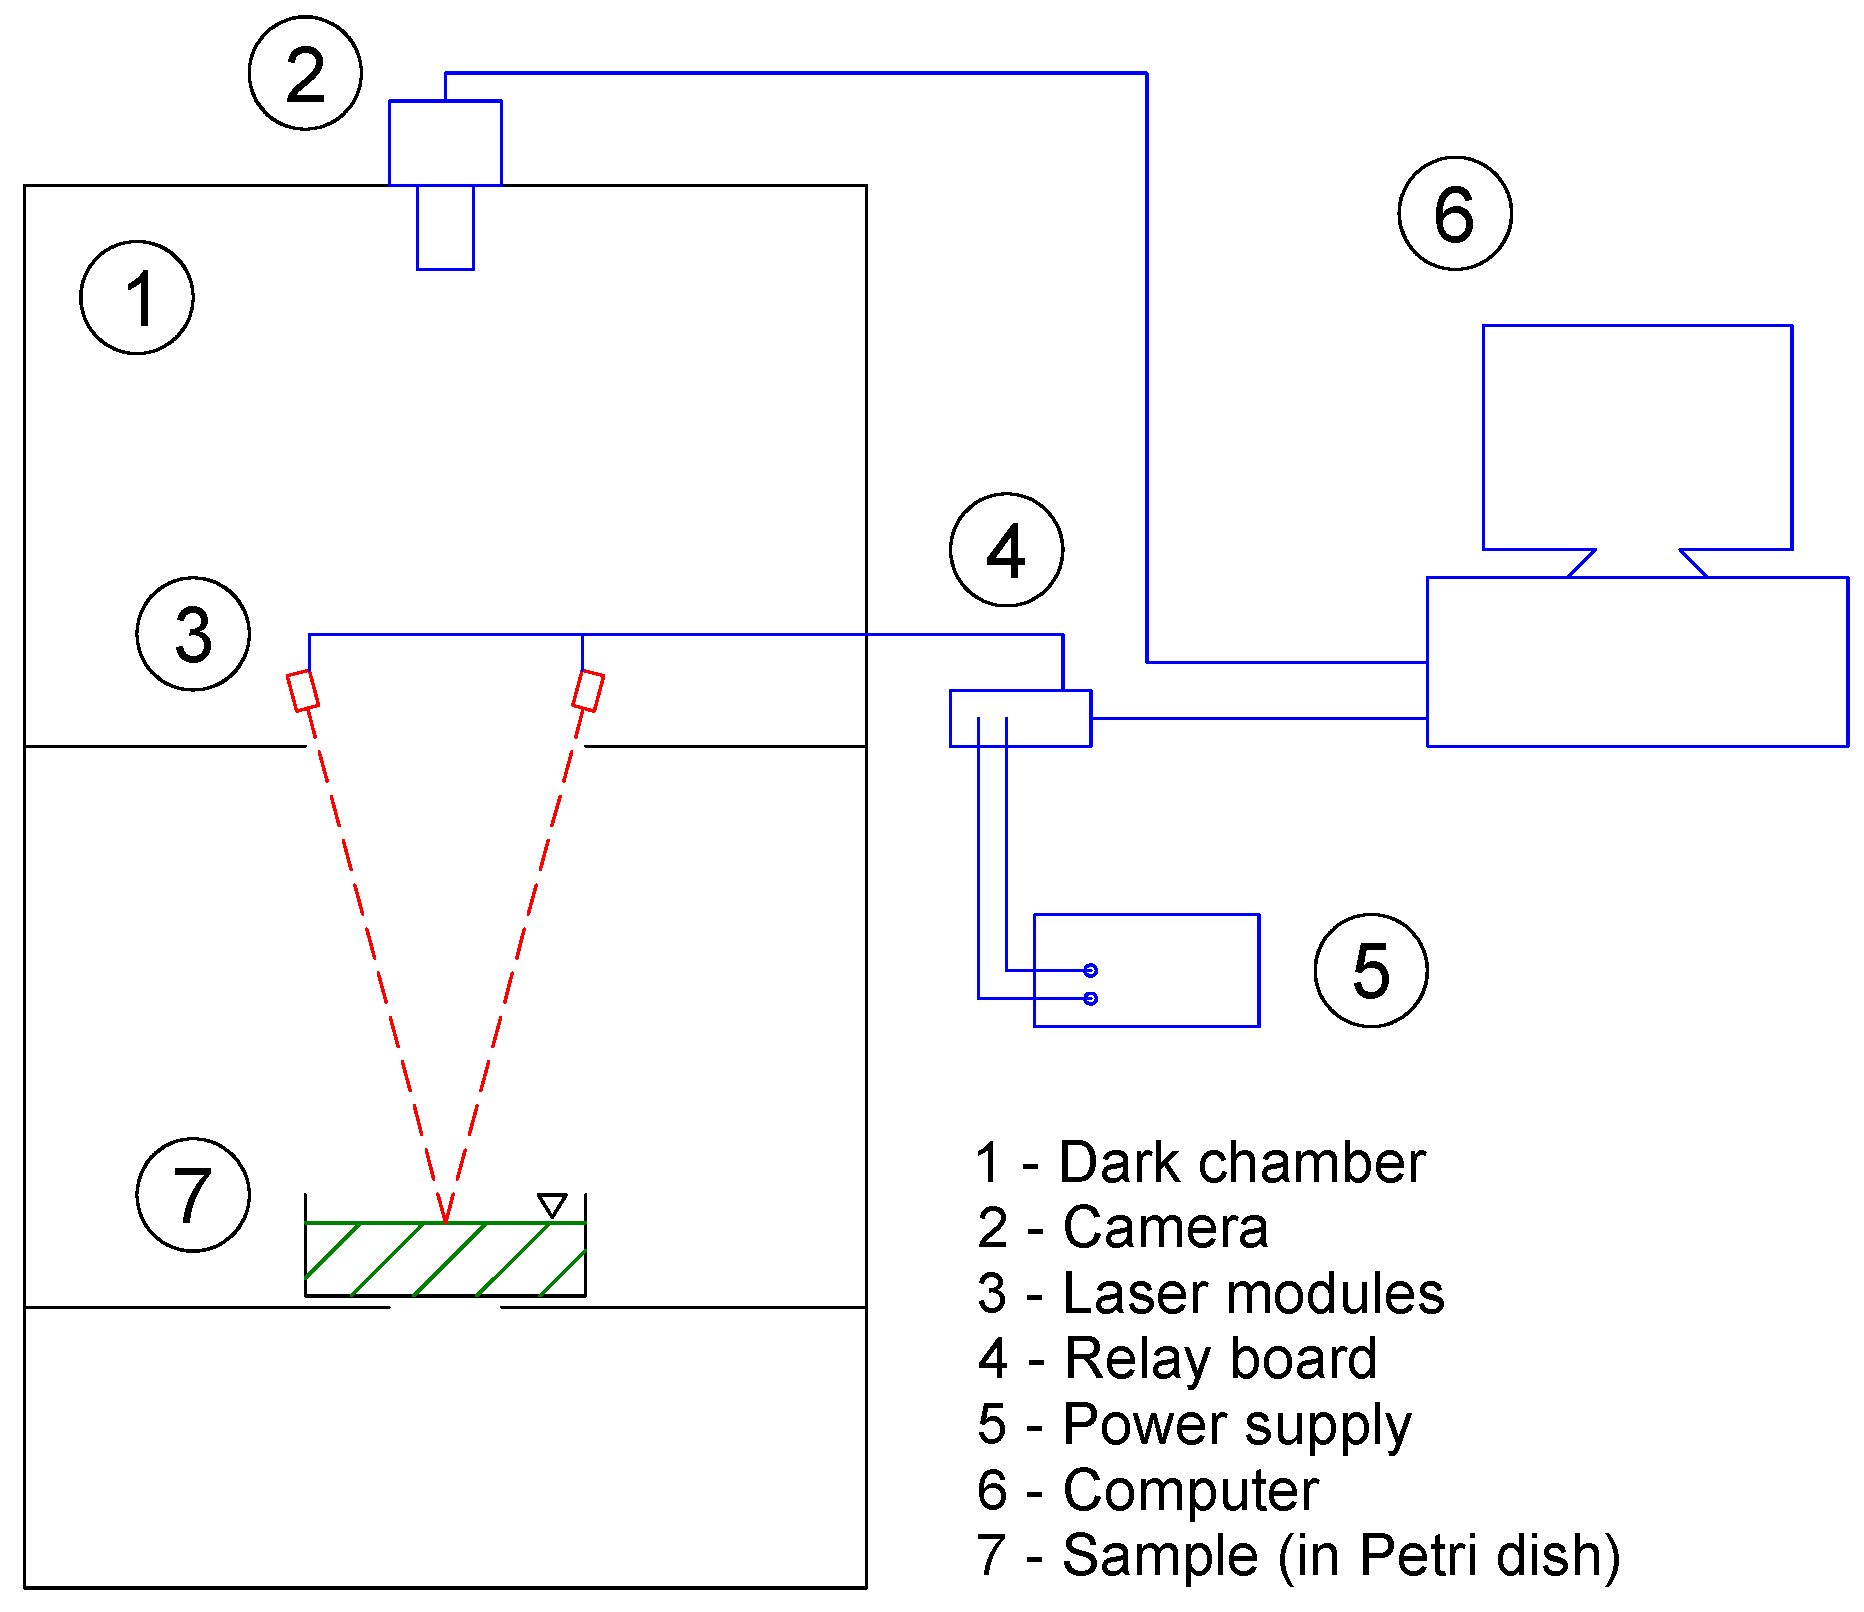
2.3. Laser-Induced Diffuse Reflectance Imaging

The wine samples were poured into a Petri dish at a level of 3 mm. Low-power laser modules of 3 mW and ∅1 mm beam diameter were used to induce diffuse reflectance (backscattering) signals at wavelengths of 532, 635, 780, 808, 850 and 1064 nm. The angle of incidence was adjusted to 15°. Digital images were collected using a 12-bit camera (model MV1-D1312, Photonfocus, Lachen, Switzerland) with a resolution of 0.113 mm/pixel. Measurements were performed in two replicates. Image acquisition took place in a dark chamber to enhance the signal-to-noise ratio and protect the measurement from other light sources. The Petri dish was placed over a hole to avoid reflection from any surface below. The setup of the laser vision system is introduced in Figure 1.
The illuminated spot appeared as a peak in the average intensity signal (Figure 2). The binary image data was processed using the GNU Octave (version 4.4.1) software. Laser light distribution was described with peak width at selected intensity levels 25%, 50% and 75%, called D25, D50 and D75, respectively. Ratios of D50 to D75 and D25 to D75 were also computed. The illuminated area was segmented above an intensity level of 50% and a ring of 25–75%, called A50 and A25–75, respectively. The ratio of A50 to A25–75 was also calculated. The ratios of the parameters are expected to reflect the sharpness of the peak and the outline of the illuminated spot.
The statistical software of R (version 4.0.3) was used to perform an analysis of variances (ANOVA) to discover the effect of adulteration on the values measured. Additionally, generalized linear model (GLM) regression was performed to predict adulteration based on significantly affected parameters of diffuse reflectance. Linear discriminant analysis (LDA) was also performed on the data to test the classification power of the parameters.

3. Results

3.1. NIR Spectroscopy

In the NIR spectra, the red and white wines obtained similar readings in the wavelength range of 900–1700 nm. Differences were primarily observed around 1450 nm and beyond. Smaller changes were also found at the beginning of the recorded spectra below 1000 nm. Figure 3 shows the normalized spectra of the wine samples. The SNV normalized readings changed in the opposite direction for water dilution and for added sugar. The arrows on the figure represent how the spectral values changed with increasing degree of adulteration.
The sensitive regions of the spectra were confirmed by the latent variable (LV) loadings of the PLSR model of all wine samples (Figure 4). A wavelength can be considered important when the LV loading values deviate significantly from zero or the LV values have a large standard deviation. These wavelength ranges are related to the vibrational tones of the bonds in the water molecule. Therefore, changes related to water content are expected to yield better results.
The evaluation of PLSR models is presented in Table 3. Water dilution resulted in a lower error compared to added sugar in terms of RMSE. Both single-factor adulteration techniques were addressed successfully with LV = 3. All models achieved high coefficients of determination of R2 > 0.989. Using a single factor and two factors together, the merged samples reached a high coefficient of determination and a low estimation error with LV = 6.
The merged samples were evaluated at the level of adulteration, and it was observed that the prediction model for white wine Sauvignon Blanc performed slightly better for R2 and RMSE.
When all the measured samples were used to construct the PLSR model, the coefficient of determination decreased but was still above the expected value (R2 > 0.96, n = 84). The PLS-predicted values versus the observed adulteration levels are presented in Figure 5. The estimation error increased almost twofold when both red and white wine samples were included in a single model. The RMSE = 0.3484 adulteration level means 0.59% added sugar and 6.85% water dilution.

3.2. Diffuse Reflectance Imaging

Laser-induced diffuse reflectance (backscattering) also responded sensitively to adulteration according to the results of the ANOVA (analysis of variances) test. More wavelengths and parameters indicated changes in response to added sugar than in response to water dilution. The results are summarized in Table 4. Only three combinations were found to be sensitive to both adulterations. Each is related to the shape and sharpness of the peak: D50/D75 is the ratio of the peak width with a 50% to 75% intensity, A25–75 is the illuminated area of the ring between 25% and 75% intensity, while A50/A25–75 is the ratio of the central illuminated area above 50% intensity to the area of the ring in the 25–75% range. Significant effects of p < 0.05 (small case) and p < 0.01 (upper case) are indicated in Table 4.
The F-scores of the ANOVA test for the selected parameters evaluated for all wine samples and separately for each type are presented in Table 5. Of these parameters, the ring area in the 25–75% range responded most sensitively and significantly to the wine type. This was likely the result of anthocyanin absorption in red wine, which can affect light distribution. The ratio of the segmented peak areas (A50/A25–75) was more sensitive to added sugar in Sauvignon Blanc wine but more sensitive to water dilution in Portugieser wine. A lower sensitivity of this parameter was observed in the analysis of all data. When comparing the adulteration factors, added sugar resulted in the highest F-score in Sauvignon Blanc (F = 161.4) and all wine samples (F = 65.56).
Although the ANOVA results indicated that the ratio of the segmented peak measured at 532 nm might be a suitable parameter for prediction, its correlation with the adulteration level was very low (r < 0.3). The general linear model (GLM) was applied using the three most sensitive parameters. The GLM model achieved regression quality parameters of R2 = 0.0487, RMSE = 1.725, RPD = 1.043 and AIC = 38.71. The Durbin–Watson autocorrelation test resulted in a 1.683 value, indicating the absence of systematic error. The RMSE value for the adulteration level means 3.06% added sugar and 20.39% water dilution. These prediction errors are much higher than that of NIR spectroscopy.
Linear discriminant analysis (LDA) was performed on the data measured to test the classification power of laser backscattering (Table 6). The samples were grouped according to adulteration level. Classification accuracy was higher for added sugar than for water dilution. Additionally, the results fluctuated very much, depending on the wavelength. The highest success rate of 100% was achieved for added sugar, while all samples, including adulteration with a mixture of water dilution and added sugar, resulted in lower values. The selection of sensitive parameters also decreased the classification accuracy. Adulteration with added sugar was detected without error at 635 nm, 850 nm and 1064 nm.

4. Discussion

Wine adulteration was tested by simulating prohibited techniques of water dilution and the addition of sugar to finished wine. The simulation was not limited to a single factor; mixed adulteration using both techniques was also performed. Analytical methods typically focus on one or a few key ingredients, such as the identification of anthocyanin by high performance liquid chromatography (HPLC) [4,9]. The evaluation of visible and NIR spectra was reported in order to be able to distinguish country of origin and estimate soluble solid content and pH [5,7,8,12]. These studies have shown that pigment concentration in wine, and especially the measured spectra, are suitable for the evaluation of wine quality and origin. The results presented in this study also showed that NIR spectra can be used to predict the adulteration level. Additionally, multiple adulteration factors (components) were successfully detected, even their mixture. The PLS-DA classification method was successfully used to detect the level and type of Irish whiskey adulteration based on NIR spectroscopy [13]. Compared to the present study, whiskey classes were prepared with 0.1–2.0% adulteration using methanol and ethyl acetate. While water dilution and added sugar were successfully detected using SNV normalized spectra in Portugieser and Sauvignon Blanc wines, methanol and ethyl acetate detection in Irish whiskey required second derivatives of the spectra. The authors also concluded that the identification of low-level adulteration (<1.0%) of whiskey was difficult. This result is similar to the PLS prediction error of 0.59% for added sugar. Water dilution was predicted with an error lower than 0.17% as a single factor and an error of 6.85% was reached for mixed adulteration. Water dilution was not considered adulteration, but it is clearly a prohibited practice used to increase profit.
Laser-induced diffuse reflectance, also called backscattering, is primarily used for the quality assessment of solid foods and produce [16,18]. It is a novel technique utilizing the interaction between light and biological material. Applications in liquid food are very limited. Yoghurt fermentation was successfully monitored by means of pH estimation [17]. There is no literature on the investigation of diffuse reflectance on transparent samples. Wine produced a narrow peak of intensity signal below 5 mm FWHM (full width at half maximum). The shape of the peak was detected as changing. Descriptive parameters of the peak shape changed significantly at 850 nm and 1064 nm due to added sugar. The parameters measured at 532 nm and 635 nm responded sensitively to both added sugar and water dilution. Classification based on LDA achieved a high success rate for added sugar (>93.33% at all wavelengths), and water dilution reached 76.67% (at 532 nm), but the GLM model was unable to estimate the adulteration rate with good accuracy. Without reference to the literature on the backscattering analysis of transparent liquids, the NIR results of the same samples can be used for comparison. The prediction errors of 3.06% achieved for added sugar and of 20.39% for water dilution are much higher than that of spectroscopy. The diffuse reflectance technique needs further development to produce a better signal and increase light distribution in the samples.
The methods proposed for predicting adulteration are different compared to those based on classification of wines according to designated origin or level of adulteration. Classification methods are limited to choosing the most similar group from training set. Prediction based on a regression model estimates the amount of adulterating components, and a decision can be made using a threshold value. The techniques proposed were able to estimate dissimilarity as the normalized distance from the original wine by means of the adulteration level. This approach can be useful for multiple adulterants applied in combination.

5. Conclusions

Adulteration was tested in this study using added sugar and water dilution for Sauvignon Blanc (white) and Portugieser (red) wines. Instead of a classification, the techniques proposed estimate the level of dissimilarity to original wine. Samples were prepared with single-factor adulteration as well as with their combination. NIR spectroscopy resulted in good prediction accuracy based on PLS regression. Addressing the single factor required three latent variables, while the adulteration level of the factors, including combinations, was successfully estimated with six latent variables. The global model including all adulteration techniques and wine types obtained R2 > 0.966 and RMSE = 0.3484. This prediction error of adulteration level corresponds to 0.59% added sugar and 6.85% water dilution. The NIR spectroscopy results are comparable to those in the literature, and suggest a technique for estimating the adulteration of wines. In the case of laser-induced backscattering, statistical analysis revealed that shape of the intensity signal changed in response to adulteration. The GLM model, based on the selected parameters, reached a higher prediction error of 3.06% added sugar and 20.39% water dilution (RMSE = 1.725). Backscattering parameters successfully discriminated samples with added sugar (100%) at 635 nm, 850 nm and 1064 nm using LDA. The classification of water dilution reached 76.67% at 532 nm. The backscattering signal was altered by adulteration, but this technique needs further development to achieve accurate prediction.

Author Contributions

Conceptualization, L.B. and D.A.; methodology, L.B., L.L.P.N. and D.A.; software, L.B.; validation, A.H., L.L.P.N. and D.A.; formal analysis, L.B.; investigation, A.H.; resources, L.B. and D.A.; data curation, A.H.; writing—original draft preparation, A.H. and L.B.; writing—review and editing, A.H., L.L.P.N. and D.A.; visualization, A.H. and L.B.; supervision, L.B. and D.A.; funding acquisition, L.B. All authors have read and agreed to the published version of the manuscript.

Funding

The project is supported by the European Union and co-financed by the European Social Fund (grant agreement no. EFOP-3.6.3-VEKOP-16-2017-00005).

Institutional Review Board Statement

Not applicable.

Informed Consent Statement

Not applicable.

Data Availability Statement

The data presented in this study are available on request from the corresponding author.

Conflicts of Interest

The authors declare no conflict of interest.

References

  1. Bánvölgyi, S.; Dusza, E.; Namukwambi, F.K.; Kiss, I.; Stefanovits-Bányai, É.; Vatai, G. Optimization of extraction of phenolic compounds from Tokaji Aszú marc using response surface methodology. Progr. Agric. Eng. Sci. 2020, 16, 1–9. [Google Scholar] [CrossRef]
  2. Christoph, N.; Baratossy, G.; Kubanovic, V.; Kozina, B.; Rossmann, A.; Schlicht, C.; Voerkelius, S. Possibilities and limitations of wine authentication using stable. Mit. Klost. 2004, 54, 144–158. [Google Scholar]
  3. Regulation (EU) No 1308/2013 of the European Parliament and of the Council of 17 December 2013 Establishing a Common Organisation of the Markets in Agricultural Products and Repealing Council Regulations (EEC) No 922/72, (EEC) No 234/79, (EC) No 1037/2001 and (EC) No 1234/2007. Available online: http://data.europa.eu/eli/reg/2013/1308/oj (accessed on 5 December 2021).
  4. Geana, E.I.; Popescu, R.; Costinel, D.; Dinca, O.R.; Stefanescu, I.; Ionete, R.E.; Bala, C. Verifying the red wines adulteration through isotopic and chromatographic investigations coupled with multivariate statistic interpretation of the data. Food Cont. 2016, 62, 1–9. [Google Scholar] [CrossRef]
  5. Arvanitoyannis, I.S. Wine authenticity, traceability and safety monitoring. In Managing Wine Quality; Reynolds, A.G., Ed.; Woodhead Publishing Limited: Sawston, UK, 2010; pp. 218–270. ISBN 978-1-84569-484-5. [Google Scholar] [CrossRef]
  6. Cimpoiu, C.; Hosu, A.; Briciu, R.; Miclaus, V. Monitoring the origin of wine by reversed-phase thin-layer chromatography. J. Plan. Chrom. 2007, 20, 407–410. [Google Scholar] [CrossRef]
  7. Hong, E.; Lee, S.Y.; Jeong, J.Y.; Park, J.M.; Kim, B.H.; Kwon, K.; Chun, H.S. Modern analytical methods for the detection of food fraud and adulteration by food category. J. Sci. Food Agric. 2017, 97, 3877–3896. [Google Scholar] [CrossRef] [PubMed]
  8. Ríos-Reina, R.; García-González, D.L.; Callejón, R.M.; Amigo, J.M. NIR spectroscopy and chemometrics for the typification of Spanish wine vinegars with a protected designation of origin. Food Cont. 2018, 89, 108–116. [Google Scholar] [CrossRef]
  9. Bridle, P.; Garcia-Viguera, C. A simple technique for the detection of red wine adulteration with elderberry pigments. Food Chem. 1995, 55, 111–113. [Google Scholar] [CrossRef]
  10. Penza, M.; Cassano, G. Recognition of adulteration of Italian wines by thin-film multisensor array and artificial neural networks. Anal. Chim. Acta 2004, 509, 159–177. [Google Scholar] [CrossRef]
  11. Zinia Zaukuu, J.L.; Gillay, Z.; Kovács, Z. Standardized extraction techniques for meat analysis with the electronic tongue: A case study of poultry and red meat adulteration. Sensors 2021, 21, 481. [Google Scholar] [CrossRef] [PubMed]
  12. Vitális, F.; Zinia Zaukuu, J.L.; Bodor, Z.; Aouadi, B.; Hitka, G.; Kaszab, T.; Zsom-Muha, V.; Gillay, Z.; Kovács, Z. Detection and quantification of tomato paste adulteration using conventional and rapid analytical methods. Sensors 2020, 20, 6059. [Google Scholar] [CrossRef] [PubMed]
  13. Power, A.C.; Jones, J.; NiNeil, C.; Geoghegan, S.; Warren, S.; Currivan, S.; Cozzolino, D. What’s in this drink? Classification and adulterant detection in Irish Whiskey samples using near infrared spectroscopy combined with chemometrics. J. Sci. Food Agric. 2021, 101, 5256–5263. [Google Scholar] [CrossRef] [PubMed]
  14. Nugraha, D.T.; Zinia Zaukuu, J.L.; Bósquez, J.P.A.; Bodor, Z.; Vitalis, F.; Kovács, Z. Near-infrared spectroscopy and aquaphotomics for monitoring mung bean (Vigna radiata) sprout growth and validation of ascorbic acid content. Sensors 2021, 21, 611. [Google Scholar] [CrossRef] [PubMed]
  15. Herrero-Latorre, C.; Barciela-García, J.; García-Martín, S.; Peña-Crecente, R.M. Detection and quantification of adulterations in aged wine using RGB digital images combined with multivariate chemometric techniques. Food Chem. 2019, 3, 100046. [Google Scholar] [CrossRef]
  16. Baranyai, L.; Zude, M. Analysis of laser light migration in apple tissue by Monte Carlo simulation. Progr. Agric. Eng. Sci. 2008, 4, 45–59. [Google Scholar] [CrossRef]
  17. Arango, O.; Trujillo, A.J.; Castillo, M. Inline control of yoghurt fermentation process using a near infrared light backscatter sensor. J. Food Eng. 2020, 277, 109885. [Google Scholar] [CrossRef]
  18. Sanchez, P.D.C.; Hashim, N.; Shamsudin, R.; Nor, M.Z.M. Laser-light backscattering imaging approach in monitoring and classifying the quality changes of sweet potatoes under different storage conditions. Posth. Biol. Tech. 2020, 164, 111163. [Google Scholar] [CrossRef]
Figure 1. Vision system setup for laser-induced diffuse reflectance imaging.
Processes 10 00095 g001
Figure 2. Intensity signals of diffuse reflectance of a selected wine sample.
Processes 10 00095 g002
Figure 3. Normalized spectral readings in 900–1700 nm and their change with water dilution (upper) and added sugar (lower). The arrows represent the direction of the increasing adulteration.
Processes 10 00095 g003aProcesses 10 00095 g003b
Figure 4. Loading values of LV1–3 for the PLSR model in 900–1700 nm.
Processes 10 00095 g004
Figure 5. PLSR prediction of adulteration level for Portugieser (o) and Sauvignon Blanc (+) wine samples.
Processes 10 00095 g005
Table 1. Wine adulteration levels of water dilution (v/v) or added sugar (m/m).
Portugieser (Red Wine)Sauvignon Blanc (White Wine)
LevelAdded Water, %Added Sugar, %LevelAdded Water, %Added Sugar, %
000000
128.573.62128.573.71
248.906.89248.907.15
363.5610.04363.5610.44
473.9713.06473.9713.35
581.4115.80581.4116.41
Table 2. Wine adulteration using a mixture of water dilution (v/v) and added sugar (m/m).
Portugieser (Red Wine)Sauvignon Blanc (White Wine)
LevelAdded Water, %Added Sugar, %LevelAdded Water, %Added Sugar, %
2.5048.985.082.4848.984.92
3.7228.5711.673.7928.5711.82
6.1081.4111.356.2181.4111.91
Table 3. PLSR model performance in the estimation of wine adulteration.
WinePortugieser (Red Wine)Sauvignon Blanc (White Wine)
FactorWaterSugarAllWaterSugarAll
Samples181842181842
LV336336
R20.99900.99970.98910.99920.99980.9913
RMSE0.166%0.504%0.1940.165%0.361%0.180
Table 4. Sensitivity of backscattering signal parameters according to the ANOVA test.
WavelengthD75D50D25D50/D75D25/D75A50A25–75A50/A25–75
1064sss--Ss-
850s-s--ss-
808w-s-----
780--s-----
635--ss/w--s-
532---w--s/wS/W
s = significant effect of added sugar (p < 0.05), w = significant effect of water dilution (p < 0.05). S = significant effect of added sugar (p < 0.01), W = significant effect of water dilution (p < 0.01).
Table 5. ANOVA F-scores for the most sensitive diffuse reflectance parameters.
Diffuse ReflectanceAdulteration Factors
WavelengthParameterWine TypeWaterSugar
532 nmA50/A25–750.5517.7172.439
532 nmA25–7516.360.83565.56
635 nmD50/D752.6691.2171.882
532 nmA50/A25–75Sauvignon Blanc1.12428.28
532 nmA25–751.111161.4
635 nmD50/D750.6011.271
532 nmA50/A25–75Portugieser21.181.527
532 nmA25–751.3627.511
635 nmD50/D751.041.95
Table 6. Classification results (%) of LDA on wine adulteration based on laser backscattering.
WavelengthAll ParametersSelected Parameters
WaterSugarAllWaterSugarAll
532 nm76.6796.6760.0060.0086.6723.33
635 nm66.6710080.0046.6793.3343.33
650 nm56.6793.3373.3350.0083.3333.33
780 nm73.3396.6773.3356.6780.0033.33
808 nm53.3393.3370.0046.6793.3326.67
850 nm63.3310080.0050.0093.3346.67
1064 nm56.6710066.6740.0093.3343.33
Publisher’s Note: MDPI stays neutral with regard to jurisdictional claims in published maps and institutional affiliations.

