
Synthesis, Characterization and Gas Adsorption of Unfunctionalized and TEPA-Functionalized MSU-2 †
by
 , and
, and
Xin Ying Lee
1,2,
Vinosha Viriya
1,2,
Thiam Leng Chew
1,2,*,
Pei Ching Oh
1,2,
Yit Thai Ong
3,
Chii-Dong Ho
4 and
Zeinab Abbas Jawad
5 1
Department of Chemical Engineering, Faculty of Engineering, Universiti Teknologi PETRONAS, Seri Iskandar 32610, Perak Darul Ridzuan, Malaysia
2
CO2 Research Centre (CO2RES), Institute of Contaminant Management, Universiti Tekologi PETRONAS, Seri Iskandar 32610, Perak Darul Ridzuan, Malaysia
3
Department of PetroChemical Engineering, Faculty of Engineering and Green Technology, Universiti Tunku Abdul Rahman, Kampar Campus, Jalan Universiti, Bandar Barat, Kampar 31900, Perak Darul Ridzuan, Malaysia
4
Department of Chemical and Materials Engineering, Tamkang University, No. 151, Yingzhuan Road, Tamsui District, New Taipei City 25137, Taiwan
5
Department of Chemical Engineering, College of Engineering, Qatar University, Doha P.O. Box 2713, Qatar
*
Author to whom correspondence should be addressed.
†
This paper is an extended version of papers published in the conferences: Energy Security and Chemical Engineering Congress (ESChE) 2019, Penang, Malaysia, 17–19 July 2019 and 5th International Conference of Chemical Engineering & Industrial Biotechnology, Virtual, 9–11 August 2020.
Processes 2022, 10(10), 1943; https://doi.org/10.3390/pr10101943
Submission received: 29 July 2022
/
Revised: 2 September 2022
/
Accepted: 4 September 2022
/
Published: 27 September 2022
(This article belongs to the Topic Carbon Capture, Storage and Utilisation Technologies (CCS/CCU))
Abstract
:Michigan State University-2 (MSU-2) is notable potential adsorbent for carbon dioxide (CO2) due to its intrinsic properties, which include its highly interconnected three-dimensional (3D) wormhole-like framework structure, high specific surface area, and its large total pore volume, as well as its large amount of surface silanol hydroxyl groups, which facilitate the amine functionalization process. In this study, unfunctionalized MSU-2 was synthesized via a fluoride-assisted two-step process via the solution precipitation method, using Triton X-100 as the surfactant and tetraethylorthosilicate (TEOS) as the silica precursor. Then, the synthesized MSU-2 was functionalized using varying tetraethylenepentamine (TEPA) loadings of 20–60 wt%. The effect of different TEPA loadings on the properties and CO2 adsorption capacity of the MSU samples was investigated. Studies of the CO2 adsorption of the unfunctionalized and TEPA-functionalized MSU-2 samples was conducted at 40 °C and 1 bar of pressure. Furthermore, scanning electron microscopy (SEM); surface area and porosity (SAP) analysis; carbon, hydrogen, nitrogen, and sulfur (CHNS) analysis, X-ray diffractometry (XRD); Fourier transform infrared (FTIR) spectrometry; and thermogravimetric analysis (TGA) were utilized to characterize the resultant unfunctionalized and TEPA-functionalized MSU-2 with different TEPA loadings in order to study their morphologies, pore characteristics, elemental compositions, crystallographic structures, functional groups, chemical bonding, and thermal stability, respectively. The comprehensive results obtained from the analytical instruments and the CO2 adsorption studies indicated that the TEPA-functionalized MSU-2 with 40 wt% of TEPA loading achieved the highest average CO2 adsorption capacity of 3.38 mmol-CO2/g-adsorbent.
1. Introduction
Global warming, which is mainly caused by the emission of excessive carbon dioxide (CO2) into the atmosphere, has become an environmental issue and environmentalists all over the world are searching for methods and materials to capture CO2 effectively [1]. According to the Global Energy & CO2 Status Report 2019 by the International Energy Agency (IEA), approximately two-thirds of the increase in CO2 emissions could be ascribed to the combustion of fossil fuels such as coal, petroleum, and natural gas in power plants in order to generate energy for industrial applications [2,3]. The high concentration of CO2 in the atmosphere has negative effects on nature, which include the greenhouse effect, the loss of the mass of ice sheets, and the warming of oceans [4]. Therefore, it is of the utmost importance to control the emission of CO2 into the atmosphere. One of the most practical methods is CO2 capture and sequestration (CCS).
Generally, absorption, membrane separation, cryogenic distillation, and adsorption are the four common types of technologies used in CO2 capture [5]. Although absorption technology using liquid amines is the most developed method among the others, its application is limited by drawbacks such as the high energy consumption required for amine regeneration, the corrosiveness of amines, high solution viscosity, amine losses, as well as the degradation of amines in the presence of oxygen [5,6,7,8,9,10]. Moreover, advancements in membrane technology in recent years have contributed hugely to the enhancement of CO2 capture technology; however, it still possesses some limitations due to the difficulty of operation on a large scale, the high energy requirements of post-combustion CO2 capture, as well as its high cost [5,7,10,11]. In addition, the application of cryogenic separation for CO2 capture is limited due to the fact that it is a highly energy-intensive process and due to the issue of CO2 refrigeration at low temperature [5,12]. On the other hand, adsorption technology, which is also a well-established CO2 removal technique, has gained wide attention in recent years as it involves lower energy consumption and operating costs. Moreover, adsorbents are commonly easy to regenerate during the desorption process. Furthermore, this technology performs well in low CO2 concentration feed gas streams [5].
Basically, adsorption is a surface phenomenon in which gas molecules are attached to a solid surface. The gas molecules and the solid surface are known as the adsorbate and the adsorbent, respectively [5,13]. The extent of CO2 adsorption is affected by various factors, in which the properties of the adsorbent used have significant effect on the adsorption performance of the system [14,15]. In order to ensure high CO2 adsorption capacity, a suitable adsorbent needs to have a high affinity with the targeted gas [16], large and tunable pore sizes, a large total pore volume, a high specific surface area, and a multi-dimensional porous framework [17]. The types of materials which have been studied for use as CO2 adsorbents include carbons [18], oxides (for example, ZnO) [19], metal organic frameworks (MOFs) [20], zeolites [21] and mesoporous silicas such as MCM-41, SBA-16, MSU-J, KIT-6, and MSU-1 [22,23,24,25,26]—all of which show high potential for CO2 adsorption as they exhibit the desired characteristics of a good adsorbent, as mentioned above. In addition, mesoporous silicas contain a large amount of silicon hydroxyl groups on the surface, which can facilitate further surface modifications through the formation of chemical bonds with the added organic materials [27]. One of the most common surface modification methods is amine-functionalization using the wet impregnation technique due to its simple preparation steps and the fact that no toluene is required [28]. In the wet impregnation method, the organic materials—specifically, organic amines—are dissolved in a solvent, usually methanol or ethanol, and mesoporous silicas are dispersed in the solution for the adherence of amine molecules on the pore walls of mesoporous silicas [29]. Various previous studies have been conducted to investigate the CO2 adsorption performance of amine-functionalized mesoporous silicas and it has been found that amine functionalization significantly enhanced the CO2 adsorption capacity of the resultant adsorbents. When mesoporous silicas are functionalized with amines, CO2 gas molecules react with the amino groups in amine molecules chemically to form carbamates, in which the interaction is stronger than that of with silanol hydroxyl groups on the surface of unfunctionalized mesoporous silicas [8,17].
MSU-2 is a promising material for use as a CO2 adsorbent due to its highly interconnected three-dimensional (3D) wormhole-like framework structure, its large pore volume, and the fact that it contains numerous surface silanol hydroxyl groups [30,31,32]. These characteristics facilitate better adsorption performance, as well as an easier functionalization process with amines. To the best of our knowledge, no studies have been conducted to date to assess CO2 adsorption using TEPA-functionalized MSU-2. In this study, unfunctionalized MSU-2 was synthesized by using TEOS and Triton X-100 as the source of the silicas and the template, respectively. Next, MSU-2 was functionalized using TEPA with loadings varying from 20 wt% to 60 wt%. The unfunctionalized and TEPA-functionalized MSU-2 were then characterized in terms of their morphology, pore characteristics, elemental composition, crystallinity, functional groups, and thermal stability using various analytical instruments. Moreover, the effect of TEPA loading on the CO2 adsorption capacity of the MSU samples was investigated. The aim of the current study was to find the optimum TEPA loading for functionalized MSU-2, as well as the highest CO2 adsorption capacity that can be achieved using the optimum TEPA functionalized MSU-2.
2. Materials and Methods
2.1. Materials
Triton X-100 (MW = ∼647, density = 1.065 g/mL) was purchased from Sigma Aldrich and used as the surfactant for the synthesis of MSU-2. Tetraethylorthosilicate (TEOS, ≥99%, MW = 208.33, density = 0.94 g/mL) was obtained from Merck and used as the silica precursor for MSU-2 preparation. Tetraethylenepentamine (TEPA, ≥95.0%, C8H23N5, MW = 189.30, density = 0.99 g/mL) was purchased from Acros Organics and used as the amine for functionalization. Hydrochloric acid fuming 37% (HCl, EMSURE®, ACS, ISO, Reag. Ph Eur) and absolute ethanol (EtOH, EMSURE®, ACS, ISO, Reag. Ph Eur, C2H5OH) were also purchased from Merck, whereas sodium fluoride (NaF, ≥98.5%, MW = 41.99) was obtained from R&M Chemicals. All the chemicals were of analytical grade. The 99.99% CO2 gas, 99.99% CH4 gas, and 99.99% N2 gas were purchased from Air Products.
2.2. Synthesis of Unfunctionalized MSU-2
MSU-2 was synthesized by means of a fluoride-assisted, two-step process of solution precipitation, of which the two most important processes included the self-assembly of the silica surfactant and the condensation of the silica precursor to form a colloidal sol. TEOS was mixed into 100 mL of a 0.02 M Triton X-100 aqueous solution with a TEOS/Triton X-100 molar ratio of 8 and the mixture was stirred at room temperature. Then, 0.25 M of HCl was added dropwise to the mixture of TEOS and Triton X-100 until the pH became 2. The resulting solution was then sonicated for 30 min at room temperature, stirred moderately for 5 h, and aged without agitation for 10 h to obtain a clear solution. NaF powder was added slowly under vigorous stirring to the resulting solution with a NaF/TEOS molar ratio of 0.04/1 for silica condensation to occur. Then, the beaker was placed into a water bath at 55 °C for 48 h in a static condition to allow the precipitation of the product. The solid sample was filtered off, washed with distilled water, and dried in an oven (Thermo Scientific Heratherm OGH100, Country of Origin: Germany) at 100 °C for 4 h. The solid sample was calcined in air at 200 °C for 6 h and then at 620 °C for 6 h to remove the framework-bound surfactant.
2.3. Synthesis of TEPA-Functionalized MSU-2
Prior to the functionalization process, the unfunctionalized MSU-2 was thermally pre-treated in an oven at 100 °C for 1 h. A specific amount of TEPA was dissolved in 20 mL of ethanol and stirred for 30 min. After complete dissolution, 1 g of unfunctionalized MSU-2 was dispersed into the TEPA/ethanol solution and stirred for 30 min. Then, the resulting mixture was sonicated for 30 min to improve the diffusion of TEPA inside the pores of the unfunctionalized MSU-2. To complete the volatilization of ethanol, the resultant slurry was evaporated at 70 °C for 16 h under stirring. The obtained TEPA-functionalized MSU-2 sample was then dried at 100 °C for 2 h in the oven. The resulting samples were denoted as TEPA(x)/MSU-2, where x represents the weight percentage of TEPA loaded in the MSU-2, which was equal to 20 wt%, 30 wt%, 40 wt%, 50 wt%, or 60 wt%.
2.4. CO2 Adsorption Experiment
The CO2 gas adsorption testing of the unfunctionalized and TEPA-functionalized MSU-2 was conducted in a column test rig with an inner diameter of 10 mm, whereas gas analysis throughout the experiment was performed using a gas analyzer (Gensonic Technology NDIR sensor, Model G2-03). Firstly, 4 g of the adsorbent was loaded into the gas adsorption column test rig and heated from room temperature to 100 °C and held for 3 h under 100 mL/min of N2 flow in order to remove the gases and moisture adsorbed from the surroundings. Then, the temperature was reduced to 40 °C for gas adsorption measurements and held at that point. The feed gas mixture consisting of 50% CO2 gas and 50% CH4 gas was passed through the adsorbent sample in the gas adsorption column test rig. The composition readings of the outlet gas were collected using a Gensonic gas analyzer at a 1 s interval. When the composition readings of the outlet gas reached 50% CO2 gas and 50% CH4 gas, this indicated the end of the adsorption process. Using the breakthrough curve plotted based on the raw data obtained from the Gensonic gas analyzer, the CO2 adsorption capacities of the unfunctionalized and TEPA-functionalized MSU-2 were determined. Three runs of adsorption tests under the same conditions were performed for each MSU-2 sample. The average value of the CO2 adsorption capacity for each MSU-2 sample was determined based on the CO2 adsorption capacities obtained in the 3 runs of adsorption tests.
2.5. Characterization
A scanning electron microscope (SEM, Hitachi TM3030 Tabletop, Japan), operated under an acceleration voltage of 5.00 kV, was used to study the morphology of the unfunctionalized and TEPA-functionalized MSU-2 adsorbents. A surface area and porosity analyzer (SAP, Micromeritics TriStar II 3020, USA) was used to evaluate the pore characteristics of the unfunctionalized and TEPA-functionalized MSU-2. Prior to the measurement, the adsorbent samples were degassed at 65 °C under vacuum conditions for 24 h to eliminate the moisture and the pre-adsorbed gases on the surface of the samples. The Brunauer–Emmett–Teller (BET) specific surface area was characterized based on N2 adsorption/desorption at −196 °C, whereas the total pore volume was computed based on the amount of N2 adsorbed after completing the condensation of pores at a relative pressure of p/p0 = 0.99. The elemental composition of the adsorbent samples was examined using a carbon, hydrogen, nitrogen, and sulfur analyzer (CHNS, Elementar vario MICRO cube, Germany). The crystallographic structures of the unfunctionalized and TEPA-functionalized MSU-2 were studied using an X-ray diffractometer (XRD, Bruker D2 PHASER Benchtop, Germany). The XRD patterns were obtained at room temperature by observing Cu Kα X-ray radiation in the 2θ range from 0.01° to 10° with a scanning step of 0.01°. A Fourier transform infrared spectrometer (FTIR, PerkinElmer Frontier, USA) was used to determine the functional groups and chemical bonding of the adsorbent samples, using the KBr wafer technique. The scans conducted were from 4000 cm−1 to 400 cm−1 with a 4 cm−1 resolution to obtain the absorption band. The thermal stability of the unfunctionalized and TEPA-functionalized MSU-2 was investigated using a thermogravimetric analyzer (TGA, PerkinElmer Simultaneous Thermal Analyzer STA 6000, USA). The adsorbent samples were heated from room temperature (25 °C) to 800 °C at a heating rate of 5 °C/min under an inert N2 atmosphere.
3. Results and Discussion
3.1. Morphology Analysis
In Figure 1 we present SEM images of unfunctionalized and TEPA-functionalized MSU-2 with different TEPA loadings. In Figure 1a, it can be observed that the synthesized unfunctionalized MSU-2 possessed a monodisperse spherical morphology, which is in good agreement with the results reported in the previous literature [30,31,33,34,35,36,37]. This is due to the mild acidity of pH 2 and the stable process that occurred during the hydrolysis step, caused the silica oligomers and the surfactant molecules present in the TEOS/Triton X-100 solution, forming spherical nanoscopic micellar hybrid objects [31,35]. Moreover, it can be observed in Figure 1b–f that all the MSU-2 functionalized with TEPA loadings of 20 wt% to 60 wt% also showed monodisperse spherical morphologies which were comparable to that of unfunctionalized MSU-2. These results indicate that even after TEPA impregnation, the spherical shape of the MSU-2 was well-preserved [38,39]. However, there was no obvious trend of a change in the MSU particles’ size observed when the TEPA loading was increased from 20 wt% to 60 wt%.
3.2. Pore Characteristics and Elemental Analysis
The nitrogen adsorption/desorption isotherms of the unfunctionalized and TEPA-functionalized MSU-2 were plotted as shown in Figure 2.
The N2 adsorption isotherms of the unfunctionalized MSU-2, as shown in Figure 2a, resembled the type IV adsorption isotherm, with a hysteresis loop around a relative pressure (p/p0) of approximately 0.43 to 0.80 [40,41,42]. This indicated the occurrence of pore condensation of N2 molecules in the mesopores [8,11,32,43]. Generally, an adsorbent with a type IV adsorption isotherm has a well-defined mesoporous structure [11,26] and its surface exhibits relatively strong interaction with gas adsorbate molecules [40,41,42].
Furthermore, Figure 2b–d show that the TEPA-functionalized MSU-2 with TEPA loadings of 20 wt% to 40 wt% also exhibited comparable type IV adsorption isotherms, indicating that the mesoporosity of TEPA(20)/MSU-2, TEPA(30)/MSU-2, and TEPA(40)/MSU-2 remained well-defined. These results indicate that with TEPA loadings up to 40 wt%, the impregnation of TEPA did not destroy the pore structure of the unfunctionalized MSU-2 [11]. However, the increment in TEPA loading caused the amount of N2 adsorbed on the surface of TEPA-functionalized MSU-2 to decrease. This was due to the fact that the addition of TEPA partially occupied the internal cavities of pore channels and this caused a reduction in the surface area and pore volume of the unfunctionalized MSU-2. Therefore, the specific surface area available for N2 adsorption became smaller, leading to the decreasing quantity of adsorbed N2 by TEPA-functionalized MSU-2. This phenomenon was further supported by the pore characteristics obtained from SAP measurements, as shown in Table 1. Before the impregnation of TEPA, the unfunctionalized MSU-2 possessed a high BET specific surface area (SBET) of 1223.13 m2/g and a total pore volume (Vp) of 0.87 cm3/g. Then, the SBET and Vp decreased drastically to 27.08 m2/g and 0.03 cm3/g, respectively, after 40 wt% of TEPA was loaded onto the MSU-2.
Moving on, with a further increment in TEPA loading to 50 wt% and 60 wt%, no obvious type IV adsorption isotherm could be observed, and the N2 adsorption/desorption isotherm patterns of TEPA(50)/MSU-2 and TEPA(60)/MSU-2 were almost a straight line [26]. This was due to the pore filling effect of TEPA in the pore spaces of the unfunctionalized MSU-2, with the mesopores totally covered by the excessive TEPA when the TEPA loading increased beyond 40 wt% [11]. As shown in Table 1, the decrease in SBET to 0.12 m2/g at 60 wt% of TEPA loading further proved that their mesopores were nearly completely occupied with TEPA. In addition, the Vp decreased to an extent that could not be measured and it could only be denoted as approximately zero as there were no distinct mesopores detected in TEPA-functionalized MSU-2 with more than 40wt% of TEPA loading [26,43].
In addition, the TEPA content in the TEPA-functionalized MSU-2, which is represented by the composition of nitrogen (N), measured via CHNS elemental analysis, exhibited a correlation with the SBET and Vp of the adsorbent samples obtained from SAP measurements. Based on the results shown in Table 1, it could be observed that when the TEPA loading increased from 20 wt% to 60 wt%, the weight percentage of N also increased from 7.62 wt% to 19.46 wt%. On the contrary, with an increasing weight percentage of N, the SBET and Vp of the TEPA-functionalized MSU-2 exhibited a decrease. These results indicated that TEPA was successfully impregnated onto the surface of unfunctionalized MSU-2 and they are in good agreement with the results reported in previous research works [11,44].
3.3. Crystallinity Analysis
The XRD diffraction patterns of unfunctionalized and TEPA-functionalized MSU-2 with different TEPA loadings are shown in Figure 3. In Figure 3a, it can be observed that the unfunctionalized MSU-2 exhibited a narrow XRD peak at a 2θ value of 1.0°, which is in good agreement with the XRD patterns reported in the previous literature [32,45]. This well-resolved low-angle XRD pattern corresponds to (100) crystal face diffraction [26,32]. In Figure 3b–f, the XRD diffraction angles with identical 2θ values are shown in the XRD patterns of TEPA(20)/MSU-2, TEPA(30)/MSU-2, TEPA(40)/MSU-2, TEPA(50)/MSU-2, and TEPA(60)/MSU-2, indicating that after TEPA impregnation, the mesostructure of MSU-2 was preserved [26]. However, we observed that the diffraction intensity of the XRD peaks at a 2θ value of 1.0° decreased when the loading of TEPA impregnated in MSU-2 increased. The decrease in diffraction intensity was due to a decrease in crystallinity when the loading of TEPA impregnated in MSU-2 increased. This is because TEPA also covered the outer surfaces of MSU-2, in addition filling in the pore channels of MSU-2. This shows that the pore ordering of TEPA-functionalized MSU-2 deteriorated with increasing TEPA loading from 20 wt% to 60 wt% [46]. Similar phenomena were reported by other researchers on TEPA-functionalized MSU-1 [26]. Moreover, after a drastic decrease in diffraction intensity with increasing TEPA loadings from 0 wt% to 50 wt%, the diffraction intensity remained constant when the loaded TEPA was beyond 50 wt%. This may be because there was excessive TEPA loading on the external surfaces of TEPA(50)/MSU-2 and TEPA(60)/MSU-2. Therefore, no obvious influence was observed on the diffraction intensity even when the amount of TEPA coated on the outer surface of the adsorbents continued to increase [20].
3.4. Functional Groups
The FTIR spectra of unfunctionalized and TEPA-functionalized MSU-2 shown in Figure 4 were used to examine the type of bonding formed in the chemical structure of the adsorbents. In Figure 4a, it can be observed that the significant features of the FTIR spectrum for the unfunctionalized MSU-2 included a large broad band between 3600 cm−1 and 3250 cm−1, which was centered at the band of about 3467 cm−1, and a few bands at wavenumbers of 1647 cm−1, 1077 cm−1, 800 cm−1, and 461 cm−1, which is in agreement with the FTIR spectra reported in the previous literature by Perez-Quintanilla et al. [32] and Wang et al. [26]. To be more specific, due to the overlapping of two bands, which indicates that the siloxane chains in the structure of the unfunctionalized MSU-2 were long or branched, the broad strong band centered at 1077 cm−1 was associated with a broad shoulder at 1217 cm−1. Hence, this caused the -Si-O-Si- absorption to become broader and more complex [47,48]. Based on the correlations of group vibrations to regions of infrared absorption [49,50] and the spectrum–structure correlations of infrared analysis for organosilicon compounds [47,48], Table 2 show the type of bonding represented by each of the peaks in the FTIR spectra of unfunctionalized and TEPA-functionalized MSU-2.
By comparing the FTIR spectra of unfunctionalized MSU-2 shown in Figure 4a and TEPA-functionalized MSU-2 with different TEPA loadings shown in Figure 4b–f, it can be observed that all the peaks exhibited in the unfunctionalized MSU-2 were also evident in the FTIR spectra of TEPA-functionalized MSU-2 with amine loadings of 20 wt% to 60 wt%, indicating the successful impregnation of TEPA onto MSU-2. However, as the mass of the TEPA molecules in the MSU-2 increased with higher TEPA loadings, the large broad band at 3467 cm−1 gradually shifted to a lower wavenumber. This shows that a reaction took place between the surface hydroxyl groups of MSU-2 adsorbents and the amino groups present in TEPA molecules where new hydrogen bonds were formed [11]. Moreover, the presence of the bands attributed to unfunctionalized MSU-2 at 1647 cm−1, 1077 cm−1, 800 cm−1, and 461 cm−1 in the FTIR spectra of TEPA-functionalized MSU-2 with different TEPA loadings shows that the characteristic bands of MSU-2 remained undestroyed by TEPA impregnation [11]. However, owing to the increasing amount of TEPA loaded on the surface of MSU-2, the percentage of transmittance for all the peaks exhibited a gradual decrease with increasing TEPA loadings from 20 wt% to 60 wt% [8]. Furthermore, some additional bands were displayed in the FTIR spectra of all the TEPA-functionalized MSU-2, including bands at 2950 cm−1, 2843 cm−1, 1571 cm−1, 1477 cm−1, and 1310 cm−1. These bands indicate that TEPA was successfully impregnated on the surface of MSU-2. In addition, the percentage of transmittance of the adsorption peaks exhibited at wavenumbers of 2950 cm−1, 2843 cm−1, 1477 cm−1, and 1310 cm−1 increased with increasing TEPA loadings as a higher amount of TEPA in MSU-2 contributed to stronger bond vibrations, which then lead to a higher-intensity bands.
3.5. Thermal Analysis
The thermal stability of unfunctionalized and TEPA-functionalized MSU-2 was evaluated based on their TGA profiles and DTG curves, as shown in Figure 5 and Figure 6, respectively. From the TGA profiles, the weight percentage loss, which indicated the amount of TEPA loaded, was obtained, whereas the degradation temperature of the adsorbent samples was determined from the DTG curves. Table 3 summarizes the weight loss in the TGA profiles of the adsorbent samples and pure liquid TEPA.
As shown in the TGA profile from Figure 5, the unfunctionalized MSU-2 illustrated only one-step degradation at around 30 °C to 80 °C, whereas the TEPA-functionalized MSU-2 exhibited a two-step degradation at about 30 °C to 80 °C and 190 °C to 290 °C. Firstly, the small weight loss of less than 6% prior to 100 °C in both unfunctionalized and TEPA-functionalized MSU-2 was associated with the desorption of physically pre-adsorbed water and gas molecules from the adsorbent samples. As shown in Figure 5, a magnification of the overlapped TGA profile lines of unfunctionalized and functionalized MSU-2 for the first small weight loss (which occurred due to the desorption of physically pre-adsorbed water and gas molecules) can be seen. For unfunctionalized MSU-2, no significant weight loss was observed when the temperature continued to rise to 800 °C. This phenomenon is comparable with the TGA profiles and DTG curves reported in the previous literature [8,11,25,26,51,52,53]. For TEPA-functionalized MSU-2, the first small weight loss was also due to the elimination of the ethanol solvent which had not been completely removed during the fabrication process [52,53]. Moving on, the obvious drop in the TGA profiles and the peaks exhibited by the DTG curves of TEPA-functionalized MSU-2 with TEPA loadings of 20 wt% to 60 wt% indicated the second weight loss around 190 °C to 290 °C, where the degradation temperature range was close to that of pure TEPA (approximately 260 °C). Therefore, this drastic weight loss was attributed to the decomposition of amine groups present in the impregnated TEPA on the adsorbent surface, as well as TEPA volatilization [11,25,26]. As the TEPA loading increased from 20 wt% to 60 wt%, the second-step weight loss also increased from 16.53% to 52.95% as shown in Table 3. As shown in Figure 5, the total weight loss of the samples increased when the TEPA loading increased from 20 wt% to 60 wt%. The higher the TEPA loading functionalized onto the samples, the higher the total weight loss of the samples. This was because when the samples functionalized with higher amounts of TEPA were heated in the TGA analysis, larger amounts of amine groups were decomposed, and therefore higher total weight losses were displayed by the samples functionalized with higher TEPA loadings.
3.6. Effect of TEPA Loading on CO2 Adsorption Capacity of Adsorbents
CO2 adsorption experiments with unfunctionalized and TEPA-functionalized MSU-2 were conducted at 40 °C and 1 bar of pressure and the results, with standard deviations of 0.03–0.18, are shown in Figure 7.
Compared to the unfunctionalized MSU-2, the average CO2 adsorption capacity of TEPA-functionalized MSU-2 with different TEPA loadings showed a significant increase. Although the unfunctionalized MSU-2 possessed an average CO2 adsorption capacity of 0.63 mmol-CO2/g-adsorbent, which is relatively lower than that of TEPA-functionalized MSU-2, this value is comparable with the CO2 adsorption capacities of various unfunctionalized mesoporous silica adsorbents reported in previous research works [11,26,29,43]. This is due to the weak affinity of the silanol hydroxyl groups of unfunctionalized MSU-2 towards CO2 gas molecules. However, after TEPA impregnation, the amino groups in TEPA molecules showed high affinity with the CO2 gas molecules, thus promoting stronger interaction between the adsorbent surface and gas adsorbate molecules through the formation of carbamates. In accordance with this, the TEPA-functionalized MSU-2 showed a higher CO2 adsorption capacity [11].
Furthermore, with increasing TEPA loadings, the average CO2 adsorption capacity of the TEPA-functionalized MSU-2 also increased until it reached a maximum value of 3.38 mmol-CO2/g-adsorbent at 40 wt% TEPA loading. However, a further increase in TEPA loading up to 60 wt% caused the average CO2 adsorption capacity to decrease to 1.23 mmol-CO2/g-adsorbent. These results indicate that the optimum TEPA loading in the current study was 40 wt%, which is also in accordance with the characterization results obtained from SAP and XRD analysis. At low TEPA loadings, which were below the optimum loading, a larger amount of approachable adsorption active sites was available on the adsorbent surfaces, with increasing amounts of TEPA being impregnated, thus adsorbing more CO2 gas molecules. However, this relationship was limited by the specific surface area and the total pore volume of the unfunctionalized MSU-2. This is due to the fact that there was a point at which the mesopore channels of the unfunctionalized MSU-2 were fully filled with TEPA, leading to the blockage of pores [26]. Then, the excess TEPA started to cover the outer surface of the adsorbent particle, preventing CO2 gas molecules from being diffused into the pore channels and from reaching the adsorption sites [43]. Thus, a lower amount of CO2 gas molecules was adsorbed by the TEPA-functionalized MSU-2 with TEPA loadings beyond the optimum amount.
4. Conclusions
In the current study, unfunctionalized MSU-2 was successfully synthesized via a fluoride-assisted two-step process of solution precipitation and TEPA was successfully impregnated onto MSU-2 through the wet impregnation method as verified by SAP, CHNS, XRD, FTIR, and TGA analyses. Moreover, SEM analyses indicated that the monodisperse microspherical morphology of the MSU-2 was not destroyed in the TEPA functionalization process. However, with increasing TEPA loadings, the BET specific surface area and the total pore volume of the adsorbent samples, as measured through SAP analysis, decreased, whereas the CHNS analysis showed an increase in the N content, indicating a larger amount of impregnated TEPA. Furthermore, the intensities of TEPA-functionalized MSU-2 in XRD analysis were lower than that of unfunctionalized MSU-2 due to the reduction in crystallinity that occurred after TEPA impregnation. Moreover, the functionalization of TEPA onto MSU-2 caused the shifting of absorption bands and the appearance of new bands in the FTIR spectra of TEPA-functionalized MSU-2, indicating bonding between the surface hydroxyl groups of MSU-2 and amine groups in TEPA. In addition, TGA profiles indicated that the total weight loss was higher for the TEPA-functionalized MSU-2 with higher TEPA loading. Lastly, based on CO2 gas adsorption experiments conducted at 40 °C and 1 bar of pressure, we found that the functionalization of TEPA significantly enhanced the CO2 adsorption capacity of MSU-2. In conclusion, based on the comprehensive outcomes obtained from the characterization and CO2 adsorption experiments, the optimum TEPA loading was 40 wt%, with TEPA(40)/MSU-2 possessing an average CO2 adsorption capacity of 3.38 mmol-CO2/g-adsorbent.
Author Contributions
Conceptualization, X.Y.L. and T.L.C.; methodology, X.Y.L.; validation, X.Y.L.; formal analysis, X.Y.L. and Y.T.O.; investigation, X.Y.L.; writing—original draft preparation, X.Y.L. and T.L.C.; writing—review and editing, V.V., C.-D.H. and Z.A.J.; visualization, X.Y.L. and T.L.C.; supervision, T.L.C. and P.C.O. All authors have read and agreed to the published version of the manuscript.
Funding
This research was funded by YUTP-Fundamental Research Grant (Cost center: 015LC0-258) and YUTP-Fundamental Research Grant (015LC0-396). The APC was funded by YUTP-Fundamental Research Grant (Cost center: 015LC0-258).
Acknowledgments
The author would like to acknowledge the financial support from YUTP-Fundamental Research Grant (Cost center: 015LC0-258) and YUTP-Fundamental Research Grant (015LC0-396). This research work was also supported by Universiti Teknologi PETRONAS, Institute of Contaminant Management UTP, CO2 Research Centre (CO2RES), UTP.
Conflicts of Interest
The authors declare no conflict of interest. The funders had no role in the design of the study; in the collection, analyses, or interpretation of data; in the writing of the manuscript; or in the decision to publish the results.
References
- Hauchhum, L.; Mahanta, P. Carbon dioxide adsorption on zeolites and activated carbon by pressure swing adsorption in a fixed bed. Int. J. Energy Environ. Eng. 2014, 5, 349–356. [Google Scholar] [CrossRef]
- Global Energy & CO2 Status Report 2019. Available online: https://www.iea.org/reports/global-energy-co2-status-report-2019 (accessed on 14 July 2022).
- Robertson, D. Health effects of increase in concentration of carbon dioxide in the atmosphere. Curr. Sci. 2006, 90, 1607–1609. [Google Scholar]
- Mei, W.; Primeau, F.; McWilliams, J.C.; Pasquero, C. Sea surface height evidence for long-term warming effects of tropical cyclones on the ocean. Proc. Natl. Acad. Sci. USA 2013, 110, 15207–15210. [Google Scholar] [CrossRef] [PubMed]
- Songolzadeh, M.; Soleimani, M.; Ravanchi, M.T.; Songolzadeh, M. Carbon Dioxide Separation from Flue Gases: A Technological, Review Emphasizing Reduction in Greenhouse Gas Emissions. Sci. World J. 2014, 14, 828131. [Google Scholar] [CrossRef] [PubMed]
- Bounaceur, R.; Lape, N.; Roizard, D.; Vallieres, C.; Favre, E. Membrane processes for post-combustion carbon dioxide capture: A parametric study. Energy 2006, 31, 2556–2570. [Google Scholar] [CrossRef]
- Gupta, M.; Coyle, I.; Thambimuthu, K. CO2 Capture Technologies and Opportunities in Canada: “Strawman Document for CO2 Capture and Storage (CC&S) Technology Roadmap”, 1st ed.; Canadian CC& S Technology Roadmap Workshop: Calgary, AB, Canada, 2003. [Google Scholar]
- Lu, C.; Bai, H.; Su, F.; Chen, W.; Hwang, J.F.; Lee, H.-H. Adsorption of Carbon Dioxide from Gas Streams via Mesoporous Spherical-Silica Particles. J. Air Waste Manag. Assoc. 2010, 60, 489–496. [Google Scholar] [CrossRef]
- Meth, S.; Goeppert, A.; Prakash, G.K.S.; Olah, G.A. Silica Nanoparticles as Supports for Regenerable CO2 Sorbents. Energy Fuels 2012, 26, 3082–3090. [Google Scholar] [CrossRef]
- Olajire, A.A. CO2 capture and separation technologies for end-of-pipe applications—A review. Energy 2010, 35, 2610–2628. [Google Scholar] [CrossRef]
- Jiao, J.; Lv, P.; Wang, L.; Dan, S.; Qi, L.; Cui, Y. CO2 capture of amino functionalized three-dimensional worm-hole mesostructured MSU-J silica. J. Porous Mater. 2014, 21, 775–781. [Google Scholar] [CrossRef]
- Kapdi, S.; Vijay, V.; Rajesh, S.; Prasad, R. Biogas scrubbing, compression and storage: Perspective and prospectus in Indian context. Renew. Energy 2005, 30, 1195–1202. [Google Scholar] [CrossRef]
- Adsorption. Available online: https://www.slideshare.net/Kamyaparashar/adsorption-presentation-44669901 (accessed on 14 July 2022).
- Tyagi, V.; Ratna Sagar, P. Essential Chemistry Xii; Ratna Sagar P. Ltd.: Delhi, India, 2009. [Google Scholar]
- Anusha, G. Feasibility Studies on the Removal of Iron and Fluoride from Aqueous Solution by Adsorption Using Agro Based Waste Materials. Ph.D. Thesis, Anna University, Chennai, India, 2015. [Google Scholar]
- Gargiulo, N.; Pepe, F.; Caputo, D. CO2 Adsorption by Functionalized Nanoporous Materials: A Review. J. Nanosci. Nanotechnol. 2014, 14, 1811–1822. [Google Scholar] [CrossRef] [PubMed]
- Ma, Y.; Wang, Z.; Xu, X.; Wang, J. Review on porous nanomaterials for adsorption and photocatalytic conversion of CO2. Chin. J. Catal. 2017, 38, 1956–1969. [Google Scholar] [CrossRef]
- Ma, C.; Bai, J.; Hu, X.; Jiang, Z.; Wang, L. Nitrogen-doped porous carbons from polyacrylonitrile fiber as effective CO2 ad-sorbents. J. Environ. Sci. 2023, 125, 533–543. [Google Scholar] [CrossRef]
- Usseinov, A.B.; Akilbekov, A.T.; Kotomin, E.A.; Popov, A.I.; Seitov, D.D.; Nekrasov, K.A.; Giniyatova, S.G.; Karipbayev, Z.T. The first principles calculations of CO2 adsorption on (101––0100) ZnO surface. AIP Conf. Proc. 2019, 2174, 020181. [Google Scholar]
- Lee, G.; Yoo, D.K.; Ahmed, I.; Lee, H.J.; Jhung, S.H. Metal-organic frameworks composed of nitro groups: Preparation and applications in adsorption and catalysis. Chem. Eng. J. 2023, 451, 138538. [Google Scholar] [CrossRef]
- Wang, J.; Zhou, Y.; Hu, X. Adsorption of CO2 by a novel zeolite doped amine modified ternary aerogels. Environ. Res. 2022, 214, 113855. [Google Scholar] [CrossRef]
- Lashaki, M.J.; Ziaei-Azad, H.; Sayari, A. Unprecedented improvement of the hydrothermal stability of amine-grafted MCM-41 silica for CO2 capture via aluminum incorporation. Chem. Eng. J. 2022, 450, 138393. [Google Scholar] [CrossRef]
- Liu, Y.; Lin, X.; Wu, X.; Liu, M.; Shi, R.; Yu, X. Pentaethylenehexamine loaded SBA-16 for CO2 capture from simulated flue gas. Powder Technol. 2017, 318, 186–192. [Google Scholar] [CrossRef]
- Jiao, J.; Cao, J.; Lv, P.P. Amine-immobilized Three-dimensional Wormhole Mesostructured MSU-J Silica for CO2 Adsorption: Effect of Amine Loading and Temperature on the Adsorption Capacity. Chem. Lett. 2015, 44, 928–930. [Google Scholar] [CrossRef]
- Kishor, R.; Ghoshal, A.K. Amine-Modified Mesoporous Silica for CO2 Adsorption: The Role of Structural Parameters. Ind. Eng. Chem. Res. 2017, 56, 6078–6087. [Google Scholar] [CrossRef]
- Wang, X.; Li, H.; Liu, H.; Hou, X. AS-synthesized mesoporous silica MSU-1 modified with tetraethylenepentamine for CO2 adsorption. Microporous Mesoporous Mater. 2011, 142, 564–569. [Google Scholar] [CrossRef]
- Chen, C.; Kim, J.; Ahn, W.-S. CO2 capture by amine-functionalized nanoporous materials: A review. Korean J. Chem. Eng. 2014, 31, 1919–1934. [Google Scholar] [CrossRef]
- Wang, X.; Schwartz, V.; Clark, J.C.; Ma, X.; Overbury, S.H.; Xu, X.; Song, C. Infrared Study of CO2 Sorption over “Molecular Basket” Sorbent Consisting of Polyethylenimine-Modified Mesoporous Molecular Sieve. J. Phys. Chem. C 2009, 113, 7260–7268. [Google Scholar] [CrossRef]
- Jiao, J.; Cao, J.; Xia, Y.; Zhao, L. Improvement of adsorbent materials for CO2 capture by amine functionalized mesoporous silica with worm-hole framework structure. Chem. Eng. J. 2016, 306, 9–16. [Google Scholar] [CrossRef]
- Beaudet, L.; Hossain, A.K.-Z.; Mercier, L. Direct Synthesis of Hybrid Organic−Inorganic Nanoporous Silica Microspheres. 1. Effect of Temperature and Organosilane Loading on the Nano- and Micro-Structure of Mercaptopropyl-Functionalized MSU Silica. Chem. Mater. 2002, 15, 327–334. [Google Scholar] [CrossRef]
- Boissière, C.; Larbot, A.; van der Lee, A.; Kooyman, P.J.; Prouzet, E. A New Synthesis of Mesoporous MSU-X Silica Controlled by a Two-Step Pathway. Chem. Mater. 2000, 12, 2902–2913. [Google Scholar] [CrossRef]
- Pérez-Quintanilla, D.; Sánchez, A.; del Hierro, I.; Fajardo, M.; Sierra, I. Synthesis and characterization of novel mesoporous silicas of the MSU-X family for environmental applications. J. Nanosci. Nanotechnol. 2009, 9, 4901–4909. [Google Scholar] [CrossRef]
- Biswas, K.; Ray, J.C.; Choi, J.-S.; Ahn, W.-S. Morphology control of MSU-1 silica particles. J. Non-Cryst. Solids 2008, 354, 1–9. [Google Scholar] [CrossRef]
- Biswas, K.; Jang, S.-H.; Ahn, W.-S.; Baik, Y.-S.; Cheong, W.J. Synthesis of MSU-1 silica particles with spherical morphology. Stud. Surf. Sci. Catal. 2007, 165, 587–590. [Google Scholar]
- Boissiere, C.; Kuemmel, M.; Persin, M.; Larbot, A.; Prouzet, E. Spherical MSU-1 mesoporous silica particles tuned for HPLC. Adv. Funct. Materials. 2001, 11, 129–135. [Google Scholar] [CrossRef]
- Lee, G.; Youn, H.-K.; Jin, M.-J.; Cheong, W.-J.; Ahn, W.-S. Synthesis of organic–inorganic hybrid MSU-1 for separation and catalytic applications. Microporous Mesoporous Mater. 2010, 132, 232–238. [Google Scholar] [CrossRef]
- Martines, M.A.; Yeong, E.; Larbot, A.; Prouzet, E. Temperature dependence in the synthesis of hexagonal MSU-3 type mesoporous silica synthesized with Pluronic P123 block copolymer. Microporous Mesoporous Mater. 2004, 74, 213–220. [Google Scholar] [CrossRef]
- Rahmam, S.B. Optimization of Surface Treatment and Functionalization of Multiwalled Carbon Nanotubes (MWCNT) for Carbon Dioxide (CO2) Adsorption. In Chemical Engineering; Universiti Teknologi PETRONAS: Bandar Seri Iskandar, Malaysia, 2014. [Google Scholar]
- Talavera-Pech, W.; Avila-Ortega, A.; Pacheco Catalán, D.; Quintana-Owen, P.; Barron-Zambrano, J. Effect of Functionaliza-tion Synthesis Type of Amino-MCM-41 Mesoporous Silica Nanoparticles on Its RB5 Adsorption Capacity and Kinetics. Silicon 2018, 11, 1547–1555. [Google Scholar] [CrossRef]
- Gregg, S.J.; Sing, K.S.W. Adsorption, Surface Area and Porosity. Ber. Bunsenges. Phys. Chem. 1982, 86, 957. [Google Scholar] [CrossRef]
- Rouquerol, F.; Rouquerol, J.; Sing, K. Adsorption by Powders and Porous Solids; Elsevier Ltd.: Amsterdam, The Netherlands, 1999. [Google Scholar]
- Lee, X.Y.; Chew, T.L.; Oh, P.C.; Ho, C.-D.; Ong, Y.T. Synthesis and Characterization of MSU-2 for CO2 Adsorption. IOP Conf. Series Mater. Sci. Eng. 2020, 991, 012076. [Google Scholar] [CrossRef]
- Wang, D.; Wang, X.; Ma, X.; Fillerup, E.; Song, C. Three-dimensional molecular basket sorbents for CO2 capture: Effects of pore structure of supports and loading level of polyethylenimine. Catal. Today 2014, 233, 100–107. [Google Scholar] [CrossRef]
- Watabe, T.; Yogo, K. Efficient CO2 Adsorption on Amine-impregnated Mesoporous Silica Sorbents: Interpretation of Moderate Amine Loading. Chem. Lett. 2014, 43, 790–792. [Google Scholar] [CrossRef]
- Park, I.; Wang, Z.; Pinnavaia, T.J. Assembly of Large-Pore Silica Mesophases with Wormhole Framework Structures from α,ω-Diamine Porogens. Chem. Mater. 2005, 17, 383–386. [Google Scholar] [CrossRef]
- Teng, Z.; Lu, Z.; Li, J.; Zhuang, J.; Yang, W. The effect of 1-propanol on structure and hydrothermal stability of MSU-4 silica spheres. Colloids Surf. A Physicochem. Eng. Asp. 2011, 384, 200–204. [Google Scholar] [CrossRef]
- Bellamy, L.J. Organo-Silicon Compounds. In The Infra-Red Spectra of Complex Molecules; Bellamy, L.J., Ed.; Springer: Dordrecht, The Netherlands, 1975; pp. 374–384. [Google Scholar]
- Smith, A.L. Analysis of Silicones; Wiley: New York, NY, USA, 1974; Volume 41. [Google Scholar]
- Lin, S.-P. Introduction of Molecular Vibrations & IR Spectroscopy. In Modern Optical Spectroscopy; Institute of Biomedical Engineering, National Chung Hsing University: Taiwan, 2016. [Google Scholar]
- Oxtoby, D.W.; Gillis, H.P.; Butler, L.J. Principles of Modern Chemistry; Cengage Learning: Boston, MA, USA, 2015. [Google Scholar]
- Lin, L.-Y.; Bai, H. Continuous generation of mesoporous silica particles via the use of sodium metasilicate precursor and their potential for CO2 capture. Microporous Mesoporous Mater. 2010, 136, 25–32. [Google Scholar] [CrossRef]
- Dao, D.S.; Yamada, H.; Yogo, K. Large-Pore Mesostructured Silica Impregnated with Blended Amines for CO2 Capture. Ind. Eng. Chem. Res. 2013, 52, 13810–13817. [Google Scholar] [CrossRef]
- Dao, D.S.; Yamada, H.; Yogo, K. Response Surface Optimization of Impregnation of Blended Amines into Mesoporous Silica for High-Performance CO2 Capture. Energy Fuels 2015, 29, 985–992. [Google Scholar] [CrossRef]
Figure 1.
SEM images at 10,000× magnification of (a) unfunctionalized MSU-2, and MSU-2 functionalized with TEPA loadings of (b) 20 wt%, (c) 30 wt%, (d) 40 wt%, (e) 50 wt%, and (f) 60 wt%.
Figure 1.
SEM images at 10,000× magnification of (a) unfunctionalized MSU-2, and MSU-2 functionalized with TEPA loadings of (b) 20 wt%, (c) 30 wt%, (d) 40 wt%, (e) 50 wt%, and (f) 60 wt%.
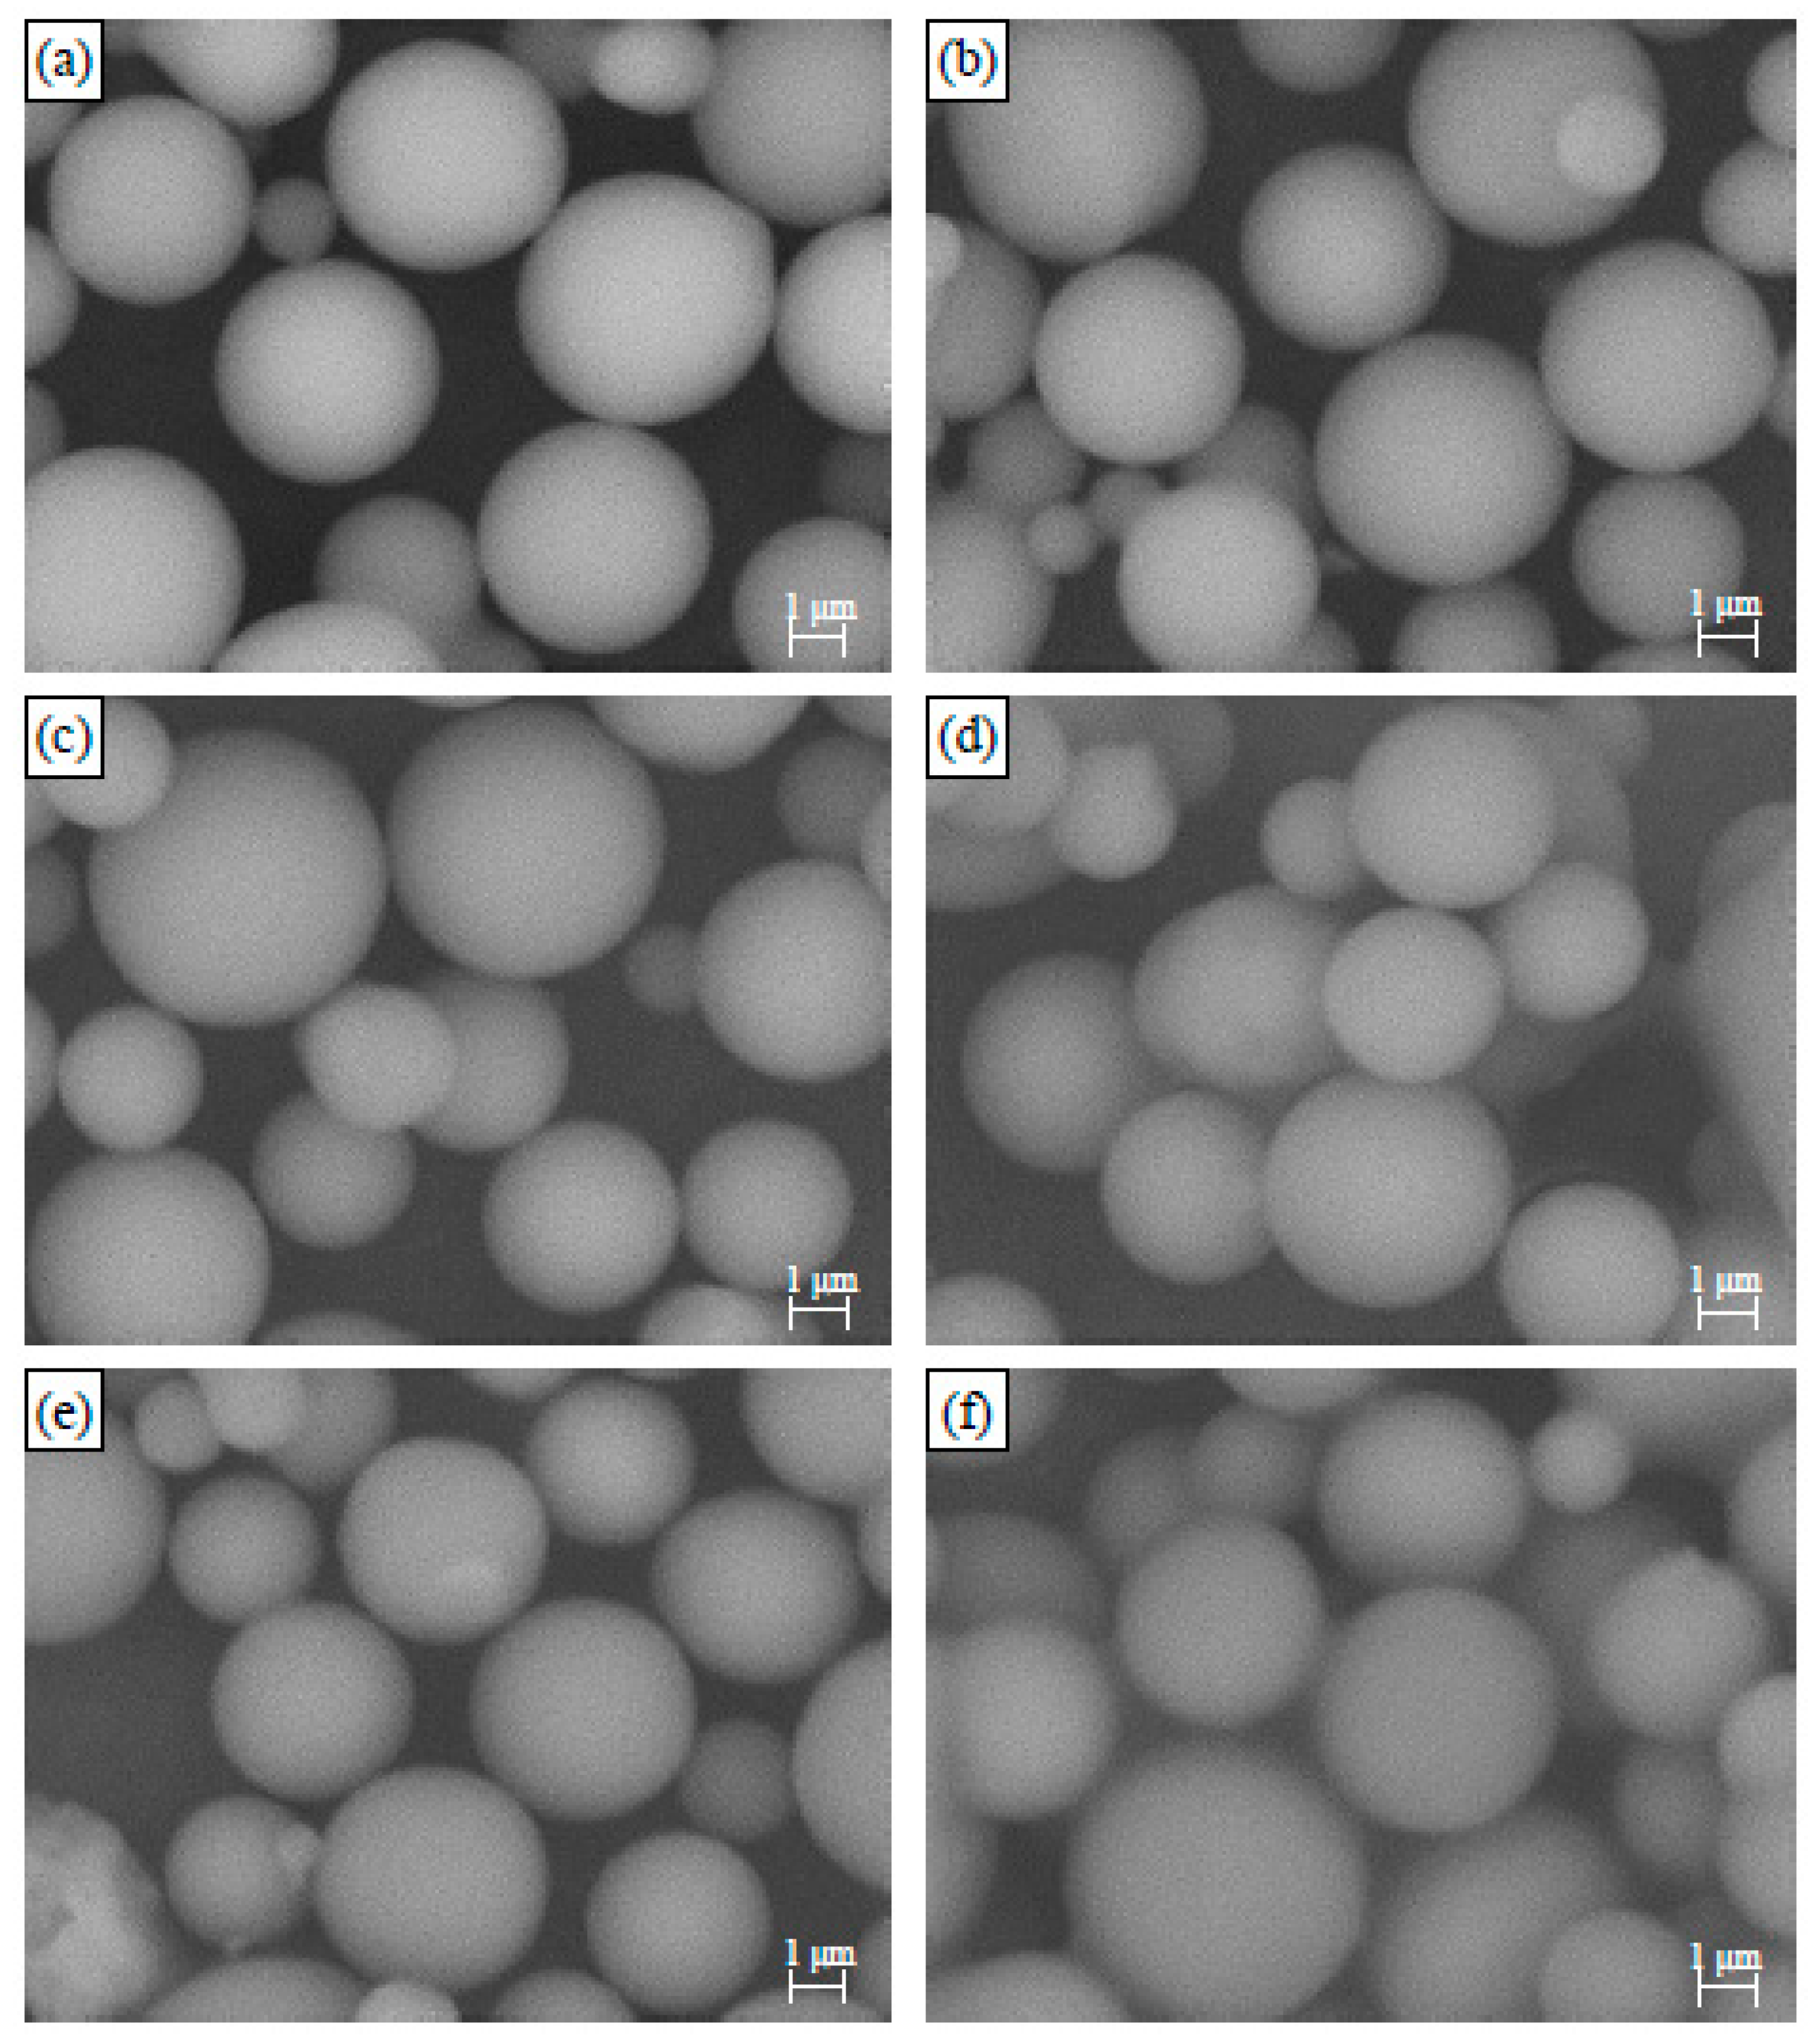
Figure 2.
Nitrogen adsorption/desorption isotherms of (a) unfunctionalized MSU-2, and MSU-2 functionalized with TEPA loadings of (b) 20 wt%, (c) 30 wt%, (d) 40 wt%, (e) 50 wt%, and (f) 60 wt%.
Figure 2.
Nitrogen adsorption/desorption isotherms of (a) unfunctionalized MSU-2, and MSU-2 functionalized with TEPA loadings of (b) 20 wt%, (c) 30 wt%, (d) 40 wt%, (e) 50 wt%, and (f) 60 wt%.

Figure 3.
XRD diffraction patterns of (a) unfunctionalized MSU-2 and MSU-2 functionalized with TEPA loadings of (b) 20 wt%, (c) 30 wt%, (d) 40 wt%, (e) 50 wt%, and (f) 60 wt%.
Figure 3.
XRD diffraction patterns of (a) unfunctionalized MSU-2 and MSU-2 functionalized with TEPA loadings of (b) 20 wt%, (c) 30 wt%, (d) 40 wt%, (e) 50 wt%, and (f) 60 wt%.
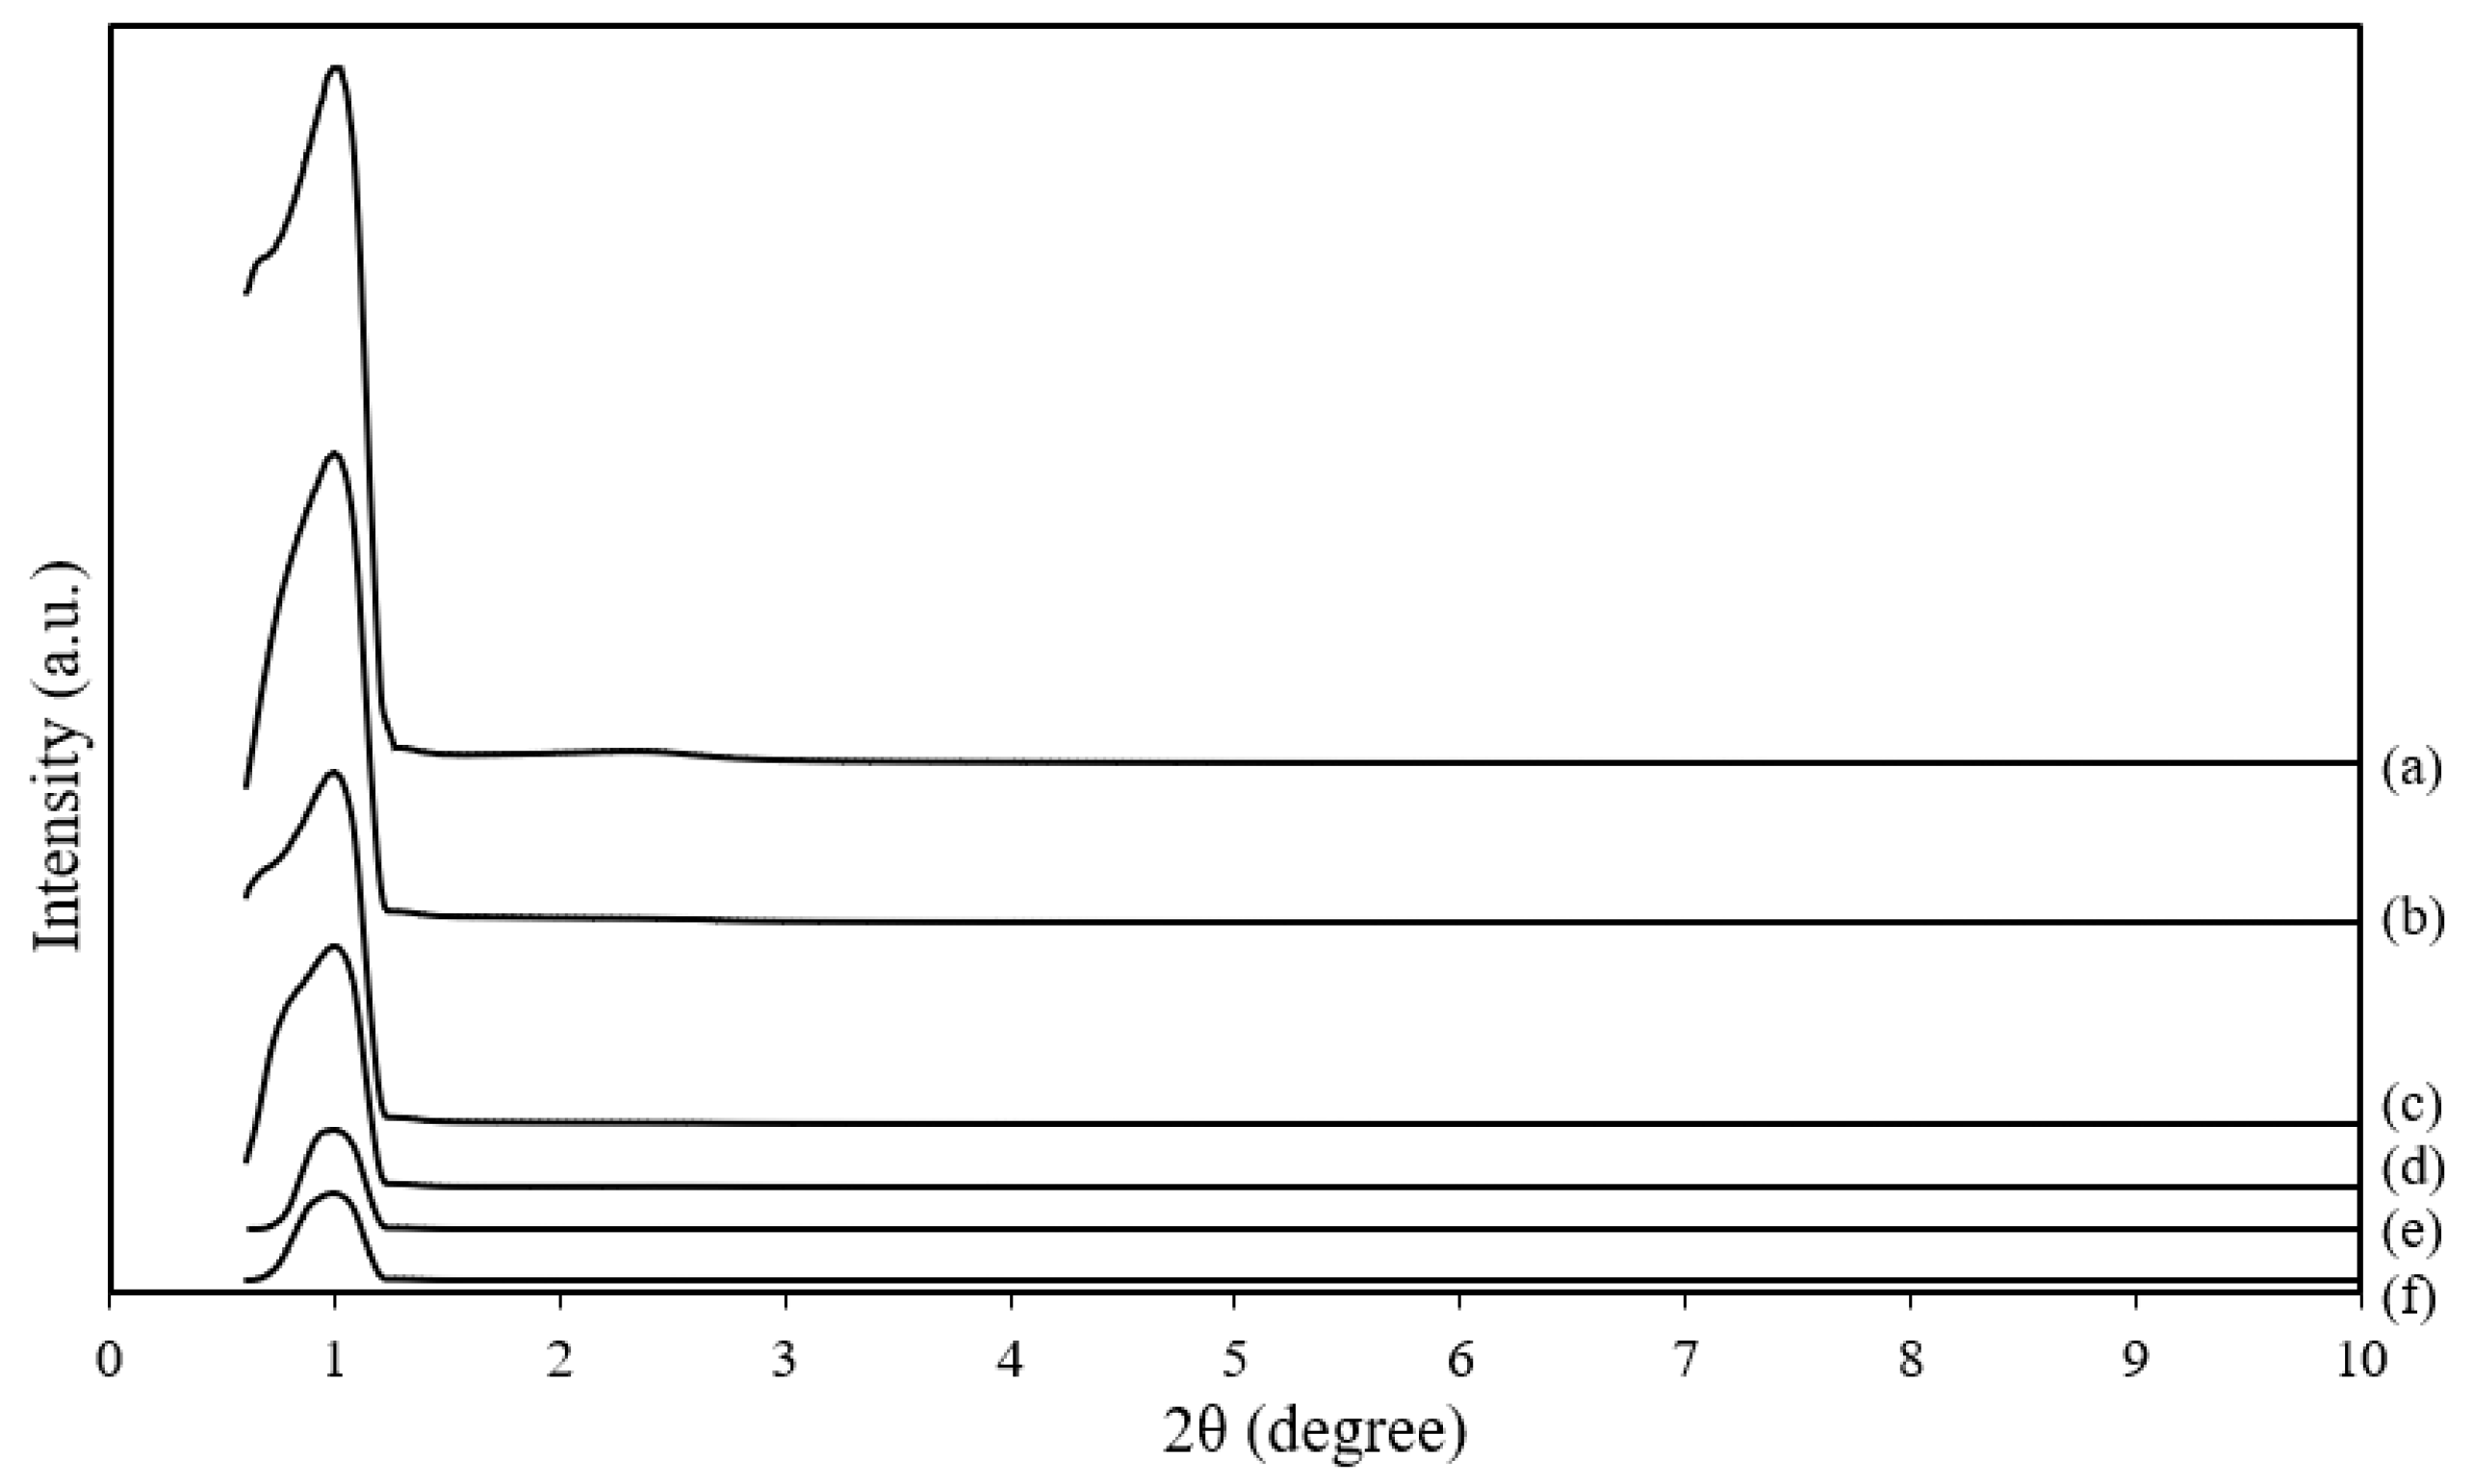
Figure 4.
FTIR spectra for (a) unfunctionalized MSU-2 and MSU-2 functionalized with TEPA loadings of (b) 20 wt%, (c) 30 wt%, (d) 40 wt%, (e) 50 wt%, and (f) 60 wt%.
Figure 4.
FTIR spectra for (a) unfunctionalized MSU-2 and MSU-2 functionalized with TEPA loadings of (b) 20 wt%, (c) 30 wt%, (d) 40 wt%, (e) 50 wt%, and (f) 60 wt%.

Figure 5.
TGA profiles of (a) unfunctionalized MSU-2; MSU-2 functionalized with TEPA loadings of (b) 20 wt%, (c) 30 wt%, (d) 40 wt%, (e) 50 wt%, (f) 60 wt%; and (g) pure TEPA.
Figure 5.
TGA profiles of (a) unfunctionalized MSU-2; MSU-2 functionalized with TEPA loadings of (b) 20 wt%, (c) 30 wt%, (d) 40 wt%, (e) 50 wt%, (f) 60 wt%; and (g) pure TEPA.
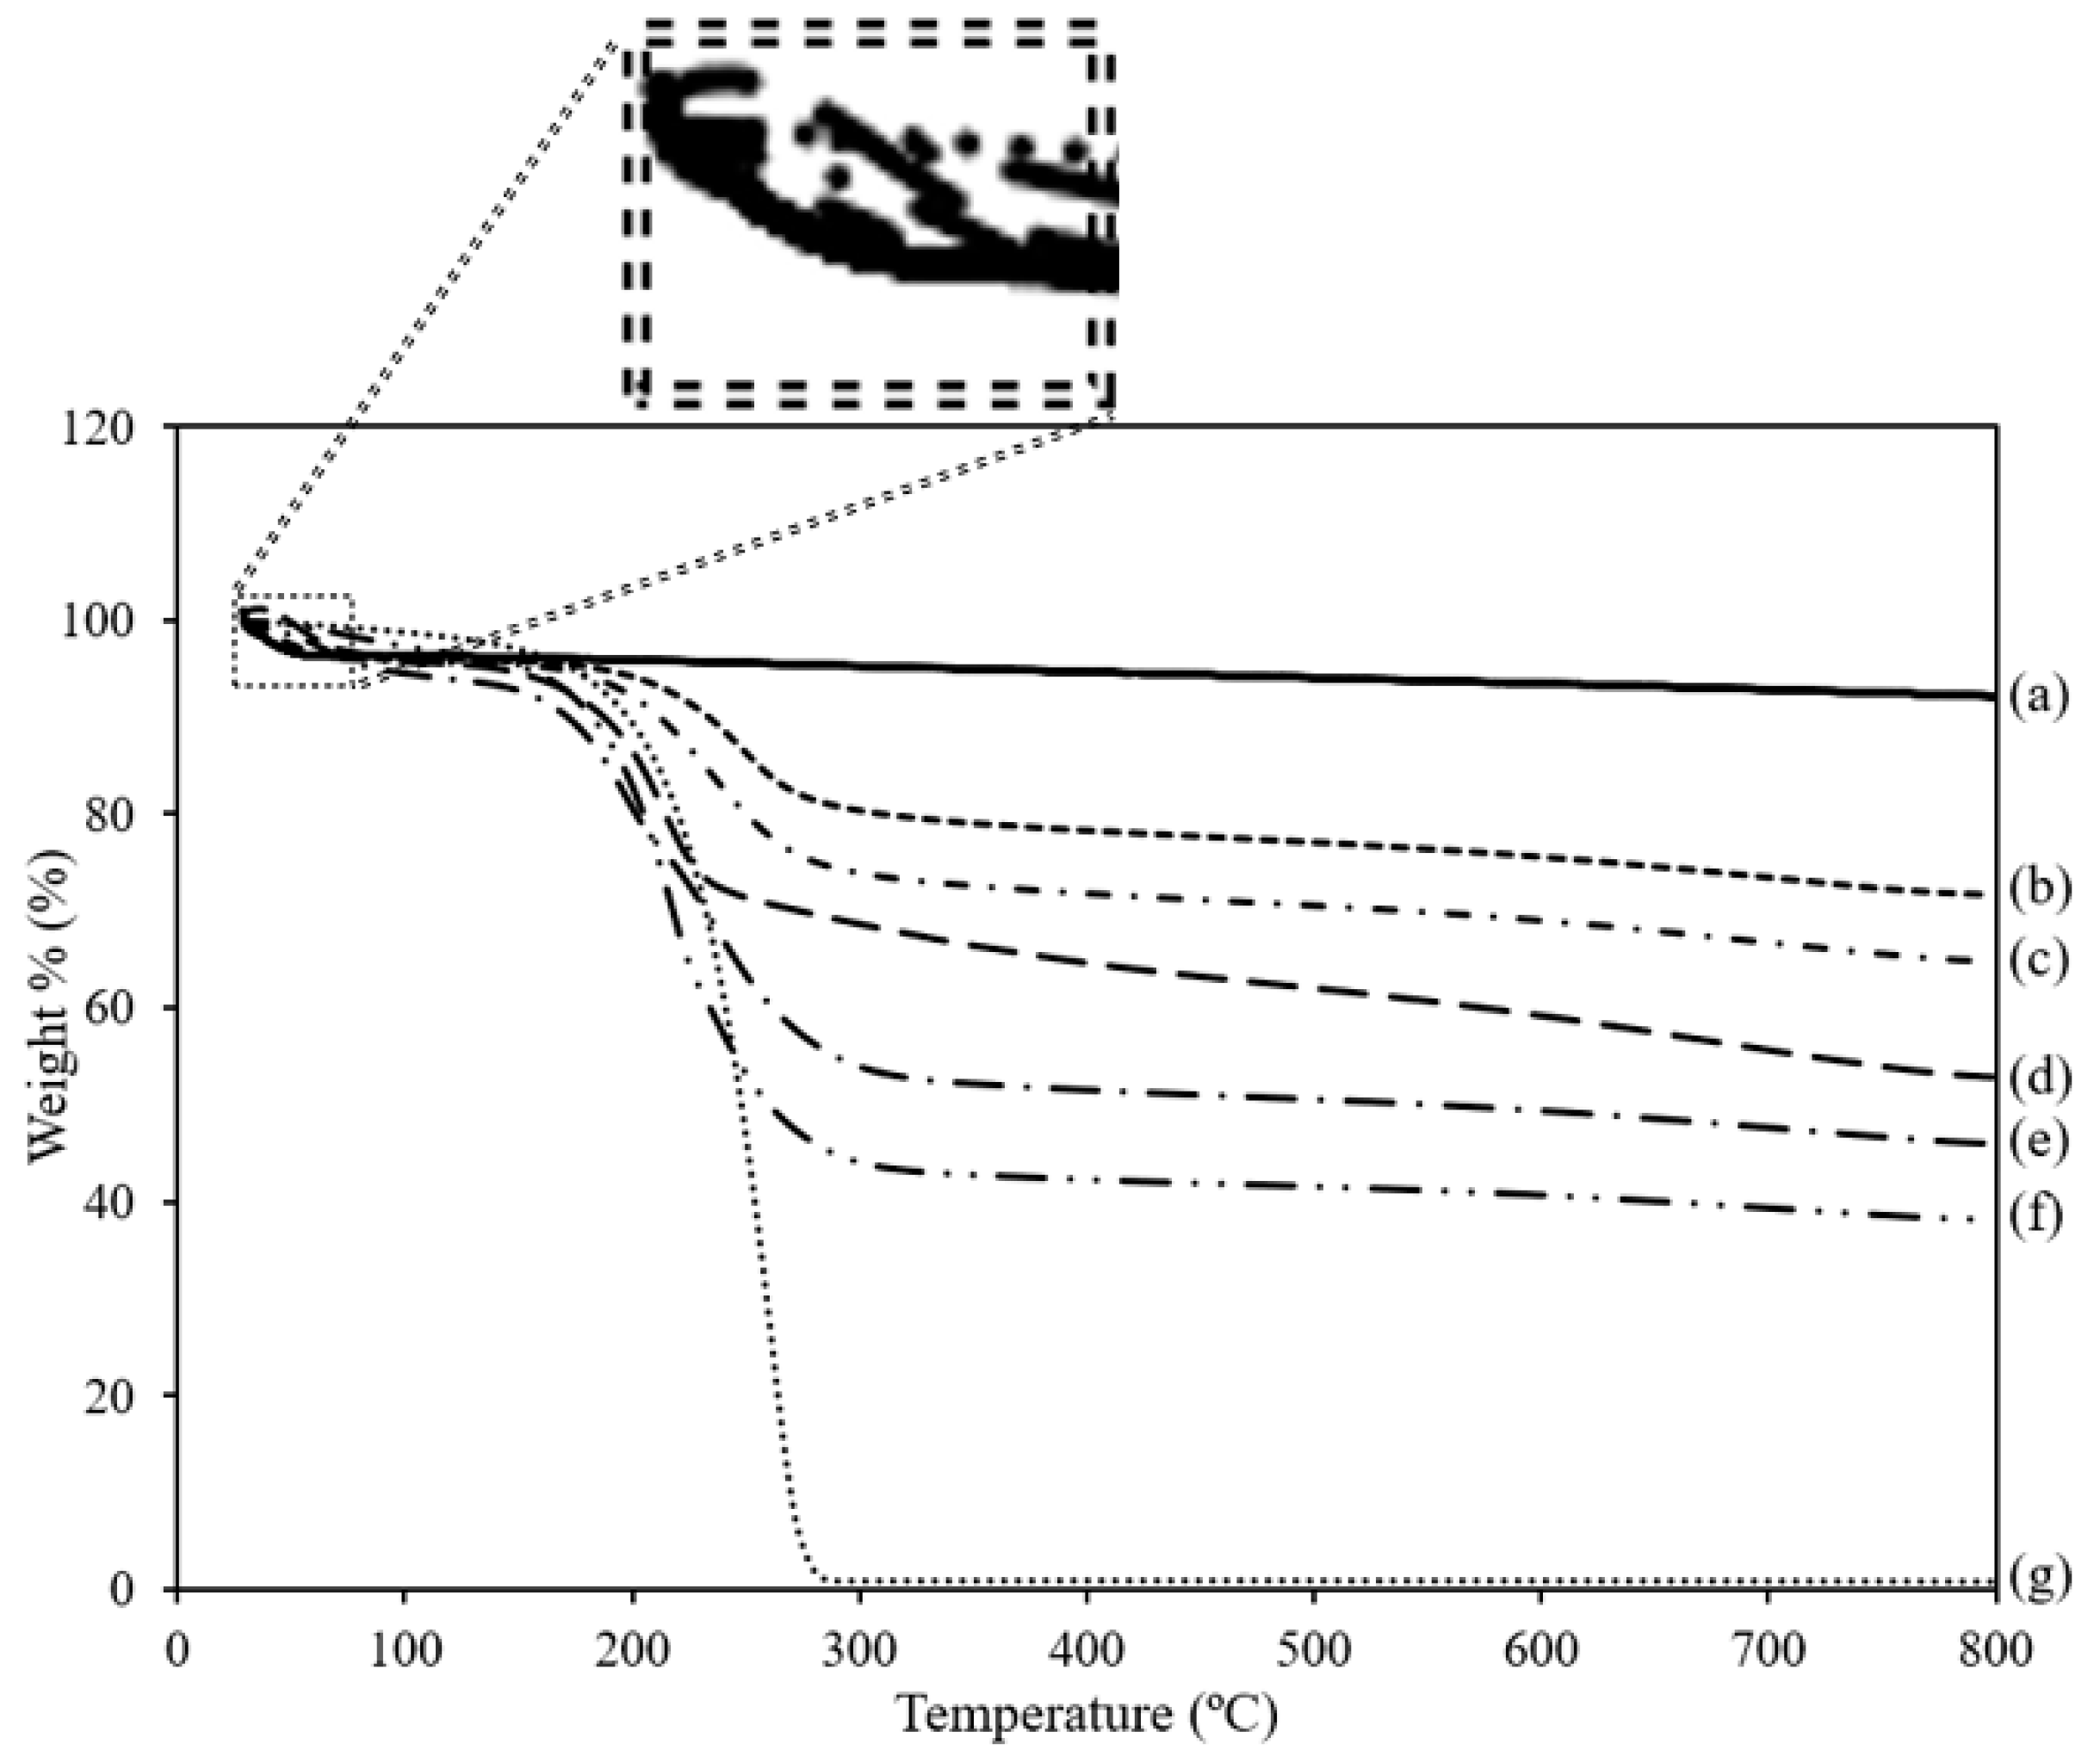
Figure 6.
DTG curves of unfunctionalized MSU-2; MSU-2 functionalized with TEPA loadings of 20 wt%, 30 wt%, 40 wt%, 50 wt%, 60 wt%; and pure TEPA.
Figure 6.
DTG curves of unfunctionalized MSU-2; MSU-2 functionalized with TEPA loadings of 20 wt%, 30 wt%, 40 wt%, 50 wt%, 60 wt%; and pure TEPA.
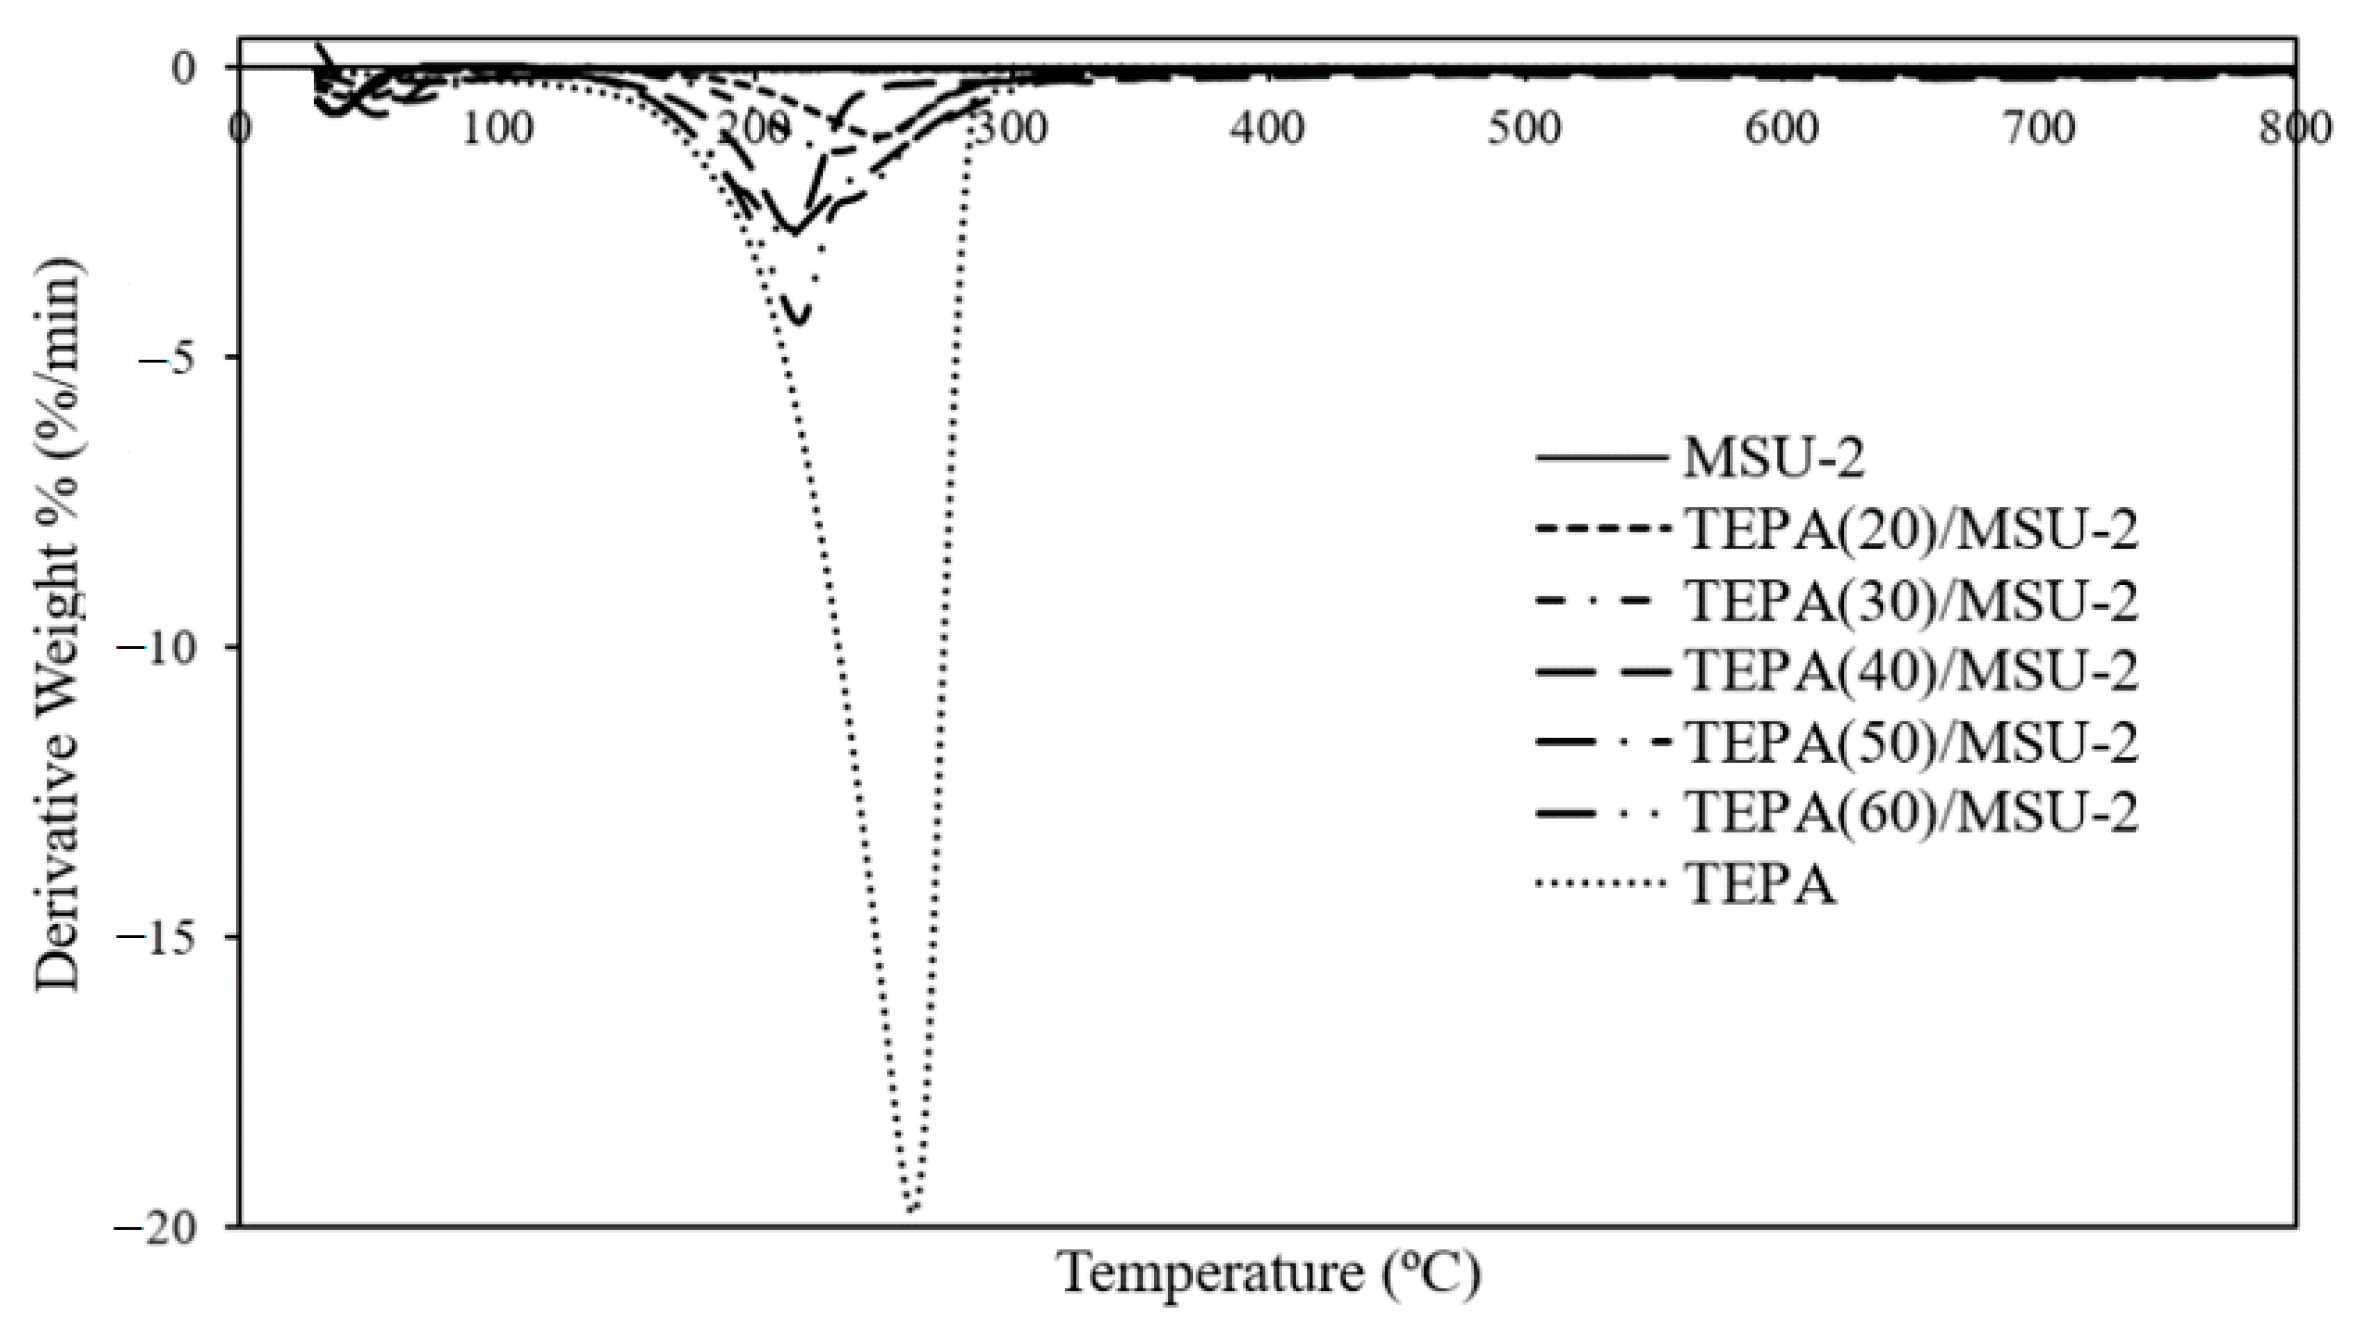
Figure 7.
Average CO2 adsorption capacity of unfunctionalized MSU-2 and MSU-2 functionalized with TEPA loadings of 20 wt%, 30 wt%, 40 wt%, 50 wt% and 60 wt% at 40 °C, at 1 bar of pressure and 50% CO2/50% CH4 gas mixture.
Figure 7.
Average CO2 adsorption capacity of unfunctionalized MSU-2 and MSU-2 functionalized with TEPA loadings of 20 wt%, 30 wt%, 40 wt%, 50 wt% and 60 wt% at 40 °C, at 1 bar of pressure and 50% CO2/50% CH4 gas mixture.


Table 1.
Pore characteristics and elemental analysis of unfunctionalized and TEPA-functionalized MSU-2.
Table 1.
Pore characteristics and elemental analysis of unfunctionalized and TEPA-functionalized MSU-2.
| Sample | BET Specific Surface Area, SBET (m2/g) | Total Pore Volume, Vp (cm3/g) | N Content (wt%) |
|---|---|---|---|
| MSU-2 | 1223.13 | 0.87 | 0.00 |
| TEPA(20)/MSU-2 | 397.20 | 0.34 | 7.62 |
| TEPA(30)/MSU-2 | 140.34 | 0.16 | 8.97 |
| TEPA(40)/MSU-2 | 27.08 | 0.03 | 11.91 |
| TEPA(50)/MSU-2 | 0.29 | ~0.00 | 15.80 |
| TEPA(60)/MSU-2 | 0.12 | ~0.00 | 19.46 |
Table 2.
Characteristic bonds shown in the FTIR spectra of unfunctionalized MSU-2 and TEPA-functionalized MSU-2 [8,11,26,44,47,48,49,50,51].
| Wavenumber (cm−1) | Title 3 |
|---|---|
| ∼3467 # | O-H stretching vibrations of the hydrogen bonded surface silanol groups and the remaining adsorbed water molecules |
| 2950 * | Asymmetric stretching vibration of the –CH2 groups of TEPA chains |
| 2843 * | Symmetric stretching vibration of the –CH2 groups of TEPA chains |
| 1647 # | Deformation vibrations of physically adsorbed water molecules |
| 1571 * | Bending vibration (δ(N–H)) of –NH– |
| 1477 * | Deformation vibration of –NH2 |
| 1310 * | Stretching vibration of C–N |
| 1077 # | Asymmetrical stretching (νas) of siloxane (-Si-O-Si-) band |
| 800 # | Si-O bond symmetrical stretching (νs) of the silanol groups |
| 461 # | Bending vibration (δ) of siloxane (-Si-O-Si-) band |
# Attributed to unfunctionalized MSU-2. * Attributed to TEPA molecules.
Table 3.
Weight losses in TGA profiles of unfunctionalized and TEPA-functionalized MSU-2.
| Adsorbents | Weight Loss of First-Step Degradation at 30–80 °C (%) | Weight Loss of Second-Step Degradation at 190–290 °C (%) |
|---|---|---|
| MSU-2 | 3.62 | - |
| TEPA(20)/MSU-2 | 3.98 | 16.53 |
| TEPA(30)/MSU-2 | 4.09 | 22.94 |
| TEPA(40)/MSU-2 | 4.25 | 26.24 |
| TEPA(50)/MSU-2 | 5.34 | 41.10 |
| TEPA(60)/MSU-2 | 3.15 | 52.95 |
| TEPA | - | 99.01 |
Publisher’s Note: MDPI stays neutral with regard to jurisdictional claims in published maps and institutional affiliations. |
© 2022 by the authors. Licensee MDPI, Basel, Switzerland. This article is an open access article distributed under the terms and conditions of the Creative Commons Attribution (CC BY) license (https://creativecommons.org/licenses/by/4.0/).
Share and Cite
MDPI and ACS Style
Lee, X.Y.; Viriya, V.; Chew, T.L.; Oh, P.C.; Ong, Y.T.; Ho, C.-D.; Jawad, Z.A. Synthesis, Characterization and Gas Adsorption of Unfunctionalized and TEPA-Functionalized MSU-2. Processes 2022, 10, 1943. https://doi.org/10.3390/pr10101943
AMA Style
Lee XY, Viriya V, Chew TL, Oh PC, Ong YT, Ho C-D, Jawad ZA. Synthesis, Characterization and Gas Adsorption of Unfunctionalized and TEPA-Functionalized MSU-2. Processes. 2022; 10(10):1943. https://doi.org/10.3390/pr10101943
Chicago/Turabian StyleLee, Xin Ying, Vinosha Viriya, Thiam Leng Chew, Pei Ching Oh, Yit Thai Ong, Chii-Dong Ho, and Zeinab Abbas Jawad. 2022. "Synthesis, Characterization and Gas Adsorption of Unfunctionalized and TEPA-Functionalized MSU-2" Processes 10, no. 10: 1943. https://doi.org/10.3390/pr10101943
Note that from the first issue of 2016, this journal uses article numbers instead of page numbers. See further details here.