

Bridging the Operational Efficiency Differences between Franchisors and Franchisees: A Metafrontier Approach


Abstract
:1. Introduction
2. Literature Review of Food Franchise Efficiency
3. Research Model and Data
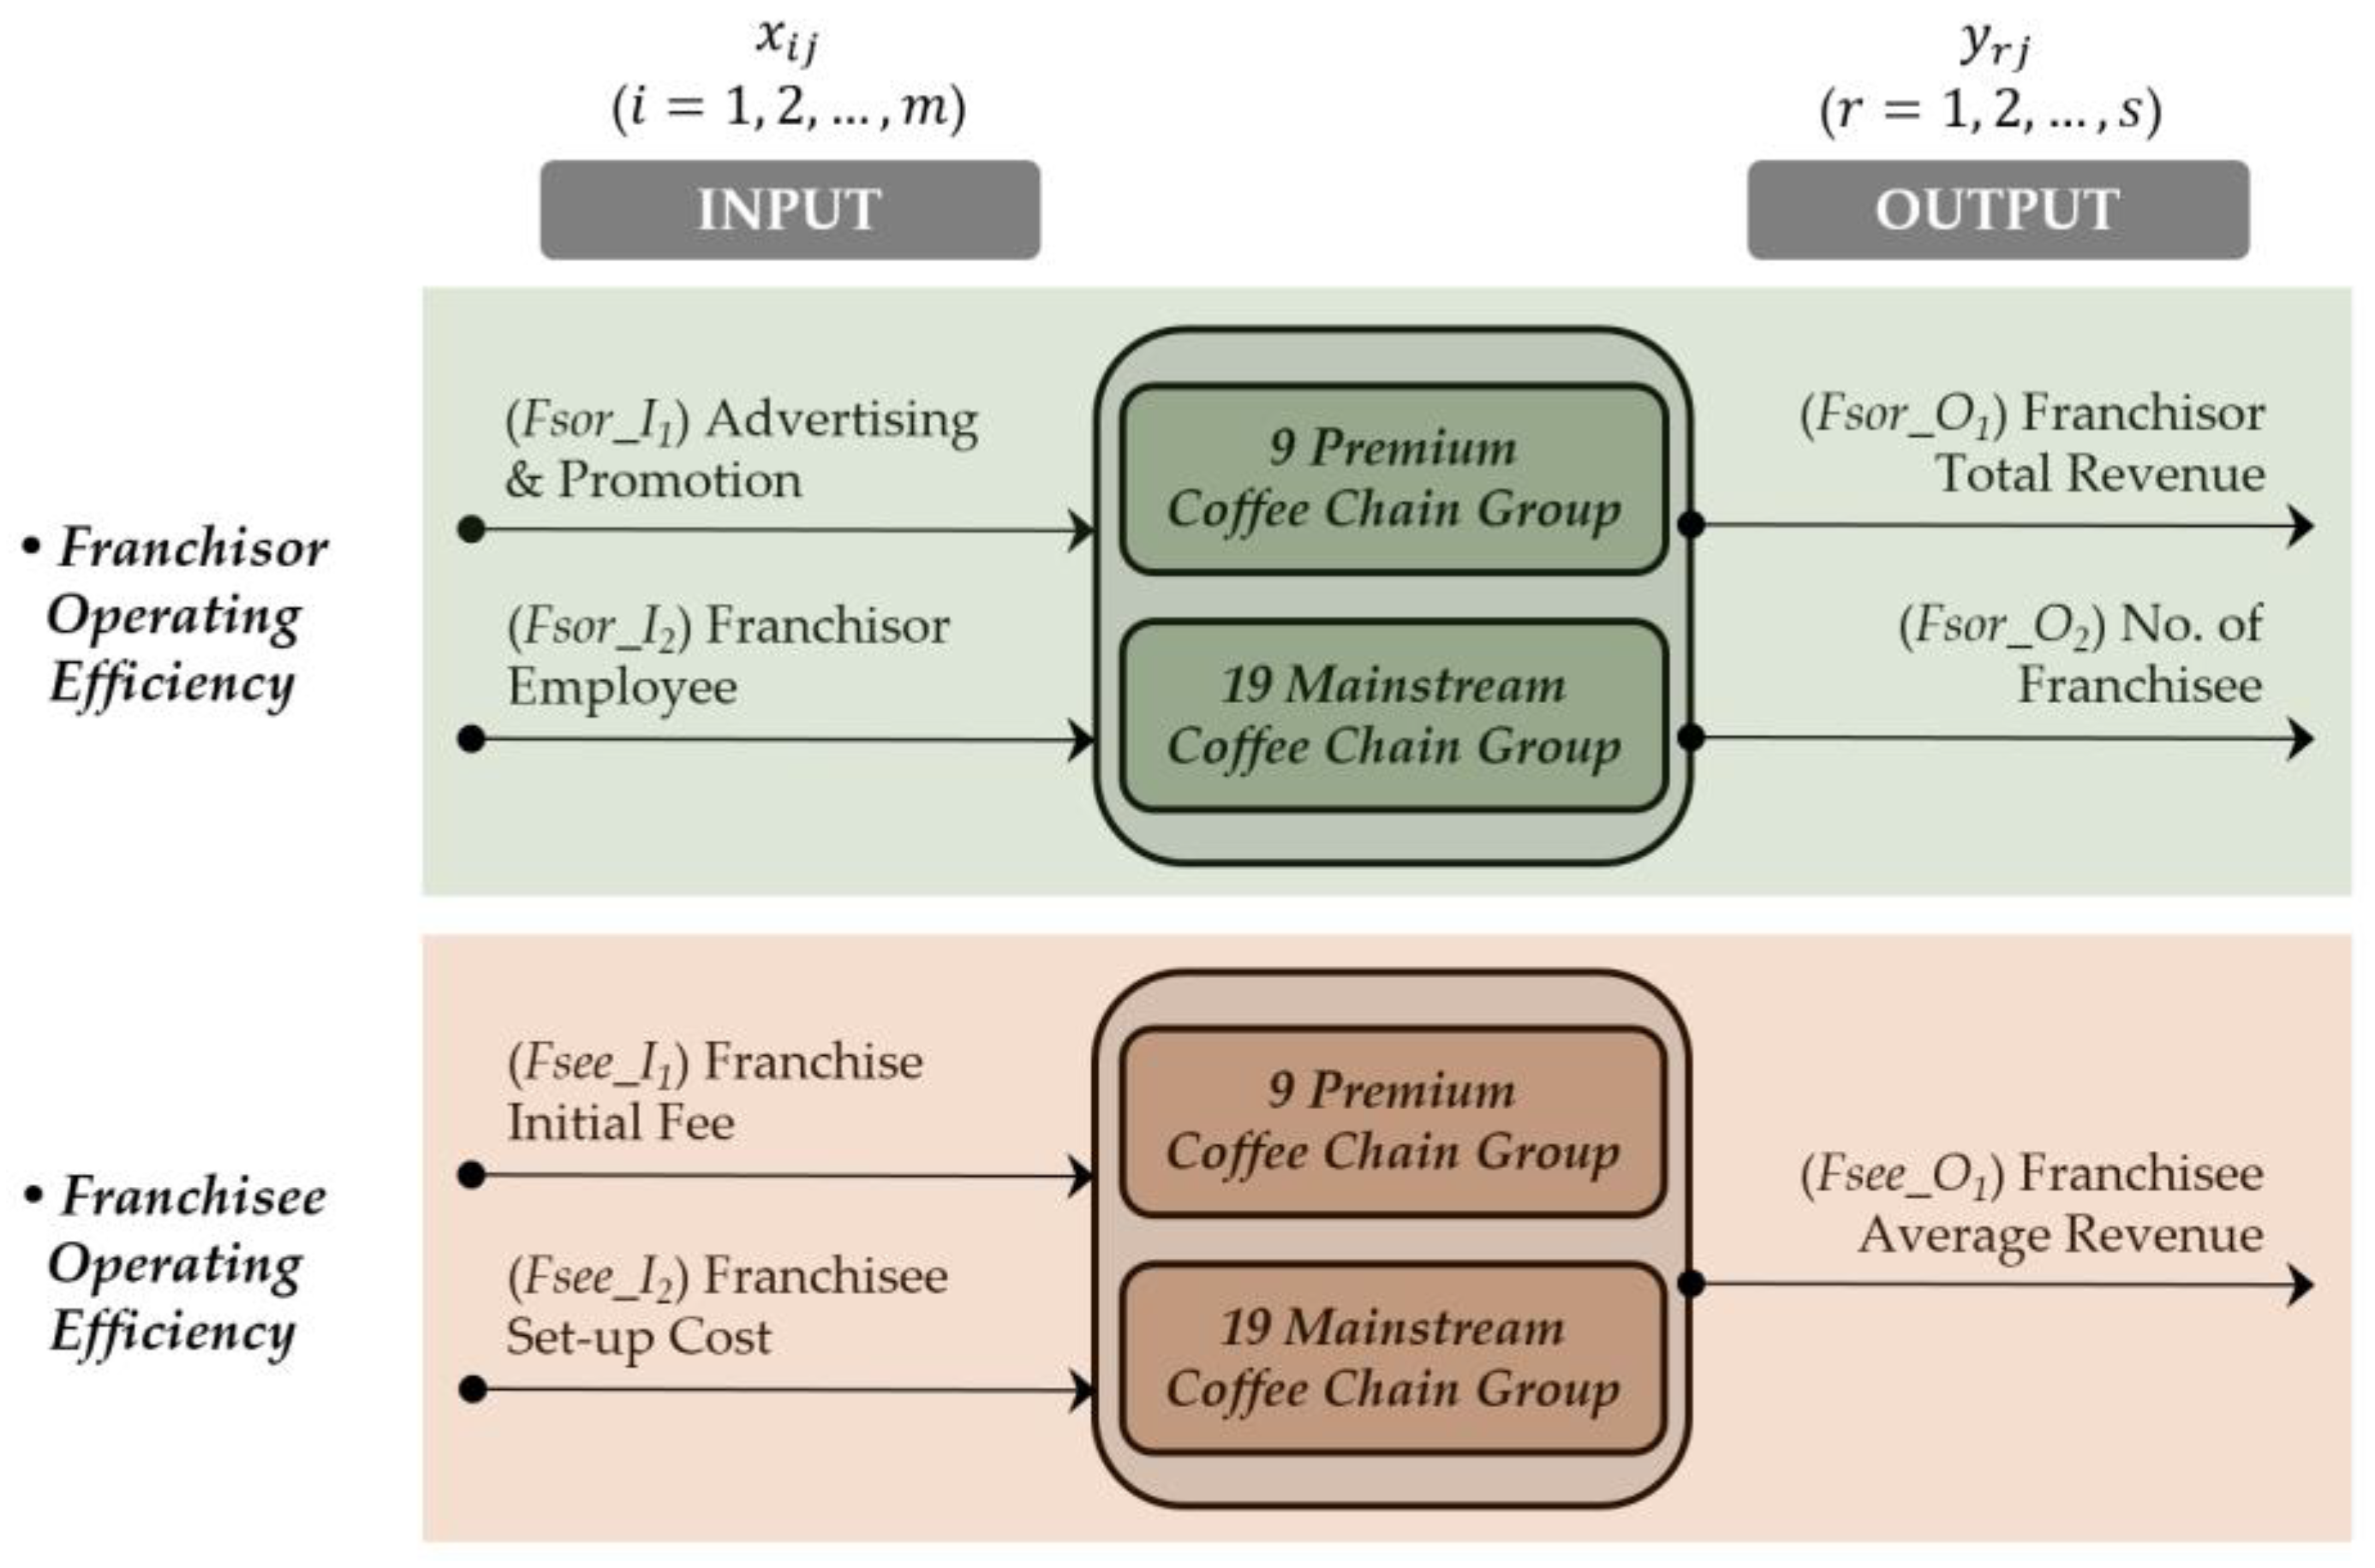
- Franchisor’s Advertising and Promotion Expenses (FsorAP): The costs for promoting a franchise brand and recruiting franchisees.
- Franchisor Employee (FsorE): Full-time employees of a parent franchising company, such as employees in any other type of business (e.g., franchise supervisors and franchise operating managers).
- Franchisor Total Sales (FsorTS): The annual total sales amount of a franchise establishment company, including: (a) franchisees’ sales-based ongoing royalties, (b) franchise initial fee revenue, and (c) distribution revenue allocated to goods and services that franchisees sell.
- Number of Franchisees (NFsee): The total number of franchised outlets under the control of a parent franchising company.
- Franchise Initial Fee (FseeIF): The license fees of entry and owning a franchise to be paid by a franchisee to a franchising company (e.g., franchise subscription fee, education fee, deposit, etc.).
- Franchisee Set-up Cost (FseeSC): This refers to the total cost of opening a franchise shop, specifically, the interior costs of a franchisee, such as the cost of supplies and equipment, furniture, and fixtures.
- Franchisee Average Sales (FseeAS): The average annual sales per franchisee over a given time.
4. Results
4.1. Metafrontier DEA Results of Coffee Franchisors
4.2. Metafrontier DEA Results of Coffee Franchisees
4.3. Bootstrap DEA Results of Coffee Franchisees
4.3.1. Comparison between Franchisors and Franchisees
4.3.2. Comparison between Premium and Mainstream Brand Groups
5. Discussion
5.1. Theoretical Implications
5.2. Practical Implications
6. Conclusions and Future Research
Author Contributions
Funding
Institutional Review Board Statement
Informed Consent Statement
Data Availability Statement
Acknowledgments
Conflicts of Interest
Appendix A. The categorization, DMU codes, and full names of the decision making units (DMUs)
| Group | DMU Code | Coffee Chain Name | Business Start Date |
| Premium Coffee Franchise group | A(01) | Dal.komm Coffee | 7 May 2012 |
| A(02) | DROPTOP | 18 Aug 2011 | |
| A(03) | EDIYA COFFEE | 17 Aug 2001 | |
| A(04) | Caffé TIAMO | 1 Apr 2005 | |
| A(05) | CAFÉ-BENE | 28 Jun 2008 | |
| A(06) | Coffeenie | 5 Nov 2009 | |
| A(07) | TOMNTOMS | 18 Dec 2004 | |
| A(08) | TWOSOME PLACE | 30 Sep 2008 | |
| A(09) | HOLLYS COFFEE | 1 Jun 1999 | |
| Mainstream Coffee Franchise group | B(01) | THE LITTER | 1 Aug 2015 |
| B(02) | the Venti | 21 Mar 2014 | |
| B(03) | DUTCH&BEAN | 4 Nov 2014 | |
| B(04) | 10000LAB COFFEE | 14 Oct 2015 | |
| B(05) | MEGA MGC COFFEE | 9 Mar 2016 | |
| B(06) | BULK COFFEE | 15 Jan 2018 | |
| B(07) | Café BOMBOM | 16 Jan 2015 | |
| B(08) | PAIK’S COFFEE | 7 Sep 2009 | |
| B(09) | Selecto Coffee | 20 Nov 2012 | |
| B(10) | Amasvin | 12 Aug 2008 | |
| B(11) | XOXO HOTDOG & COFFEE | 22 Apr 2016 | |
| B(12) | YOGER-PRESSO | 20 Nov 2007 | |
| B(13) | Cheongja Dabang | 14 Sep 2015 | |
| B(14) | Coffee-mama | 8 Sep 2010 | |
| B(15) | COFFEE-BAY | 30 Jun 2011 | |
| B(16) | Coffee-banhada | 30 Mar 2011 | |
| B(17) | COFFEE ONLY | 10 Sep 2016 | |
| B(18) | Compose Coffee | 11 Aug 2014 | |
| B(19) | ToPresso | 1 Oct 2005 |
Appendix B. Mathematical framework for Metafrontier Efficiency
References
- Park, D.-Y.; Choi, K.; Kang, D.-H. Measuring the Meta Efficiency and Its Determinants on Efficiency in the Korean Coffee Shop Franchise. Sustainability 2020, 12, 2398. [Google Scholar] [CrossRef] [Green Version]
- Kim, J.; Whang, S. The Effects of Service Quality of Low-price Coffee Brand on Positive Emotional Response, Attitude and Behavioral Intention. Culin. Sci. Hosp. Res. 2018, 24, 59–69. [Google Scholar]
- Roh, E.Y.; Choi, K. Efficiency comparison of multiple brands within the same franchise: Data envelopment analysis approach. Int. J. Hosp. Manag. 2010, 29, 92–98. [Google Scholar] [CrossRef]
- Piot-Lepetit, I.; Perrigot, R.; Cliquet, G. Impact of the Industry on Franchise Chain Efficiency: A Meta-DEA and Context-Dependent DEA Approach. J. Oper. Res. Soc. 2014, 65, 1692–1699. [Google Scholar] [CrossRef]
- Maruyama, M.; Yamashita, Y. Franchise Fees and Royalties: Theory and Empirical Results. Rev. Ind. Organ. 2012, 40, 167–189. [Google Scholar] [CrossRef]
- Lanchimba, C.; Windsperger, J.; Fadairo, M. Entrepreneurial orientation, risk and incentives: The case of franchising. Small Bus. Econ. 2018, 50, 163–180. [Google Scholar] [CrossRef]
- Garg, V.K.; Rasheed, A.A.; Priem, R.L. Explaining franchisors’ choices of organization forms within franchise systems. Strateg. Organ. 2005, 3, 185–217. [Google Scholar] [CrossRef]
- Vázquez, L. Up-front Franchise Fees and Ongoing Variable Payments as Substitutes: An Agency Perspective. Rev. Ind. Organ. 2005, 26, 445–460. [Google Scholar] [CrossRef]
- Zhang, X.-M.; Li, Q.-W.; Liu, Z.; Chang, C.-T. Optimal pricing and remanufacturing mode in a closed-loop supply chain of WEEE under government fund policy. Comput. Ind. Eng. 2021, 151, 106951. [Google Scholar] [CrossRef]
- Medal-Bartual, A.; Garcia-Martin, C.-J.; Sala-Garrido, R. Efficiency analysis of small franchise enterprises through a DEA metafrontier model. Serv. Ind. J. 2012, 32, 2421–2434. [Google Scholar] [CrossRef]
- Kim, C.; Lee, S.; Kim, S.W. Surviving in the Red Ocean: Measuring Factors for Business Excellence among Coffee Franchises in Korea. Total Qual. Manag. Bus. Excell. 2016, 27, 761–774. [Google Scholar] [CrossRef]
- Joo, S.-J.; Stoeberl, P.A.; Fitzer, K. Measuring and benchmarking the performance of coffee stores for retail operations. Benchmarking 2009, 16, 741–753. [Google Scholar] [CrossRef]
- Joo, S.-J.; Min, H.; Kwon, I.-W.; Kwon, H. Comparative efficiencies of specialty coffee retailers from the perspectives of socially responsible global sourcing. Int. J. Logist. Manag. 2010, 21, 490–509. [Google Scholar] [CrossRef]
- Wang, Z.; Chiu, Y.-H.; Hsieh, J.-C.; Li, Y.; Chem, Y.-C.; Jang, Y.-C. Estimating the cross-strait performance of a local coffee chain through network meta-frontier DEA. Singap. Econ. Rev. 2020, 65, 1439–1455. [Google Scholar] [CrossRef]
- Martin, C.J.G.; Medal-Bartual, A.; Peris-Ortiz, M. Analysis of Efficiency and Profitability of Franchise Services. Serv. Ind. J. 2014, 34, 796–810. [Google Scholar] [CrossRef]
- Dyson, R.G.; Allen, R.; Camanho, A.S.; Podinovski, V.V.; Sarrico, C.S.; Shale, E.A. Pitfalls and protocols in DEA. Eur. J. Oper. Res. 2011, 132, 245–259. [Google Scholar] [CrossRef]
- Reynolds, D. An Exploratory Investigation of Multiunit Restaurant Productivity Assessment Using Data Envelopment Analysis. J. Travel Tour. Mark. 2004, 16, 19–26. [Google Scholar] [CrossRef]
- Sveum, M.; Sykuta, M. The Effect of Franchising on Establishment Performance in the U.S. Restaurant Industry. Cornell Hosp. Q. 2019, 60, 104–115. [Google Scholar] [CrossRef]
- Alberca, P.; Parte, L. Operational efficiency evaluation of restaurant firms. Int. J. Contemp. Hosp. Manag. 2018, 30, 1959–1977. [Google Scholar] [CrossRef]
- Tsai, W.H.; Lee, H.L.; Yang, C.H.; Huang, C.C. Input-Output Analysis for Sustainability by Using DEA Method: A Comparison Study between European and Asian Countries. Sustainability 2016, 8, 1230. [Google Scholar] [CrossRef] [Green Version]
- Golany, B.; Roll, Y. An application procedure for DEA. Omega 1989, 17, 237–250. [Google Scholar] [CrossRef]
- O’Donnell, C.J.; Rao, D.P.; Battese, G.E. Metafrontier Frameworks for the Study of Firm-level Efficiencies and Technology Ratios. Empir. Econ. 2008, 34, 231–255. [Google Scholar] [CrossRef]
- Battese, G.E.; Rao, D.S.P. Technology Gap, Efficiency and a Stochastic Metafrontier Function. Int. J. Bus. Econ. 2002, 1, 87–93. [Google Scholar]
- Battesse, G.E.; Rao, D.S.P.; O’Donnell, C.J. A Metafrontier Production Function for Estimation of Technical Efficiencies and Technology Gaps for Firms Operating Under Different Technologies. J. Prod. Anal. 2004, 21, 91–103. [Google Scholar] [CrossRef]
- Perrigot, R.; Cliquet, G.; Piot-Lepetit, I. Plural form chain and efficiency: Insights from the French hotel chains and the DEA methodology. Eur. Manag. J. 2009, 27, 268–280. [Google Scholar] [CrossRef]
- Efron, B. Bootstrap Methods: Another Look at the Jackknife. Ann. Statist. 1979, 7, 569–593. [Google Scholar] [CrossRef]
- Simar, L.; Wilson, P.W. A general methodology for bootstrapping in nonparametric frontier models. J. Appl. Stat. 2000, 27, 779–802. [Google Scholar] [CrossRef]
- Simar, L.; Wilson, P.W. Inference by the m out of n bootstrap in nonparametric frontier models. J. Prod. Anal. 2011, 36, 33–53. [Google Scholar] [CrossRef]
- Perrigot, R.; Watson, A.; Dada, O.B. Sustainability and green practices: The role of stakeholder power in fast-food franchise chains. Int. J. Contemp. Hosp. Manag. 2021, 33, 3442–3464. [Google Scholar] [CrossRef]
- Zhang, X.-M.; Chen, H.; Liu, Z. Operation strategy in an E-commerce platform supply chain: Whether and how to introduce live streaming services? Int. Trans. Oper. Res. 2022. [Google Scholar] [CrossRef]
- Duman, G.M.; Tozanli, O.; Kongar, E.; Gupta, S.M. A holistic approach for performance evaluation using quantitative and qualitative data: A food industry case study. Expert. Syst. Appl. 2017, 81, 410–422. [Google Scholar] [CrossRef]
- Uli, L.D.; Martín, F.V.; Cataluña, F.J.R. Analysis of efficiency of own and franchised units in the Spanish franchise system. Eur. Res. Manag. Bus. Econ. 2017, 23, 165–172. [Google Scholar]

 : Premium Group, ✕: Mainstream Group; (A) CRS-based assumption; (B) VRS-based assumption.
: Premium Group, ✕: Mainstream Group; (A) CRS-based assumption; (B) VRS-based assumption.
: Premium Group, ✕: Mainstream Group; (A) CRS-based assumption; (B) VRS-based assumption.

| Authors | Method | DMUs | Input Variables | Output Variables | |
|---|---|---|---|---|---|
| Coffee Industry | Park et al. [1] | Metafrontier DEA | 29 Korean Coffee Shop Franchisors | Employee, Franchisee’s Average Sales, Number of Franchisee | Financial Stabilization, Total Sales, Total Asset |
| Kim et al. [11] | Input-oriented CCR | 6 Coffee Franchises in Korea from 2010 to 2014 | Product cost, Labor cost, Costs for interior design | Sales Profit | |
| Joo et al. [12] | Input-oriented CCR/BCC | 8 Premier Coffee Retail Stores | Cost of Sales, Occupancy expenses, Wages/Benefits, Other Expenses, | Total Sales | |
| Joo et al. [13] | Input-oriented CCR | 7 Specialty Coffee Retailers | Costs of Goods Sold, Sales, General, and Administrative Expenses, Depreciation/Amortization | Revenue | |
| Wang et al. [14] | Network metafrontier DEA | 54 B Coffee Company of Taiwan and China from 2010 to 2012 | Personnel Pay, Raw Material Costs, Selling Expenses | Operating Income, Sales Revenue, Advance Receipts, Administrative Expenses | |
| Food Restaurant Industry | Reynolds [17] | CCR/ BCC | 38 chains of same-brand franchises in United States | Hours worked, Average wage, Number of competitors, Seating capacity | Daily sales, Tip percentage |
| Roh and Choi [3] | Input-oriented CCR/ BCC | 550 chain restaurants operating within the Pacific Rim | Environmental/Location, Physical resources, Human resources, Management efficiency | Sales, Net income | |
| Sveum and Sykuta [18] | Two-stage DEA | 8900 restaurants in United States | Payroll, Age of the establishment, Number of seats | Total Sales, Counter Sales, Drive-thru Sales, Takeout Sales, Server Sales | |
| Alberca and Parte [19] | Metafrontier DEA | 863 restaurants in Spain | Total assets, Staff Costs, Cost of Sales | Total Sales |
| Category | Operational Efficiency for Franchisor | Operational Efficiency for Franchisee | ||||||
|---|---|---|---|---|---|---|---|---|
| FsorAP (1000 won) | FsorE (Person) | FsorTS (1000 won) | NFsee | FseeIF (1000 won) | FseeSC (1000 won) | FseeAS (1000 won) | ||
| Max | Premium | 13,342,110 | 2303 | 364,058,442 | 2885 | 39,150 | 260,050 | 508,907 |
| Mainstream | 1,855,012 | 281 | 134,708,794 | 1188 | 21,000 | 156,051 | 298,566 | |
| Min | Premium | 13,142 | 14 | 3,945,604 | 99 | 5300 | 51,590 | 90,685 |
| Mainstream | 6743 | 11 | 1,047,124 | 105 | 0 | 42,400 | 34,789 | |
| Ave | Premium | 3,018,980 | 456 | 93,293,856 | 668 | 18,561 | 142,369 | 220,237 |
| Mainstream | 376,379 | 49 | 21,502,480 | 375 | 10,961 | 66,203 | 147,957 | |
| SD | Premium | 4,584,804 | 732 | 126,456,525 | 916 | 9323 | 72,501 | 126,016 |
| Mainstream | 515,076 | 62 | 31,121,487 | 300 | 5144 | 25,326 | 71,986 | |
| Group | DMU Code | CRS | VRS | SE | RTS | Main Cause of Inefficiency | |||||
|---|---|---|---|---|---|---|---|---|---|---|---|
| ME (TE) | GF | TGR | ME (PTE) | GF | TGR | PTE | SE | ||||
| 1 | Fsor_A(01) | 0.0932 | 0.2130 | 0.4377 | 0.1602 | 0.4200 | 0.3814 | 0.5821 | DRS | ◯ | |
| Fsor_A(02) | 0.2168 | 0.5288 | 0.4099 | 0.3133 | 0.5638 | 0.5556 | 0.6919 | DRS | ◯ | ||
| Fsor_A(03) | 0.4564 | 1 | 0.4564 | 1 | 1 | 1 | 0.4564 | DRS | ◯ | ||
| Fsor_A(04) | 0.5730 | 1 | 0.5730 | 1 | 1 | 1 | 0.5730 | IRS | ◯ | ||
| Fsor_A(05) | 0.2176 | 0.5174 | 0.4205 | 0.3527 | 0.6622 | 0.5327 | 0.6169 | DRS | ◯ | ||
| Fsor_A(06) | 0.6448 | 1 | 0.6448 | 0.8319 | 1 | 0.8319 | 0.7751 | IRS | ◯ | ||
| Fsor_A(07) | 0.4903 | 0.8849 | 0.5541 | 1 | 1 | 1 | 0.4903 | DRS | ◯ | ||
| Fsor_A(08) | 0.1685 | 0.4092 | 0.4117 | 1 | 1 | 1 | 0.1685 | DRS | ◯ | ||
| Fsor_A(09) | 0.2004 | 0.4846 | 0.4136 | 0.7321 | 0.8628 | 0.8485 | 0.2737 | DRS | ◯ | ||
| Ave. | 0.3401 | 0.6709 | 0.4802 | 0.7100 | 0.8343 | 0.7945 | 0.5142 | DRS: 77.8%, IRS: 22.2% | |||
| 2 | Fsor_B(01) | 1 | 1 | 1 | 1 | 1 | 1 | 1 | CRS | ||
| Fsor_B(02) | 0.4658 | 0.4658 | 1 | 0.7006 | 0.7026 | 0.9972 | 0.6649 | DRS | ◯ | ||
| Fsor_B(03) | 0.3283 | 0.3283 | 1 | 0.3494 | 0.3494 | 1 | 0.9397 | IRS | ◯ | ||
| Fsor_B(04) | 0.3319 | 0.3319 | 1 | 0.3353 | 0.3353 | 1 | 0.9897 | DRS | ◯ | ||
| Fsor_B(05) | 0.7803 | 0.7803 | 1 | 1 | 1 | 1 | 0.7803 | DRS | ◯ | ||
| Fsor_B(06) | 1 | 1 | 1 | 1 | 1 | 1 | 1 | CRS | |||
| Fsor_B(07) | 1 | 1 | 1 | 1 | 1 | 1 | 1 | CRS | |||
| Fsor_B(08) | 0.5137 | 0.5137 | 1 | 1 | 1 | 1 | 0.5137 | DRS | ◯ | ||
| Fsor_B(09) | 0.3999 | 0.3999 | 1 | 0.4429 | 0.4429 | 1 | 0.9029 | DRS | ◯ | ||
| Fsor_B(10) | 1 | 1 | 1 | 1 | 1 | 1 | 1 | CRS | |||
| Fsor_B(11) | 0.6135 | 0.6135 | 1 | 0.6356 | 0.6362 | 0.9991 | 0.9651 | IRS | ◯ | ||
| Fsor_B(12) | 0.5928 | 0.5928 | 1 | 0.7138 | 0.7138 | 1 | 0.8304 | DRS | ◯ | ||
| Fsor_B(13) | 0.8584 | 0.8584 | 1 | 1 | 1 | 1 | 0.8584 | IRS | ◯ | ||
| Fsor_B(14) | 0.4324 | 0.4324 | 1 | 0.4702 | 0.4702 | 1 | 0.9197 | DRS | ◯ | ||
| Fsor_B(15) | 0.2301 | 0.2301 | 1 | 0.5767 | 0.5767 | 1 | 0.3991 | DRS | ◯ | ||
| Fsor_B(16) | 0.5963 | 0.5963 | 1 | 0.7972 | 0.7972 | 1 | 0.7480 | DRS | ◯ | ||
| Fsor_B(17) | 0.5614 | 0.5614 | 1 | 0.6314 | 0.6314 | 1 | 0.8891 | IRS | ◯ | ||
| Fsor_B(18) | 1 | 1 | 1 | 1 | 1 | 1 | 1 | CRS | |||
| Fsor_B(19) | 0.4995 | 0.4995 | 1 | 0.5364 | 0.5364 | 1 | 0.9312 | DRS | ◯ | ||
| Ave. | 0.6423 | 0.6423 | 1 | 0.7468 | 0.7470 | 0.9998 | 0.8586 | DRS: 71.4%, IRS: 28.6% | |||
| Group | DMU Code | CRS | VRS | SE | RTS | Main Cause of Inefficiency | |||||
|---|---|---|---|---|---|---|---|---|---|---|---|
| ME (TE) | GF | TGR | ME (PTE) | GF | TGR | PTE | SE | ||||
| 1 | Fsee_A(01) | 0.1104 | 0.1445 | 0.7642 | 0.3043 | 0.3043 | 1 | 0.3628 | DRS | ◯ | |
| Fsee_A(02) | 0.7280 | 1 | 0.7280 | 0.7787 | 1 | 0.7787 | 0.9350 | IRS | ◯ | ||
| Fsee_A(03) | 0.3020 | 0.3907 | 0.7728 | 0.4539 | 0.4539 | 1 | 0.6652 | DRS | ◯ | ||
| Fsee_A(04) | 0.1963 | 0.2625 | 0.7477 | 0.2584 | 0.2964 | 0.8718 | 0.7597 | DRS | ◯ | ||
| Fsee_A(05) | 0.1508 | 0.2216 | 0.6805 | 0.3060 | 0.3060 | 1 | 0.4928 | DRS | ◯ | ||
| Fsee_A(06) | 0.1626 | 0.2181 | 0.7454 | 0.2713 | 0.2713 | 1 | 0.5991 | DRS | ◯ | ||
| Fsee_A(07) | 0.3603 | 0.5032 | 0.7160 | 0.6287 | 0.6680 | 0.9412 | 0.5731 | DRS | ◯ | ||
| Fsee_A(08) | 0.6165 | 0.8224 | 0.7497 | 1 | 1 | 1 | 0.6165 | DRS | ◯ | ||
| Fsee_A(09) | 1 | 1 | 1 | 1 | 1 | 1 | 1 | CRS | |||
| Ave. | 0.4030 | 0.5070 | 0.7672 | 0.5557 | 0.5889 | 0.9546 | 0.6671 | DRS: 87.5%, IRS: 12.5% | |||
| 2 | Fsee_B(01) | 1 | 1 | 1 | 1 | 1 | 1 | 1 | CRS | ||
| Fsee_B(02) | 0.3636 | 0.3636 | 1.0000 | 0.4944 | 0.6262 | 0.7894 | 0.7354 | DRS | ◯ | ||
| Fsee_B(03) | 0.3712 | 0.3777 | 0.9830 | 0.4082 | 0.4332 | 0.9421 | 0.9096 | DRS | ◯ | ||
| Fsee_B(04) | 0.5381 | 0.5501 | 0.9782 | 0.5648 | 0.5755 | 0.9814 | 0.9527 | IRS | ◯ | ||
| Fsee_B(05) | 0.7399 | 0.7441 | 0.9943 | 0.8668 | 0.9580 | 0.9049 | 0.8535 | DRS | ◯ | ||
| Fsee_B(06) | 0.4621 | 0.4621 | 1.0000 | 0.5177 | 0.5245 | 0.9871 | 0.8925 | DRS | ◯ | ||
| Fsee_B(07) | 0.5107 | 0.5253 | 0.9723 | 0.5478 | 0.5711 | 0.9592 | 0.9324 | DRS | ◯ | ||
| Fsee_B(08) | 1 | 1 | 1 | 1 | 1 | 1 | 1 | CRS | |||
| Fsee_B(09) | 0.3236 | 0.3236 | 1.0000 | 0.3416 | 0.3437 | 0.9941 | 0.9473 | DRS | ◯ | ||
| Fsee_B(10) | 0.8067 | 0.8296 | 0.9723 | 1 | 1 | 1 | 0.8067 | IRS | ◯ | ||
| Fsee_B(11) | 0.1749 | 0.1749 | 1 | 0.2032 | 0.2032 | 1 | 0.8605 | DRS | ◯ | ||
| Fsee_B(12) | 0.2859 | 0.2900 | 0.9858 | 0.2930 | 0.2979 | 0.9837 | 0.9757 | DRS | ◯ | ||
| Fsee_B(13) | 0.4099 | 0.4101 | 0.9994 | 0.4126 | 0.4142 | 0.9962 | 0.9933 | DRS | ◯ | ||
| Fsee_B(14) | 0.2140 | 0.2173 | 0.9845 | 0.2300 | 0.2406 | 0.9559 | 0.9302 | DRS | ◯ | ||
| Fsee_B(15) | 0.1057 | 0.1057 | 1 | 0.1712 | 0.2856 | 0.5996 | 0.6173 | DRS | ◯ | ||
| Fsee_B(16) | 0.2312 | 0.2312 | 1 | 0.2904 | 0.2986 | 0.9727 | 0.7960 | DRS | ◯ | ||
| Fsee_B(17) | 0.4408 | 0.4534 | 0.9723 | 0.4573 | 0.4683 | 0.9765 | 0.9639 | DRS | ◯ | ||
| Fsee_B(18) | 0.6038 | 0.6038 | 1 | 0.7281 | 0.8202 | 0.8877 | 0.8293 | DRS | ◯ | ||
| Fsee_B(19) | 0.2868 | 0.2868 | 0.9999 | 0.3112 | 0.3112 | 1 | 0.9213 | IRS | ◯ | ||
| Ave. | 0.4668 | 0.4710 | 0.9917 | 0.5178 | 0.5459 | 0.9437 | 0.8904 | DRS: 82.4%, IRS: 17.6% | |||
| DMU Code | CRS-Based | VRS-Based | ||||||||
|---|---|---|---|---|---|---|---|---|---|---|
| Franchisor | Franchisee | Diff. (A)-(B) | Franchisor | Franchisee | Diff. (A)-(B) | |||||
| ME | BME (A) | ME | BME (B) | ME | BME (A) | ME | BME (B) | |||
| A(01) | 0.0932 | 0.0775 | 0.1104 | 0.0998 | (0.0223) | 0.1602 | 0.1383 | 0.3043 | 0.2638 | (0.1254) |
| A(02) | 0.2168 | 0.1837 | 0.7280 | 0.6459 | (0.4622) | 0.3133 | 0.2848 | 0.7787 | 0.5923 | (0.3075) |
| A(03) | 0.4564 | 0.3833 | 0.3020 | 0.2698 | 0.1135 | 1 | 0.7293 | 0.4539 | 0.4036 | 0.3256 |
| A(04) | 0.5730 | 0.4272 | 0.1963 | 0.1785 | 0.2487 | 1 | 0.8292 | 0.2584 | 0.2353 | 0.5939 |
| A(05) | 0.2176 | 0.1893 | 0.1508 | 0.1313 | 0.0580 | 0.3527 | 0.3247 | 0.3060 | 0.2598 | 0.0649 |
| A(06) | 0.6448 | 0.4631 | 0.1626 | 0.1475 | 0.3156 | 0.8319 | 0.7084 | 0.2713 | 0.2266 | 0.4818 |
| A(07) | 0.4903 | 0.3621 | 0.3603 | 0.3184 | 0.0437 | 1 | 0.7408 | 0.6287 | 0.5583 | 0.1825 |
| A(08) | 0.1685 | 0.1503 | 0.6165 | 0.5612 | (0.4109) | 1 | 0.7526 | 1 | 0.8289 | (0.0762) |
| A(09) | 0.2004 | 0.1797 | 1 | 0.9080 | (0.7284) | 0.7321 | 0.6376 | 1 | 0.8422 | (0.2047) |
| B(01) | 1 | 0.8100 | 1 | 0.5790 | 0.2311 | 1 | 0.8412 | 1 | 0.5235 | 0.3177 |
| B(02) | 0.4658 | 0.3995 | 0.3636 | 0.3312 | 0.0683 | 0.7006 | 0.6364 | 0.4944 | 0.4438 | 0.1926 |
| B(03) | 0.3283 | 0.2748 | 0.3712 | 0.3378 | (0.0630) | 0.3494 | 0.3058 | 0.4082 | 0.3750 | (0.0692) |
| B(04) | 0.3319 | 0.2882 | 0.5381 | 0.4896 | (0.2014) | 0.3353 | 0.2965 | 0.5648 | 0.4594 | (0.1629) |
| B(05) | 0.7803 | 0.6512 | 0.7399 | 0.6667 | (0.0155) | 1 | 0.7800 | 0.8668 | 0.7929 | (0.0129) |
| B(06) | 1 | 0.6142 | 0.4621 | 0.4210 | 0.1933 | 1 | 0.7081 | 0.5177 | 0.4624 | 0.2457 |
| B(07) | 1 | 0.6585 | 0.5107 | 0.4657 | 0.1928 | 1 | 0.7442 | 0.5478 | 0.5020 | 0.2422 |
| B(08) | 0.5137 | 0.4539 | 1 | 0.8927 | (0.4388) | 1 | 0.7887 | 1.0000 | 0.8126 | (0.0239) |
| B(09) | 0.3999 | 0.3459 | 0.3236 | 0.2935 | 0.0523 | 0.4429 | 0.4000 | 0.3416 | 0.2968 | 0.1032 |
| B(10) | 1 | 0.8291 | 0.8067 | 0.7359 | 0.0932 | 1 | 0.7179 | 1 | 0.5289 | 0.1891 |
| B(11) | 0.6135 | 0.4979 | 0.1749 | 0.1012 | 0.3966 | 0.6356 | 0.5618 | 0.2032 | 0.1344 | 0.4274 |
| B(12) | 0.5928 | 0.5167 | 0.2859 | 0.2598 | 0.2570 | 0.7138 | 0.6243 | 0.2930 | 0.2581 | 0.3662 |
| B(13) | 0.8584 | 0.6730 | 0.4099 | 0.3664 | 0.3066 | 1 | 0.7229 | 0.4126 | 0.3420 | 0.3808 |
| B(14) | 0.4324 | 0.3788 | 0.2140 | 0.1946 | 0.1842 | 0.4702 | 0.4325 | 0.2300 | 0.2096 | 0.2229 |
| B(15) | 0.2301 | 0.1627 | 0.1057 | 0.0963 | 0.0664 | 0.5767 | 0.5269 | 0.1712 | 0.1435 | 0.3835 |
| B(16) | 0.5963 | 0.4688 | 0.2312 | 0.2062 | 0.2625 | 0.7972 | 0.6971 | 0.2904 | 0.2631 | 0.4340 |
| B(17) | 0.5614 | 0.4549 | 0.4408 | 0.4006 | 0.0543 | 0.6314 | 0.5381 | 0.4573 | 0.4107 | 0.1274 |
| B(18) | 1 | 0.6729 | 0.6038 | 0.5489 | 0.1240 | 1 | 0.7315 | 0.7281 | 0.6566 | 0.0748 |
| B(19) | 0.4995 | 0.4395 | 0.2868 | 0.2561 | 0.1834 | 0.5364 | 0.4947 | 0.3112 | 0.2516 | 0.2431 |
| (A) CRS-Based | (B) VRS-Based |
|---|---|
 |  |
| Mann–Whitney U = 334.0, Wilcoxon W = 740.0, S.E = 61.025, Asymptotic Sig. = 0.342 | Mann–Whitney U = 221.0, Wilcoxon W = 627.0, S.E = 61.025, Asymptotic Sig. = 0.005 *** |
| CRS-Based | VRS-Based | |||
|---|---|---|---|---|
| Franchisor | Franchisee | Franchisor | Franchisee | |
| Total n | n = 28 (Premium = 9, Mainstream = 19) | |||
| Mean Rank * | P = 8.00, M = 17.58 | P = 12.78, M = 15.32 | P = 14.67, M = 14.42 | P = 15.67, M = 13.95 |
| Mann–Whitney U | 144.000 | 101.000 | 84.000 | 75.000 |
| Wilcoxon W | 334.000 | 291.000 | 274.000 | 265.000 |
| Standardized Test | 2.878 | 0.762 | −0.074 | −0.517 |
| Asymptotic Sig. | 0.004 *** | 0.446 | 0.941 | 0.605 |
Publisher’s Note: MDPI stays neutral with regard to jurisdictional claims in published maps and institutional affiliations. |
© 2022 by the authors. Licensee MDPI, Basel, Switzerland. This article is an open access article distributed under the terms and conditions of the Creative Commons Attribution (CC BY) license (https://creativecommons.org/licenses/by/4.0/).
Share and Cite
Kim, S.B.; Choi, K. Bridging the Operational Efficiency Differences between Franchisors and Franchisees: A Metafrontier Approach. Processes 2022, 10, 2021. https://doi.org/10.3390/pr10102021
Kim SB, Choi K. Bridging the Operational Efficiency Differences between Franchisors and Franchisees: A Metafrontier Approach. Processes. 2022; 10(10):2021. https://doi.org/10.3390/pr10102021
Chicago/Turabian StyleKim, Seung Beom, and Kanghwa Choi. 2022. "Bridging the Operational Efficiency Differences between Franchisors and Franchisees: A Metafrontier Approach" Processes 10, no. 10: 2021. https://doi.org/10.3390/pr10102021