Article

Effect of Sulfate, Citrate, and Tartrate Anions on the Liquid-Liquid Equilibrium Behavior of Water + Surfactant

by
Otto A. Q. Jimenez
1,
Josiel M. Costa
2,*,
Bruno R. de Souza
1,
Abimael C. Medeiros
1,
Edson G. Monteiro-Junior
1 and
Rodrigo C. Basso
1
1
Science and Technology Institute, Federal University of Alfenas (UNIFAL-MG), José Aurélio Vilela Road, 11999, BR 267, Km 533, Poços de Caldas 37715-400, MG, Brazil
2
School of Food Engineering (FEA), University of Campinas (UNICAMP), Campinas 13083-862, SP, Brazil
*
Author to whom correspondence should be addressed.
Processes 2022, 10(10), 2023; https://doi.org/10.3390/pr10102023
Submission received: 7 September 2022 / Revised: 27 September 2022 / Accepted: 4 October 2022 / Published: 7 October 2022

Abstract

:
Cloud point extraction is a versatile method aimed at separating compounds from complex mixtures and arouses great technological interest, particularly among the biochemical industries. However, one must have deep knowledge of the liquid–liquid equilibrium behavior of systems to properly use the method. Thus, we used thermodynamic parameters to evaluate the effect of citrate, sulfate, and tartrate anions on the phase separation of water + Triton X-114® mixtures at 283.2 K, 293.2 K, and 303.2 K. In these systems, increasing the temperature and the anion molar fraction expanded the biphasic region in the following order: C 6 H 5 O 7 3 - > SO 4 2 - >   C 4 H 4 O 6 2 . Unlike other studies based on the Hofmeister series, the Gibbs free energy of micellization correlated the anion effect on the biphasic region with the spontaneity of the micelle formation. The water molecules structured around these anions were evaluated according to the shell volume of the immobilized water by electrostriction, volume of water around the hydration shell, Gibbs free energy of hydration, and Gibbs free energy of electrostriction ( Δ G el 12 ). The citrate anion presented a higher Δ G el 12 of −1781.49 kJ mol−1, due to the larger number of electrons around it. In addition, the partition coefficient of the surfactant in the two liquid phases revealed a linear dependence upon the anion mole fractions by following the previous anion sequence and temperature in the phase separation.

Graphical Abstract

1. Introduction

Aqueous biphasic systems provide an efficient alternative for separation and extraction techniques, due to their meeting the current environmental and sustainability requirements [1]. Their use is based on the different partitions found among the target compound and other molecules in the two liquid phases. Thus, many research groups have been conducting studies based on the separation and pre-purification of several compounds through this technique, such as plasmid DNA [2], papain [3], bromelain [4], bovine serum albumin [5], cefazoline [6], norbixin [7], metal ions [8], and monoclonal antibodies [9].
The cloud point extraction technique consists of a phase separation of an aqueous surfactant solution by temperature change and/or adding a third component. The process presents a micellar-rich phase, composed mostly of the surfactant, and a water-rich phase. Its advantages are the mild extraction temperatures, solute biological activity conservation, process simplicity, and the non-requirement for organic solvents [10].
Triton X-114® is an anionic surfactant used to extract compounds of biotechnological interest through the cloud point method [11,12,13,14]. This surfactant has a low cloud point temperature, reduced toxicity and market price, high density (resulting in fast-settling separation), and low critical micellar concentration [14].
Aqueous biphasic systems use salts to purify enzymes and other proteins, drugs, nucleic acids, and other metabolites. These electrolytes affect the phase equilibrium behavior of surfactant solutions and can be added to systems to modify the phase separation region. They decrease the cloud point and/or modulate the target compound partition to be extracted [15,16,17,18,19,20].
Considering Triton X-114’s versatility in extracting compounds of a high market price in biochemical processes through the cloud point method, studies on the concomitant temperatures and anion effects on the thermodynamic parameters of solutions are scarce. To the authors’ knowledge, no liquid–liquid equilibrium data were found in the systems studied, as a function of temperature. The reported studies focused on the cloud point changes, composite partitioning, and phase separation, according to the phase composition results only, with no additional thermodynamic basis. Most of the works were not based on the micellization theory, quantitative thermodynamic parameters, and/or thermodynamic solvation of ions. Instead, they are focused on the Hofmeister series, a theory based on the specifics of each type of system that exhibits unstable behavior, as Koga [21] demonstrated through the six different Hofmeister classifications for the same anions. In this context, Sun et al. [22] highlighted the importance of understanding the effect of salt on extraction processes using aqueous two-phase systems. They pointed out that abnormal phenomena are not understood only from a simplistic interpretation, according to the salting-out ability of ions.
Therefore, this study addressed the effect of citrate ( C 6 H 5 O 7 3 ), tartrate ( C 4 H 4 O 6 2 ) , and sulfate ( SO 4 2 ) anions on the liquid–liquid equilibrium of systems containing water + Triton X-114® (TX114) + sodium salts. We analyzed the systems at 283.2 K, 293.2 K, and 303.2 K. The experimental data associated with micellization and ion solvation theories provided the quantitative thermodynamic parameters. The parameters selected to discuss the system equilibrium were: the Gibbs free energy of micellization ( Δ G mic ° ) , entropy ( Δ S mic ° ) , and enthalpy of micellization ( Δ H mic ° ) ; the volume of anion hydration ( V hyd ) ; the shell volume of immobilized water by the electrostriction effect ( V el 1 ) ; the volume of water around the hydration shell ( V el 2 ) ; the Gibbs free energy of anion hydration ( Δ G hyd ) ; the Gibbs free energy of electrostatic interaction in the hydration shell and the shell around itself ( Δ G el 12 ) .

2. Materials and Methods

2.1. Experimental Procedure

Triton X-114 ((1,1,3,3-Tetramethylbutyl)phenyl-polyethylene glycol), Sigma-Aldrich, >99.0%); sodium sulfate (Synth, >99.0%); sodium citrate (Synth, >99.0%); di-hydrate sodium tartrate (Synth, >99.0%); and bi-demineralized water were used for the study. The evaluated systems were water + TX114 + sodium sulfate, sodium citrate, or sodium tartrate at 283.2 K, 293.2 K, and 303.2 K.
The binodal curves were determined by turbidimetric titration. The Triton X-114® rich-phase (TXRP) of the binodal curves was obtained by titrating a concentrated mixture of the surfactant + water in the equilibrium cell with salt solutions, at concentrations ranging from 9.7 to 10.2%, 8 to 10%, and 5.1 to 11.3% (w/w) for the sodium citrate, sodium sulfate, and sodium tartrate, respectively, until the turbidity formation. The mixture on the cell was titrated with a pure polymer until the solution became limpid. Afterward, the system was titrated with a salt solution until the turbidity formed. The salt-rich phase (SRP) of the binodal curves was obtained by a diluted mixture of the surfactant and water in an equilibrium cell. The mixture was titrated with saline solutions at concentrations ranging from 19.8 to 20%, 14 to 15.3%, and 17.3 to 21.1% (w/w) for the sodium citrate, sodium sulfate, and sodium tartrate, respectively, until the formation of the turbidity. Again, the titration of the mixture in the cell at equilibrium was carried out with a pure polymer, and then with the saline solution, as previously described.
A magnetic stirrer (Gehaka, São Paulo-Brazil, Model AA-840) maintained the systems under agitation in a glass equilibrium cell at a temperature controlled by a thermostatic bath (Tecnal, Piracicaba-Brazil, model TE-2005). Before and after dripping the solutions or pure compounds, 20 mL syringes for the titrations were weighed on an analytical balance (Shimadzu, Japan, Model AUY-220, 0.0001 g accuracy). The component masses for each cloud point were obtained from weighing, and the component mass fraction was determined for each cloud point on the binodal curve.
The determination of the mass fractions of the tie lines occurred as proposed by Merchuk et al. [23]. The initial compositions of each system were selected from the biphasic region obtained through the binodal curves. The mass of each component was determined to result in the best combination of tie lines with a total system mass of 12 g. After choosing the points representing the total composition of each tie line that will split into both phases in a state of equilibrium described for the mass fractions of the three components in the biphasic region of the diagrams (overall composition points—OC), the components were weighed in propylene Falcon tubes. The samples were mixed using a vortex agitator (Gehaka, São Paulo-Brazil, Model AV-2) and kept in a thermostatic bath for at least 24 h, until the two phases achieved a state of equilibrium, determined by two clear phases separated by a defined interface. The masses of each phase were collected and weighed separately, until reaching nearly 1 mm from the interface. The individual masses of the equilibrium phases of each OC provided the mass fractions of the components in the TXRP and SRP.

2.2. Determination of Thermodynamic Parameters

The TXRP, SRP, and OC are represented in equations as Roman numerals I, II, and III, respectively. The mass fractions of the TX114 and sodium salts per tie line were determined from the masses of the TXRP, SRP, and OC by solving four mass-balance Equations (1)–(4) using the add-in Solver (Microsoft Excel™). Equation (5) represents the ratio between the SRP and OC masses, as proposed by Merchuk et al. [23].
W TX 114 II = ( W TX 114 III ) ( 1 ) W TX 114 I
W salt II = ( W salt III ) ( 1 ) W salt I
W TX 114 II = a + bW salt II + c ( W salt II ) 2
W TX 114 I = d + eW salt I + f ( W salt I ) 2 + g ( W salt I ) 3 + h ( W salt I ) 4
= mass II mass III
where W—Component mass fraction; a, b, c, d, e, f, g, and h are coefficients from the binodal curves (Tables S1 and S2); the subscripts represent the components in the systems; and the superscripts III, II, and I are the overall composition, salt-rich, and TX114-rich phases, respectively.
The coefficients from Equations (3) and (4) were obtained by fitting the polynomial equation to the experimental data using the software Statigraphic Centurion18 ™. The coefficients of determination were higher than 0.9840 for the SRP and higher than 0.9950 for the TXRP. After calculating the mass fractions of the phases using the methodology proposed by Merchuk et al. [23], all the composition values were converted into a molar fraction basis. Tables S3–S11 display the molar fractions of the tie lines for the systems water + TX114 + sodium sulfate, sodium citrate, or sodium tartrate at 283.2, 293.2, and 303.2 K.
Equation (6) determines the ( Δ G mic ° ) . Corkill et al. [24] and Zana [25] reported the viability of using this equation for micellar systems.
Δ G mic ° = RTln ( X TX 114 )
where R—Universal gas constant ( kJ   mol 1   K 1 ) , T—Temperature (K), and X TX 114 —Molar fraction of the TX114.
The enthalpy of micellization was obtained by the slope in the linear plot of ( Δ G mic ° T ) vs. (1/T), according to Equation (7), as reported by Sadeghi and Jamehbozorg [26].
Δ H mic ° = d ( Δ G mic ° T )   d ( 1 / T )
The Gibbs–Helmotz equation provides the Δ S mic ° (Equation (8)).
Δ G mic ° = Δ H mic °     T Δ S mic °
Equations (6)–(8) determined the thermodynamic parameters of the TX114 that ranged between 0.005 and 0.010 molar fractions, which correspond to each salt molar fraction at the x-axis in the graph. The same range of the TX114 molar fraction for all the systems allowed the evaluation of the effect of the anionic composition on these thermodynamic parameters, without the influence of the surfactant molar fractions.
Ebrahimi et al. [27] described the relative contribution of entropy on Δ G mic ° , according to Equation (9).
ξ = | T Δ S | | T Δ S | + | Δ H |
Marcus [28] has proposed the separation of the electrostriction volume into two regions. The first shell is a dielectrically saturated water layer, where the water molecules around the bare ions are completely immobilized ( V el 1 ) . The second shell is the layer where the ion interacts electrostatically with the water molecules in the first surrounding layer ( V el 2 ). Marcus [29] reported that the standard partial volume of the ion results from a sum of four terms, as demonstrated in Equation (10).
V 0   ¯ = V hyd + V el 1 + V el 2 + V str
where V hyd —Volume of hydrated anion by disregarding the electrical charge effect, V el 1 —Lower volume caused by electrical charge (electrostriction) in the hydration shell, V el 2 —Volume decrease around the hydration shell due to electrical effect, V str —Volume increase due to the water molecules structured around the hydrophobic groups (23.2 cm 3   mol 1 for the C 6 H 5 group in citrate anion) [29].
The V str is used for large hydrophobic anions with alkyl or aryl groups, resulting in water molecules around them to structure themselves, with an open, clathrate-like structure of positive values. V str are assigned as 6.1, 5.4 and 23.2 cm 3   mol 1 for CH 3 , CH 2 and C 6 H 5 groups [29].
As proposed by Marcus [29], Equations (11)–(14) determine each volume contribution for the salt anions at 298.2 K:
V hyd = ( 4 / 3 ) π N Av + ( r + Δ r ) 3
V el 1 = 59 . 27 | z i | Δ r / ( r + Δ r )
V el 2 = 417 . 5   z 2   [ 1 / ( r + Δ r ) ]
Δ r = ( 9 . 46 × 10 4 | z | r + r 3 ) 1 / 3 r
where z—Anion charge, N Av —Avogadro number, Δ r —Thickness of immobilized water spherical shell surrounding the ion, r—Effective radius of anions determined by the apparent molar volume at 298.2 K: C 6 H 5 O 7 3 —72.0 cm 3   mol 1 , C 4 H 4 O 6 2 —60.1 cm 3   mol 1 [30], SO 4 2 —36.5 cm 3   mol 1 [31] (Table S12).
As proposed by Marcus [32], Equations (15)–(18) provide the parameters of the   Δ G hyd at 298.2 K:
Δ G hyd = Δ G neu + Δ G el 12 + Δ G uns
Δ G neu = 41     87 r + 1200 r 2
Δ G el 12 = 64 . 5 z 2   [ 0 . 44 Δ r r + 0 . 987 ] / ( r + Δ r )
Δ G uns = 120 rz 3
where Δ G neu —Gibbs free energy of the neutral interaction between the anions and water, Δ G el 12 —Gibbs free energy of the electrostatic interaction in and around the hydration shell, and Δ G uns —Gibbs free energy of an unsymmetrical charge effect.
The Setschenow-type equation was used for the systems at 303.3 K (the temperature above the cloud point of water + polymer mixture with no salt), as reported by Carale et al. [33] (Equation (19)).
ln ( X TX 114 I ) = ln ( X TX 114 cm )     k S X salt I
where X TX 114 I —Polymer molar fraction in the binodal curve, X TX 114 cm —Critical micellar concentration for the water + polymer mixture at 303.2 K, k S —Salt coefficient, and X salt I —Salt molar fraction in the binodal curve.
Equation (20) provides the partition coefficients:
k = X TX 114 I X TX 114 II
where X TX 114 I —TX114 molar fraction of TXRP, and X TX 114 II —TX114 molar fraction of SRP. Both were obtained through their mass balance (Equations (1)–(4)).

3. Results and Discussion

The systems containing salt demonstrated an increase in the biphasic region with increasing temperature, as illustrated in Figure 1.
The electrolytes induced the phase separation at temperatures below the cloud point of the surfactant-water mixture in the absence of the salts, at 296.4 K. The TX114 micelles formation separated the liquid into two phases. The decrease of the anions in the systems with the increasing temperature determined the difference in the biphasic area. Increasing the temperature of the TX114 solutions caused changes in the packing between the TX114 molecules, increasing the apparent molar volumes and the fractional free volumes of the solution [14]. The hydrogen bonds between the water and oxyethylene groups in the TX114 become weaker, reducing the polymer hydration. Therefore, the competition of the anions with the TX114 for the water molecules, associated with the increase in temperature, promoted the aggregation of the TX114 as micelles, inducing the formation of the TXRP. Aravopoulou et al. [34] reported this mechanism on hydrogen bonds between water and hydrophilic portions of macromolecules as a cause of the effect of temperature on phase separation in mixtures of thermoresponsive polymer + water systems.
In the SRP, the polymer mass fractions were small and similar for the three salts in the same temperature range. It decreases as the molar fraction of the salt increases, indicating a linear trend, with the low slope in the binodal curve. In the TXRP, there was an increase in the molar fraction of the polymer, as a function of the molar fraction of the electrolyte. The polymer dehydration caused by the binding of the saline anions with the water molecules separated the phases and promoted the interaction between the micelles, decreasing their solubility [35].
The C 6 H 5 O 7 3 , SO 4 2 , and   C 4 H 4 O 6 2 anions from the sodium salts increased the biphasic region, as a function of the concentration. The systems containing the sodium citrate demonstrated a larger biphasic area, followed by those having the sodium sulfate, which presented slightly larger phase separation regions than those containing the sodium tartrate, indicating an exclusion effect on the TX114 in the sequence C 6 H 5 O 7 3 > SO 4 2 > C 4 H 4 O 6 2 . The difference was bigger according to the polymer molar fraction and less evident with increasing temperature. Ghaffari et al. [6] observed a similar trend for the same anions in the phase separation of polyethylene glycols, with average molar masses of 6000 g   mol 1 and 8000 g   mol 1 .
Ananthapadmanabhan and Goddard [36] reported three mechanisms for a mutual exclusion between hydrated ions and hydrated polymers promoting phase separation: (1) a repulsive interaction between the anions and anion-like TX114 groups, resulting from the high electronegativity of the oxygen atoms in the surfactant molecule; (2) imaging forces resulting from a dielectric discontinuity at the TX114–water interface; (3) the hydration layer around the ions and polymers acts as an obstacle for interactions between the hydrated anionic structures and the hydrated polymeric structures.
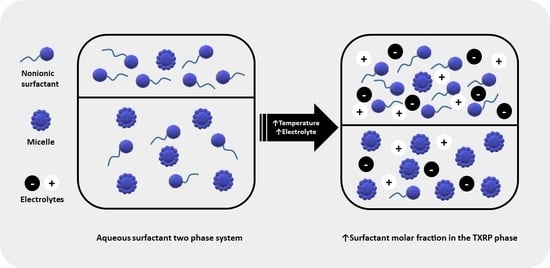
The solutropism observed in the tie lines of Figure 1 indicate a higher salt molar fraction increase in the SRP compared to the TXRP. A high concentration of electrolytes in the system increased the exclusion of the TX114 on the anions in the TXRP. The temperature and electrolyte concentration resulted in the highest surfactant molar fraction in the surfactant-rich phase, reinforcing the volume exclusion effect between the components.
The salt coefficients in Setschenow-type equations for the TXRP in the systems at 303.2 K corroborated the previous sequence for the salt effect on the TX114 exclusion, as described in Equations (21)–(23). The salt coefficients correlated the salt molar fraction with the polymer molar fraction in the binodal curve, where there is micelle formation. The higher absolute values indicated a higher salt effect on the phase separation. A slight difference between the coefficients for the   C 4 H 4 O 6 2 and SO 4 2 corresponded to a difference in the exclusion effect for the anions. The linear coefficients indicated a maximum relative standard deviation of 2.54% for −5.51, equivalent to a critical micellar concentration of 0.0041 in the molar fraction of the water + TX114 mixture, in the absence of salt. The small differences between the linear coefficients demonstrated the excellent fit of the equations.
ln ( X TX 114 I ) = 5 . 42 + 450 . 91   X citrate
ln ( X TX 114 I ) = 5 . 38 + 319 . 89   X sulphate
ln ( X TX 114 I ) = 5 . 37 + 293 . 9   X tartrate
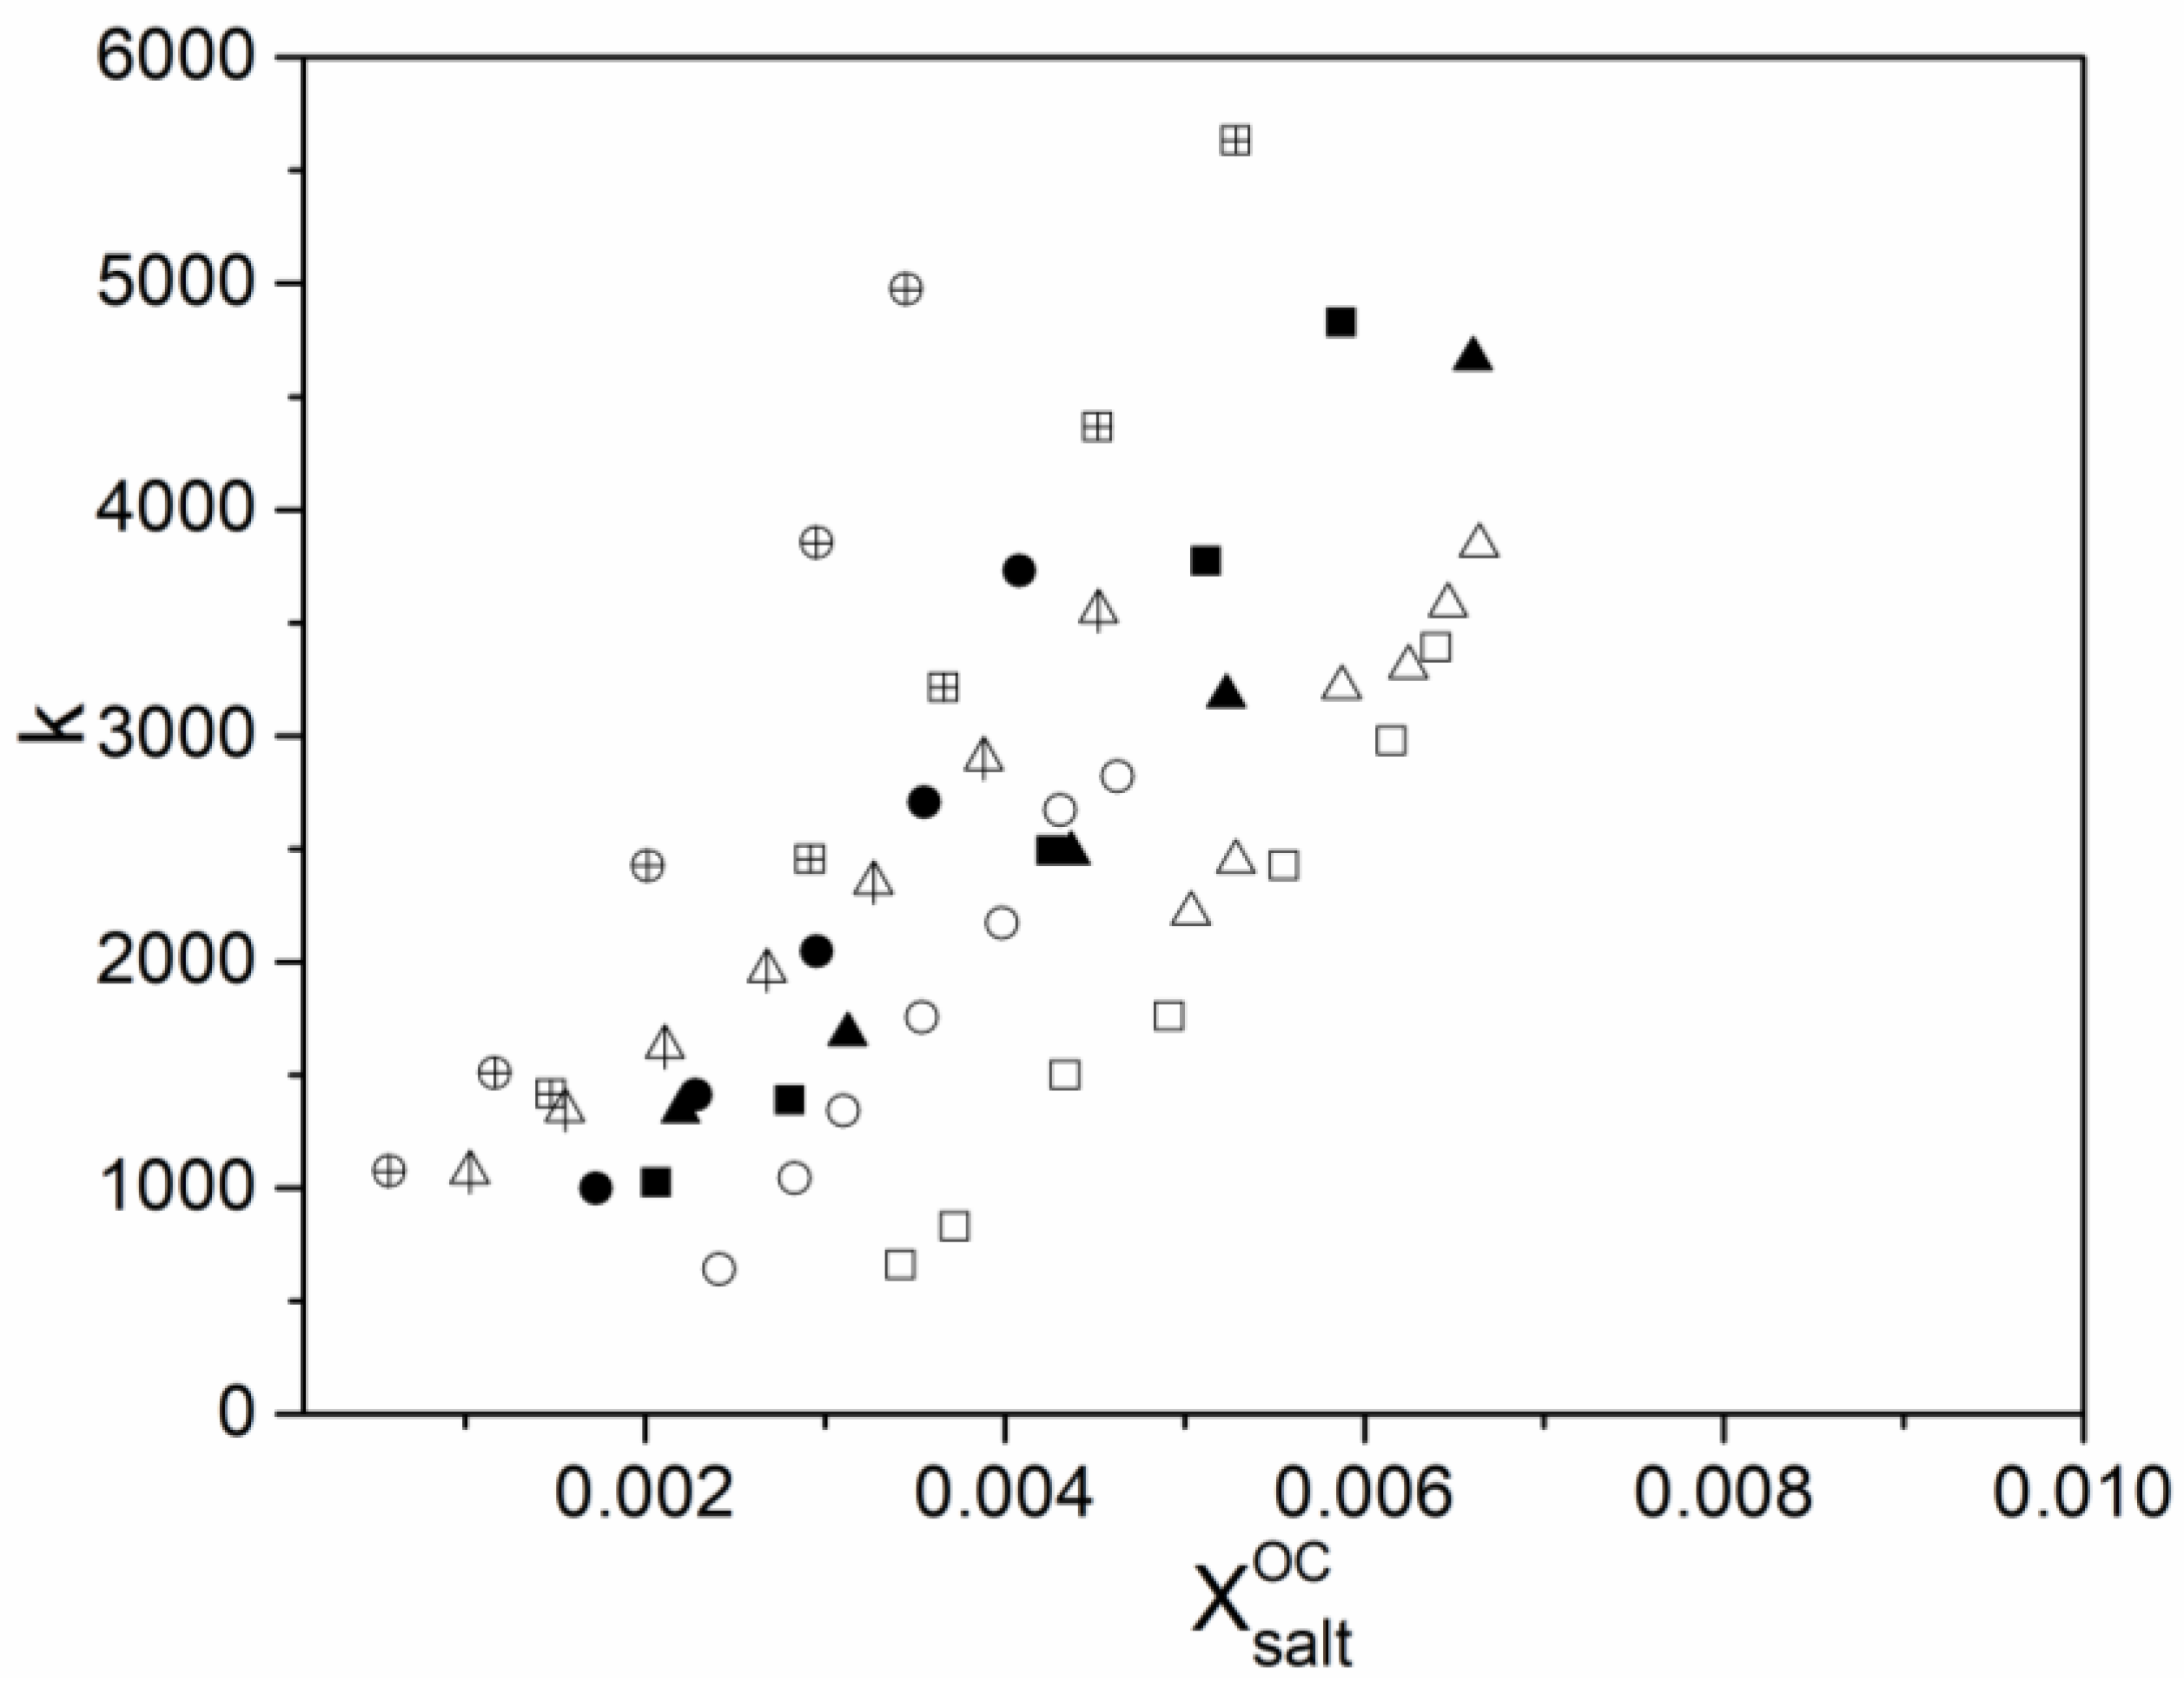
As displayed in Figure 2, the partition coefficients for the TX114 linearly correlated with the molar fraction of the salt in the OC. The adjustment by the linear functions indicated an R 2     0 . 9644 for all systems.
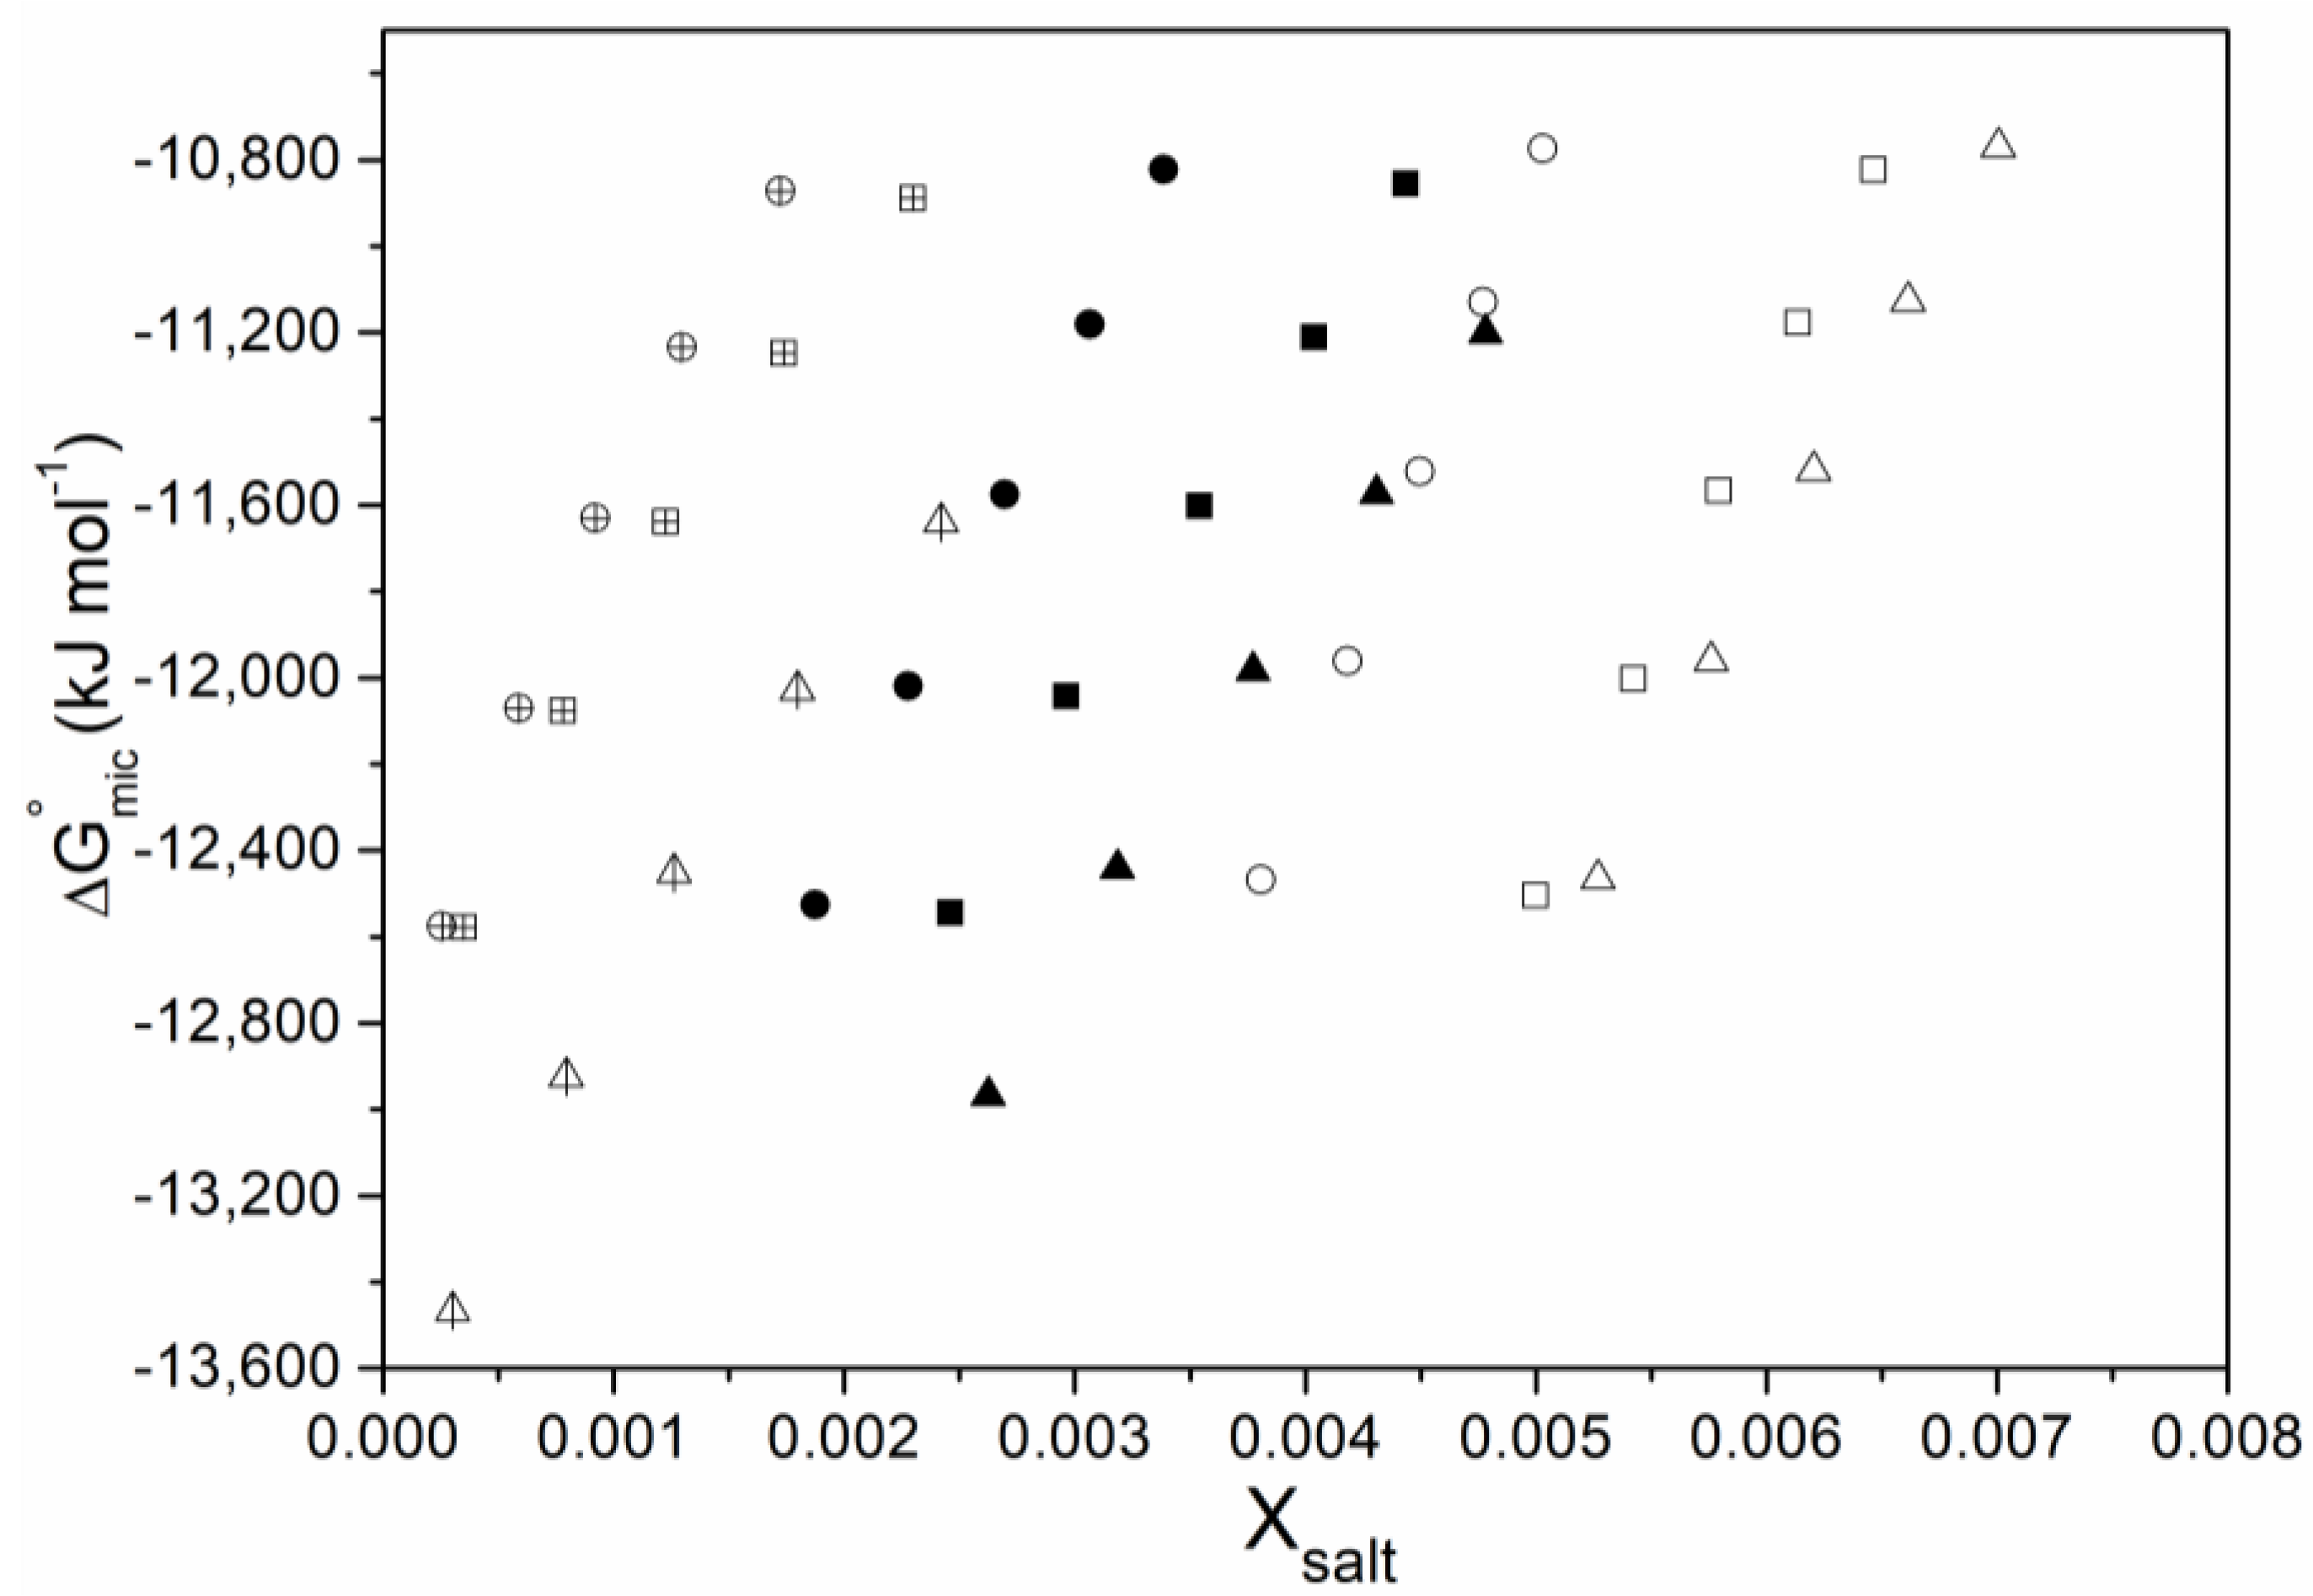
According to Figure 3, the Δ G mic ° in the TX114 molar fraction ranging from 0.005 to 0.010 were negative for the systems containing the three salts. A value of Δ G mic ° −19.4 kJ   mol 1 for the water + TX114 mixture without electrolytes at 298.2 K was reported previously [37]. Comparing the latter value to the Δ G mic ° ranging from −13.5 to −10.8 k J   mol 1 for the systems with the three salts, the spontaneous phase separation was induced by the anions, and was smaller than that induced by the temperature effect.
Smaller molar fractions of the C 6 H 5 O 7 3 induced similar Δ G mic ° in the systems compared with the other two anions, while the smaller molar fractions of the SO 4 2 led to a similar or higher Δ G mic ° compared to the   C 4 H 4 O 6 2 by following the sequence of anions in the TX114 exclusion. The bigger difference between the Δ G mic ° due to temperature emphasizes its favorable effect on the phase separation spontaneity, even in the presence of anions.
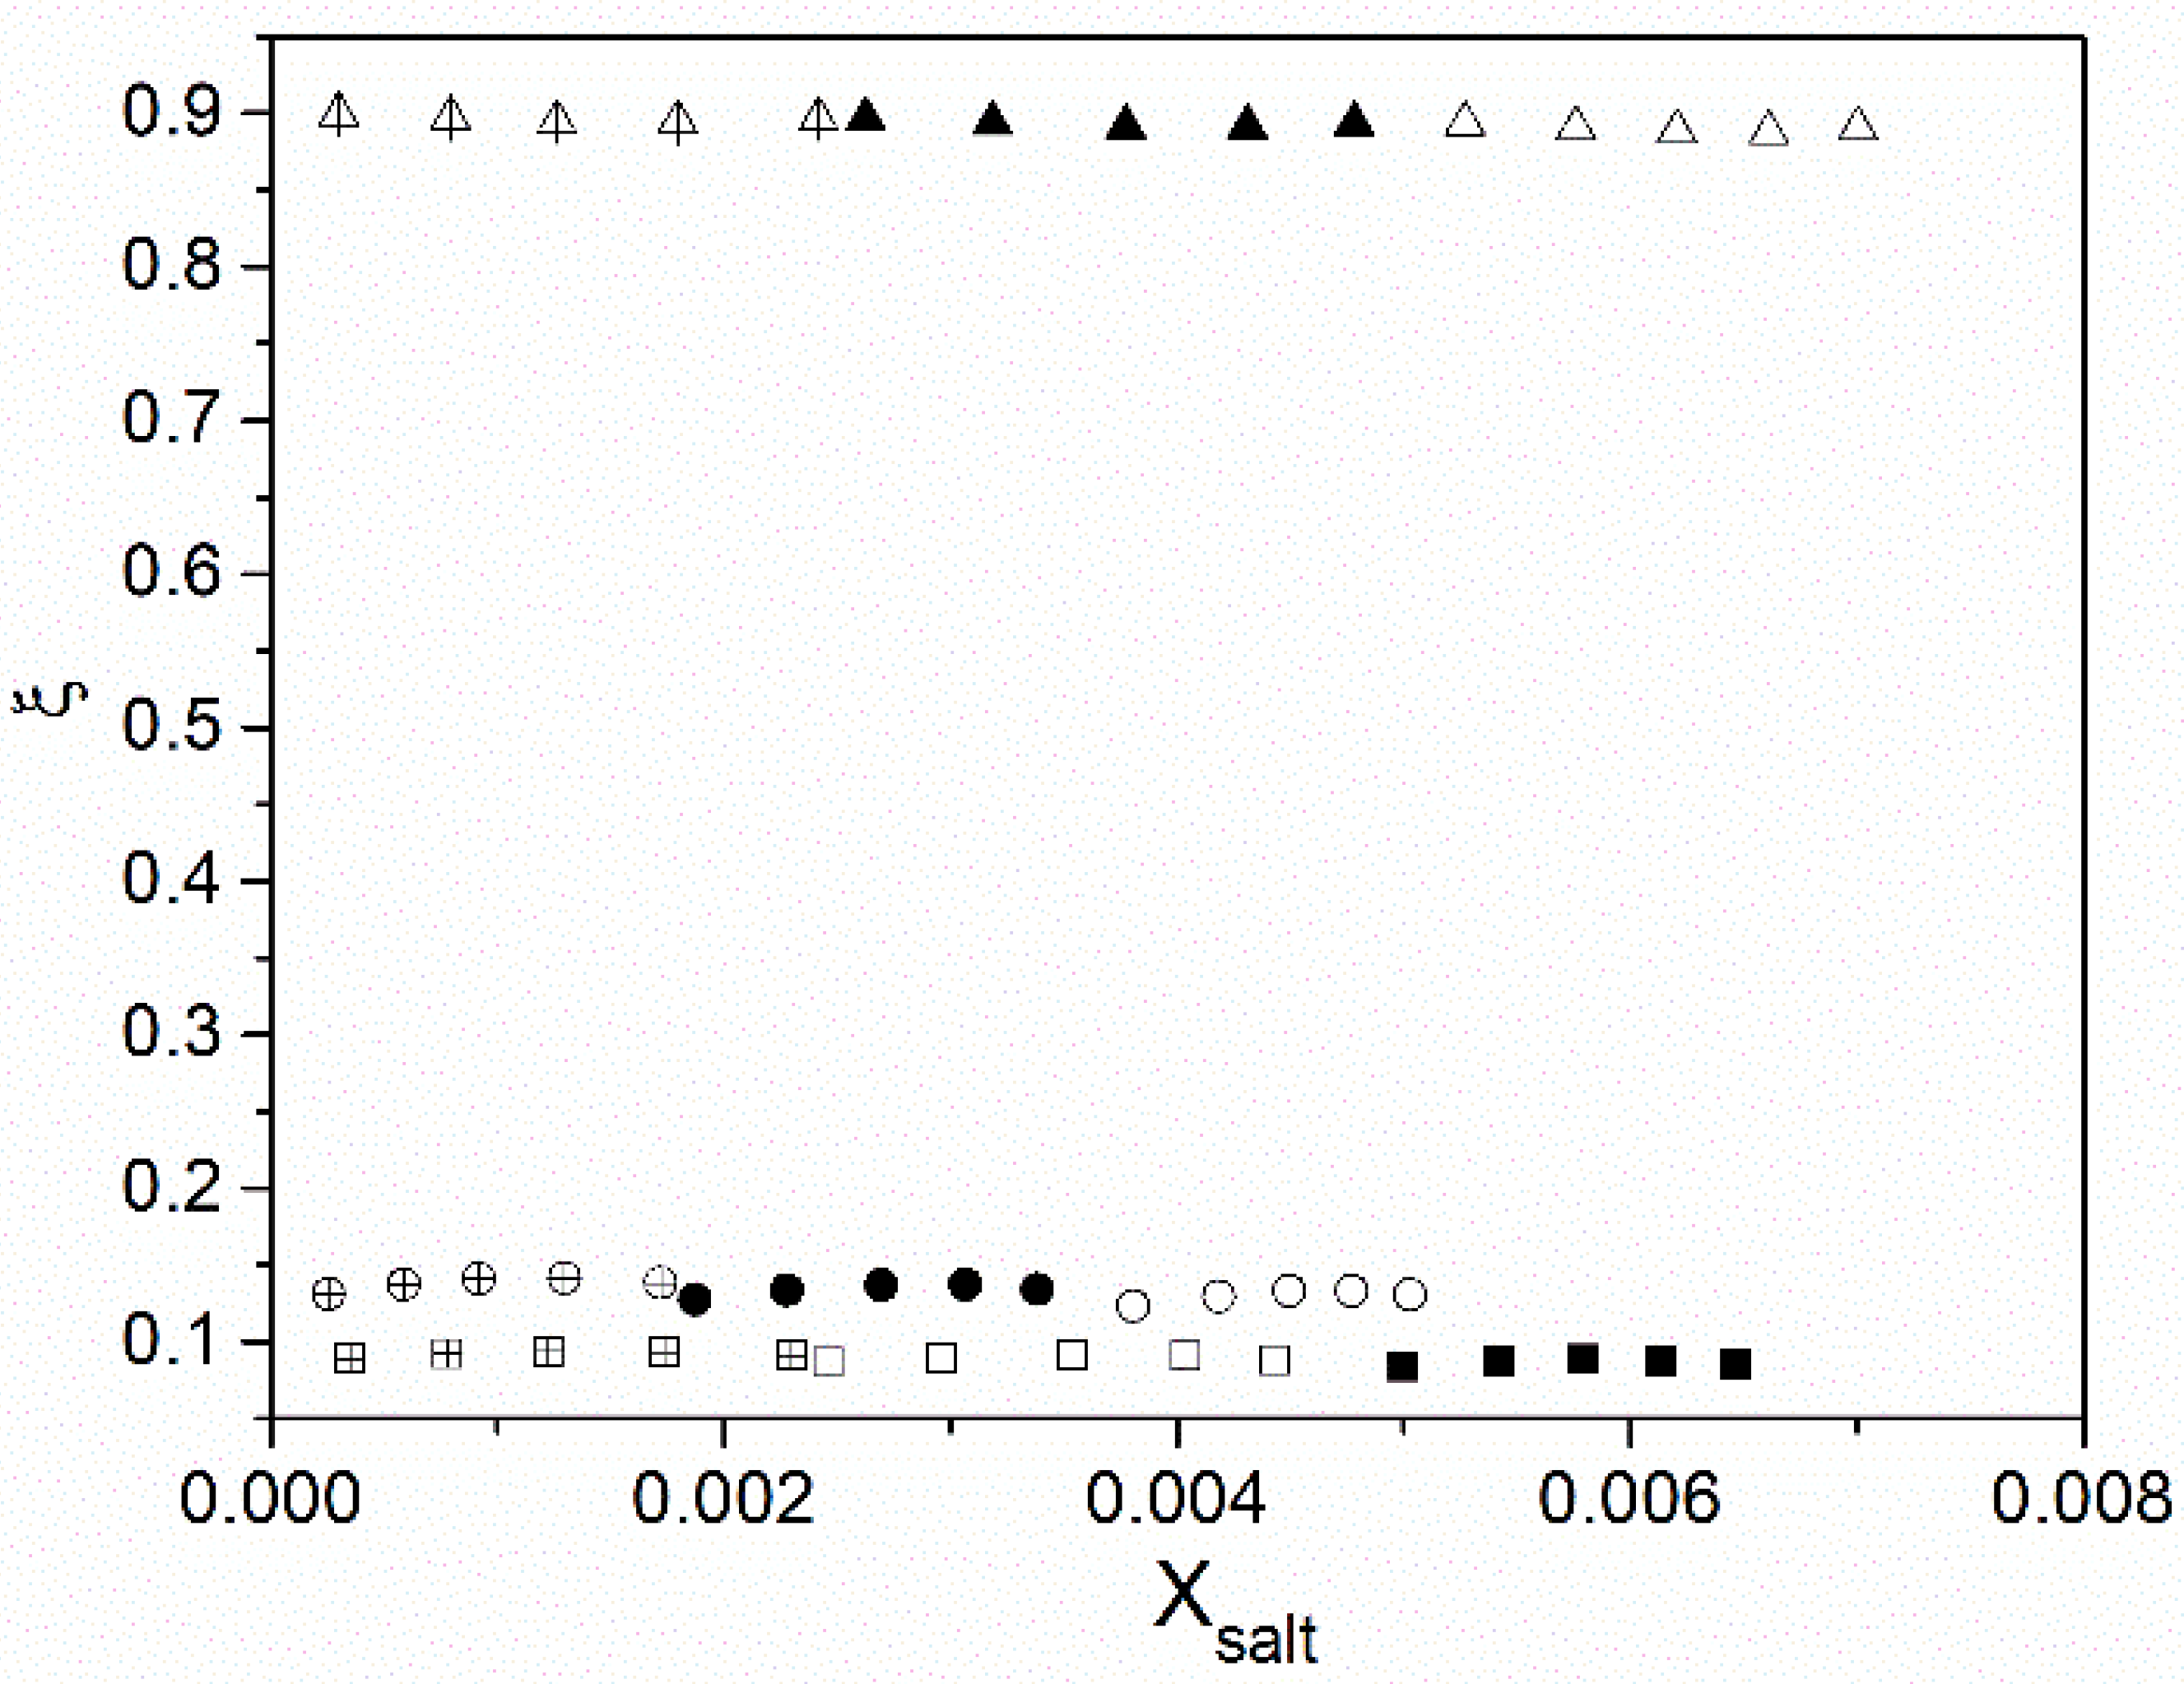
The TX114 partition to a polymer-rich phase and the tendency of micellar formation given by the   Δ G mic ° is a linear function of the salt molar fraction, indicating a direct correlation between both parameters. Figure 4 displays the entropic contributions in the range of 0.89 to 0.90, 0.12 to 0.14, and 0.08 to 0.09 for the   C 4 H 4 O 6 2 , C 6 H 5 O 7 3 , and   SO 4 2 , respectively, in the same TX114 mole fraction range.
The Δ S mic ° were all positive for the systems containing the C 4 H 4 O 6 2 , C 6 H 5 O 7 3 , and SO 4 2 anions, resulting in values ranging from 43.4 to 50.0 J   mol 1 , 5.0 to 5.5 J   mol 1 , and 3.3 to 3.7 J   mol 1 , respectively, and the TX114 mole fractions ranged from 0.005 to 0.010. Simultaneously, the Δ H mic ° values ranged from 1517 to 1686 J   mol 1 , −10930 to −9368 J   mol 1 , and −11456 to −9896 J   mol 1 for the systems containing the   C 4 H 4 O 6 2 , C 6 H 5 O 7 3 and SO 4 2 , respectively, in the same TX114 mole fraction range.
The positive Δ S mic ° demonstrates a higher energy dispersion in the systems, revealing that the order added to the systems by the formation of the micelles was smaller than the disorder generated by the dehydration of the TX114. Previous studies have reported that hydrated oxyethylene groups of non-ionic surfactants induced the structuring of the liquid phase [38,39]. Furthermore, the loss of water molecules bonded to such polar groups increased the overall randomness in the systems and their entropy.
According to Table 1, the lowest absolute values of the Δ G el 12 among the three anions explain the positive Δ H mic ° and the highest Δ S mic ° values for the tartrate anions. Although the   C 4 H 4 O 6 2 competes with the TX114 molecules for water, the bonds between the water and this anion are weaker than those for the C 6 H 5 O 7 3 and SO 4 2 . Therefore, the     C 4 H 4 O 6 2 anions in the system present less polymer dehydration, resulting in less energy release and less micelle formation. The weaker solvation of the   C 4 H 4 O 6 2 also leads to less organization in the systems, providing the high Δ S mic ° values.
Burakowski et al. [40] pointed out that a small number of hydrophilic groups in the molecule (oxyethylene groups) interacted with water in the micellization of anionic surfactants, which may reveal a partial hydration or dehydration of the TX114, depending on the type of anion. Carale et al. [33] stated that the creation of the cavity to accommodate the hydrophobic tail of the polymer is a function of the charge density of the anion. Its higher values result in a well-structured, solvent–solvent interaction. Therefore, in the presence of the tartrate anion, there are fewer broken bonds between the water and the TX114 than with the citrate and sulfate anions. In addition, the formation of the water cavities by the surfactant uses less energy, decreasing the energy absorbed in the micellization phase with a higher energy dissipation. The lower solvation of the tartrate anion results in a high disorder of less-structured water molecules, increasing the entropy of the system compared to those with the other anions.
The anion charge is directly correlated to the water structuring by changes in the O–H bonds between the two states (bench or linear), resulting in the Gibbs free energy, entropy, and enthalpy of 252 cal   mol 1 , −16.9 cal   mol 1 , and −4.78 cal   mol 1 , respectively, for the changes between these states [41]. The negative Δ G el 12 for the C 6 H 5 O 7 3 was almost twice that for the SO 4 2 , revealing the large electrical charge associated with a greater influence of the first anion on the organization of the surrounding water molecules and, therefore, on the volume exclusion effect, as well. A larger number of electrons around the citrate anion led to the highest Δ G el 12 among the anions.
The Δ G hyd of the citrate, sulfate, and tartrate anions were all negative, indicating that the hydration was a spontaneous phenomenon. In absolute values, the parameter was higher for the C 6 H 5 O 7 3 than for the SO 4 2 , and slightly higher than that of the   C 4 H 4 O 6 2 . As the anion hydration results in the surfactant dehydration and, consequently, in the formation of the micelles, the previous sequence reinforced the effect of the anion in the exclusion of the TX114 and followed the tendencies observed for the Δ G mic ° as a function of the anion effect on the biphasic region. Moreover, Rogers, and Bauer [42] studied polyethylene glycols, based on aqueous systems, and reported a direct correlation between the magnitude of the absolute values of the Δ G hyd and the salting effect of the anions. Zafarani-Moattar and Hamzehzadeh [43] also observed that the correlation between the Δ G hyd and the anion exclusion affected the phase separation in a ternary aqueous system containing a mixture of 1-butyl-3-methylimidazolium bromide + potassium citrate.
Table 2 displays the V el 1 and V el 2 parameters. The C 6 H 5 O 7 3 anions reduced the water volume in the hydration shell and the one surrounding it. Despite the same valence number of the SO 4 2 and   C 4 H 4 O 6 2 , the former showed a greater reduction in the water volume for both shells. The thickness of the immobilized and spherical water shells around the anions ( Δ r ) due to the electrical field in this region were 0.038 nm, 0.030 nm, and 0.024 nm for SO 4 2 , C 6 H 5 O 7 3 , and   C 4 H 4 O 6 2 , respectively.
The C 6 H 5 O 7 3 achieved the greatest reduction in the water volumes of the hydration shell ( V el 1 ) and the shell around itself ( V el 2 ), due to its higher absolute valence number than the other anions. Its higher negative charge led to a strong dielectric saturation and the immobilization of the water molecules on the shell next to the bare ion, in addition to electrically affecting the solvent shell around the former. Anions with a higher valence are more effective in promoting surfactant micellization than those with a lower valence [44]. Notwithstanding the same charge of the SO 4 2 and C 4 H 4 O 6 2 , the reduction in the water volume around the first anion was higher than the second one. According to the V el 1 and V el 2 , the smaller size of the sulfate anions resulted in a higher charge density than that of the tartrate anions.
The solvated ions of the salt added to a polymeric solution compete with the surfactant for the water molecules, reducing its solubility. Cations are less solvated than anions and have a minor effect on the biphasic region formation. Furthermore, as the Na + cations are common in the three salts of the study, the differences in the phase behavior were due to the C 6 H 5 O 7 3 , SO 4 2 , and C 4 H 4 O 6 2 anions. The V hyd of these anions at 298.2 K followed the sequence: C 6 H 5 O 7 3 > C 4 H 4 O 6 2 > SO 4 2 . On the other hand, the ion charge effect on the reduction of the water volume around the anions (electrostriction) followed the sequence: C 6 H 5 O 7 3 > SO 4 2 >   C 4 H 4 O 6 2 . The electrostriction volume comprises the water molecules immobilized on the hydration shell. The electrical charge around the water molecules affects themselves [28]. Both reductions in volume ( V el 1 and V el 2 ) were related to the water structuring by the anion charge. Therefore, they must be considered when evaluating the effect of ion exclusion on the liquid–liquid phase separation phenomenon. Furthermore, the electrostriction volumes induce the liquid–liquid phase separation by the TX114 aggregation. The immobilization and orientation of the water molecules due to the electrical charge of the anions promote this effect.
The water structuring around the C 6 H 5 O 7 3 , SO 4 2 , and C 4 H 4 O 6 2 anions was supported by the parameters Δ G neut , Δ G el 12 , V hyd , V el 2 , and V el 1 and described the phase separation in the aqueous biphasic systems. Sadeghi and Jahani [45] highlighted the importance of the structuring water around anions and polymers, and the exclusion effect. The authors reported the phase-split arising from the ion–water and polymer–water interactions, being favorable in contrast to the polymer–ion interactions. Furthermore, these interactions mutually exclude the hydrated polymer molecules and hydrated ions, splitting the systems into a polymer-rich and a salt-rich phase.

4. Conclusions

The phase separation in the systems containing the anionic surfactant Triton X-114 increased as a function of the temperature and anions, according to the following sequence: C 6 H 5 O 7 3 > SO 4 2 >   C 4 H 4 O 6 2 . The Gibbs free energies of micellization were all negative by following the previous sequence with the absolute values. The sequence was supported by the parameters attributed to the structuring of the water molecules, such as the Gibbs free energy of hydration, Gibbs free energy of electrostriction, electrostriction volume on the hydration shell, and electrostriction volume in the water surrounding that shell. The water structured around the anions induced a greater exclusion effect on the surfactant micelles. The entropic contribution for the Gibbs free energy of micellization was lower for the SO 4 2 and C 6 H 5 O 7 3 , compared to the   C 4 H 4 O 6 2 , due to its weaker solvation. The partition coefficients and Gibbs free energies of micellization followed an almost linear behavior as a salt molar fraction functioned in the system.

Supplementary Materials

The following supporting information can be downloaded at: https://www.mdpi.com/article/10.3390/pr10102023/s1, Table S1: Coefficients from binodal curves for the salt rich-phase; Table S2: Coefficients from binodal curves for the Triton X-114® rich-phase; Table S3: Thickness of immobilized water spherical shell surrounding the ion and effective radius of anions; Table S4: Molar fractions of the tie lines for the system citrate + triton X-114® + water at 293.2 K; Table S5: Molar fractions of the tie lines for the system citrate + triton X-114® + water at 303.2 K; Table S6: Molar fractions of the tie lines for the system sulfate + triton X-114® + water at 283.2 K; Table S7: Molar fractions of the tie lines for the system sulfate + triton X-114® + water at 293.2 K; Table S8: Molar fractions of the tie lines for the system sulfate + triton X-114® + water at 303.2 K; Table S9: Molar fractions of the tie lines for the system tartrate + triton X-114® + water at 283.2 K; Table S10: Molar fractions of the tie lines for the system tartrate + triton X-114® + water at 293.2 K; Table S11: Molar fractions of the tie lines for the system tartrate + triton X-114® + water at 303.2 K; Table S12: Thickness of immobilized water spherical shell surrounding the ion and effective radius of anions.

Author Contributions

Conceptualization, R.C.B. and O.A.Q.J.; methodology, O.A.Q.J., B.R.d.S. and A.C.M.; software, O.A.Q.J.; validation, O.A.Q.J., B.R.d.S. and A.C.M.; formal analysis, R.C.B.; investigation, O.A.Q.J.; resources, R.C.B.; data curation, O.A.Q.J.; writing—original draft preparation, E.G.M.-J.; writing—review and editing, J.M.C. and R.C.B.; visualization, E.G.M.-J.; supervision, R.C.B.; project administration, R.C.B.; funding acquisition, R.C.B. All authors have read and agreed to the published version of the manuscript.

Funding

This research was funded by Fundação de Amparo à Pesquisa do Estado de Minas Gerais—FAPEMIG, grant number TEC-APQ-01412-16; Conselho Nacional de Desenvolvimento Científico e Tecnológico—CNPq, grant number 420355/2016-2; Coordenação de Aperfeiçoamento de Pessoal de Nível Superior—CAPES, [finance code 001]; Partnerships Program for Education and Training (PAEC) between the Organization of American States (OEA) and the Coimbra Group of Brazilian Universities (GCUB), grant number 001/2016—Otto Alberto Quispe Jimenez master’s degree scholarship; Conselho Nacional de Desenvolvimento Científico e Tecnológico—CNPq, grant number PIBIT/CNPq–13/2018–Bruno Rossetti de Souza—undergraduate scholarship.

Data Availability Statement

Not applicable.

Conflicts of Interest

The authors declare no conflict of interest.

References

  1. Chakraborty, A.; Sen, K. Phase separation in aqueous systems for realizing virtually significant extractions. RSC Adv. 2014, 4, 64328–64335. [Google Scholar] [CrossRef]
  2. Kepka, C.; Rhodin, J.; Lemmens, R.; Tjerneld, F.; Gustavsson, P.-E. Extraction of plasmid DNA from Escherichia coli cell lysate in a thermoseparating aqueous two-phase system. J. Chromatogr. A 2004, 1024, 95–104. [Google Scholar] [CrossRef] [PubMed]
  3. Rocha, M.V.; Nerli, B.B. Molecular features determining different partitioning patterns of papain and bromelain in aqueous two-phase systems. Int. J. Biol. Macromol. 2013, 61, 204–211. [Google Scholar] [CrossRef] [PubMed]
  4. Wang, L.; Li, W.; Liu, Y.; Zhi, W.; Han, J.; Wang, Y.; Ni, L. Green separation of bromelain in food sample with high retention of enzyme activity using recyclable aqueous two-phase system containing a new synthesized thermo-responsive copolymer and salt. Food Chem. 2019, 282, 48–57. [Google Scholar] [CrossRef] [PubMed]
  5. Chow, Y.H.; Yap, Y.J.; Tan, C.P.; Anuar, M.S.; Tejo, B.A.; Show, P.L.; Ariff, A.B.; Ng, E.-P.; Ling, T.C. Characterization of bovine serum albumin partitioning behaviors in polymer-salt aqueous two-phase systems. J. Biosci. Bioeng. 2015, 120, 85–90. [Google Scholar] [CrossRef] [PubMed]
  6. Ghaffari, S.; Rahbar Shahrouzi, J.; Towfighi, F.; Baradar Khoshfetrat, A. Partitioning of cefazolin in aqueous two-phase systems containing poly (ethylene glycol) and sodium salts (citrate, tartrate, and sulphate). Fluid Ph. Equilibria 2019, 488, 54–61. [Google Scholar] [CrossRef]
  7. Junqueira, C.M.; da Silva Cabral, D.; Penido, J.A.; Mageste, A.B.; Virtuoso, L.S. How does the use of surfactants in polymer-salt based aqueous two-phase systems affect the annatto dye (Bixa orellana L.) partitioning? Fluid Ph. Equilibria 2018, 478, 14–22. [Google Scholar] [CrossRef]
  8. Teng, H.; Wang, X.; Hou, Y.; Chen, Y.; Yang, C.; Shen, T. Properties and Extraction for [Ni(NH3)6]2+ of ATPS-a Formed by Aqueous Cationic–Anionic Surfactant Mixtures. J. Dispers. Sci. Technol. 2016, 37, 830–835. [Google Scholar] [CrossRef]
  9. Kastelic, M.; Vlachy, V. Theory for the Liquid–Liquid Phase Separation in Aqueous Antibody Solutions. J. Phys. Chem. B 2018, 122, 5400–5408. [Google Scholar] [CrossRef]
  10. Hinze, W.L.; Pramauro, E. A Critical Review of Surfactant-Mediated Phase Separations (Cloud-Point Extractions): Theory and Applications. Crit. Rev. Anal. Chem. 1993, 24, 133–177. [Google Scholar] [CrossRef]
  11. Malpiedi, L.P.; Nerli, B.B.; Abdala, D.S.P.; Pessôa-Filho, P.d.A.; Pessoa, A. Aqueous micellar systems containing Triton X-114 and Pichia pastoris fermentation supernatant: A novel alternative for single chain-antibody fragment purification. Sep. Purif. Technol. 2014, 132, 295–301. [Google Scholar] [CrossRef]
  12. Teodorowicz, M.; Perdijk, O.; Verhoek, I.; Govers, C.; Savelkoul, H.F.J.; Tang, Y.; Wichers, H.; Broersen, K. Optimized Triton X-114 assisted lipopolysaccharide (LPS) removal method reveals the immunomodulatory effect of food proteins. PLoS ONE 2017, 12, e0173778. [Google Scholar] [CrossRef] [PubMed] [Green Version]
  13. Zhang, J.; Zhu, C.; Fan, D.; Ma, X.; Mi, Y.; Xue, W. A Two-Step Protocol to Remove Endotoxins from Human-Like Collagen. Sep. Sci. Technol. 2015, 50, 993–1001. [Google Scholar] [CrossRef]
  14. Duarte, A.W.F.; Lopes, A.M.; Molino, J.V.D.; Pessoa, A.; Sette, L.D. Liquid–liquid extraction of lipase produced by psychrotrophic yeast Leucosporidium scottii L117 using aqueous two-phase systems. Sep. Purif. Technol. 2015, 156, 215–225. [Google Scholar] [CrossRef] [Green Version]
  15. Szymczyk, K.; Taraba, A. Aggregation behavior of Triton X-114 and Tween 80 at various temperatures and concentrations studied by density and viscosity measurements. J. Therm. Anal. Calorim. 2016, 126, 315–326. [Google Scholar] [CrossRef] [Green Version]
  16. Cordisco, E.; Haidar, C.N.; Goñi, R.; Nerli, B.B.; Malpiedi, L.P. Physicochemical characterization of aqueous micellar systems formed by environmentally friendly salts. Fluid Ph. Equilibria 2015, 393, 111–116. [Google Scholar] [CrossRef]
  17. Ritter, E.; Racheva, R.; Storm, S.; Müller, S.; Ingram, T.; Smirnova, I. Influence of Inorganic Salts on the Phase Equilibrium of Triton X-114 Aqueous Two-Phase Systems. J. Chem. Eng. Data 2016, 61, 1496–1501. [Google Scholar] [CrossRef]
  18. Sayem Alam, M.; Mandal, A.B. The clouding phenomena of mixed surfactant (non-ionic Triton X-114+cationic gemini 16-5-16) solutions: Influence of inorganic and organic additives on the cloud point. J. Mol. Liq. 2015, 212, 237–244. [Google Scholar] [CrossRef]
  19. Mohammad, S.; Held, C.; Altuntepe, E.; Köse, T.; Sadowski, G. Influence of Salts on the Partitioning of 5-Hydroxymethylfurfural in Water/MIBK. J. Phys. Chem. B 2016, 120, 3797–3808. [Google Scholar] [CrossRef]
  20. Xie, X.; Han, J.; Zhang, Q.; Rao, W.; Wang, Y.; Wu, J.; Ni, L. Cloud point behavior of thermosensitive triblock copolymer L61 in the presence of electrolytes. J. Dispers. Sci. Technol. 2017, 38, 494–497. [Google Scholar] [CrossRef]
  21. Koga, Y. Chapter VIII-The Effects of Salts on the Molecular Organization of H2O: 1-Propanol (1P)-Probing Methodology. In Solution Thermodynamics and its Application to Aqueous Solutions; Koga, Y., Ed.; Elsevier: Amsterdam, The Netherlands, 2007; pp. 205–239. [Google Scholar]
  22. Sun, P.; Huang, K.; Liu, H. Specific Salt Effect on the Interaction between Rare Earth Ions and Trioctylphosphine Oxide Molecules at the Organic–Aqueous Two-Phase Interface: Experiments and Molecular Dynamics Simulations. Langmuir 2018, 34, 11374–11383. [Google Scholar] [CrossRef] [PubMed]
  23. Merchuk, J.C.; Andrews, B.A.; Asenjo, J.A. Aqueous two-phase systems for protein separation: Studies on phase inversion. J. Chromatogr. B Biomed. Appl. 1998, 711, 285–293. [Google Scholar] [CrossRef]
  24. Corkill, J.M.; Goodman, J.F.; Harrold, S.P. Thermodynamics of micellization of non-ionic detergents. Trans. Faraday Soc. 1964, 60, 202–207. [Google Scholar] [CrossRef]
  25. Zana, R. Critical Micellization Concentration of Surfactants in Aqueous Solution and Free Energy of Micellization. Langmuir 1996, 12, 1208–1211. [Google Scholar] [CrossRef]
  26. Sadeghi, R.; Jamehbozorg, B. The salting-out effect and phase separation in aqueous solutions of sodium phosphate salts and poly(propylene glycol). Fluid Ph. Equilibria 2009, 280, 68–75. [Google Scholar] [CrossRef]
  27. Ebrahimi, N.; Sadeghi, R.; Ameen, B.A.H. Thermodynamics of clouding process in 1-butanol + water mixtures in the presence and absence of sugars. J. Mol. Liq. 2019, 278, 164–174. [Google Scholar] [CrossRef]
  28. Marcus, Y. Thermodynamics of ion hydration and its interpretation in terms of a common model. Pure AppI. Chem. 1987, 59, 1093–1101. [Google Scholar] [CrossRef] [Green Version]
  29. Marcus, Y. Thermodynamics of solvation of ions. Part 6.—The standard partial molar volumes of aqueous ions at 298.15 K. J. Chem. Soc. Faraday Trans. 1993, 89, 713–718. [Google Scholar] [CrossRef]
  30. Apelblat, A.; Manzurola, E. Apparent molar volumes of organic acids and salts in water at 298.15 K. Fluid Ph. Equilibria 1990, 60, 157–171. [Google Scholar] [CrossRef]
  31. Clegg, S.L.; Wexler, A.S. Densities and Apparent Molar Volumes of Atmospherically Important Electrolyte Solutions. 1. The Solutes H2SO4, HNO3, HCl, Na2SO4, NaNO3, NaCl, (NH4)2SO4, NH4NO3, and NH4Cl from 0 to 50 °C, Including Extrapolations to Very Low Temperature and to the Pure Liquid State, and NaHSO4, NaOH, and NH3 at 25 °C. J. Phys. Chem. A 2011, 115, 3393–3460. [Google Scholar] [CrossRef]
  32. Marcus, Y. Thermodynamics of solvation of ions. Part 5.—Gibbs free energy of hydration at 298.15 K. J. Chem. Soc. Faraday Trans. 1991, 87, 2995–2999. [Google Scholar] [CrossRef]
  33. Carale, T.R.; Pham, Q.T.; Blankschtein, D. Salt effects on intramicellar interactions and micellization of nonionic surfactants in aqueous solutions. Langmuir 1994, 10, 109–121. [Google Scholar] [CrossRef]
  34. Aravopoulou, D.; Kyriakos, K.; Miasnikova, A.; Laschewsky, A.; Papadakis, C.M.; Kyritsis, A. Comparative Investigation of the Thermoresponsive Behavior of Two Diblock Copolymers Comprising PNIPAM and PMDEGA Blocks. J. Phys. Chem. B 2018, 122, 2655–2668. [Google Scholar] [CrossRef] [PubMed]
  35. Cai, Y.; Han, J.; Wang, Y.; Wang, L.; Li, C.; Mao, Y.; Ni, L.; Zhang, W. The Cloud Point Behaviors and the Liquid–Liquid Equilibrium of L31—Inorganic Sodium Salt Aqueous Two-Phase Systems. J. Dispers. Sci. Technol. 2019, 40, 777–783. [Google Scholar] [CrossRef]
  36. Ananthapadmanabhan, K.P.; Goddard, E.D. Aqueous biphase formation in polyethylene oxide-inorganic salt systems. Langmuir 1987, 3, 25–31. [Google Scholar] [CrossRef]
  37. Stubicar, N.; Petres, J.J. Micelle formation by tritons in aqueous solutions. Croat. Chem. Acta 1981, 255–266. [Google Scholar]
  38. Patil, S.; Rakshit, A.; Sharma, K.; Rohit, K.; Rana, A. Physicochemical Studies of Nonionic Surfactants, C12E12 and C12E15: Effect of pH and NaCl. J. Surf. Sci. Technol. 2004, 20, 87. [Google Scholar]
  39. Rosen, M.J. Surfactant and Interfacial Phenomena, 2nd ed.; John Willey & Sons Inc.: New York, NY, USA, 1989. [Google Scholar]
  40. Burakowski, A.; Gliński, J.; Riederer, M. Hydration of polyethylene glycol monododecyl ethers (C12Ei, for i = 6 and 10) in their diluted aqueous solutions. J. Mol. Liq. 2019, 276, 179–183. [Google Scholar] [CrossRef]
  41. Nucci, N.V.; Vanderkooi, J.M. Effects of salts of the Hofmeister series on the hydrogen bond network of water. J. Mol. Liq. 2008, 143, 160–170. [Google Scholar] [CrossRef] [Green Version]
  42. Rogers, R.D.; Bauer, C.B. Partitioning behavior of group 1 and 2 cations in poly(ethylene glycol)-based aqueous biphasic systems. J. Chromatogr. B Biomed. Appl. 1996, 680, 237–241. [Google Scholar] [CrossRef]
  43. Zafarani-Moattar, M.T.; Hamzehzadeh, S. Effect of pH on the phase separation in the ternary aqueous system containing the hydrophilic ionic liquid 1-butyl-3-methylimidazolium bromide and the kosmotropic salt potassium citrate at T = 298.15K. Fluid Ph. Equilibria 2011, 304, 110–120. [Google Scholar] [CrossRef]
  44. Hooshyar, H.; Sadeghi, R. Influence of sodium salts on the micellization and interfacial behavior of cationic surfactant dodecyltrimethylammonium bromide in aqueous solution. J. Chem. Eng. Data 2015, 60, 983–992. [Google Scholar] [CrossRef]
  45. Sadeghi, R.; Jahani, F. Salting-In and Salting-Out of Water-Soluble Polymers in Aqueous Salt Solutions. J. Phys. Chem. B 2012, 116, 5234–5241. [Google Scholar] [CrossRef] [PubMed]
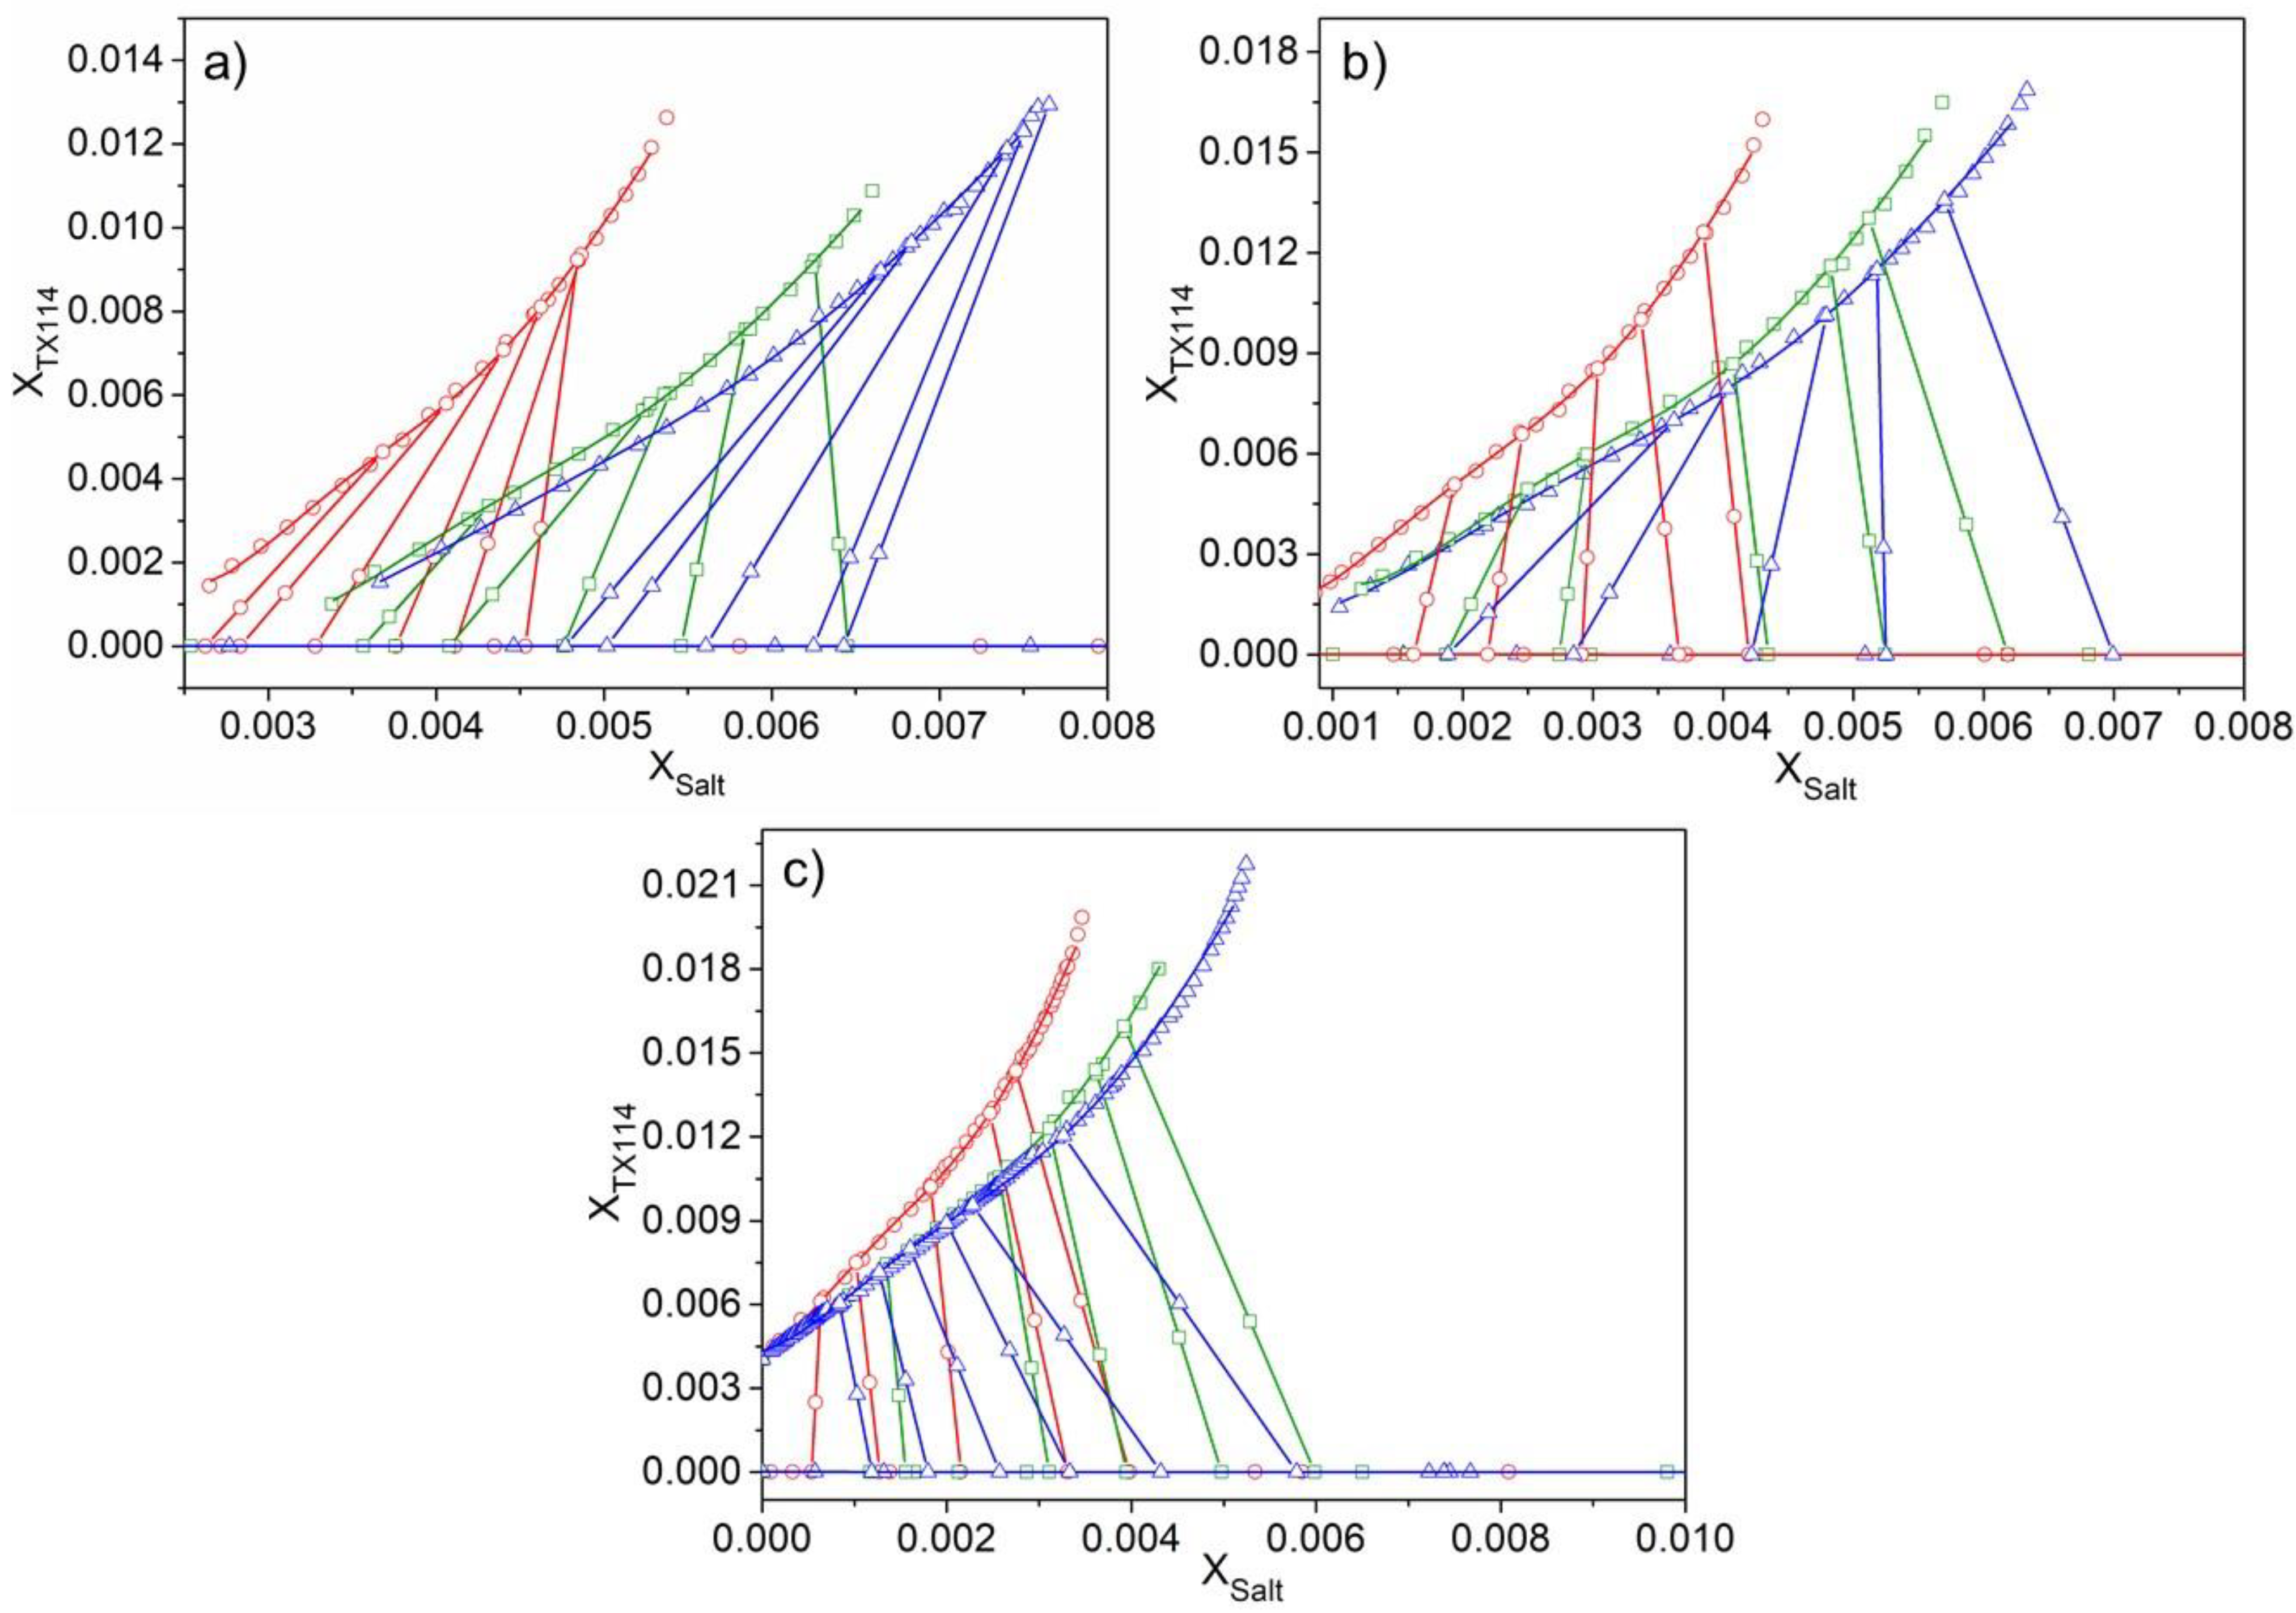
Figure 1. Experimental and calculated binodal curves and tie lines of systems containing TX114 + water + sodium citrate (-o-) or sodium sulfate (-□-) or sodium tartrate (--): (a) 283.2 K, (b) 293.2 K, (c) 303.2 K.
Processes 10 02023 g001
Figure 2. Partition coefficients versus salt molar fraction in OC for the systems containing sodium citrate at 283.2 K (o) 293.2 K (●), and 303.2 K (⊕); sodium sulfate at 283.2 K (□), 293.2 K (■), and 303.2 K (⊞) and sodium tartrate at 283.2 K (△), 293.2 K (▲), and 303.2 K (⏃).
Processes 10 02023 g002
Figure 3. Gibbs free energy of micellization ( kJ   mol 1 ) as salt molar fraction ( X salt ) function in the systems containing sodium citrate at 283.2 K (o), 293.2 K (●), and 303.2 K (⊕); sodium sulfate at 283.2 K (□), 293.2 K (■), and 303.2 K (⊞) and sodium tartrate at 283.2 K (△), 293.2 K (▲), and 303.2 K (⏃).
Processes 10 02023 g003
Figure 4. Entropic contribution (ξ) versus salt molar fraction in OC for the system containing sodium citrate at 283.2 K (o), 293.2 K (●), and 303.2 K (⊕); sodium sulfate at 283.2 K (□), 293.2 K (■), and 303.2 K (⊞) and sodium tartrate at 283.2 K (△), 293.2 K (▲), and 303.2 K (⏃).
Processes 10 02023 g004
Table 1. Gibbs free energy of hydration ( Δ G hyd ), Gibbs free energy of neutral interactions between anions and water ( Δ G neu ), Gibbs free energy of electrostatic interaction in hydration shell and in water shell around itself ( Δ G el 12 ), and nonsymmetrical Gibbs free energy ( Δ G uns ).
Anion Δ G hyd   ( kJ   mol 1 ) Δ G el 12   ( kJ   mol 1 ) Δ G neu ( kJ   mol 1 ) Δ G uns ( kJ   mol 1 )
SO 4 2 −1110.54−967.6591.07−233.96
C 6 H 5 O 7 3 −2645.28−1781.49126.51−990.30
  C 4 H 4 O 6 2 −1007.53−846.60115.35−276.27
Table 2. Volume of hydration anion (Vhyd), volume of electrostriction on hydration shell (Vel1), and volume of water shell around itself (Vel2).
Anion V hyd   ( cm 3   mol 1 ) V el 1   ( cm 3 mol 1 ) V el 2   ( cm 3 mol 1 )
SO 4 2 56.1−15.8−65.3
C 6 H 5 O 7 3 95.4−15.9−123.1
  C 4 H 4 O 6 2 76.7−9.2−58.9
Publisher’s Note: MDPI stays neutral with regard to jurisdictional claims in published maps and institutional affiliations.