
Changing Ready-to-Drink Coffee Aroma Using Dielectric Barrier Discharge Plasma

1
Departamento de Tecnologia de Alimentos, Universidade Federal do Ceará, Fortaleza 60440-900, CE, Brazil
2
Departamento de Engenharia Química, Universidade Federal do Ceará, Fortaleza 60440-900, CE, Brazil
*
Author to whom correspondence should be addressed.
Processes 2022, 10(10), 2056; https://doi.org/10.3390/pr10102056
Submission received: 30 September 2022
/
Revised: 8 October 2022
/
Accepted: 9 October 2022
/
Published: 11 October 2022
(This article belongs to the Special Issue Progress in Food Processing)
Abstract
:Coffee is one of the world’s most consumed beverages, and its aroma plays an essential role in consumer acceptance. Ready-to-drink coffee is popular in many countries and can be bought with different flavoring agents. In this work, we evaluated the changes that can be made to ready-to-drink coffee by applying cold plasma to convert coffee volatiles, modulating its aroma chemically. To achieve this goal, dielectric-barrier discharge (DBD) plasma was applied to ready-to-drink coffee at different excitation frequencies and processing times. Several chemical reactions were observed, and their routes were proposed. DBD plasma technology increased the relevance of the desirable nutty descriptor from 2.9 to 27.7%. The technology can also increase the significance of the fruity and green descriptors, which can be modulated to produce specialty or gourmet ready-to-drink coffees.
1. Introduction
Coffee is one of the most consumed beverages in the world. Its consumption is comprised of roasted, instant, and ready-to-drink coffees. Ready-to-drink (RTD) coffee is a packaged beverage sold in a prepared form and ready for consumption.
The market for RTD coffee has been growing and is driven by consumers that want convenience, new flavor experiences, and healthier beverages. According to market research [1], RTD coffee is growing by 7.6% per year in North America, Europe, and Asia.
The RTD coffee market has primarily focused on consumers that want to substitute carbonated drinks for healthy intakes. Compared to carbonated drinks, RTD coffee contains several phenolics, antioxidants, vitamins, and minerals in addition to caffeine [2]. RTD coffee is a good source of instant energy and wellness, becoming popular among middle-aged workers and youngsters. This latter group also drinks RTD coffee as a quick energy supplement after intense physical activities.
Although some RTD coffee customers are from groups seeking quick energy, most customers are interested in new sensory perceptions and desire a good coffee experience. A significant portion of customers seek different flavors and tones but without additives. Coffee flavor varies considerably due to several factors such as variety, origin, maturation of the cherry, storage conditions, drying conditions, fermentation, climatic conditions, processing, and preparation methods [3]. Flavors vary from nutty, chocolaty, fruity, cocoa-like, spice-toned, floral, citrusy, and other descriptors. The processing and preparation methods play an essential role in the nutty, chocolaty, roasted, and cocoa-like descriptors, which can be controlled. However, other flavor characteristics depend on the origin, variety, maturation of the cherry, storage conditions, drying conditions, fermentation, and climatic conditions [4]. The last one cannot be controlled and may change significantly annually.
RTD coffee producers have difficulty with quality control and delivering engineered experiences to their customers, mainly if no additives are employed to alter the coffee flavor. The aroma of RTD coffee is attributed to several volatile compounds including pyridine, pyrazines, pyrroles, furans, ketones, esters, alcohols, aldehydes, and other minor compounds. Pyrazines, pyrroles, and pyridines are responsible for the desired coffee attributes such as cocoa, nutty, and roasted notes [5]. Alcohols, aldehydes, esters, and furans are responsible for undesired attributes such as earthy, fruity, and green notes.
Attempts to control coffee flavor have been conducted overtime. For instance, introducing microbial starter culture under controlled fermentation has improved the overall coffee quality and flavor [6]. However, this approach resulted in limited changes in the aroma profile and was very dependent on a proper selection of the starter culture [7]. Controlling roasting improves the coffee flavor, but this approach only tends to increase furans, pyridines, pyrazines, and pyrroles that give coffee its cocoa, burnt, and nutty notes [8].
Previous studies from our group [9,10,11,12] showed that cold plasma technology could change the chemistry of aroma compounds in camu-camu juice [9] and orange juice [10] as well as many bioactive compounds in cashew-apple juice [13], avocado puree [14], and other products. The technology was proven to work satisfactorily in modulating the aroma of juices based on terpenoids and sesquiterpenoid compounds. Plasma processing allows hydrolysis, isomerization, dehydrogenation, scission, hydrogenation, ring-opening, and ring-closure reactions, which can be controlled by the proper setting of plasma processing conditions [9]. Plasma-induced reactions are similar to the naturally occurring responses in plants because they rely on free radicals and ions that are naturally produced during normal or stress-driven metabolism.
In this work, we evaluated the use of cold plasma technology in inducing chemical modifications in RTD coffee to change its aroma and produce different sensory experiences for customers. Dielectric-barrier discharge plasma was applied to hot brewed coffee at different excitation frequencies. The chemical profile of the ready-to-drink coffee aroma was assessed by gas chromatography coupled with the mass spectrum, and the aroma profile was evaluated using the odor activity value. The proposed chemical modifications are presented, and the probable chemical reactions postulated.
2. Materials and Methods
2.1. Materials
Coffee grains (Melitta, Brazil), arabica variety, were purchased for this study. Ribitol (internal standard) was purchased from Merck.
2.2. Ready-to-Drink Coffee Preparation
Coffee grains were ground for 20 s in a coffee grinder (Cuisinart, Stamford, CT, USA), obtaining a powdered coffee. The ready-to-drink coffee (RTD coffee) was produced by the immersion of 5 g of coffee powder into 20 mL of distilled water at 90 °C using a French press system. After 5 min of immersion, the coffee was filtered [15]. The beverage was chilled for 30 min at 12 °C and subjected to plasma processing.
2.3. Plasma Treatment
Plasma was formed between two aluminum electrodes (80 mm diameter) separated by acrylic plates 15 mm apart. An electrical plasma generator (Inergiae model Pulse 0300) applied a 20 kV electrical potential difference between the electrodes generating plasma. The excitation frequencies of the source were set at 50, 500, and 1000 Hz. The treatment was carried out for 15 and 30 min. The ready-to-drink coffee (40 mL) was placed in acrylic Petri dishes and subjected to plasma treatment. The control sample consisted of untreated ready-to-drink coffee. All experiments were conducted in triplicate.
2.4. GC-MS Analysis
The gas-chromatography coupled to mass spectrum (GC-MS) analysis followed the procedure described by Rodrigues and Fernandes [10]. A sample of 5.0 mL of ready-to-drink coffee was added to a 20 mL vial and equilibrated at 40 °C for 20 min. The aroma volatiles was extracted by applying solid-phase microextraction (SPME). Full details on the chromatographical method are described in Rodrigues and Fernandes [10]. The mass spectra were compared with the National Institute of Standards and Technology (NIST) and Wiley Mass Spectra Library.
2.5. Aroma Profile
The aroma profile of the ready-to-drink coffee was assessed using instrumental analysis (GC-MS profiling) and odor activity value (OAV), following the method described by Rodrigues and Fernandes [10]. The OAV was calculated by dividing each substance’s mass fraction by its odor threshold in water [16]. The water odor threshold values were obtained in the literature [17,18,19,20,21,22,23,24]. The volatiles was grouped according to their primary odor description. The radar plots presented the five most important odor descriptors (cocoa, nutty, green, fruity, and meaty).
2.6. Statistical Analysis
Statistical analysis was conducted using Statistica v.13 (Tbico Software). The Fisher LSD test was used at a 95% confidence level for a mean comparison.
3. Results and Discussion
3.1. Volatile Profile
Table 1 presents the ready-to-drink coffee volatile compounds observed in the chromatographic analysis, their respective retention times (RT), Kovats index, odor threshold, and odor description. Twenty-four compounds were identified in the control and processed samples.
Table 2 presents the ready-to-drink coffee volatile compound profile for the control sample and samples subjected to DBD plasma. The studied operating conditions significantly modified the concentration of the volatile compounds (p < 0.05) compared to the control sample (untreated RTD-coffee).
The product is characterized by a complex mixture of furan, pyrazines, aldehydes, alcohols, pyridines, pyrroles, and other oxygenated and nitrogenated compounds. The main volatile compounds found in the RTD coffee were 2-methylbutanal and 3-methylbutanal (21.2% w/w), 2-methylfuran (13.4% w/w), pyridine (12.9% w/w), 2-furan methanol acetate (11.2% w/w), and 2,5-dimethylfuran (9.4% w/w). Other compounds were present in lesser amounts.
The volatile profile of brewed coffees differs considerably in the literature regarding the concentration (or mass fraction) of each compound; however, many furans, pyrazines, aldehydes, ketones, pyrroles, and pyridines are usually present. Compared to Colombian arabica coffee, the coffee used in this work presented higher amounts of 2-methylbutanal, 3-methylbutanal, and pyridine; similar quantities of 2-furan methanol acetate and 2,5-dimethylfuran; and lower amounts of furfural [15]. Compared to another Brazilian arabica coffee, the coffee used in this work presented higher amounts of 2-methylbutanal, 3-methylbutanal, 2-furan methanol acetate, and 2,5-dimethylfuran, similar amounts of pyridine, and lower amounts of 3-furan methanol, 5-methylfuran aldehyde, and 2-ethyl-3-methylpyrazine [25].
A heat map illustrating the changes in the mass fraction of volatile components with the untreated RTD coffee as a basis for comparison is presented in Figure 1. The darker colors indicate changes above 50% in the components’ mass fraction, and lighter colors indicted changes below 25%.
The changes observed in the molecular composition varied according to the applied processing time and excitation frequency. Overall, the concentration of alcohols and aldehydes decreased from 26.2% to 5.7% when low excitation frequency (50 Hz) and 10.6% when medium and high excitation frequencies were applied. The contribution of alcohols and aldehydes to the volatile composition and aroma activity value is low in coffee, and these changes do not represent a significant difference (p < 0.05).
The contents of furans increased after plasma treatment from 48.1% to 69.9% at 50 Hz and 30 min of processing, while a lower increase was observed in other operating conditions. An increase in the total pyrrole concentration was observed in the first 15 min of processing, decreasing to a lower level than its initial concentration after 30 min of treatment. The changes in pyridines and pyrazines were not very significant. The exception was the concentration of pyrazines processed at 500 Hz for 30 min, which increased to its higher value (22.9%). The increase in furans and the decrease in pyrazines after 30 min may be related to the accumulation of reactive oxygen species and higher levels of the oxidation of compounds during extended treatment. To better understand the changes in the volatile chemical profile, their main classes of chemicals (aldehydes, alcohols, furans, pyrazines, and pyrroles) will be discussed separately.
The concentration of 2-methylbutanal and 3-methylbutanal presented the highest percentual decrease (between 44 and 87%), while hexanal presented a slightly lower reduction (between 13 and 56%). The concentration of alcohols increased in the first 15 min of processing, with the highest mass increase observed for 1,5-hexadien-3-ol, followed by 2-nonen-1-ol and 2-decen-1-ol. The decrease in aldehydes was more significant at a 50 Hz excitation frequency than at 500 and 1000 Hz. The higher decay rate at 50 Hz may indicate that these aldehydes have reacted with hydroxyl, hydronium, or hydrogen radicals, forming their respective alcohol (hexanol, 2-methyl butanol, and 3-methylbutanol) or hydrocarbon (hexane, 2-methylbutane, and 3-methylbutane). None of these products were observed in the chromatographical analysis, most probably due to their high volatility, which may cause the volatilization of these compounds during plasma treatment. The alcohols in the volatile profile were all alcohols with longer chain lengths and thus less volatile. Their presence in the volatile profile may indicate a chemical-induced degradation of coffee fatty acids (palmitic, stearic, oleic, and linoleic), ultimately forming alcohols or aldehydes between six and 10 carbons. These substances are typical green leaf volatiles (GLVs) naturally formed in fruits [26]. The formation of aldehydes and alcohols during plasma treatment may have been caused by the induction of the LOX enzymatic route or by direct oxidation of fatty acids by the reactive oxygen species.
The major furan in the untreated ready-to-drink coffee was 2-methylfuran, which presented a significant decrease during the first 15 min of processing and increased after 30 min of processing. This behavior is evidence that the initial content of 2-methylfuran participates in more than one chemical reaction. Figure 2 shows the proposed chemical pathways for the changes observed in the furan compounds.
The contents of 2-furan methanol acetate showed a significant decrease from 11.2% to 2.8% during plasma processing. The decrease occurred in all excitation frequencies, evidencing that any specific operating condition does not favor scission reactions. The intermediate species, furfuryl methyl ether, was converted mainly to 2-furan methanol. No trend was observed with the other two furans with linear hydrocarbon side chains, 2,5-dimethyl furan and 2-pentyl furan.
The contents of 2-furan methanol, furfural, and 2-furan methanol acetate presented the highest increase in mass basis. The concentration of furfural increased up to 96%, and the concentration of 2-furan methanol increased to 705%. Furfural showed the highest increase at 1000 Hz, while the highest increase in 2-furan methanol was observed at 50 Hz. This difference is mainly related to the reactive plasma species that lead the chemical transformation.
Furfural and 2-furan methanol are two central compounds to which many other furan compounds convert. At low excitation frequencies, the conversion of 2,5-dimethyl furan to 5-methyl-2-furaldehyde, 2-methyl furan to 2-furan methanol, and furfural to 2-furan methanol occurs to a greater extent due to the higher concentration of hydroxyl, hydronium, and hydrogen radicals [27,28]. Under all excitation frequencies, the scission of 2,2′-methylenedi furan and 1-(2-furanylmethyl)-1H-pyrrole to 2-methyl furan will occur. The scission of methylene units also took place with the conversion of 5-methyl-2-furaldehyde and furfuryl methyl ether to furfural, furfuryl methyl ether to 2-furan methanol. The bombardment of plasma species and irradiation induce C–C bond scissions, abstracting CH2 from terminal bonds and forming metastable C-radicals, which can react with compounds such as furfural, producing 2-furyl methyl ketone [29], which slightly increased at low and medium excitation frequencies (50 and 500 Hz).
An increase in the concentration of pyrazines was observed at 1000 Hz, but there was no specific trend when subjected to plasma generated at 50 Hz. The concentration of 4-methyl pyrimidine increased with the treatment time. The results observed for pyridine, pyrimidine, and pyrazines do not allow for the prediction of the chemical pathways, which leads to their formation and consumption. Further analyses are required to understand these plasma-induced reactions fully.
The effect of the excitation frequency in RTD coffee was less significant than in camu-camu and orange juice, where the excitation frequency played a substantial role in the selectivity of the chemical reactions induced by reactive plasma species [30]. Low excitation frequencies (50 to 200 Hz) tend to produce more hydrogen and hydroxyl radicals, while high frequencies (600 to 1000 Hz) produce more ozone and other reactive oxygen species [27,28].
3.2. Aroma Profile
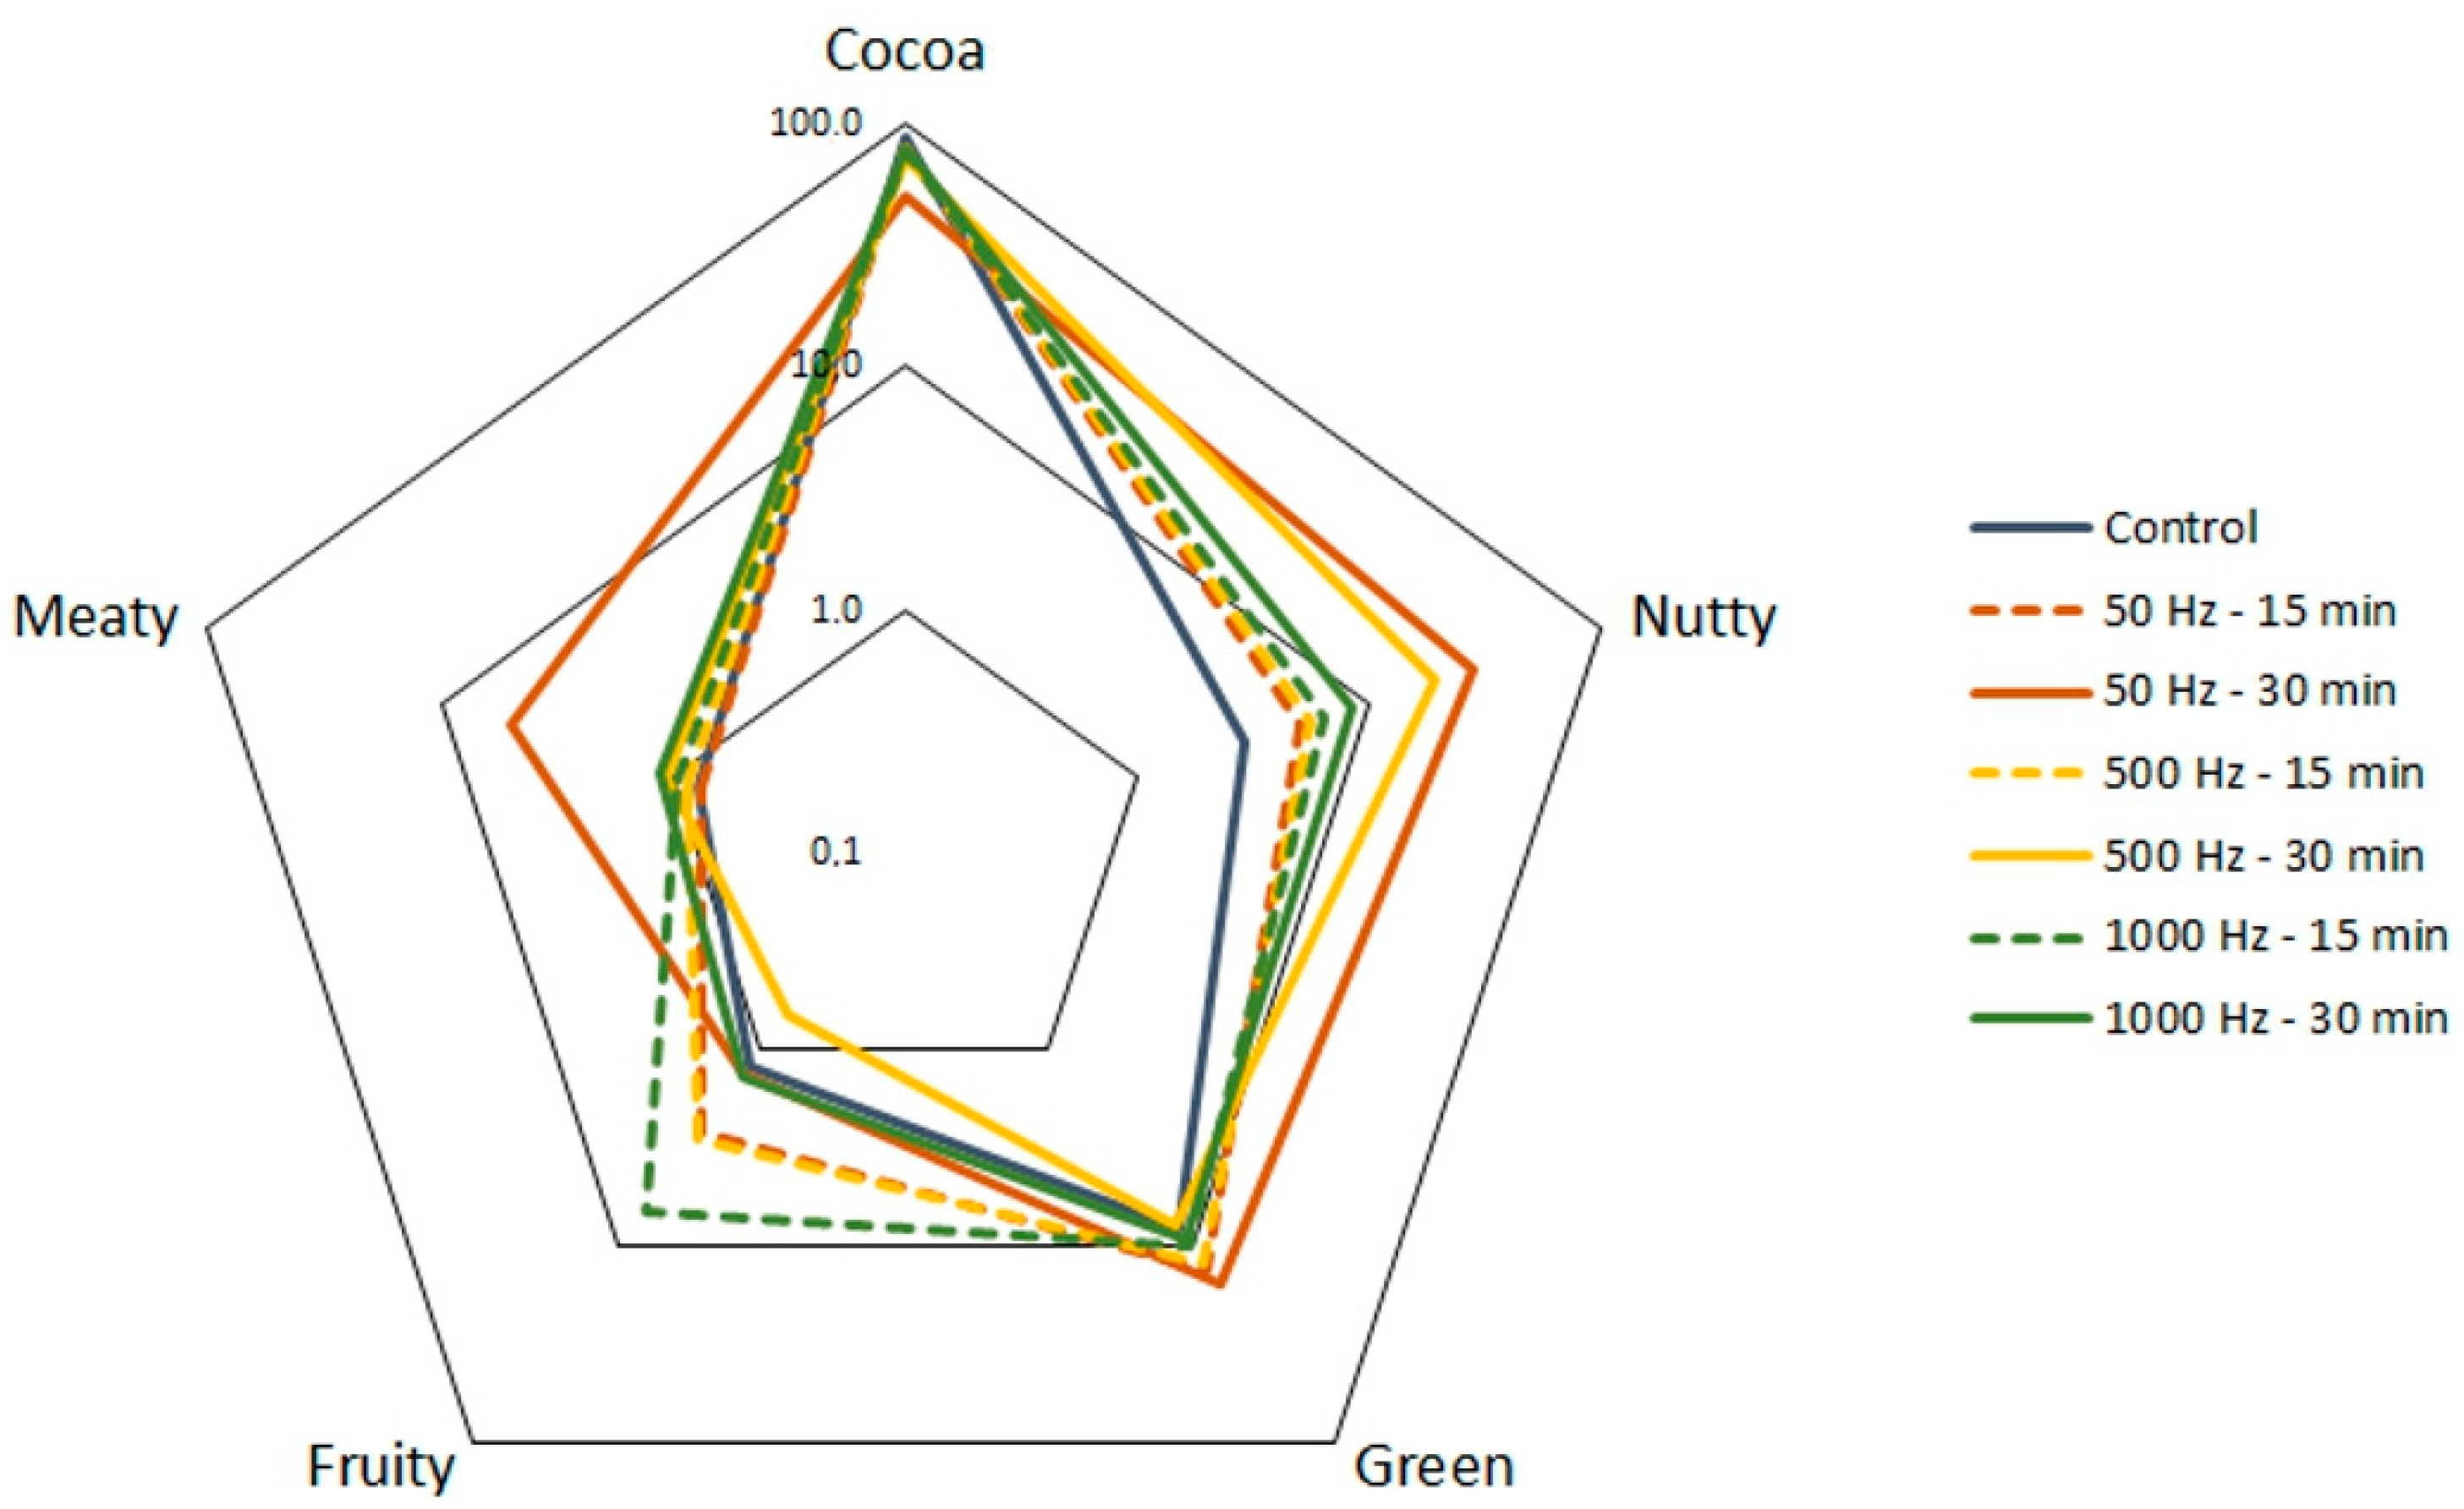
Figure 3 shows the changes in the five primary odor descriptors (cocoa, nutty, meaty, fruity, and green) of this RTD coffee. The chemical reactions induced by plasma treatment on the volatiles directly affected the aroma profile of the product, with significant changes in the strength of the nutty, meaty, fruity, and green descriptors. The changes in the cocoa descriptor did not change significantly (p < 0.05).
The aroma of the untreated RTD coffee was characterized by 86.9% cocoa, 2.9% nutty, 8.1% green, 1.2% fruity, and 0.8% meaty descriptors. The changes induced by plasma treatment increased the relevance of the nutty and fruity descriptors and significantly decreased the significance of the cocoa descriptor. Although all operating conditions changed the aroma profile, the aroma intensity decreased after plasma treatment. The total OAV decreased between 45 and 87%, indicating a significant loss of aroma intensity, which is a disadvantage of the plasma treatment.
The decrease in total OAV was mainly due to the reduction in OAV of the cocoa descriptors, caused by the decline in the contents of hexanal, 2-methylbutanal, and 3-methylbutanal. These compounds have a low odor threshold and significantly contribute to the coffee aroma.
The relevance of the cocoa descriptor decreased from 86.9% to between 49.4 and 79.6% following the decrease in 2-methylbutanal and 3-methylbutanal concentrations. The significance of the nutty descriptor significantly increased from 2.9% to between 5.0 and 27.7% (depending on the operating condition), caused by the increase in the concentration of 3-ethyl-2,5-dimethylpyrazine and 2-methylpyrazine. The increase in the nutty descriptor OAV is positive because this descriptor is highly appreciated in coffee. The range of changes in this descriptor (from 2.9 to 27.7%) gives high modulation and control potential for the DBD plasma technology.
The green descriptor OAV relevance increased from 8.1% to 15.6%, almost duplicating its relevance, depending on the operational conditions applied. Although the hexanal concentration decreased, an increase in the significance of the green descriptor was caused by a more expressive decrease in the concentration of the compounds responsible for the cocoa descriptor.
The fruity descriptor increased its relevance due to the increased contents of 2-pentyl furan and 2-furan methanol acetate. Its relevance rose from 1.2% to 6.5%. This range of modulation can be considered reasonable for the fruity descriptor since customers may expect fruity notes in coffees but not a predominance of a fruity aroma.
The meaty descriptor increased due to the increase in 2,5-dimethylfuran concentration. It is unusual to expect a meaty aroma in coffee, but it may induce a different sensorial experience. The increase in the meaty descriptor occurred only in a condition where coffee’s main aroma compounds were converted into high-threshold compounds. Thus, inferring a meaty aroma in coffee is avoidable.
The coffee in this work presented only six compounds with a very low odor threshold (<0.01 mg/L), three aldehydes, one pyrrole, and two furans. This low quantity of aromatic chemical compounds makes the modulation of aromas in coffee difficult. However, the DBD cold plasma treatment increased the relevance of the green, fruity, nutty, and meaty descriptors into reasonable ranges. Therefore, modulating the RTD coffee aroma is possible for the cocoa, nutty, green, fruity, and meaty descriptors, where different operating conditions changed the relevance of this descriptor.
This situation is similar to the changes that could be made in camu-camu and orange juice [9,10], where modulation of the three primary relevant descriptors (citrus, herbal, and woody) is possible.
An evaluation of the chemical changes induced by cold plasma and its effects on the instrumental aroma show that this technology can modulate the RTD coffee aroma, producing specialty or gourmet coffees, where different notes are highly appreciated. The increase in relevance of the nutty descriptor from 2.9% up to 27.7% is interesting because this descriptor is one of the most desirable notes in coffee, given the amount of nut-flavored coffees available in the market.
The data obtained following the procedure presented in this work can be used to modulate coffee aromas by applying statistical predictive procedures such as response surface methodology, fuzzy logic, or neural networks. The operating conditions that lead to an increase, decrease, maximum, or minimum values of a specific descriptor or a combination of two or more descriptors can be attained by the proper setting of an objective function.
The application of optimization procedures may allow for multiple modulation options such as making a coffee with the maximal nutty descriptor notes, or with minimal green descriptor notes, or with a certain equilibrium between cocoa and fruity descriptor notes, or any combination desired by the customers and producers.
Quality control may also benefit from plasma processing and statistical predictive procedures to correct the aroma of a given coffee, which may change due to changes in the maturation of the cherry, storage conditions, fermentation, or climatic conditions.
4. Conclusions
DBD plasma processing induced several chemical reactions in the compounds that characterize ready-to-drink coffee aroma. Extensive chemical modifications were observed in aldehydes and furans. Few chemical modifications were observed in the pyrroles and pyrazines. The excitation frequency significantly modulates the changes toward the C–C bond scission and oxidation reactions.
The changes induced by DBD plasma did not produce any toxic or undesired compounds that could compromise its use. Therefore, this technology was shown to be an interesting process for engineering natural aromas in ready-to-drink coffee. The technology may help quality control to maintain similar aromas between batches and create new sensory experiences for coffee consumers.
The main disadvantage of plasma processing was an overall reduction in the volatile compounds with high odor value activity, which can lead to a less pronounced aroma. The main advantage of plasma processing was increased desirable nutty notes and the possibility of giving green and fruity notes without resorting to artificial aromas. The chemical changes induced by plasma may be helpful to correct coffees with aroma defects.
Author Contributions
Conceptualization, F.A.N.F.; Formal analysis, S.R. and F.A.N.F.; Investigation, F.A.N.F.; Resources, S.R.; Writing—original draft preparation, F.A.N.F.; Writing—review and editing, S.R. and F.A.N.F. All authors have read and agreed to the published version of the manuscript.
Funding
This research was funded by the Conselho Nacional de Desenvolvimento Científico e Tecnológico (CNPq).
Data Availability Statement
Data are provided upon request.
Conflicts of Interest
The authors declare no conflict of interest.
References
- Mordor_Intelligence. Ready-to-Drink (RTD) Coffee Market—Growth, Trends, COVID-19 Impact, and Forecasts (2022–2027); Mordor: Hyderabad, India, 2022. [Google Scholar]
- Stiefel, C.; Lindemann, B.; Morlock, G.E. Non-target bioactive compound profiles of coffee roasts and preparations. Food Chem. 2022, 391, 133263. [Google Scholar] [CrossRef] [PubMed]
- Akiyama, M.; Murakami, K.; Ikeda, M.; Iwatsuki, K.; Kokubo, S.; Wada, A.; Tokuno, K.; Onishi, M.; Iwabuchi, H.; Tanaka, K. Characterization of flavor compounds released during grinding of roasted robusta coffee beans. Food Sci. Technol. Res. 2005, 11, 298–307. [Google Scholar] [CrossRef] [Green Version]
- Kumazawa, K.; Masuda, H. Investigation of the change in the flavor of a coffee drink during heat processing. J. Agric. Food Chem. 2003, 51, 2674–2678. [Google Scholar] [CrossRef] [PubMed]
- Buffo, R.A.; Cardelli-Freire, C. Coffee flavour: An overview. Flavour Fragr. J. 2004, 19, 99–104. [Google Scholar] [CrossRef]
- Mahingsapun, R.; Tantayotai, P.; Panyachanakul, T.; Samosorn, S.; Dolsophon, K.; Jiamjariyatam, R.; Lorliam, W.; Srisuk, N.; Krajangsang, S. Enhancement of Arabica coffee quality with selected potential microbial starter culture under controlled fermentation in wet process. Food Biosci. 2022, 48, 101819. [Google Scholar] [CrossRef]
- Krajangsang, S.; Seephin, P.; Tantayotai, P.; Mahingsapun, R.; Meeampun, Y.; Panyachanakul, T.; Samosorn, S.; Dolsophon, K.; Jiamjariyatam, R.; Lorliam, W.; et al. New approach for screening of microorganisms from Arabica coffee processing for their ability to improve Arabica coffee flavor. 3 Biotech 2022, 12, 143. [Google Scholar] [CrossRef]
- Gancarz, M.; Dobrzański, B.; Malaga-Toboła, U.; Tabor, S.; Combrzyński, M.; Ćwikła, D.; Strobel, W.R.; Oniszczuk, A.; Karami, H.; Darvishi, Y.; et al. Impact of Coffee Bean Roasting on the Content of Pyridines Determined by Analysis of Volatile Organic Compounds. Molecules 2022, 27, 1559. [Google Scholar] [CrossRef]
- Campelo, P.H.; Alves Filho, E.G.; Silva, L.M.A.; de Brito, E.S.; Rodrigues, S.; Fernandes, F.A.N. Modulation of aroma and flavor using dielectric barrier discharge plasma technology in a juice rich in terpenes and sesquiterpenes. LWT 2020, 130, 109644. [Google Scholar] [CrossRef]
- Rodrigues, S.; Fernandes, F.A.N. Glow Discharge Plasma Processing for the Improvement of Pasteurized Orange Juice’s Aroma and Off-Flavor. Processes 2022, 10, 1812. [Google Scholar] [CrossRef]
- Fernandes, F.A.N.; Rodrigues, S. Cold Plasma Processing on Fruits and Fruit Juices: A Review on the Effects of Plasma on Nutritional Quality. Processes 2021, 9, 2098. [Google Scholar] [CrossRef]
- Campelo, P.H.; Alves Filho, E.G.; Silva, L.M.A.; de Brito, E.S.; Rodrigues, S.; Fernandes, F.A.N. Modulation of aroma and flavor using glow discharge plasma technology. Innov. Food Sci. Emerg. Technol. 2020, 62, 102363. [Google Scholar] [CrossRef]
- Rodríguez, Ó.; Gomes, W.F.; Rodrigues, S.; Fernandes, F.A.N. Effect of indirect cold plasma treatment on cashew apple juice (Anacardium occidentale L.). LWT—Food Sci. Technol. 2017, 84, 457–463. [Google Scholar] [CrossRef]
- Batista, J.D.F.; Dantas, A.M.; Santos Fonseca, J.V.; Madruga, M.S.; Fernandes, F.A.N.; Rodrigues, S.; da Silva Campelo Borges, G. Effects of cold plasma on avocado pulp (Persea americana Mill.): Chemical characteristics and bioactive compounds. J. Food Process. Preserv. 2021, 45, 15179. [Google Scholar] [CrossRef]
- Córdoba, N.; Moreno, F.L.; Osorio, C.; Velásquez, S.; Ruiz, Y. Chemical and sensory evaluation of cold brew coffees using different roasting profiles and brewing methods. Food Res. Int. 2021, 141, 110141. [Google Scholar] [CrossRef] [PubMed]
- Grosch, W. Evaluation of the Key Odorants of Foods by Dilution Experiments, Aroma Models and Omission. Chem. Senses 2001, 26, 533–545. [Google Scholar] [CrossRef] [PubMed]
- Usami, A.; Ono, T.; Marumoto, S.; Miyazawa, M. Comparison of volatile compounds with characteristic odor in flowers and leaves of Nojigiku (Chrysanthemum japonense). J. Oleo Sci. 2013, 62, 631–636. [Google Scholar] [CrossRef] [Green Version]
- Padrayuttawat, A.; Yoshizawa, T.; Tamura, H.; Tokunaga, T. Optical isomers and odor thresholds of volatile constituents in Citrus sudachi. Food Sci. Technol. Int. 1997, 3, 402–408. [Google Scholar] [CrossRef] [Green Version]
- Xiao, Z.; Chen, J.; Niu, Y.; Chen, F. Characterization of the key odorants of fennel essential oils of different regions using GC–MS and GC–O combined with partial least squares regression. J. Chromatogr. B Anal. Technol. Biomed. Life Sci. 2017, 1063, 226–234. [Google Scholar] [CrossRef]
- Fazzalari, F.A. Compilation of Odor and Taste Threshold Values Data; American Society for Testing and Materials: Philadelphia, PA, USA, 1978. [Google Scholar]
- Buttery, R.G.; Ling, L.C.; Light, D.M. Tomato Leaf Volatile Aroma Components. J. Agric. Food Chem. 1987, 35, 1039–1042. [Google Scholar] [CrossRef]
- Qian, M.C.; Wang, Y. Seasonal variation of volatile composition and odor activity value of “Marion” (Rubus spp. hyb) and “Thornless Evergreen” (R. laciniatus L.) blackberries. J. Food Sci. 2005, 70, 13–20. [Google Scholar] [CrossRef]
- Gao, X.; Feng, T.; Sheng, M.; Wang, B.; Wang, Z.; Shan, P.; Zhang, Y.; Ma, H. Characterization of the aroma-active compounds in black soybean sauce, a distinctive soy sauce. Food Chem. 2021, 364, 130334. [Google Scholar] [CrossRef]
- Vázquez-Araújo, L.; Enguix, L.; Verdú, A.; García-García, E.; Carbonell-Barrachina, A.A. Investigation of aromatic compounds in toasted almonds used for the manufacture of turrón. Eur. Food Res. Technol. 2008, 227, 243–254. [Google Scholar] [CrossRef]
- Zhai, X.; Yang, M.; Zhang, J.; Zhang, L.; Tian, Y.; Li, C.; Bao, L.; Ma, C.; Abd El-Aty, A.M. Feasibility of Ultrasound-Assisted Extraction for Accelerated Cold Brew Coffee Processing: Characterization and Comparison With Conventional Brewing Methods. Front. Nutr. 2022, 9, 849811. [Google Scholar] [CrossRef]
- Hu, C.J.; Li, D.; Ma, Y.X.; Zhang, W.; Lin, C.; Zheng, X.Q.; Liang, Y.R.; Lu, J.L. Formation mechanism of the oolong tea characteristic aroma during bruising and withering treatment. Food Chem. 2018, 269, 202–211. [Google Scholar] [CrossRef]
- Amirabadi, S.; Milani, J.M.; Sohbatzadeh, F. Application of dielectric barrier discharge plasma to hydrophobically modification of gum arabic with enhanced surface properties. Food Hydrocoll. 2020, 104, 105724. [Google Scholar] [CrossRef]
- Deng, J.; He, L.; Zhao, B.; Chen, Q. Effects of air relative humidity on spectral characteristics of dielectric barrier discharge plasma assisted combustion reactor. Vacuum 2020, 175, 109189. [Google Scholar] [CrossRef]
- Ramanujam, M.; Mix, R.; Wagner, M.; Friedrich, J.F. Effect of Br gassing after Ar plasma treatment of polyolefins. J. Adhes. Sci. Technol. 2013, 27, 1828–1839. [Google Scholar] [CrossRef]
- Castro, D.R.G.; Mar, J.M.; Silva, L.S.; Silva, K.A.; Sanches, E.A.; Bezerra, J.A.; Rodrigues, S.; Fernandes, F.A.N.; Campelo, P.H. Dielectric barrier atmospheric cold plasma applied on camu-camu juice processing: Effect of the excitation frequency. Food Res. Int. 2020, 131, 109044. [Google Scholar] [CrossRef] [PubMed]
Figure 1.
Heat map illustrating the changes in the mass fraction of volatile components compared to the untreated RTD coffee.
Figure 1.
Heat map illustrating the changes in the mass fraction of volatile components compared to the untreated RTD coffee.

Figure 2.
Chemical reactions induced by plasma treatment on furans are present in the ready-to-drink coffee.
Figure 2.
Chemical reactions induced by plasma treatment on furans are present in the ready-to-drink coffee.
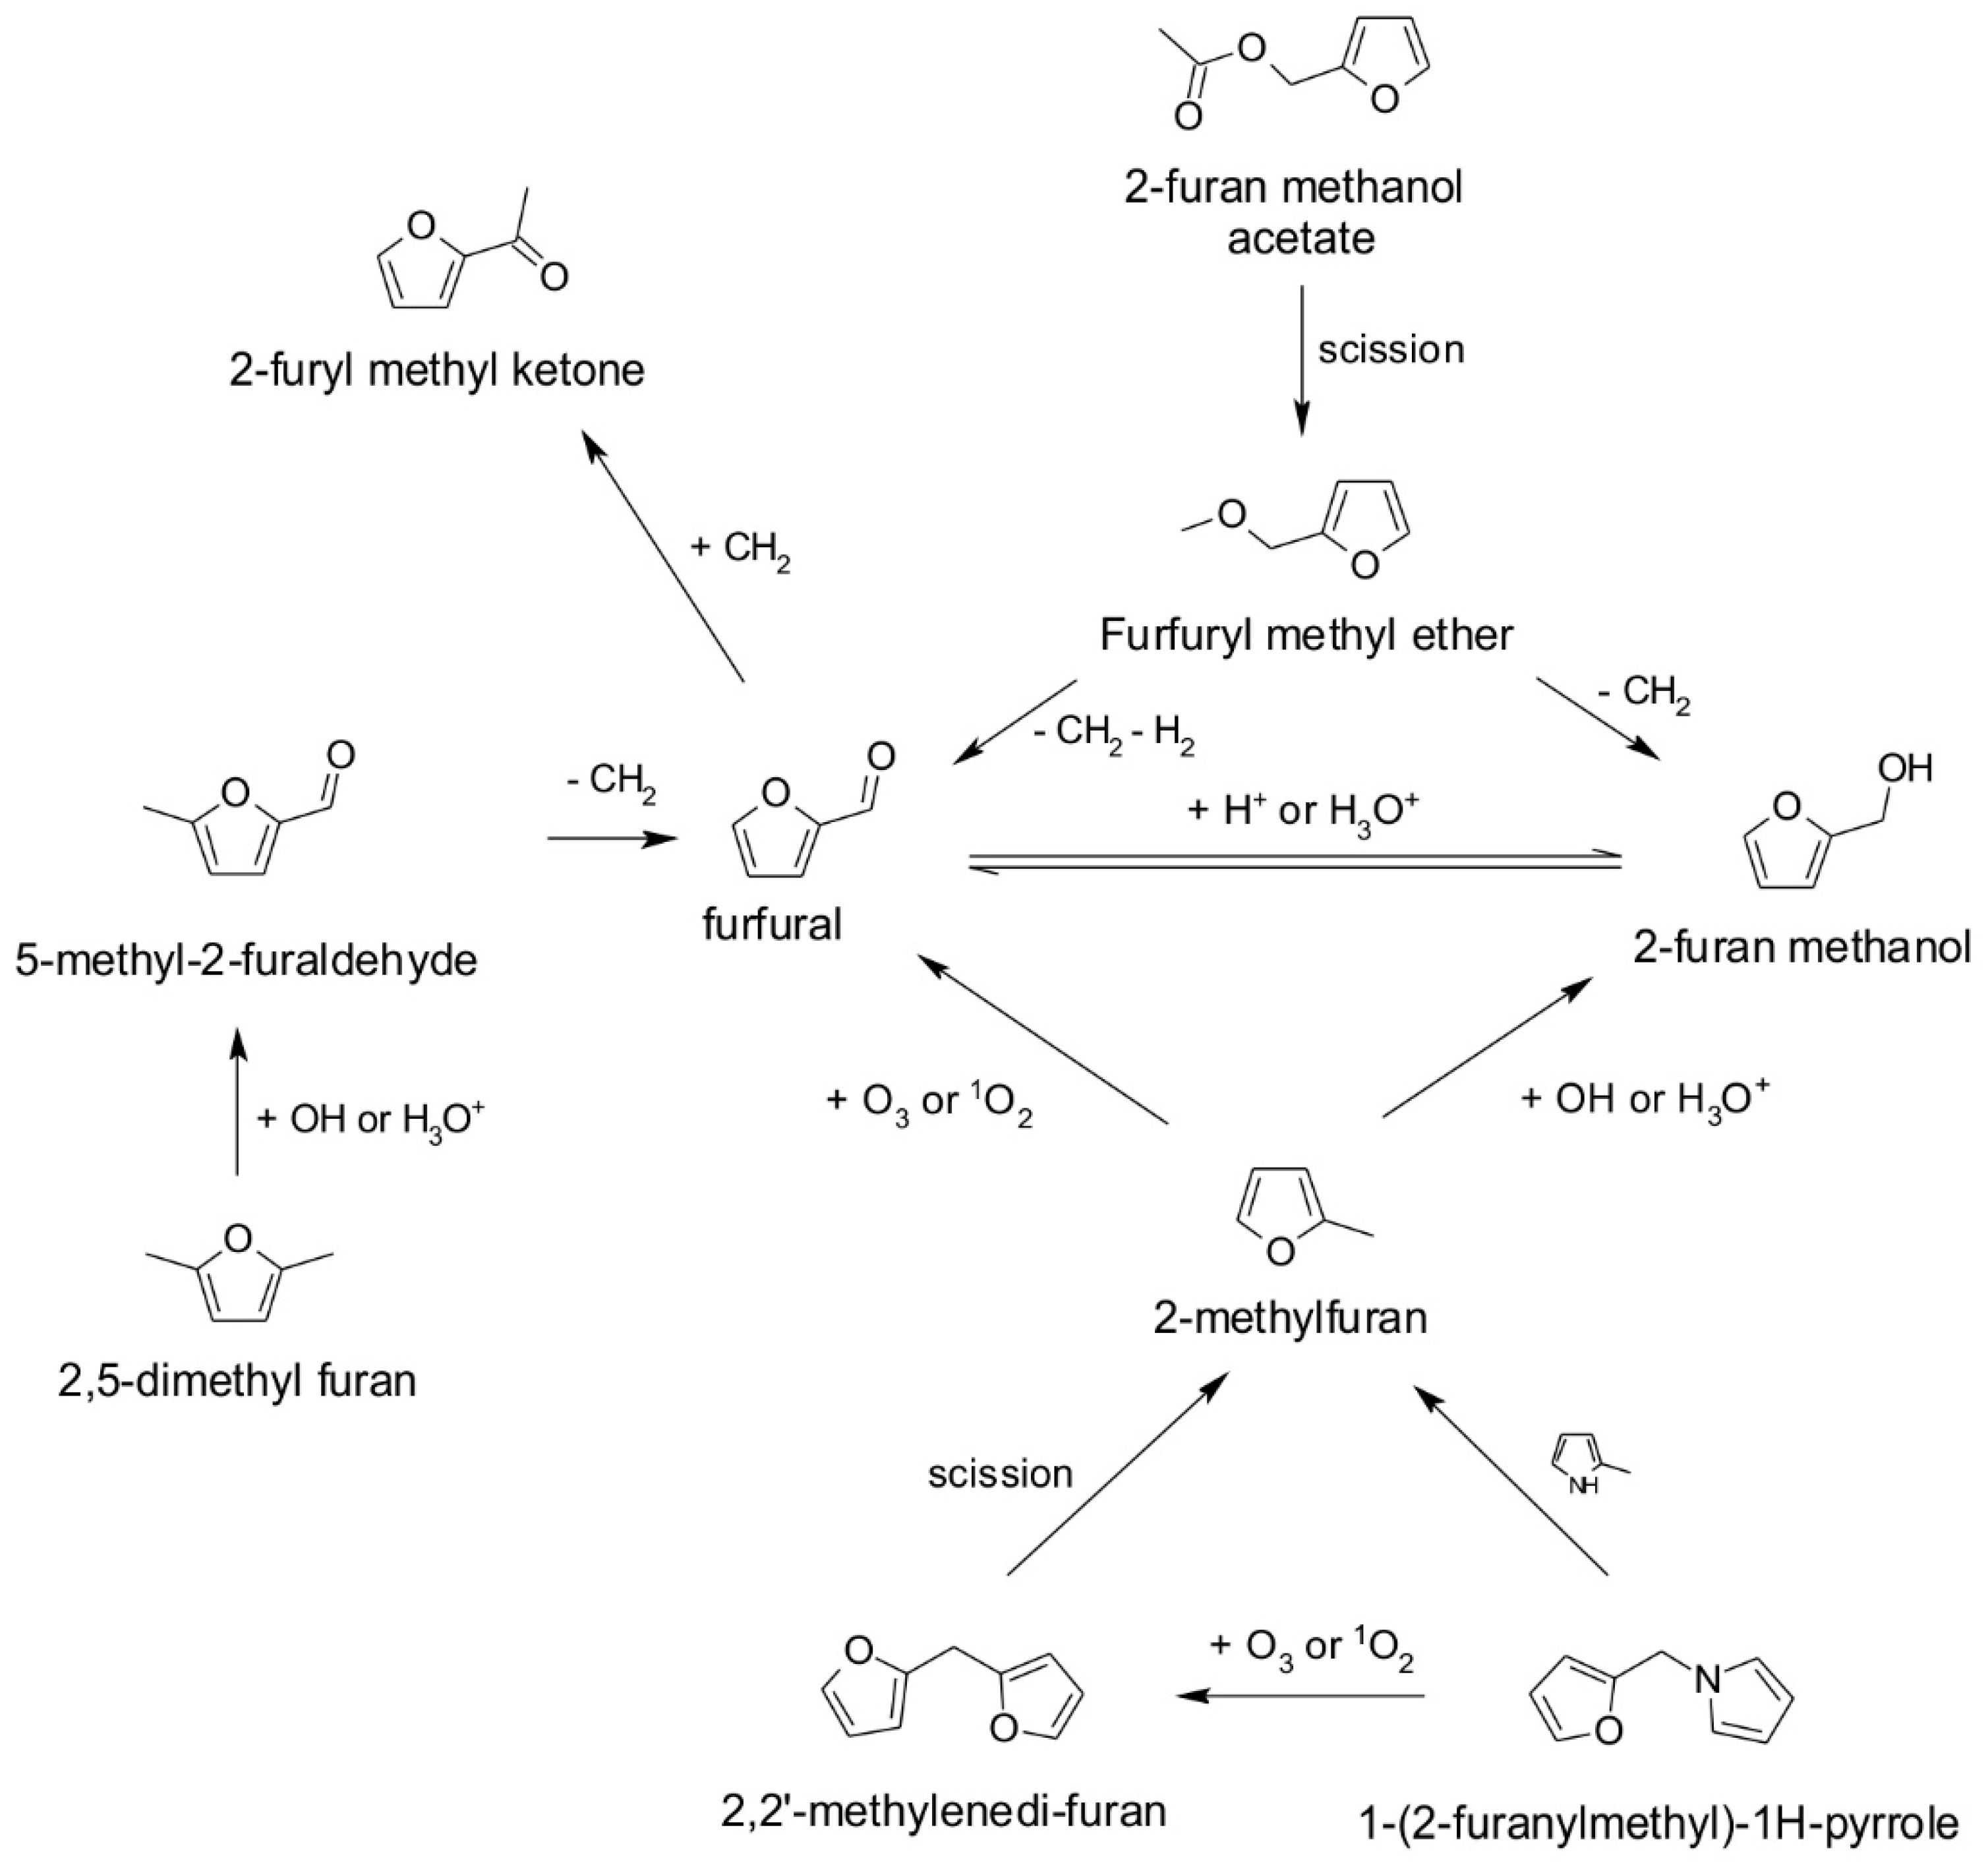
Figure 3.
The aroma profile radar for the untreated and plasma-treated RTD coffee.

Table 1.
Volatile compounds identified in the ready-to-drink coffee and their respective retention times (RT), Kovats index, odor threshold in water, and primary odor description.
Table 1.
Volatile compounds identified in the ready-to-drink coffee and their respective retention times (RT), Kovats index, odor threshold in water, and primary odor description.
| Retention Time (min) | Compound | Kovats Index | m/z | Odor Threshold in Water (mg/L) | Odor Description |
|---|---|---|---|---|---|
| Aldehydes and Alcohols | |||||
| 2.12 | 2-methylbutanal and 3-methylbutanal | 763 | 44, 58, 71 | 0.002 | Cocoa |
| 3.02 | 1,5-hexadien-3-ol | 781 | 57, 29, 39 | 0.5 | -- |
| 4.60 | hexanal | 813 | 44, 56, 72 | 0.0045 | Green |
| Furans | |||||
| 1.64 | 2-methylfuran | 753 | 82, 53, 39 | -- | -- |
| 2.44 | 2,5-dimethyl furan | 769 | 96, 43, 53 | 0.1 | Meaty |
| 5.40 | furfuryl methyl ether | 829 | 81, 112, 53 | -- | -- |
| 5.79 | furfural | 837 | 96, 39, 67 | 0.77 | Bready |
| 6.67 | 2-furan methanol | 855 | 98, 41, 81 | 2.0 | Bready |
| 9.00 | 2-furyl methyl ketone | 902 | 95, 110, 39 | 10.0 | Balsamic |
| 11.62 | 5-methyl-2-furaldehyde | 955 | 110, 53, 81 | 1.11 | Caramellic |
| 12.78 | 2-pentyl furan | 979 | 81, 138, 53 | 0.006 | Fruity |
| 13.32 | 2-furan methanol acetate | 990 | 81, 98, 140 | 0.1 | Fruity |
| 18.03 | 2,2′-methylenedi furan | 1085 | 91, 148, 39 | -- | -- |
| 18.54 | 2-furan methanol propionate | 1095 | 81, 98, 154 | -- | -- |
| Pyridines, Pyrazines, and Tetrazoles | |||||
| 3.27 | pyridine | 786 | 79, 52, 39 | 2.0 | Fishy |
| 4.92 | 5-hydrazino-1H-1,2,3,4-tetrazole | 820 | 72, 100, 207 | -- | -- |
| 5.52 | 4-methyl pyrimidine | 832 | 94, 40, 53 | -- | -- |
| 9.17 | 2,6-dimethylpyrazine | 906 | 108, 42, 67 | 10.0 | Chocolate |
| 9.27 | 2-ethylpyrazine and 2,3-dimethylpyrazine | 908 | 107, 80, 53 | 2.5 | Nutty |
| 11.94 | 3-ethyl-2,5-dimethylpyrazine | 962 | 135, 42, 108 | 0.001 | Nutty |
| 17.87 | 2-ethyl-3,5-dimethyl pyrazine | 1082 | 135, 42, 108 | 0.001 | Nutty |
| Pyrroles | |||||
| 3.14 | 2-methyl-1H-pyrrole | 784 | 80, 53, 28 | 0.017 | -- |
| 13.90 | 1-methyl-1H-pyrrole-2-carbaldehyde | 1001 | 109, 53, 80 | 19.6 | -- |
| 23.20 | 1-(2-furanylmethyl)-1H-pyrrole | 1190 | 81, 147, 53 | 0.1 | Vegetable |
Table 2.
The mass fraction of the volatile compounds identified in ready-to-drink coffee in the control and plasma-treated samples. Different letters indicate statistically different values.
Table 2.
The mass fraction of the volatile compounds identified in ready-to-drink coffee in the control and plasma-treated samples. Different letters indicate statistically different values.
| Compound | Control | 50 Hz 15 min | 50 Hz 30 min | 500 Hz 15 min | 500 Hz 30 min | 1000 Hz 15 min | 100 Hz 30 min |
|---|---|---|---|---|---|---|---|
| 2-methylfuran | 13.4 ± 0.6 b | 8.7 ± 0.4 d | 11.3 ± 0.5 c | 8.0 ± 0.4 d | 13.5 ± 0.9 b | 17.4 ± 1.2 a | 11.5 ± 1.5 bc |
| 2-methylbutanal and 3-methylbutanal | 21.2 ± 1.5 a | 10.2 ± 1.0 c | 2.7 ± 0.3 e | 11.7 ± 0.8 c | 8.3 ± 0.5 d | 11.1 ± 0.9 c | 15.3 ± 1.6 b |
| 2,5-dimethyl furan | 9.4 ± 0.5 b | 4.9 ± 0.5 d | 13.3 ± 0.8 a | 6.5 ± 0.4 c | 6.2 ± 0.4 c | 8.0 ± 0.8 bc | 7.6 ± 0.8 bc |
| 1,5-hexadien-3-ol | 0.6 ± 0.1 b | 1.5 ± 0.3 a | 0.2 ± 0.1 c | 0.7 ± 0.1 b | 0.0 ± 0.0 d | 0.0 ± 0.0 d | 0.5 ± 0.1 b |
| 2-methyl-1H-pyrrole | 2.3 ± 0.4 a | 1.8 ± 0.4 ab | 0.7 ± 0.1 c | 2.3 ± 0.3 a | 1.2 ± 0.2 b | 1.0 ± 0.2 bc | 2.3 ± 0.3 a |
| pyridine | 12.9 ± 0.8 a | 11.4 ± 1.0 ab | 5.2 ± 0.4 d | 10.7 ± 0.8 b | 12.2 ± 0.8 ab | 8.8 ± 0.7 c | 10.6 ± 0.9 b |
| not identified | 0.0 ± 0.0 e | 6.3 ± 0.5 b | 7.0 ± 0.3 b | 4.8 ± 0.3 c | 8.5 ± 0.4 a | 9.4 ± 0.6 a | 3.9 ± 0.3 d |
| hexanal | 4.4 ± 0.2 a | 3.8 ± 0.3 bc | 1.9 ± 0.3 e | 4.1 ± 0.3 ab | 2.1 ± 0.3 e | 2.9 ± 0.3 d | 3.2 ± 0.2 cd |
| 5-hydrazino-tetrazole | 1.0 ± 0.2 d | 3.4 ± 0.2 a | 1.5 ± 0.3 cd | 2.3 ± 0.2 b | 2.1 ± 0.4 bc | 2.0 ± 0.2 bc | 1.6 ± 0.2 c |
| furfuryl methyl ether | 0.8 ± 0.1 b | 0.6 ± 0.2 b | 0.0 ± 0.0 c | 0.8 ± 0.1 b | 2.6 ± 0.4 a | 0.5 ± 0.2 b | 1.0 ± 0.3 b |
| 4-methyl pyrimidine | 2.4 ± 0.5 e | 4.5 ± 0.3 b | 3.4 ± 0.3 d | 4.6 ± 0.4 ab | 5.4 ± 0.3 a | 4.6 ± 0.6 ab | 4.2 ± 0.4 b |
| furfural | 4.5 ± 0.6 c | 7.7 ± 0.6 a | 4.2 ± 0.3 c | 7.4 ± 0.4 a | 6.7 ± 0.4 ab | 5.1 ± 0.4 bc | 7.1 ± 0.2 a |
| 2-furan methanol | 4.1 ± 0.6 e | 8.3 ± 0.4 c | 33.0 ± 2.0 a | 8.0 ± 0.5 c | 13.2 ± 1.1 b | 12.8 ± 1.0 b | 6.7 ± 0.5 d |
| 2-furyl methyl ketone | 1.1 ± 0.1 b | 1.3 ± 0.3 ab | 1.9 ± 0.3 a | 1.4 ± 0.3 ab | 1.2 ± 0.3 b | 1.0 ± 0.3 b | 1.2 ± 0.4 b |
| 2,6-dimethylpyrazine | 0.5 ± 0.2 a | 0.9 ± 0.2 a | 0.5 ± 0.2 a | 0.8 ± 0.3 a | 0.9 ± 0.2 a | 0.8 ± 0.3 a | 0.7 ± 0.3 a |
| 2-ethylpyrazine and 2,3-dimethylpyrazine | 2.3 ± 0.5 b | 2.1 ± 0.3 b | 2.3 ± 0.4 b | 2.3 ± 0.4 b | 3.4 ± 0.3 a | 2.8 ± 0.4 ab | 2.1 ± 0.4 b |
| 5-methyl-2-furaldehyde | 2.7 ± 0.4 bc | 4.0 ± 0.3 a | 2.1 ± 0.3 c | 4.1 ± 0.5 a | 3.4 ± 0.2 ab | 2.9 ± 0.5 b | 3.4 ± 0.5 ab |
| 3-ethyl-2,5-dimethylpyrazine | 0.3 ± 0.1 c | 0.3 ± 0.1 c | 0.7 ± 0.1 ab | 0.3 ± 0.1 bc | 1.0 ± 0.2 a | 0.5 ± 0.1 b | 1.0 ± 0.2 a |
| 2-pentyl furan | 0.2 ± 0.1 b | 0.4 ± 0.1 ab | 0.0 ± 0.0 c | 0.6 ± 0.1 a | 0.0 ± 0.0 c | 0.4 ± 0.2 ab | 0.0 ± 0.0 c |
| 2-furan methanol acetate | 11.2 ± 0.5 a | 10.4 ± 0.3 ab | 3.6 ± 0.3 cd | 11.5 ± 0.5 a | 3.9 ± 0.3 c | 2.8 ± 0.5 d | 9.5 ± 0.4 b |
| 1-methylpyrrole-2-carbaldehyde | 0.9 ± 0.2 cd | 1.8 ± 0.3 a | 0.6 ± 0.1 d | 1.6 ± 0.1 ab | 0.9 ± 0.2 cd | 0.7 ± 0.2 d | 1.2 ± 0.1 bc |
| 2-ethyl-3,5-dimethyl pyrazine | 0.4 ± 0.1 ab | 0.5 ± 0.1 a | 0.3 ± 0.1 ab | 0.5 ± 0.1 a | 0.4 ± 0.1 ab | 0.4 ± 0.1 ab | 0.2 ± 0.1 b |
| 2,2′-methylenedi furan | 0.4 ± 0.1 a | 0.4 ± 0.1 a | 0.3 ± 0.1 a | 0.3 ± 0.1 a | 0.4 ± 0.1 a | 0.4 ± 0.1 a | 0.2 ± 0.1 a |
| 2-furan methanol propionate | 0.3 ± 0.1 ab | 0.4 ± 0.1 a | 0.1 ± 0.1 b | 0.3 ± 0.1 ab | 0.0 ± 0.0 b | 0.4 ± 0.1 a | 0.2 ± 0.1 ab |
| 2-nonen-1-ol | 0.0 ± 0.0 c | 0.5 ± 0.1 ab | 0.7 ± 0.2 a | 0.5 ± 0.1 ab | 0.2 ± 0.1 b | 0.3 ± 0.1 b | 0.0 ± 0.0 c |
| 1-(2-furanylmethyl)pyrrole | 0.4 ± 0.1 a | 0.3 ± 0.1 ab | 0.1 ± 0.0 b | 0.3 ± 0.1 ab | 0.0 ± 0.0 c | 0.1 ± 0.0 b | 0.2 ± 0.0 ab |
| 2-decen-1-ol | 0.0 ± 0.0 c | 0.4 ± 0.1 a | 0.3 ± 0.1 ab | 0.2 ± 0.1 ab | 0.0 ± 0.0 c | 0.1 ± 0.1 b | 0.0 ± 0.0 c |
| not identified | 0.1 ± 0.0 b | 0.1 ± 0.0 b | 0.0 ± 0.0 b | 0.1 ± 0.0 b | 0.2 ± 0.1 ab | 0.3 ± 0.1 a | 0.1 ± 0.1 b |
Publisher’s Note: MDPI stays neutral with regard to jurisdictional claims in published maps and institutional affiliations. |
© 2022 by the authors. Licensee MDPI, Basel, Switzerland. This article is an open access article distributed under the terms and conditions of the Creative Commons Attribution (CC BY) license (https://creativecommons.org/licenses/by/4.0/).
Share and Cite
MDPI and ACS Style
Rodrigues, S.; Fernandes, F.A.N. Changing Ready-to-Drink Coffee Aroma Using Dielectric Barrier Discharge Plasma. Processes 2022, 10, 2056. https://doi.org/10.3390/pr10102056
AMA Style
Rodrigues S, Fernandes FAN. Changing Ready-to-Drink Coffee Aroma Using Dielectric Barrier Discharge Plasma. Processes. 2022; 10(10):2056. https://doi.org/10.3390/pr10102056
Chicago/Turabian StyleRodrigues, Sueli, and Fabiano A. N. Fernandes. 2022. "Changing Ready-to-Drink Coffee Aroma Using Dielectric Barrier Discharge Plasma" Processes 10, no. 10: 2056. https://doi.org/10.3390/pr10102056
Note that from the first issue of 2016, this journal uses article numbers instead of page numbers. See further details here.