
Energy Consumption Analysis of a Diesel Hydrotreating Unit Using an Aspen Simulation

1
Department of Fintech & AI, The Hong Kong Polytechnic University, Hong Kong 999077, China
2
School of Chemical Engineering, Northwest University, Xi’an 710069, China
3
Shaanxi Environmental Protection Industry Research Institute Co., Ltd., Xi’an 710026, China
4
Shaanxi Qinbang Environmental Protection Technology Co., Ltd., Xi’an 710026, China
*
Author to whom correspondence should be addressed.
Processes 2022, 10(10), 2055; https://doi.org/10.3390/pr10102055
Submission received: 12 September 2022
/
Revised: 30 September 2022
/
Accepted: 7 October 2022
/
Published: 11 October 2022
(This article belongs to the Section Energy Systems)
Abstract
:The petrochemical industry is traditionally a high energy consumption industry, thus energy saving in this industry is of great significance in terms of trying to achieve the national goal of “carbon-peak and carbon neutrality” in China. Diesel is one of the main products of petrochemical enterprises. The energy consumption of a diesel hydrotreating (HDT) unit is relatively high due to the high reaction temperature and pressure of HDT reactors. In order to further explore the energy consumption of diesel HDT units under different operating conditions, this paper establishes a full-process simulation based on the kinetics of hydrodesulfurization, hydrodenitrogenation, and aromatics saturation, in Aspen Plus to discuss the effect of different operating conditions on the electricity, steam, and fuel gas consumptions. The results show that with the increase of reaction temperature or reaction pressure, the sulfur content in diesel oil decreases, but the consumption of related utilities and comprehensive energy consumption increases. In addition, this paper also analyzes the energy consumption changes under the operating condition boundaries when the diesel quality is unchanged. When the reaction pressure is 8 MPa and the reaction temperature is 317.5 °C, the comprehensive energy consumption is 5% lower than the energy consumption with the reaction pressure of 6 MPa and the temperature of 320 °C. Therefore, on the premise of satisfying the diesel product quality, the comprehensive energy consumption of the diesel HDT unit can be reduced by increasing the reaction pressure and decreasing the reaction temperature.
1. Introduction
With the heavier and inferior of crude oil [1], the energy consumption of a refinery is extremely high [2,3], thus accomplishing ways that can reduce the processing energy consumption is of great significance to improve the competitiveness of refineries [4] and in terms of helping China achieve their “carbon-peak and carbon neutrality” goal [5,6]. The diesel hydrotreating (HDT) unit is one of the main secondary processing units in the refinery and is the main unit for the production of diesel fuel [7]. The energy and hydrogen consumptions are further increased due to the higher impurity contents and the increasing demand for clean fuels [8].
To reduce the energy consumption of a diesel HDT unit, Al-Hadhrami et al. [9] analyzed the energy performance of heat exchangers in a HDT unit using twisted tube heat exchangers. The results showed that a twisted tube heat exchanger can save more energy and the payback period is only 2.12 years. Zhang et al. [10] proposed a nonlinear programming for the energy saving of a diesel HDT unit using the heat exchanger’s network optimization. Agbo et al. [11] conducted an exergy analysis for a naphtha HDT unit to detect heat exchangers with low exergy efficiency. The overall exergy efficiency was increased by the heat recovery of flue gas in the furnaces and boilers. Considering the advantages of the heat exchanger network and exergy analysis, Bandyopadhyay et al. [12] discussed a method that applies pinch analysis and exergy analysis during the design of a new plant to increase its energy efficient. The exergy analysis was used to identify the exergy loss of the heat exchangers. The pinch analysis was adopted to improve the energy performance of the heat exchangers. The application of the two techniques helped in the energy integration of the plant during the design phase. Zhang et al. [13] simulated a diesel HDT unit and retrofitted its heat exchanger network using pinch analysis. The results showed that the operating cost saved $4.39 m/a. Gabbar and Aboughaly [14] proposed a conceptual design of a solid waste to diesel process and conducted the energy and economic analysis to enhance the energy utilization level and economic benefits. Therefore, improving the efficiency of the heat exchanger, and utilizing exergy analysis and the heat exchanger network can improve the energy performance of a HDT unit.
In diesel HDT unit modeling, Samoilov [15] built a mathematical model to optimize five variants of a diesel HDT reactor based on the kinetics of hydrodesulfurization. Ahmad et al. [16] presented a mathematical model that integrated the reactor, separation, and heat recovery systems, to minimize the total annual cost for the conceptual design of a diesel HDT unit. Novaes et al. [17] proposed an optimization model to estimate the kinetic parameter of hydrodesulfurization and hydrodenitrogenation. These studies concluded that the optimization of a diesel HDT unit should consider the hydrogenation reaction to achieve the maximum optimization.
However, the method of optimizing the heat exchange network does not involve the optimization of the hydrogenation reaction itself [18]. As yet, there has been no report on how to optimize the HDT unit by coupling the hydrogenation reaction kinetics with optimizing the operating conditions to reduce the overall energy consumption of the HDT unit.
In this study, to understand the exact effects of the operating conditions on energy consumption, the whole process was simulated in Aspen software by coupling the key reactions of the HDT unit, such as hydrodesulfurization, hydrodenitrogenation, and aromatics saturation, and then the effects of the changes in the operating conditions on product quality and energy consumption were studied. In addition, the comprehensive energy consumption under the operating condition boundaries was also analyzed to obtain the optimal reaction conditions.
2. Diesel Hydrotreating Unit
The flow chart of a diesel HDT unit is shown in Figure 1. Generally, in the HDT unit, the raw material reacts with hydrogen at high temperature and pressure to remove impurities, such as sulfur, nitrogen and heavy metals, in the feed oil, so as to improve the molecular structure of hydrocarbons, and to provide refined products or clean fuels for downstream production. The equipment, input, and output materials of a typical HDT process are shown in Figure 1. After being pressurized, the feed oil is mixed with the high pressure mixed hydrogen. After being heated by a heat exchanger and a boiler, the oil and hydrogen mixture enters a fixed bed reactor to remove impurities. After being cooled, the reaction effluent enters several separators to separate and recycle hydrogen, oil, and acidic water. The separated oil enters a stripper to remove any acidic gas dissolved in the oil. Finally, it enters the fractionator to obtain the refined products. The recycled hydrogen separated by the separator enters the amine absorption tower to remove H2S and other acidic gases. The purified recycled hydrogen is then pressured and mixed with the make-up hydrogen to obtain mixed hydrogen.
3. Aspen Simulation of a Diesel Hydrotreating Unit
3.1. Simulation Basis
In order to clarify the comprehensive energy consumption of a diesel HDT unit, this paper takes the 3.2 million t/a diesel HDT unit of a refinery as an example and uses Aspen Plus (Aspen Technology Inc., Bedford, MA, USA) to simulate the whole process. The simulation process strictly follows the feed and operating conditions of the unit to obtain the necessary basic data.
In a diesel HDT unit, the pressure changes greatly, and the main components in the reaction process are alkanes, cycloalkanes, and aromatics, as well as non-polar and weak polar substances, such as hydrogen. According to the experiences and recommendations of the Aspen Plus help, Grayson is adopted as the global physical property method, and ENRTL-HG is selected as the physical property method when electrolyte components are involved.
The main unit equipment of the actual device, the unit operation modules selected by Aspen Plus simulation, and their main operating conditions are listed in Table 1.
3.2. Hydrogenation Reaction Kinetics
In a diesel HDT unit, chemical reactions are carried out in high temperature and high pressure conditions, and in the presence of a hydrogenation catalyst. The main reactions in the HDT reactor include hydrodemetallization, olefin saturation, hydrodenitrogenation, hydrodeoxygenation, and hydrodesulfurization, which are reactions with hydrogen to remove sulfur, metal and other impurities in the feed oil. Considering the impurity contents and reaction rates, the simulation of the diesel HDT unit mainly considers the key reactions, such as hydrodesulfurization, hydrodenitrogenation, and aromatics saturation.
The sulfur impurities can be divided into two categories, the easily reactive sulfides, such as Dibenzothiophene (DBT), and the hardly reactive sulfides, such as 4,6-Dimethyldibenzothiophene (4,6-DMDBT) [19]. The hydrodesulfurization of DBT and 4,6-DMDBT can be divided into two reactions: hydrogenolysis and hydrogenation [20]. The former is hydrogen and sulfide reacting directly to generate hydrogen sulfide and then remove it. The latter is when hydrogen saturates the aromatic ring first and then reacts with sulfide [20]. The hydrogenolysis of DBT and 4,6-DMDBT are shown as below.

The kinetics of the hydrogenolysis of DBT is shown in Equation (1) [20].
where denotes the kinetic constants, see Equation (2); indicates the reactant concentration on the catalyst surface, kmol m−3; , and are the adsorption constants in site of DBT, H2 and H2S, which are , and .
The hydrogenation of DBT and 4,6-DMDBT are presented as below:
The kinetics of the hydrogenation of DBT is shown in Equation (3) [20].
where denotes the kinetic constants, see Equation (4); is the adsorption constants in site of DBT, see Equation (5).
The kinetic constant of the hydrogenolysis and hydrogenation of 4,6-DMDBT is 1/15 of the kinetic constant of the hydrogenolysis and hydrogenation of DBT [20,21].
Hydrodenitrogenation is not the focus of this paper. Therefore, the hydrodenitrogenation reaction is regarded as a lumped reaction. The reaction’s kinetic equation is as follows [22,23]:
where denotes the kinetic constants, see Equation (7),
The aromatics saturation reaction is as follows [24]:
Since aromatics saturation is an exothermic equilibrium reaction, its equilibrium constant is as follows [24]:
3.3. Aspen Simulation
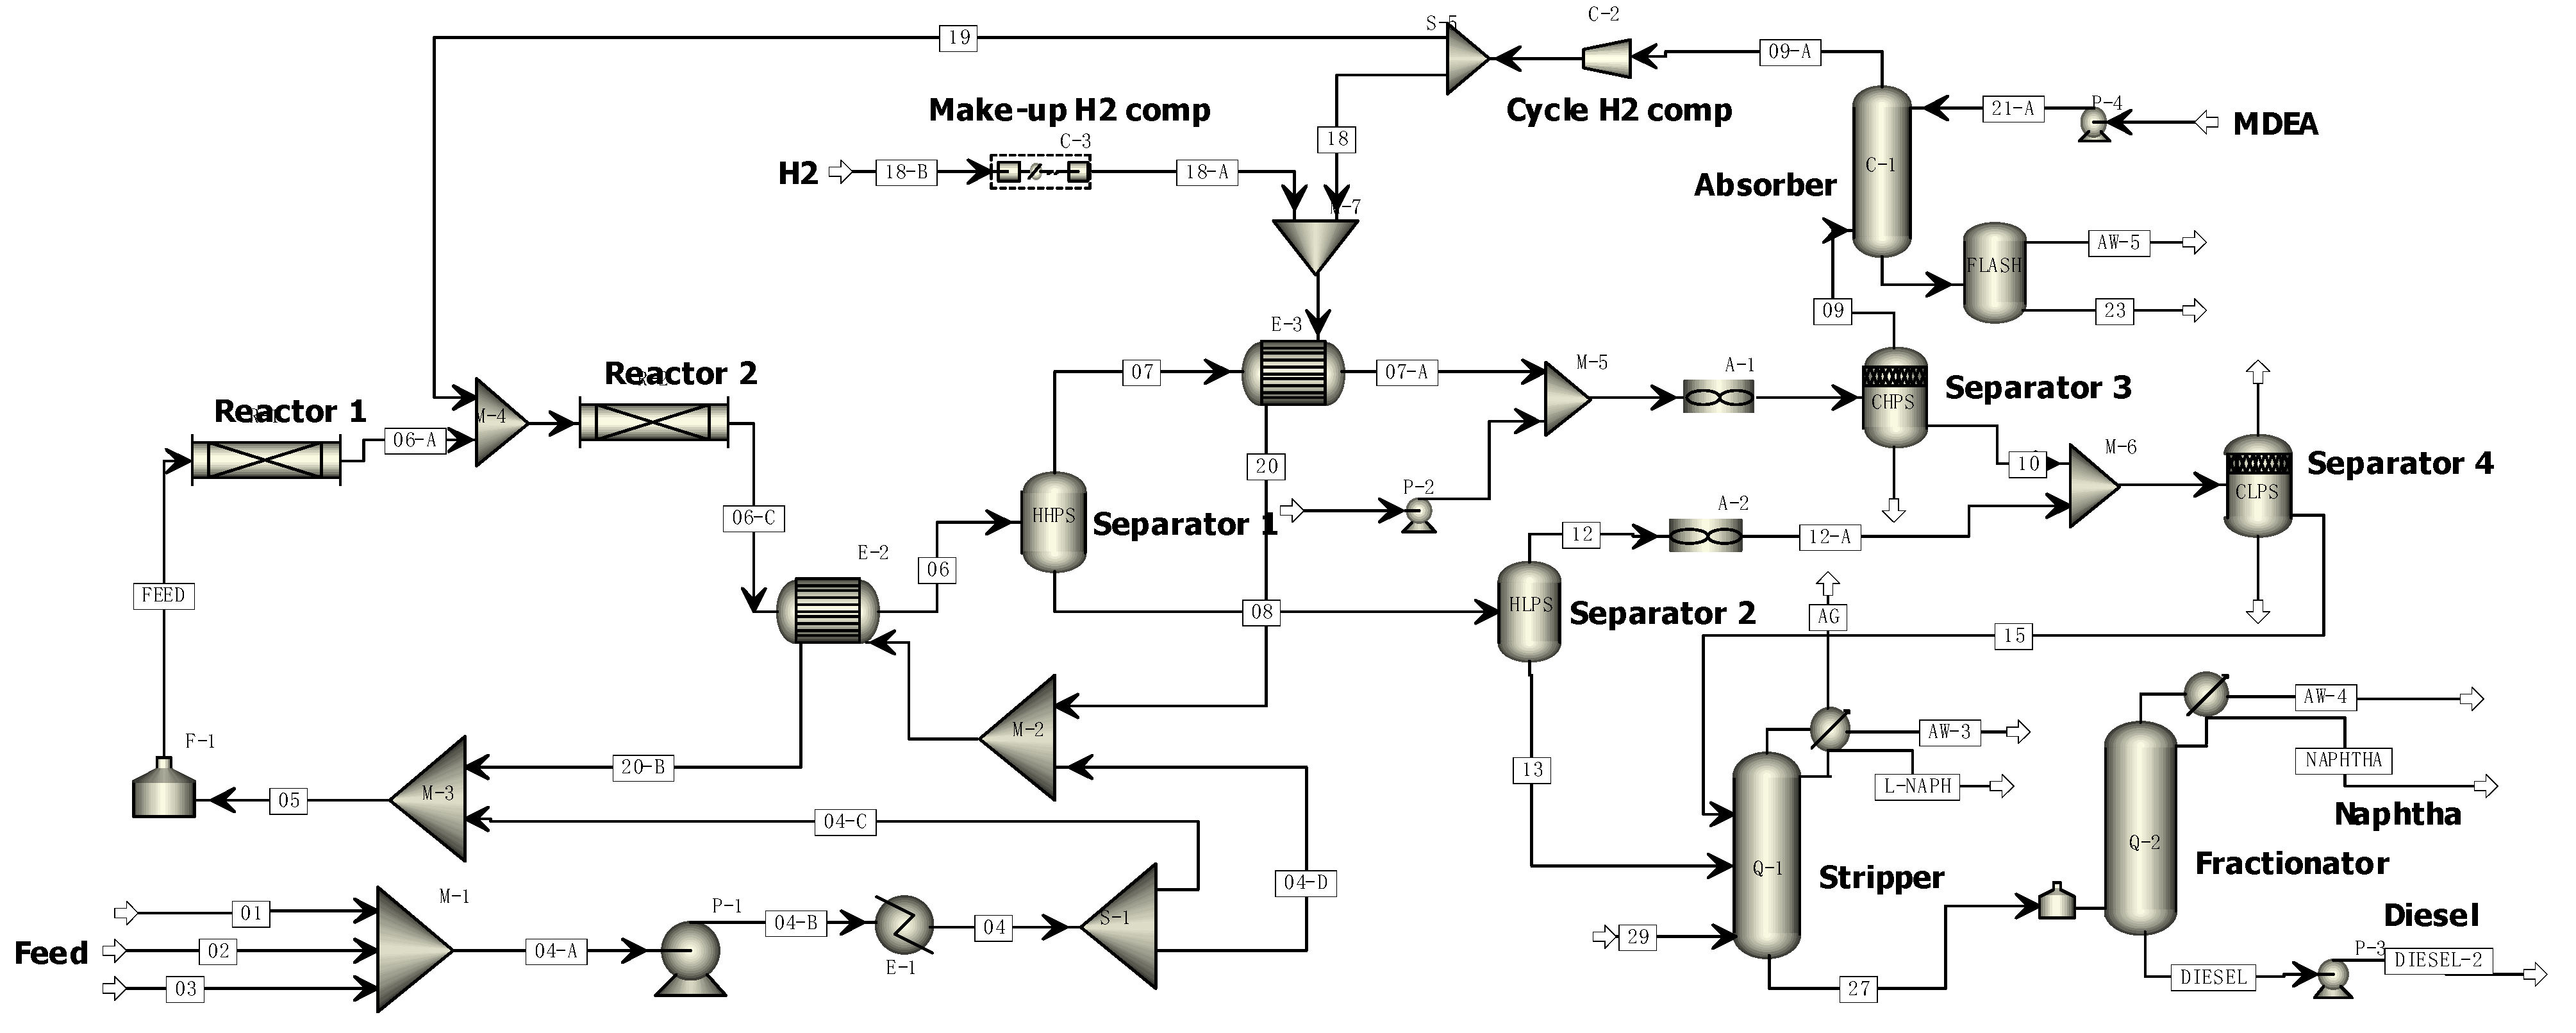
The whole process simulation of the diesel HDT unit in Aspen Plus is shown in Figure 2. The mixed feed oil composed of straight run diesel, coking gasoline, and coking diesel is pressurized by the feed oil pump, and then mixed with hydrogen after a heat exchange. The mixed feed enters the furnace to be heated to the required temperature for the HDT reactions, and then enters the first trickle bed reactor. Under the action of the catalyst, hydrodesulfurization, hydrodenitrogenation, and olefin hydrosaturation reactions are carried out. By injecting cold hydrogen at the inlet of the second bed (reactor 2), the reaction stream is cooled, and then enters the second bed for reaction. After cooling by a heat exchanger, the reaction effluent enters the hot high-pressure separator (separator 1), hot low-pressure separator (separator 2), cold high-pressure separator (separator 3) and cold low-pressure separator (separator 4) for three-phase separation. The separated hydrogen-rich gas phase is contacted with amine liquid in an absorber to remove impurities, such as hydrogen sulfide, it is then pressurized by a recycled H2 compressor, and then re-sent to the reactor for recycling. The liquid phase is passed through a steam stripper to desorb impurities, such as hydrogen sulfide and hydrogen dissolved in the oil phase. The bottom oil of the stripper is then fed in to a fractionator, the refined gasoline is pumped out from the top of the tower, and the refined diesel oil is extracted from the tower bottom and transported to the tank for storage.
3.4. Simulation Results and Comparison
Aspen Plus was used to simulate the process of a 3.2 million t/a diesel HDT unit. The comparison between the simulation results and the actual parameters is shown in Table 2, and the comparison between the product simulation parameters and the actual parameters is shown in Table 3 and Table 4, which show us the utility consumption comparisons.
According to Table 2, Table 3 and Table 4, it can be seen that the simulated values of the main operating conditions and main parameters of the diesel HDT unit simulation are basically consistent with the actual values, which indicates that the whole process simulation model of the diesel HDT unit established in this paper can accurately simulate the actual operation of the diesel HDT unit in actual production. Therefore, sensitivity analysis and energy consumption analysis of diesel HDT unit can be fairly carried out using this model simulation.
4. Results and Discuss
4.1. Effect of Reaction Temperature and Pressure on Product Quality and Energy Consumption
When the sulfur content of a refined diesel product does not meet the national regulations, the refinery can increase the desulfurization depth by adjusting the reaction temperature or pressure. Due to the different sensitivity of sulfur-containing compounds to temperature and pressure, the influence of adjusting temperature and pressure on the desulfurization depth of the reaction is not the same.
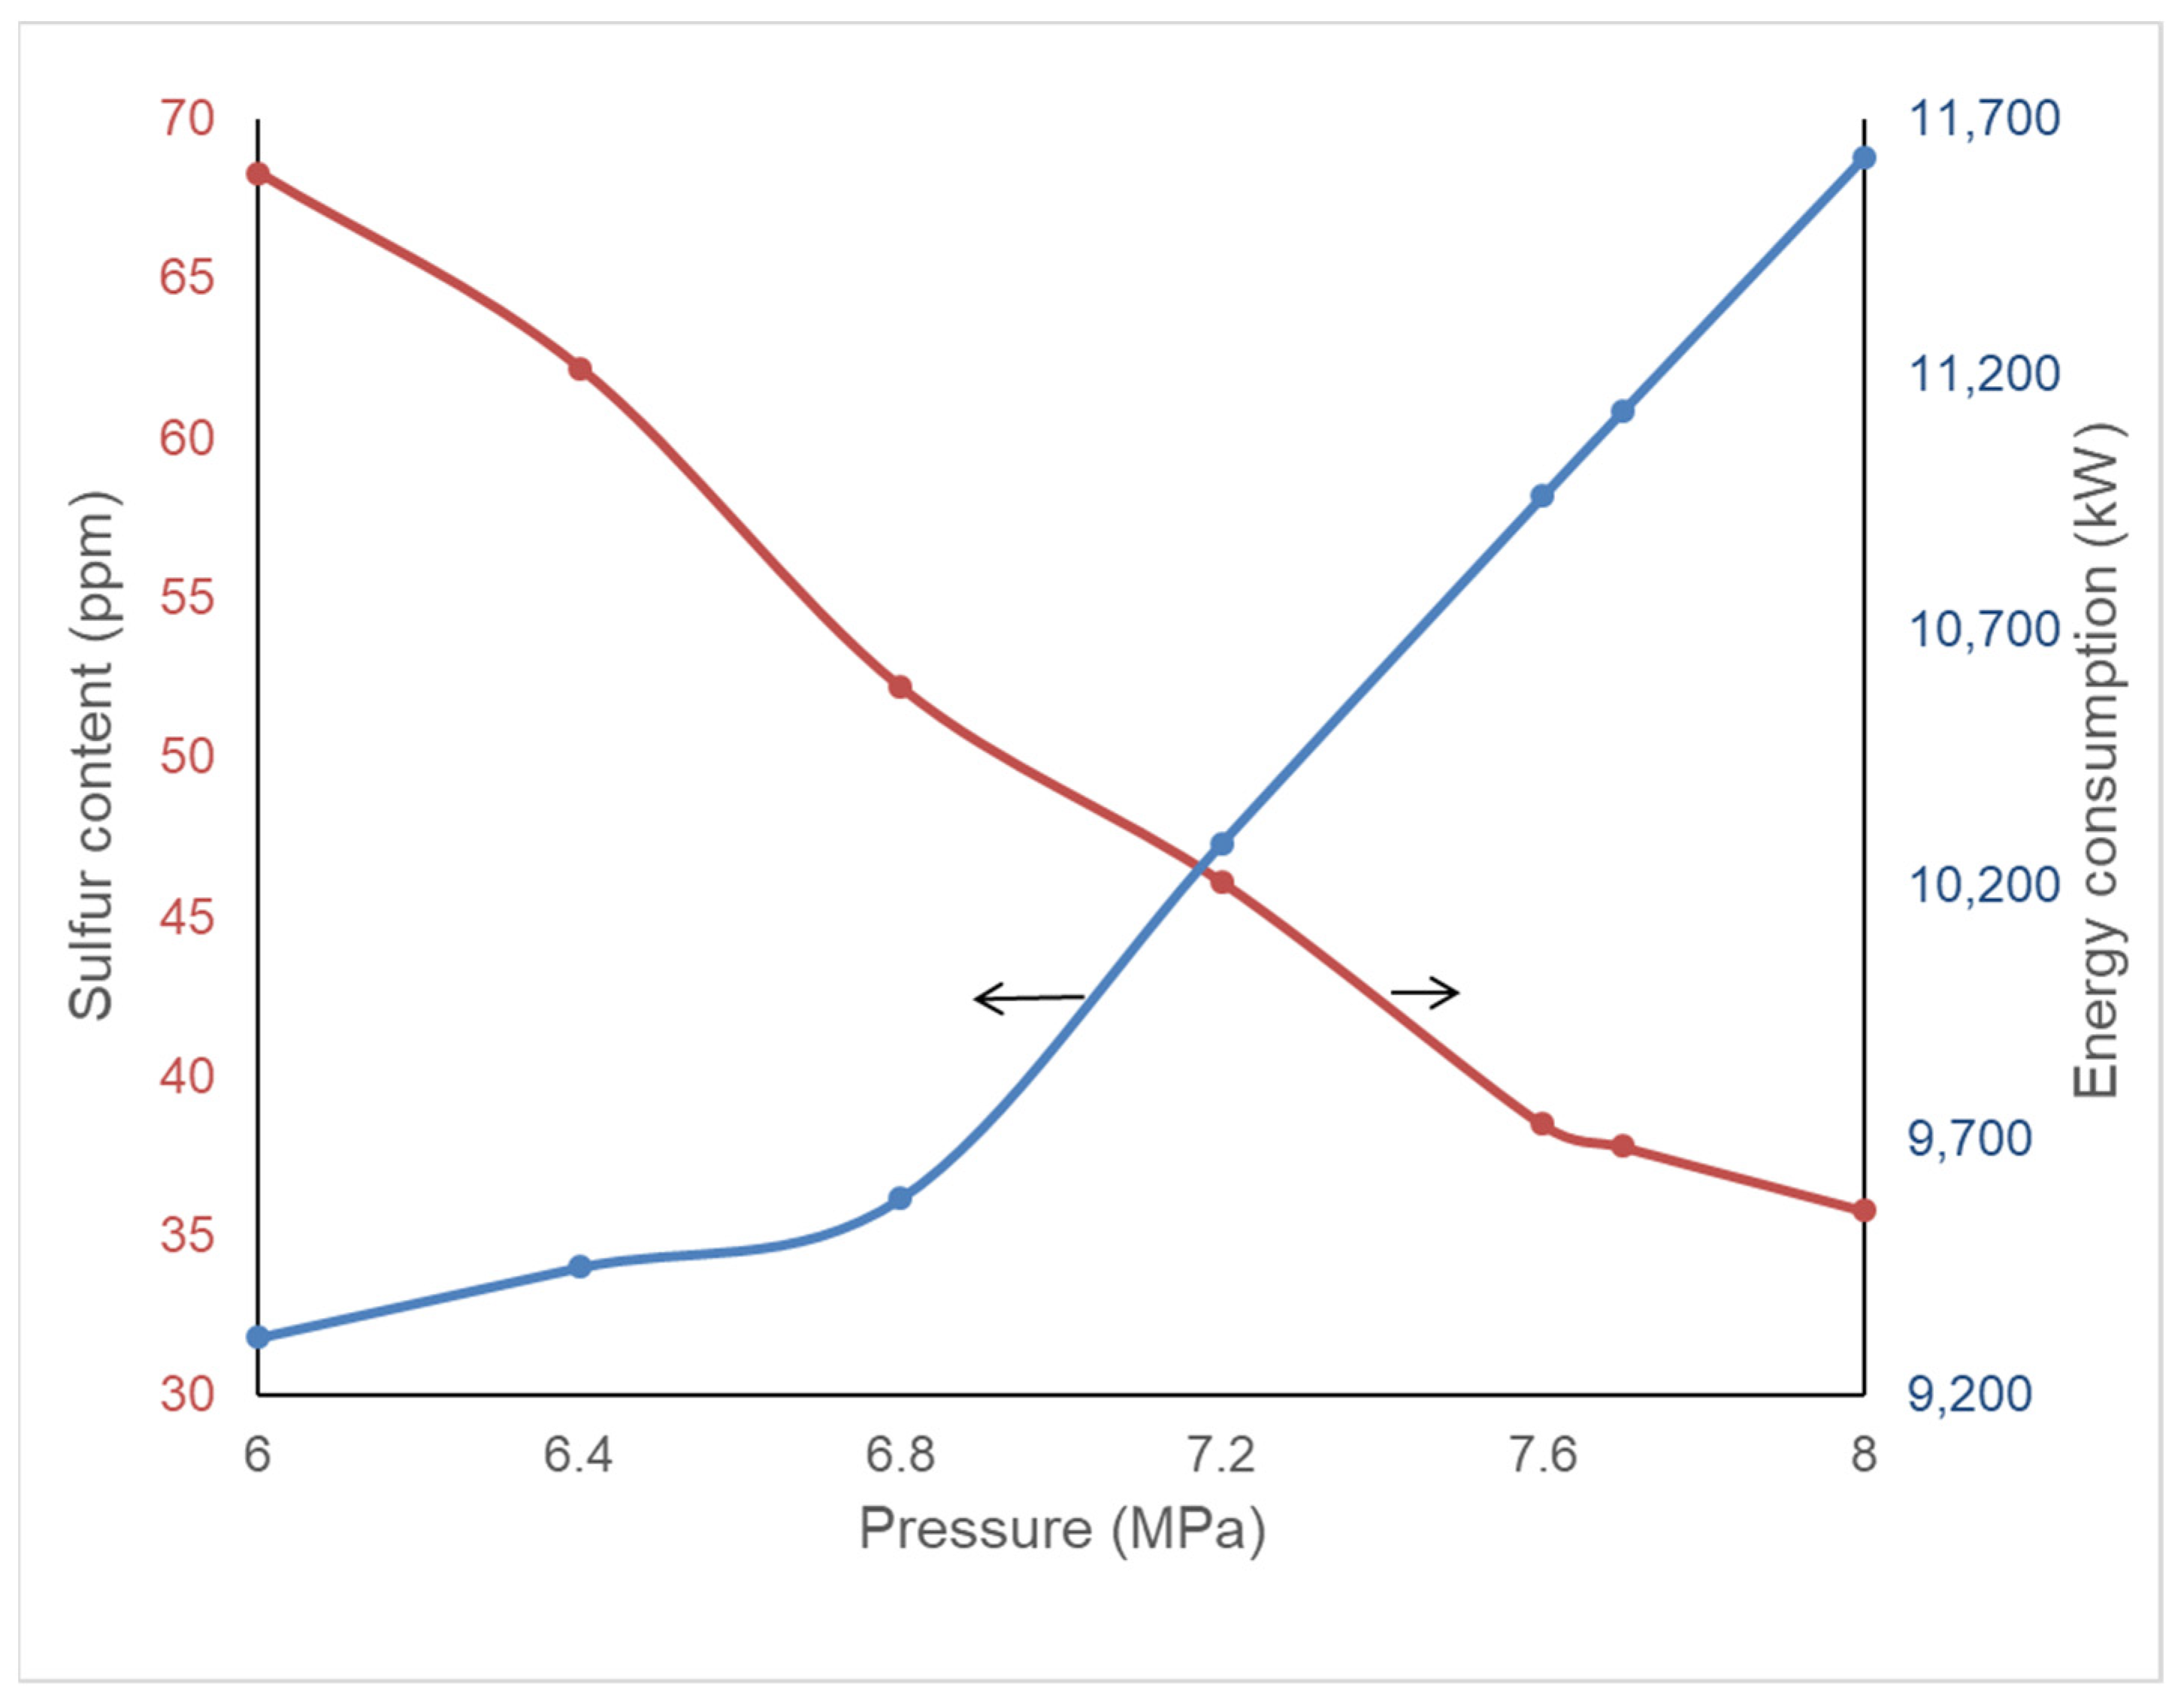
Therefore, in order to further analyze the influence of the operating conditions of the diesel HDT unit on the desulfurization process, based on the above Aspen’s whole process simulation model, this paper uses Aspen’s built-in sensitivity analysis function to obtain the influence of reaction temperature and pressure on the desulfurization depth. The influence of reaction temperature on desulfurization depth and energy consumption is shown in Figure 3, and the influence of reaction pressure on desulfurization depth and energy consumption is shown in Figure 4.
It can be seen from Figure 3 that when the reaction pressure is 7.7 MPa, the sulfur content of the diesel product decreases significantly with the increase of the reaction temperature in the range of 300–312 °C, while the sulfur content of the diesel product decreases slowly in the range of 312–320 °C. Different from the sulfur content, the comprehensive energy consumption of the diesel HDT unit also increases with the increase of the reaction temperature, and their relationship is linear. The main reason for this phenomenon is that the increase of temperature only affects the duty of the feed heating furnace, and the duty of the heating furnace is only related to the temperature.
As can be seen from Figure 4, when the reaction temperature is 318 °C, the sulfur content of the diesel product decreases significantly with the increase of the reaction pressure, and the energy consumption of the diesel HDT unit also increases. The relationship between the pressure and energy consumption is non-linear, which is different from the relationship between the temperature and energy consumption. The main reason is that much of the equipment is affected by pressure, including feed oil pump, make-up H2 compressor, and recycled H2 compressor.
4.2. Energy Consumption of the Operating Condition Boundaries
In order to further understand the energy consumption changes of the diesel HDT unit under the operation condition boundaries, the 37 ppm sulfur content of the diesel product is set as an example. Raising the pressure or temperature to the boundary of the conditions (i.e., pressure to 8 MPa, temperature to 320 °C), and adjusting another parameter to obtain the energy consumption of the HDT unit under the condition boundaries, the results are shown in Table 5 below.
It can be seen from Table 5 that under the pressure boundary conditions, the reaction temperature slightly decreases, the energy consumption of the heating furnace and recycled H2 compressor decreases, and the energy consumption of the feed oil pump and make-up H2 compressor increases. Under the temperature boundary conditions, the reaction pressure decreases noticeably, the energy consumption of the heating furnace and recycled H2 compressor increases noticeably, and the energy consumption of the feed pump and make-up H2 compressor decreases noticeably. By the comparisons of the comprehensive energy consumptions, the pressure boundary conditions can save more energy than the temperature boundary conditions.
5. Conclusions
In order to reduce the overall energy consumption of the diesel HDT unit, this paper simulates the diesel HDT unit in Aspen Plus based on the hydrogenation reaction kinetics, analyzes the influence of the operating conditions on the comprehensive energy consumption and sulfur content of the diesel products, and expounds the mechanism of the influence of operating conditions on energy consumption under the operation boundary conditions. The results show that with the increase of reaction temperature and pressure, the sulfur content of diesel products decreases and the energy consumption increases. In addition, this paper also analyzes the energy consumption changes under the operating condition boundaries when the diesel quality is unchanged. When the reaction pressure is 6 MPa and the reaction temperature is 320 °C, the comprehensive energy consumption is 13,804.77 kW, while when the reaction pressure is 8 MPa and the temperature is 317.5 °C, the comprehensive energy consumption is only 13,104.64 kW. Therefore, the quality of diesel products can be guaranteed and the comprehensive energy consumption of the diesel HDT unit can be further reduced by decreasing temperature and increasing pressure.
Author Contributions
Conceptualization, R.T. and L.W.; methodology, R.T.; validation, R.T. and W.X.; investigation, Y.L.; resources, Y.L. and J.T.; data curation, W.X.; writing—original draft preparation, R.T. and L.W.; writing—review and editing, R.T. and L.W.; visualization, R.T.; supervision, Y.L., J.T. and L.W.; funding acquisition, L.W. All authors have read and agreed to the published version of the manuscript.
Funding
The authors gratefully acknowledge funding by the project (22238006) sponsored by Natural Science Foundation of China (NSFC), the project (2021K007) sponsored by Opening Project of Guangxi Key Laboratory of Petrochemical Resource Processing and Process Intensification Technology Resource Recovery and the project (CXY-2021-130) sponsored by Production and Research Project of Yulin.
Data Availability Statement
Not applicable.
Conflicts of Interest
The authors declare no conflict of interest.
References
- Chen, S.; Feng, H.; Zheng, J.; Ye, J.; Song, Y.; Yang, H.; Zhou, M. Life Cycle Assessment and Economic Analysis of Biomass Energy Technology in China: A Brief Review. Processes 2020, 8, 1112. [Google Scholar] [CrossRef]
- Yang, K.; Liu, S.; He, C.; Zhang, B.; Chen, Q.; Pan, M. Improving energy saving of crude oil distillation units with optimal operations. J. Clean. Prod. 2020, 263, 121340. [Google Scholar] [CrossRef]
- Zhang, Y.; Li, Z.; Wang, Z.; Jin, Q. Optimization Study on Increasing Yield and Capacity of Fluid Catalytic Cracking (FCC) Units. Processes 2021, 9, 1497. [Google Scholar] [CrossRef]
- García-Sánchez, M.; Sales-Cruz, M.; Lopez-Arenas, T.; Viveros-García, T.; Pérez-Cisneros, E.S. An Intensified Reactive Separation Process for Bio-Jet Diesel Production. Processes 2019, 7, 655. [Google Scholar] [CrossRef] [Green Version]
- Liu, Z.; Deng, Z.; He, G.; Wang, H.; Zhang, X.; Lin, J.; Qi, Y.; Liang, X. Challenges and opportunities for carbon neutrality in China. Nat. Rev. Earth Environ. 2022, 3, 141–155. [Google Scholar] [CrossRef]
- Potrč, S.; Čuček, L.; Martin, M.; Kravanja, Z. Synthesis of European Union Biorefinery Supply Networks Considering Sustainability Objectives. Processes 2020, 8, 1588. [Google Scholar] [CrossRef]
- Yadav, A.; Roy, S.; Aijaz, T. Modeling of three-phase radial flow reactor for diesel hydrotreating. Chem. Eng. Sci. 2022, 257, 117713. [Google Scholar] [CrossRef]
- Wei, W. Energy saving measures and effect of hydrofining units. Pet. Refin. Eng. 2022, 52, 60. [Google Scholar]
- Al-Hadhrami, L.M.; Ahmad, A.; Al-Qahtani, A. Performance analysis of heat exchangers of an existing naphtha hydrotreating plant: A case study. Appl. Therm. Eng. 2010, 30, 1029–1033. [Google Scholar] [CrossRef]
- Zhang, B.; Chen, Q.; Hu, S.; Gu, W.; Hui, C.-W. Simultaneous optimization of energy and materials based on heat exchanger network simulation for diesel hydrotreating units. Chem. Eng. Res. Des. 2010, 88, 513–519. [Google Scholar] [CrossRef]
- Agbo, A.F.; Aboje, A.A.; Obayomi, K.S. Exergy analysis of Naphtha Hydrotreating Unit (NHU). J. Phys. Conf. Ser. 2019, 1299, 012025. [Google Scholar] [CrossRef]
- Bandyopadhyay, R.; Alkilde, O.F.; Upadhyayula, S. Applying pinch and exergy analysis for energy efficient design of diesel hydrotreating unit. J. Clean. Prod. 2019, 232, 337–349. [Google Scholar] [CrossRef]
- Sun, M.; Zhang, F.; Liu, X.; Sun, L. Heat Exchanger Network Retrofit of Diesel Hydrotreating Unit Using Pinch Analysis. China Pet. Process. Petrochem. Technol. 2021, 23, 34. [Google Scholar]
- Gabbar, H.A.; Aboughaly, M. Conceptual Process Design, Energy and Economic Analysis of Solid Waste to Hydrocarbon Fuels via Thermochemical Processes. Processes 2021, 9, 2149. [Google Scholar] [CrossRef]
- Samoilov, N.A. Mathematical Modeling and Optimization of Diesel-Fuel Hydrotreatment. Theor. Found. Chem. Eng. 2021, 55, 91–100. [Google Scholar] [CrossRef]
- Ahmad, M.I.; Zhang, N.; Jobson, M. Integrated design of diesel hydrotreating processes. Chem. Eng. Res. Des. 2011, 89, 1025–1036. [Google Scholar] [CrossRef]
- da Rocha Novaes, L.; De Resende, N.S.; Salim, V.M.; Secchi, A. Modeling, simulation and kinetic parameter estimation for diesel hydrotreating. Fuel 2017, 209, 184–193. [Google Scholar] [CrossRef]
- Kang, L.; Liu, Y. Design of flexible multiperiod heat exchanger networks with debottlenecking in subperiods. Chem. Eng. Sci. 2018, 185, 116–126. [Google Scholar] [CrossRef]
- De la Paz-Zavala, C.; Burgos-Vázquez, E.; Rodríguez-Rodríguez, J.E.; Ramírez-Verduzco, L.F. Ultra low sulfur diesel simulation. Application to commercial units. Fuel 2013, 110, 227–234. [Google Scholar] [CrossRef]
- Froment, G.F.; Depauw, G.A.; Vanrysselberghe, V. Kinetic modeling and reactor simulation in hydrodesulfurization of oil fractions. Ind. Eng. Chem. Res. 1994, 33, 2975–2988. [Google Scholar] [CrossRef]
- Houalla, M.; Broderick, D.H.; Sapre, A.V.; Nag, N.K.; De Beer, V.H.J.; Gates, B.C.; Kwart, H. Hydrodesulfurization of methyl-substituted dibenzothiophenes catalyzed by sulfided Co-Moγ-Al2O3. J. Catal. 1980, 61, 523–527. [Google Scholar] [CrossRef]
- Liang, X.; Liu, Y. Simulation of a Was oil Hydrotreating Unit and calculations of Hydrogen Consumption at Off-design Conditions. J. East China Univ. Sci. Technol. 2012, 38, 718–723. (In Chinese) [Google Scholar]
- Bej, S.K.; Dalai, A.K.; Adjaye, J. Comparison of hydrodenitrogenation of basic and nonbasic nitrogen compounds present in oil sands derived heavy gas oil. Energy Fuels 2001, 15, 377–383. [Google Scholar] [CrossRef]
- Cheng, Z.; Fang, X.; Zeng, R.; Han, B.; Huang, L.; Yuan, W. Deep removal of sulfur and aromatics from diesel through two-stage concurrently and countercurrently operated fixed-bed reactors. Chem. Eng. Sci. 2004, 59, 5465–5472. [Google Scholar] [CrossRef]
Figure 1.
Flowchart of a HDT unit (S1 to S4 mean separator 1 to separator 4).

Figure 2.
Aspen Simulation of a diesel HDT unit.

Figure 3.
Effect of reaction temperature (reaction pressure 7.7 MPa).
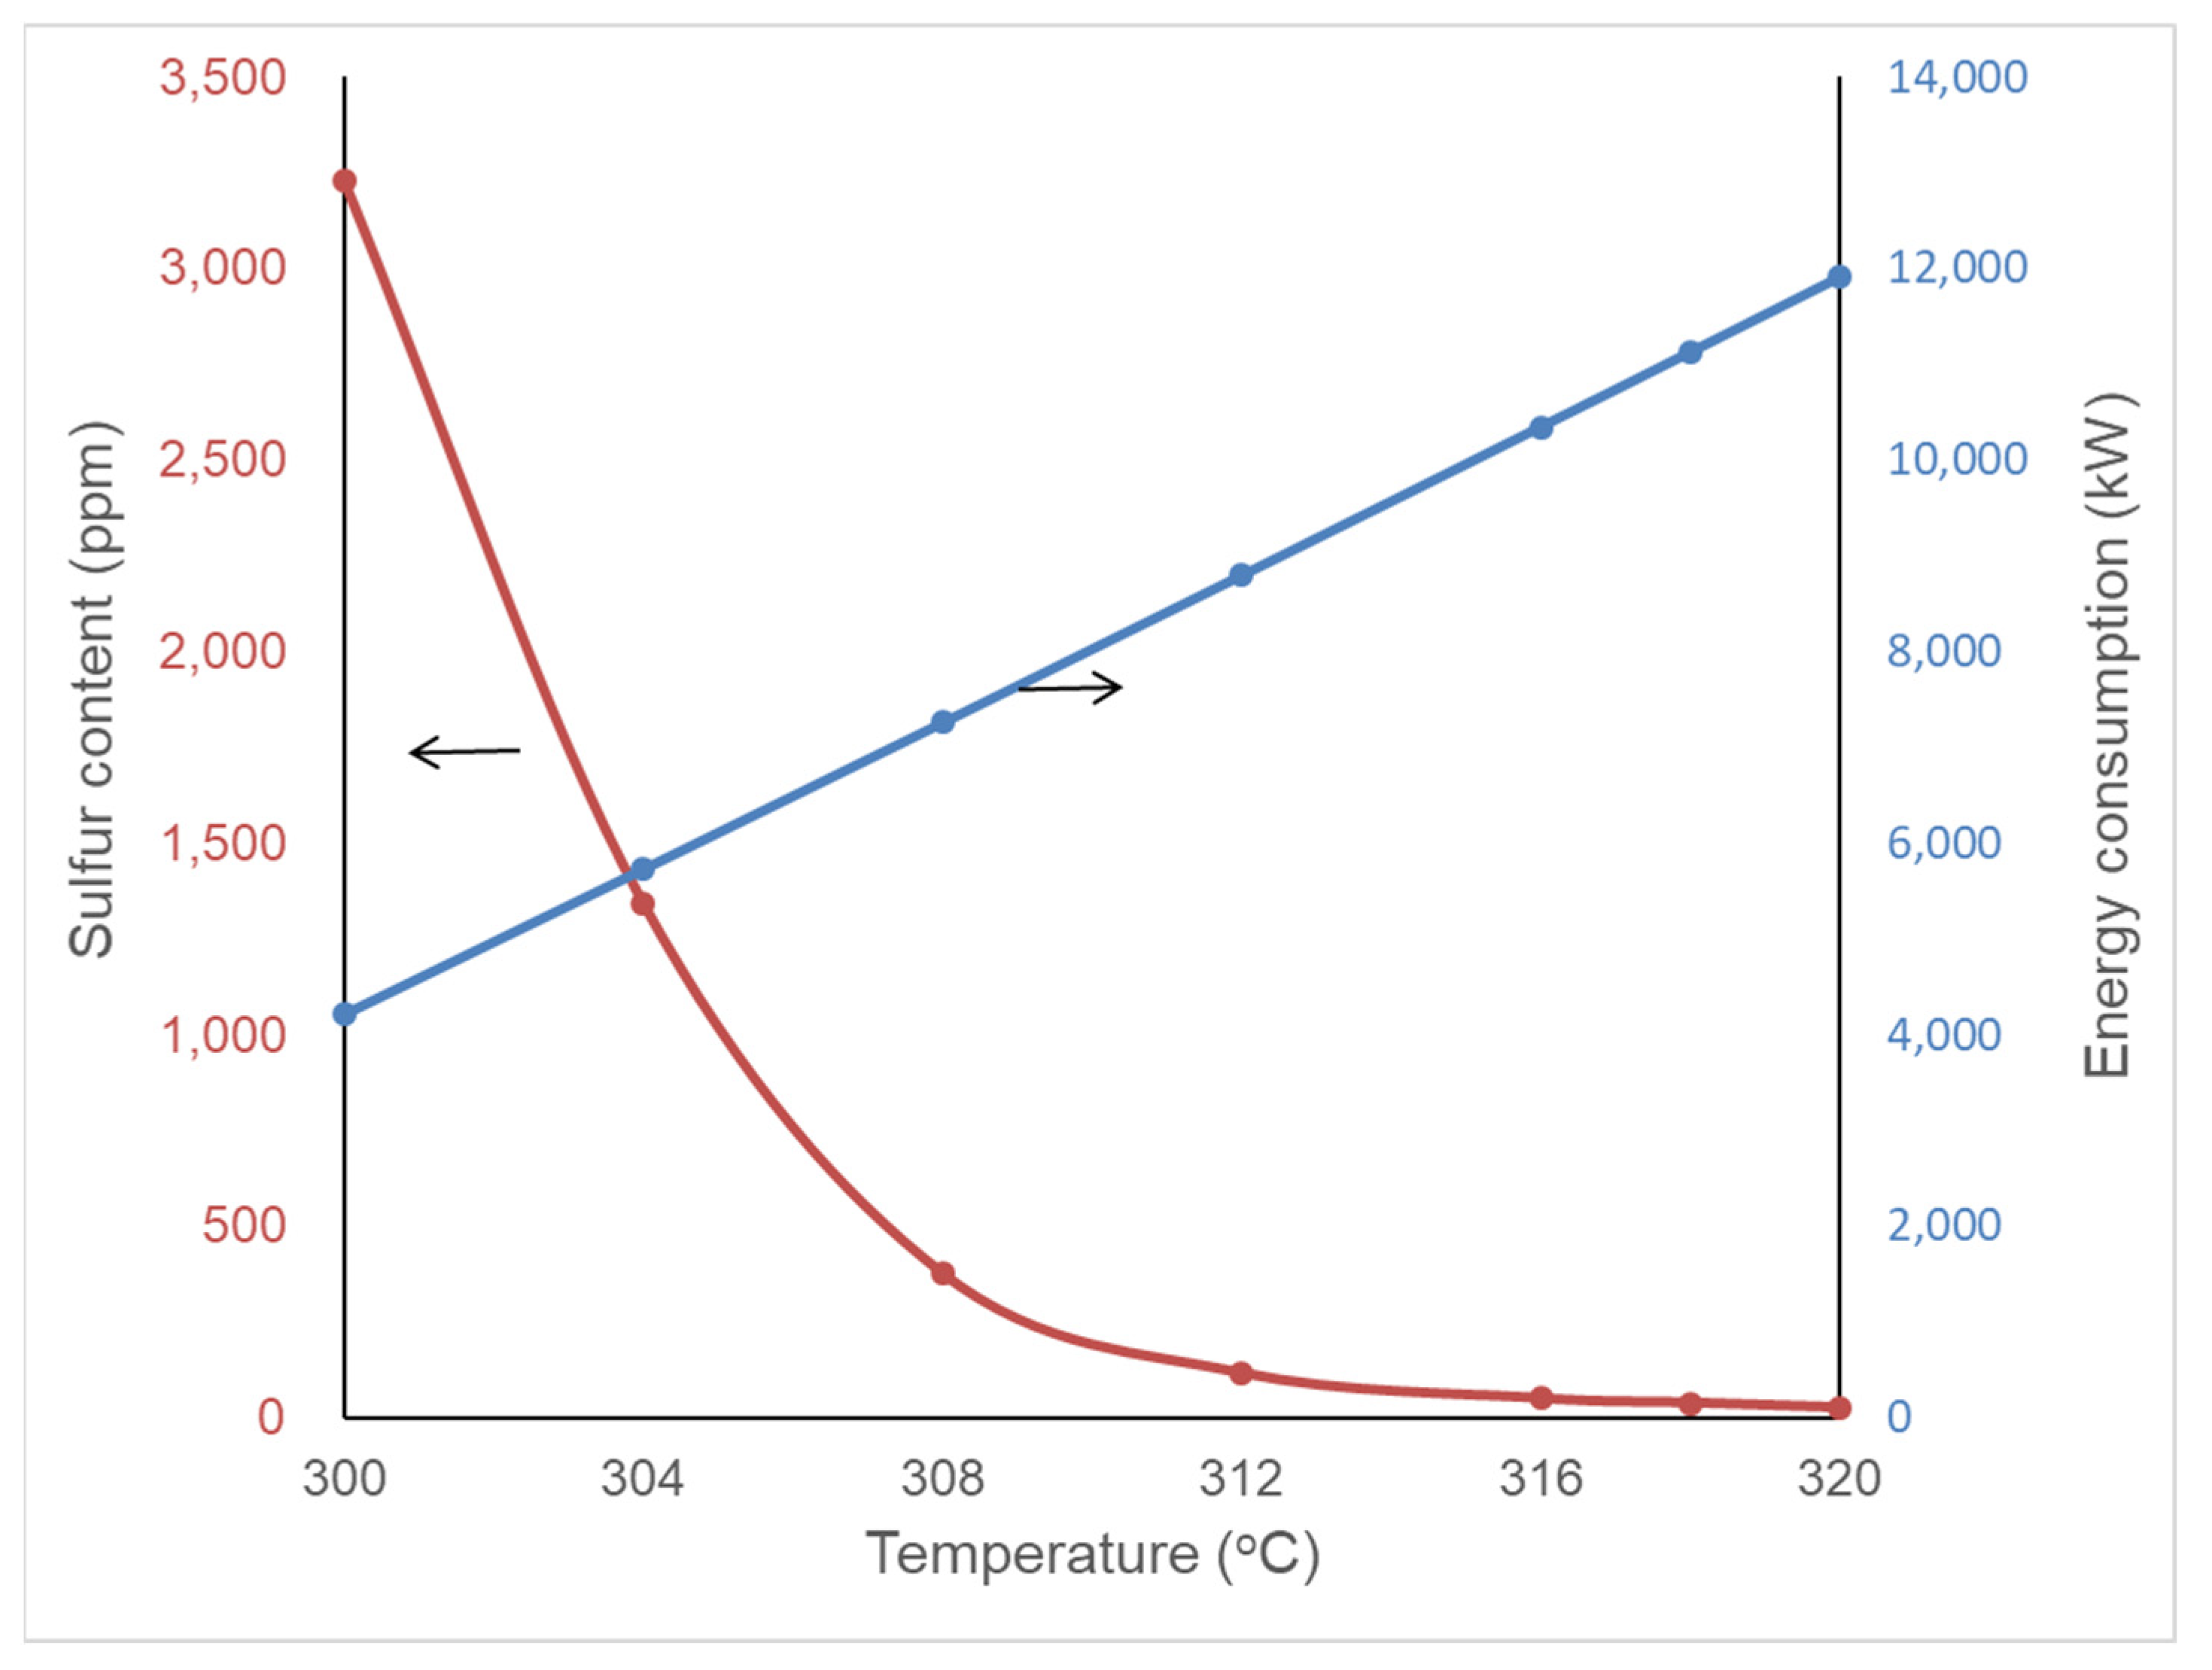
Figure 4.
Effect of reaction pressure (reaction temperature 318 °C).

Table 1.
Module selections in Aspen.
| Actual Equipment | Simulation Module | Operating Conditions 1 |
|---|---|---|
| HDT reactor | Rplug | 320 °C ≤ T ≤ 360 °C 6 MPa ≤ P ≤ 8 MPa |
| Make-up H2 compressor | Mcompr | T = 40 °C P = 2.1 MPa |
| Recycle H2 compressor | Compr | T = 50 °C P = 7 MPa |
| Separator 1, 2, 3, 4 | Flash2/Flash3 | T1 = T2 = 220 °C; T3 = T4 = 45 °C P1 = 7.2 MPa; P2 = 2.5 MPa; P3 = 7.1 MPa; P4 = 2.4 MPa |
| Absorber | RadFrac | P = 7.05 MPa |
| Stripper | PetroFrac | P = 0.8 MPa |
| Fractionator | PetroFrac | P = 0.7 MPa |
1 T denotes temperatures. P represents pressure.
Table 2.
Comparisons of main operating parameters.
| Reactor 1 (°C) | Reactor 2 (°C) | Pressure (MPa) | H2:Oil Ratio | Make-Up H2 (Nm3/h) | Fractionator (°C) | |
|---|---|---|---|---|---|---|
| Actuals | 318.0–343.0 | 335.0–355.0 | 7.7 | 300:1 | 33,443 | 161, 251, 302 1 |
| Simulation | 318.0–343.5 | 336.0–355.7 | 7.7 | 283:1 | 33,779 | 152, 251, 296 |
1 The temperatures represent the temperatures of the top, feed, and bottom stages, respectively.
Table 3.
Comparisons of feeds and products.
| Flowrate (tonne/h) | Density (kg/m−3) | Distillation Curves (°C) | S in Diesel (ppm) | N in Diesel (ppm) | ||||||||
|---|---|---|---|---|---|---|---|---|---|---|---|---|
| IBP 1 | 10 | 30 | 50 | 70 | 90 | FBP 2 | ||||||
| Feed 1 | Actuals | 283.2 | 789.1 | 253 | 256 | 269 | 285 | 307 | 327 | 341 | 14,900 | 42 |
| Simulation | 283.2 | 800.3 | 255 | 261 | 279 | 292 | 312 | 326 | 344 | 14,901 | 42 | |
| Feed 2 | Actuals | 40.9 | 683.5 | 48 | 74 | 96 | 117 | 138 | 159 | 181 | 7000 | 110 |
| Simulation | 40.9 | 686.7 | 46 | 73 | 98 | 118 | 139 | 165 | 183 | 7009 | 110 | |
| Feed 3 | Actuals | 56.8 | 790.2 | 188 | 214 | 242 | 272 | 302 | 331 | 350 | 26,000 | 750 |
| Simulation | 56.8 | 826.9 | 184 | 213 | 247 | 279 | 314 | 330 | 358 | 26,018 | 750 | |
| Diesel | Actuals | 333.7 | 618.5 | 188 | 231 | 252 | 274 | 297 | 330 | 355 | 40 | 15 |
| Simulation | 334.0 | 617.3 | 187 | 254 | 264 | 279 | 300 | 324 | 347 | 38.2 | 14.2 | |
| Gasoline | Actuals | 41.2 | 717.2 | 45 | 74 | 95 | 116 | 137 | 159 | 180 | <10 | <5 |
| Simulation | 38.1 | 706.4 | 45 | 87 | 99 | 119 | 137 | 160 | 183 | 0 | 0 | |
1 IBP denotes initial boiling point. 2 FBP represents final boiling point.
Table 4.
Comparisons of utility consumptions.
| S in Diesel (ppm) | Recycle H2 Compressor (kW) | Feed Oil Pump (kW) | Make-Up H2 Compressor (kW) | Furnace (kW) | |
|---|---|---|---|---|---|
| Actuals | 40 | 1960 | 2308 | 2836 | 6485 |
| Simulation | 38.2 | 1829 | 2277.07 | 2794.73 | 6315 |
Table 5.
Energy consumption of the operating condition boundaries.
| Temperature (°C) | Pressure (MPa) | S in Diesel (ppm) | Furnace (kW) | Feed Oil Pump (kW) | Make-Up H2 Compressor (kW) | Recycle H2 Compressor (kW) | Total Energy Consumption (kW) | |
|---|---|---|---|---|---|---|---|---|
| Original condition | 318 | 7.7 | 37.5 | 6316.3 | 2277.07 | 2794.73 | 1829.41 | 13,217.51 |
| Pressure boundaries | 317.5 | 8.0 | 37.1 | 6111.56 | 2354.7 | 2878.07 | 1760.31 | 13,104.64 |
| Temperature boundaries | 320 | 6.0 | 36.8 | 7334.68 | 1837.18 | 2271.62 | 2361.29 | 13,804.77 |
Publisher’s Note: MDPI stays neutral with regard to jurisdictional claims in published maps and institutional affiliations. |
© 2022 by the authors. Licensee MDPI, Basel, Switzerland. This article is an open access article distributed under the terms and conditions of the Creative Commons Attribution (CC BY) license (https://creativecommons.org/licenses/by/4.0/).
Share and Cite
MDPI and ACS Style
Tian, R.; Xu, W.; Li, Y.; Tian, J.; Wu, L. Energy Consumption Analysis of a Diesel Hydrotreating Unit Using an Aspen Simulation. Processes 2022, 10, 2055. https://doi.org/10.3390/pr10102055
AMA Style
Tian R, Xu W, Li Y, Tian J, Wu L. Energy Consumption Analysis of a Diesel Hydrotreating Unit Using an Aspen Simulation. Processes. 2022; 10(10):2055. https://doi.org/10.3390/pr10102055
Chicago/Turabian StyleTian, Ruijie, Weibin Xu, Yongchao Li, Jun Tian, and Le Wu. 2022. "Energy Consumption Analysis of a Diesel Hydrotreating Unit Using an Aspen Simulation" Processes 10, no. 10: 2055. https://doi.org/10.3390/pr10102055
Note that from the first issue of 2016, this journal uses article numbers instead of page numbers. See further details here.