Article

Method Development, Stability, and Pharmacokinetic Studies of Acyclovir-Loaded Topical Formulation in Spiked Rat Plasma

1
Department of Pharmaceutical Chemistry, College of Pharmacy, Prince Sattam Bin Abdulaziz University, Al Kharj 11942, Saudi Arabia
2
Department of Pharmaceutics, College of Pharmacy, King Saud University, Riyadh 11451, Saudi Arabia
3
School of Pharmaceutical Sciences, Lovely Professional University, Jalandhar 144411, Punjab, India
4
Department of Pharmaceutics, PCTE College, Ludhiana 142021, Punjab, India
*
Authors to whom correspondence should be addressed.
Processes 2022, 10(10), 2079; https://doi.org/10.3390/pr10102079
Submission received: 16 September 2022 / Revised: 5 October 2022 / Accepted: 9 October 2022 / Published: 14 October 2022

Abstract

:
Acyclovir (ACV) is a synthetic acyclic nucleoside analogue active against herpes simplex virus type 1 and 2 (HSV-1 and HSV-2). The current research entails optimization, development, and validation of the sensitive, accurate, and precise high performance liquid chromatography-photo-diode array detector (HPLC-PDA) bioanalytical method for quantification of ACV in rat plasma. The central composite design (CCD) of Design Expert (quality by design tool) was employed for identification of significant attributes (flow rate and concentration of buffer), which affected the performance of the developed method. The elution of ACV was achieved by separating the XBridge C18 column and the mobile phase comprising of the potassium dihydrogen phosphate buffer (pH-6.8) and acetonitrile in a 90:10 v/v ratio pumped at a flow rate of 1.0 mL/ min. The method was validated as per International Council for Harmonization (ICH) guidelines in terms of selectivity, linearity, recovery, accuracy, and precision. The values of the lower limit of detection and the lower limit of quantification were found to be 30 and 100 ng/mL, respectively. Conclusively, the study showed superior performance with high robustness, sensitivity, and specificity of the developed bioanalytical method. The developed quantification method was applied for estimating pharmacokinetic (PK) parameters of ACV loaded vesicular systems (ethosomes, elastic liposomes, colloidal solution, and solution) transdermally applied to rat skin (using a previously published report). The method was successful in quantifying PK profiles for comparative assessment with a high robustness, re-validity, re-transferable, and simplicity approach.

1. Introduction

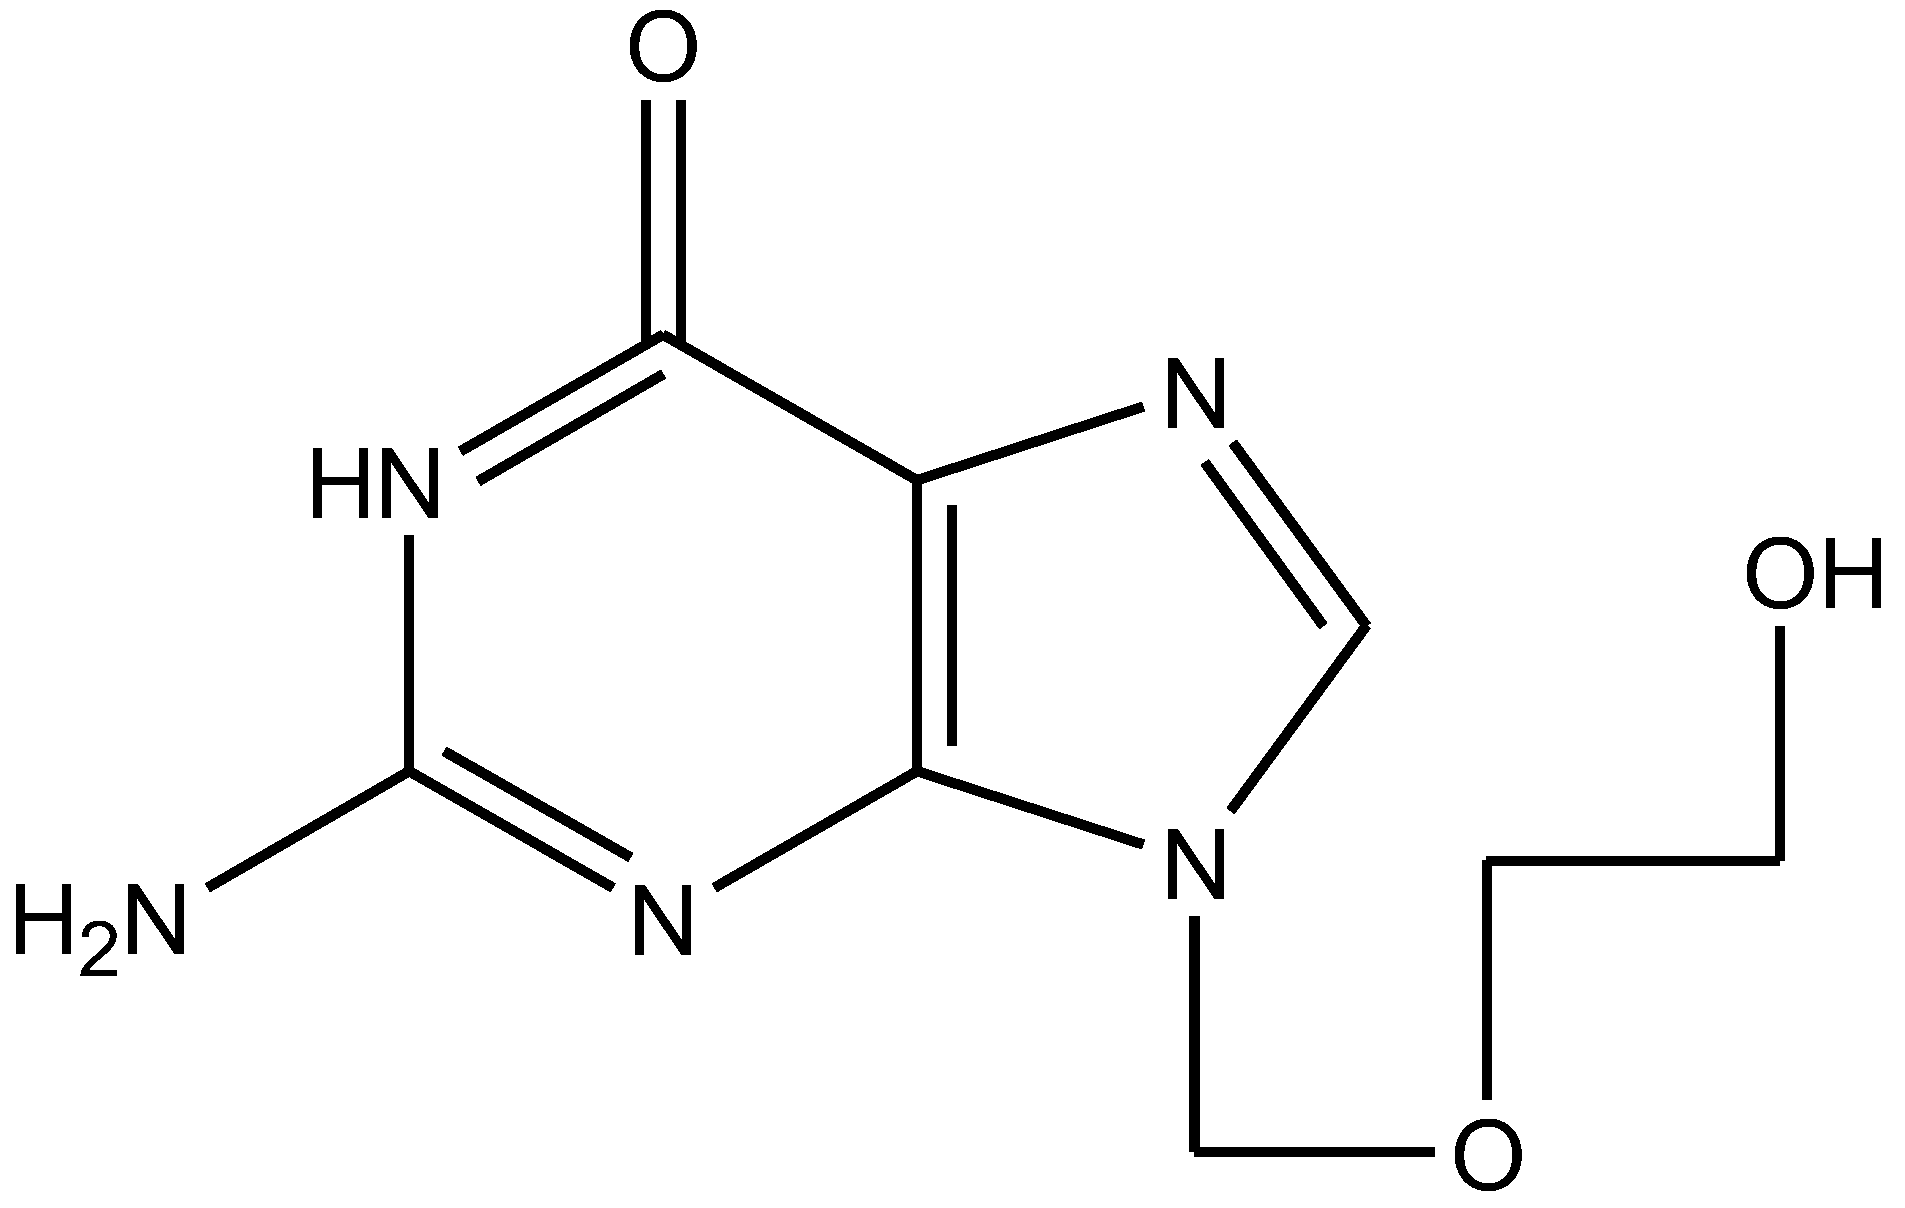
Acyclovir (ACV) 9-[(2-hydroxyethoxy)-methyl]-guanosine, is an acyclic guanosine derivative (Figure 1), which exhibits a selective inhibition of herpes virus replication with potent clinical anti-viral activity against the herpes simplex virus (HSV) and varicella-zoster viruses [1]. The Food and Drug Administration (FDA) approved treatment of genital herpes and HSV encephalitis [2]. ACV is the first-line treatment for HSV encephalitis. Currently, there are no other medications indicated for the treatment of this condition [3]. ACV incorporates itself into viral deoxyribonucleic acid (DNA), preventing further synthesis as it inhibits DNA synthesis and viral replication after it is converted to acyclovir triphosphate by viral and cellular enzymes and is available in both oral and intravenous doses [4].
The analysis method is a quantitative measurement of ACV in biological fluids, such as plasma, serum, urine, or tissue extracts [5]. Chromatography is an analytical method, wherein mainly high-performance liquid chromatography (HPLC) is widely used for quantification of pharmaceutical ACV in biological samples. The HPLC method is considered as an advanced analytical technique of liquid chromatography (LC), a technique of high precision, sensitivity, and specificity in the quantification of components [6]. HPLC allows the quantification of the targeted drug independently from blood and its metabolites in a very short span of time. Different HPLC methods were published for determination of acyclovir in human serum using a UV detector [7,8]. Development of the bioanalytical method is to provide an assessment and evaluation of ACV bioavailability (in plasma). All components (parameters) were selected for the analysis of a considerably high concentration (Cmax) of the ACV in plasma. Furthermore, this bioanalytical method can be useful in tissue distribution, toxicity (toxicokinetics), and drug therapeutic monitoring. The chromatography technique involves steps such as (i) plasma separation, (ii) preparation, (iii) extraction, (iv) selection of suitable organic/inorganic solvents, and (v) analyte separation and its validation [9].
Over the years, several methods were reported with the quantification of ACV in biological systems, employing RP-HPLC, ultra-filtration HPLC, fluorescent techniques, Raman spectroscopy, micellar electrokinetic chromatography, and UV spectroscopy [10,11,12,13,14,15,16,17]. However, these methods are inefficient and uneconomical due to the use of high-cost solvents or complicated buffers with low active ACV detection limits. This manuscript addressed the quantification of ACV using HPLC with photo diode array (PDA) and integrating the quality by design (QbD) tool for high robustness, ruggedness, and flexibility. A QbD approach is a systemic step for the method development with predefined objectives and an understanding of product and process variables (process controls) based on the sound science and quality risk management, in order to achieve a high quality product, flexible process, regulatory flexibility, and improvement [18]. Analytical science is an integral part of pharmaceutical product development and is defined as a science and risk-based paradigm to understand predefined objectives and critical process variables. This results in the intended outputs over the entire product life cycle [19]. Thus, a QbD approach is used to reduce time and energy to revalidate, redevelop, and retransfer while tech transfers.
This method was optimized and validated in accordance with the FDA guidelines. The developed method gives better recovery from plasma (>90.0%), and a very low detection limit (LLOD; 50 ng). The study aimed to apply QbD analytical science to understand the critical process variables and set low-risk analysis with high robustness and analysis flexibility during method development of ACV throughout the product development life cycle. To optimize process parameters for simplified application and cost reduction, it was interesting to apply the quality by design tool (software) in the method development and validation not reported so far for the drug (ACV in biological matrix) [20,21]. This will avoid unnecessary use of organic solvents in method development, suitable to scale up for large-scale industrial analysis, easy revalidation, high robustness, and rapid tech transfer at low energy and in a short time.
Furthermore, LLOD from earlier published reports were 1.06 µg/mL and 156 ng/mL [22,23]. The novelty and uniqueness of the current study employs an integrated method of experimental designs and simulations to determine the appropriate chromatographic method for the drug analysis in biological samples. Moreover, in silico solubility analysis was carried out of ACV in various solvents using Hansen solubility parameters (HSP) for the confirmation of components of the mobile phase. In this study, we addressed the HPLC method development for quantification of ACV in rat plasma and subsequently, the pharmacokinetic study of transdermally applied vesicular systems (elastic liposomes and ethosomes) (previously published) (ELP3, ETHO2, ELP3 gel, and ETHO2 gel) [22]. Bioanalytical method validation, along with design expert and in silico model of solubility tools, were extensively employed in the development of an accurate, sensitive, specific, and precise HPLC method with a PDA detector.

2. Materials

ACV (99.8 % pure) was obtained as a kind gift sample from Cipla Pharmaceuticals (Mumbai, Maharashtra, India). Analytical grade potassium dihydrogen phosphate was purchased from S.D. Fine Chemicals Ltd. Mumbai, Maharashtra, India. Acetonitrile, ethyl acetate and methanol HPLC grade were obtained from Sigma-Aldrich, Mumbai, India. HPLC-grade triple distilled water was prepared by using Milli-Q system, Millipore, Chandigarh, Punjab, India.

3. Methods

3.1. Estimation of Hansen Solubility Parameters (HSP) for Determination of Maximum Solubility for Mobile Phase Selection

The drug is poorly soluble in water due to lipophilic nature and nucleoside analogue. The HSPiP program (version 5.02.6, UK) was used to predict the most suitable solvent for analytical purposes. In general, Hansen solubility parameters are based on the physicochemical nature of solute and solvent in terms of dispersion, polarity, and hydrogen bonding formation capacity. These properties are innate in a molecule due to functional groups (number of hydrogen bonding acceptor counts and hydrogen bonding acceptor counts). The idea of solubility parameters was first discovered by Hildebrand and Scott by considering the solute behavior in a specific solvent [24,25]. Hansen expressed these three interactive forces of dispersion, polarity, and hydrogen bonding capacity as δd, δp, and δh, respectively. The total cohesive force (δt) of solute or solvent was the sum of the square of these forces, as in Equation (1).
t]2 = [δd]2 + [δp]2 + [δh]2
Experimental solubility of ACV was carried out using a shaker water bath at 30 °C. In brief, a weighed quantity of the drug was added to a 5 mL of solvent contained in a clear glass vial. The vial was tightly closed and placed in the water bath at a constant temperature. Saturated solubility was conducted for 72 h to attain equilibrium in each solvent. After achieving equilibrium, the mixture was filtered and the filtrate was used for the drug assay using a UV Vis spectrophotometer (Shimadzu U-1800, Tokyo, Japan) at 256 nm. Experiments were replicated to get mean and standard deviation.

3.2. Instrumentation and Chromatographic Conditions

The HPLC system consisted of a separation module (Alliance e2695, Waters, Waters Corporation, 34 Maple street, Milford, MA, USA), an auto-sampler, a thermostat, and a 2998 photodiode array (PDA) detector. The HPLC method development and validation was carried out using a C18 column (130 × 3.6 mm, 5 µm; Waters, India). The composition of the mobile phase was potassium dihydrogen phosphate (pH 6.8): acetonitrile (ACN) in a 90:10 ratio operating in isocratic mode. The drug was detected in the wavelength range of 200–400 nm using a PDA detector and maximum detection was obtained at 256 nm. Furthermore, analytical data were processed employing Empower 2 (Waters) software (Waters Corporation, Milford, MA, USA).

3.3. Sample Preparation (Extraction Method)

Wistar rats of either sex weighing around 200–220 g were used for pharmacokinetic and validation purposes. The study protocol was approved (PCTE/LDH/1370/2013) by the Institute Animal Ethics Committee of the PCTE Institute of Pharmacy, Ludhiana, Punjab, India. The HPLC method development and validation experiments were started after taking blood from the retro-orbital plexus of eye, and the plasma was separated by cold centrifuge at 2000 rpm for 10 min. After centrifugation supernatant (plasma) was separated out and methanol was added for protein precipitation (settled down) and the remaining (clear supernatant) blank plasma was stored at −20 °C. A stock solution of ACV was prepared by dissolving the drug in methanol and ACV samples in plasma were prepared by spiking with 10 μL of each of the appropriate working dilutions of ACV, followed by vortexing it, and resulting plasma sample concentrations were in the range of 100–1000 ng/mL. These samples were subjected to HPLC analysis by injecting 10 µL of sample into the injection port. The AUC for each peak obtained was plotted against concentration to make the standard curve of ACV in plasma [26]. Furthermore, quality control (QC) samples at various (three) concentration levels (lower QC, middle QC, and higher QC for ACV (200, 500, and 1000 ng/mL)) were prepared by diluting the stock solutions in an appropriate volume of mobile phase.

3.4. Screening Studies (Pre-Optimization)

Seven factors at two levels of the Taguchi design (Table 1) were tried, and finally, two factors (at three levels) were employed in Design Expert (Stat-Ease Inc., 1300 Godward St NE #6400, Minneapolis, MN, USA). Several variables of Taguchi design (injection volume, flow rate, pH of buffer, ACN concentration, buffer concentration, and sampler temperature) at different levels viz. (−1) low and (+1) high were used to investigate the prime factor affecting analysis resolution in HPLC peak. Half normal and pareto charts were obtained, which revealed factors that most significantly influenced the method validation [27]. Acyclovir is a chemically purine nucleotide (weak acid and basic groups) with slight aqueous solubility (insoluble in alcohol). The drug is associated with two pka values (pka = 2.52 and pka = 9.35) and classified as an ampholytic drug due to the dependency of solubility at ionization constant and medium pH [28]. Therefore, we considered several deciding factors, such as (a) injection volume, (b) flow rate, (c) pH of buffer, (d) ACN concentration, (d) buffer concentration, and (e) sampler temperature (temperature dependent solubility), which were responsible for having an impact on process development for analysis. In order to minimize the variability around the analysis process, the Taguchi model (a robust design) was used as a tool to determine sets of controllable factors among these. To achieve a range of major factors, these were selected and each factor was assessed by keeping constant in other trial runs. This provided us buffer concentration and flow as prime factors affecting peak intensity for remarkable resolution and flow rate to obtain at an optimized time point. Other factors, such as column temperature, ACN content, and injection volume, had no impact on the resolution of the characteristic peak. Notably, increase in injection volume proportionally increased peak height and broad base. These were used as input factor parameters for central composite design (CCD) design.

3.5. Optimization Studies

Two factors (flow rate and buffer concentration) at three levels (low, medium, and high) in the central composite design (CCD) were finally selected to study the effect of significant factors/variables, which directly influence the responses/attributes. Thirteen runs with three levels were carried out at low (−1), medium (0), and high (+1) levels employed during each experimental run of the CCD matrix (Table 2).

3.6. HPLC Method Validation

The quantitative method validation was in accordance with ICH Q2 (R1) guidelines. The optimized chromatographic method was validated for the parameters, such as linearity, accuracy, precision, sensitivity, and system suitability with lower limit of detection (LLOD) and lower limit of quantification (LLOQ) [29].

3.7. Linearity and Range

Linearity was established in rat plasma by spiking the amount of ACV and appropriate dilutions were made with the mobile phase, ranging from 100 to 1000 ng/mL as working concentrations. Dilutions were passed through syringe filters (0.2 mm) before injecting into HPLC. The calibration curve was plotted using peak area (area under curve: AUC) vs nominal concentration. Data analysis was carried out using the linear regression method.

3.8. System Suitability

The suitability of the developed HPLC method of ACV was performed by determining the peak area after injecting MQC of medium QC (500 ng/mL) (without spiking in to rat plasma). AUC value was compared with mean value obtained for the MQC injections (n = 3) [30].

3.9. Method Specificity

Blank plasma (without ACV) samples were prepared with a suitable volume of mobile phase and the samples were directly filtered into HPLC vials. The vials were kept in an auto sampler tray and were injected (10 µL) into HPLC and screened for any interfering peaks corresponding near the retention time exhibited by ACV.

3.10. Plasma Recovery

Recovery of ACV from spiked rat plasma was determined at three different concentration levels (400, 600 and 800 ng/mL). HPLC analysis was performed in triplicate (n = 3) for each of the drug concentrations and the extraction efficiency was determined (mean ± SD) [30,31,32].

3.11. Method Sensitivity

The lower limit of quantification (LLOQ) and lower limit of detection (LLOD) were determined by injecting series of known concentrations of ACV to observe the signal-to-noise ratio (S/N).

3.12. Precision and Accuracy

Precision and accuracy were evaluated by inter-day and intra-day spiking of a predetermined concentration of ACV in a plasma sample. Relative standard deviation (%RSD) of the observed values was used as parameter of precision. Samples were prepared at different concentrations (LQC: 200 ng/mL, MQC: 500 ng/mL and HQC: 800 ng/mL). Precision and accuracy were evaluated over a period of three days (inter-day) using replicate (n = 3) determinations for the spiked plasma samples, whereas precision and accuracy were assessed on three separate occasions (intra-day) on the same day (n = 3) for each concentration. Relative standard deviation (%RSD) of the observed values was used as an index of precision [32].

3.13. Robustness

The robustness of the bioanalytical method was evaluated by altering the chromatographic conditions, such as flow rate and composition of mobile phase, and their effects were observed on each of the responses (peak area and peak retention time) at different quality control samples (200, 500, and 800 ng/mL).

3.14. Stability in Plasma

The stability of ACV in plasma was evaluated at two different concentrations (500 ng and 1000 ng/mL). Briefly short-term stability at ambient temperature (30 °C) for 2 h, freeze-thaw cycles (4 °C) for 24 h, and long-term stability (30 days) at −20 °C were carried out. The stability of ACV in human plasma was also investigated for three freeze–thaw cycles. A stability experiment was carried out in triplicate (n = 3) to estimate mean ± SD.

3.15. Vesicular Formulations (Ethosomes and Elastic Liposomes) for Transdermal Applications

In our previous report, we prepared, optimized, and explored mechanistic perspective of ACV-loaded elastic liposomes and ethosomes [22]. These reported formulations were ETHO3 (ethosomal formulation), ELP3 (elastic liposomes), ETHO3-gel (respective gel), ELP3 gel (respective gel), and ACV-solution (ACV-sol). A summary of composition and respective characteristic parameters is presented in Table 3. It is noteworthy that elastic liposomes were composed of PC (phosphatidylcholine) and span 80 (low HLB = 4.3), whereas ethosomes were composed of PC and cholesterol. Propylene glycol and ethanol in a suitable ratio served as a good plasticizer of vesicular membranes of both vesicular systems. Carbopol gel served as carrier for colloidal suspensions (both vesicular systems). ACV was solubilized in 5% dimethyl sulfoxide (DMSO) solution to use as control for comparative assessment.

3.16. In Vivo Quantification of ACV (Pharmacokinetic Study)

The purpose of the present method validation was to carry out a bioavailability study in rat plasma using developed HPLC-PDA method. The animal study was carried out in Wistar albino rats weighing about 200–220 g of both sexes and experimental protocol was approved (approval number PCTE/LDH/1370/2013) by the Institute Ethics Committee of Punjab (PCTE Institute, PTU, Punjab), dated 7 February 2013, India (continuous work of the previous project) [22]. Animals were randomly distributed and divided into four different groups (n = 3 per group). The rats were inspected properly to check any possible abnormality at the site of application. The dorsal part was used to apply ACV formulations over a circle (2 cm2) on each rat and the area was properly trimmed for removing hairs. After 24 h of trimming, formulations (ELP3, ETHO2, ELP3 gel, and ETHO2 gel) containing ACV (0.5% w/v) were applied with an equal concentration and dose strength (2.5 mg/0.5 mL) [22]. Blood (1 mL) was withdrawn at varied time intervals (0, 1, 2, 4, 8, 12, and 24 h) followed by cold centrifugation and extraction, and samples were subjected to HPLC analysis for quantification of ACV. Several pharmacokinetic parameters, such as area under the curve (AUC), the maximum drug concentration (Cmax), and the time required to attain Cmax as Tmax, were determined.

3.17. Statistical Analysis

All experiments were replicated to get mean and standard deviation (n = 3). In statistical analysis, significance was expressed at p ˂ 0.05 and ANOVA (analysis of variance) was applied wherever was required to apply for data analysis in the calculation. For optimization of process variables, Design of Expert software (version 6.0.0, Sate-Ease Inc., Minneapolis, MN, USA) was used. Moreover, graphical presentation was performed using the GraphPad Prism software trial version. HSPiP software (version 5.2.06, UK) was used estimate various Hansen solubility parameters.

4. Results and Discussion

4.1. Estimation of Hansen Solubility Parameters Using HSPiP Software

As a preliminary selection of solvent for preparing suitable mobile phase in HPLC, it was imperative to predict the most suitable organic solvents as standalone and binary systems containing water. This was investigated by estimating Hansen solubility parameters (δd, δp, and δh). The result is presented in Table 4, wherein these values are along with total parameter (δt) and R (space parameter in term of sphere diameter) (Table 2). The value of “R” for acyclovir was estimated as 19.89, which is quite higher than the other solvents, except water (29.4). This may be correlated with the insolubility of ACV in water due to its location outside the HSP sphere (29.4 ˃ R = 19.89). Rest solvents or binary systems (acetonitrile + water) are still within the HSP sphere, suggesting good interaction with ACV for improved solubility as result of all prime factors (dispersion, polarity and hydrogen bonding force as the main driving force) [24,25]. Moreover, the maximum and minimum “R” values were estimated as 9.4 (ethanol) and 29.4 (water), respectively. Thus, ethanol and acetonitrile were the most compatible for mobile phase preparation due to improved drug solubility in these solvents. However, acetonitrile could be the most relevant solvent component, as evidenced with the binary system possessing R = 15.59. The ratio was decided based on the experimentally obtained HPLC peak being well resolved.

4.2. Solubility of ACV in Organic Solvents

Experimental solubility of ACV was conducted as dictated in the HSPiP software. This was carried out to confirm the predictive outcome of the HSP parameters estimated before (Table 4) in a specific solvent. Theoretically, a drug solubility in a particular solvent is the result of multiple interactive forces playing together to solubilize and stabilize in the system at a constant temperature. These forces were cohesive forces and summarized in HSP parameters of the HSPiP software. The result of experimental solubility (at 30 °C) of ACV in methanol, ethanol, acetonitrile, water, ethyl acetate, and binary mixture can be correlated to the HSP values summarized in Table 4. We found that acetonitrile exhibited higher solubility of ACV as compared to others due to the minimum difference values of polarity and dispersion parameters between the solute (δds) and the solvent (δdv). These differences were found as δds − δdv = 3.8, and δps − δpv = −3.0, for acetonitrile, respectively. Moreover, these values were relatively high in other solvents. Theoretically, the less the difference, the more the solubility is observed for a solute in a particular solvent at a constant temperature (difference approaching zero could be considered as the most soluble, δps − δpv = 0 or δds − δdv = 0) [24,25]. Thus, the experimental solubility was in good agreement with the predicted values of HSP parameters estimated using the HSPiP software.

4.3. Optimization of Chromatographic Conditions

In previous published reports, the bioanalytical quantification of ACV was often carried out with the combination of buffers and a little amount of organic solvents without the employing of any optimization technique [33,34]. An attempt was made to develop and validate an optimized, reliable, and sensitive bioanalytical method. The developed method can be revalidated, retransferred, and reproduced easily with high robustness. Therefore, this was the purpose of method validation to quantify ACV in biological fluids, such as plasma.

4.4. Screening Studies (Pre-Optimization)

In the development of the bioanalytical method, factor screening studies were carried by Taguchi design. Half-normal and Pareto charts indicated the influence of primarily two factors, i.e., flow rate and buffer (potassium dihydrogen phosphate) concentration on studied responses. Figure 2 illustrates the statistically significant values of attributes on each of the studied responses (Table 1).

4.5. Response Surface Methodology (Optimization)

Final optimization was carried out using the CCD design and exhibited two factors at three levels (Table 2). A general mathematical quadratic equation was generated to establish the relationship between the significant factors and corresponding responses.
Y = β0 + β1X1 + β2X2 + β3X1X2 + β4X12 + β5X22
where Y is the dependent variable with two coefficients (β1 and β2) of factors (X1 and X2). β0 is an intercept. β3 is a coefficient of interaction between factors X1 and X2, whereas β4 and β5 are the coefficients of quadratic terms X1” and X2, respectively.
The analysis of interaction between factors and responses is depicted in Figure 3 wherein the 3D and 2D plots were constructed for respective attributes.
Figure 3A,B illustrated that an increase in flow rate resulted in an increase in the retention time (RT), followed by a reduction after a certain limit. Further increase in flow rate caused no effect on the RT and there was no increment in RT with an increase in the flow rate. Therefore, to establish a robust method of quantification, this flow rate was optimized at a limit of 1 mL/min. The 2D and 3D plot in Figure 3C,D portrayed an increasing trend in the values of buffer concentration, though a sharply decreasing trend was observed with increasing levels of the flow rate. All experiments were conducted in triplicate (n = 3) to minimize the effects of uncontrolled factors. Further, statistical analysis was evaluated by using one-way ANOVA to analyze the model suitability. The results obtained from statistical data are given in Table 2. The value of p is 0.0004 for X1 and 0.0007 for X2 confirmed the best fitness of the model adopted for analysis of Y1 and Y2 (Table 2). The targeted criterion for the optimization was to minimize the retention time (Y1) and maximize peak area (Y2). The desirability parameter was chosen for a response variable from 0 to 1. The optimized chromatographic condition chosen to achieve the maximum overall desirability is 0.9778. Moreover, the adjusted correlation coefficient (R2) was close to the observed value, which suggested a good fit for the model. However, the optimized parameters for the robust bioanalytical method of ACV on HPLC are portrayed in Table 5.

4.6. Bionalytical Method Validation

4.6.1. Linearity and Calibration Curve

The calibration curve of ACV in the plasma was constructed in the range of 100–1000 ng/mL with a correlation coefficient value of r2= 0.999 (Figure 4A–C). The regression equation for the calibration curve was Y = 190.6x for ACV (Table 5).

4.6.2. LLOD and LLOQ

The values of LLOD and LLOQ values were computed as 30 and 100 ng/mL for ACV, respectively. These results depict that the developed bioanalytical method is sensitive to detect ACV in plasma for further clinical purpose.

4.6.3. Plasma Recovery

The results of plasma recovery values are summarized in Table 6. It is observed that mean plasma recovery was found in the range from 98.9 to 101.2% for ACV. There was no source of interference as observed at the peak retention time of the eluted ACV (Figure 4A,B).

4.6.4. Precision and Accuracy

The accuracy and precision (intra-day and inter-day) of the optimized bioanalytical method was measured and the relative standard deviation (RSD) values were <5% at all three concentration levels. As observed, values of percentage accuracy were found in a range between 91.1% and 98.6%, with low values of RSD, i.e., 1.5–2.9% (Table 7). It is evident from the results that the developed HPLC method is suitable, accurate, and indicates a high degree of precision for quantification analysis of ACV in plasma samples [35].

4.6.5. Stability

The stability of ACV was assessed using different circumstances expected to be encountered during the analytical process and sample storage. The results are portrayed in Table 8, which shows that the selected drug was stable in plasma when stored in a frozen state.

4.7. In Vivo Pharmacokinetic Study

It was mandatory to investigate a pharmacokinetic study of the drug after transdermal delivery using the validated method in rat plasma. In our previous published report, we described details of formulation development, optimization, in vitro and ex vivo studies for the drug permeation, and skin hydration using gel formulation [22]. To confirm in vivo performance of the gel formulation and therapeutic efficacy, we conducted pharmacokinetic study after transdermal application and the results are portrayed in Figure 5 and Table 9. The concentration time profile of ACV sol, ELP3, ETHO2, ELP3 gel, and ETHO2 gel, after transdermal applications showed that ETHO2 (ethosomes) was found to have the highest Cmax value (325.2 ng/mL), as compared to elastic liposomes (ELP3; 225.19 ng/mL), which may be prudent to correlate with the highest ethanolic content (45%) in the ethosomes. Ethanol of ETHO2 caused substantial deformability and flexibility in the lipid bilayer for maximized squeezing across rat skin with permeation [36]. On the other hand, ethosomal gel (ETHO2 gel; 328.09 ng/mL) executed better than elastic liposomal gel (ELP3 gel; 223.70 ng/mL) due to the ethanolic content. However, the gel slowed down the permeation rate of the drug-loaded vesicles as compared to respective ethosome or elastic liposomes colloidal suspension, which can be caused by viscosity provided by the gel for slow and sustained drug delivery (Figure 5). Notably, other pharmacokinetic parameters were observed in the same pattern. From Figure 5, it is apparent that applied formulation showed clearly varied lag time points after transdermal application. Maximum lag time (110 min) was observed in the case of ACV-Sol, which may be correlated to its poor aqueous solubility at room temperature and neutral pH. ELP3 and ETHO2 exhibited a minimum lag time (22 min) of drug permeation across rat skin due to the colloidal nature, low viscosity, and vesicles, which were directly available at the site of permeation. Gel formulations (ELP3 and ETHO2 gel) were relatively viscous and caused a slightly increased lag time (43–52 min).
The values of MRT and AUMC were progressively increased due to maximum drug entrapment in vesicles and intact vesicles passing through the stratum corneum of skin, as shown in Table 9. Conclusively, drug solution in DMSO (5% aqueous solution) revealed limited drug access to systemic circulation as compared to gel and colloidal formulations. The objective to use gel was to improve the residence time of the formulation on the applied site of skin for prolonged permeation. Moreover, gel provides hydration to skin and reduces tranepidermal water loss due to the high swelling index of bioadhesive carbopol [37,38].

5. Conclusions

The present study demonstrated the development and validation of bioanalytical technique using HPLC to quantify ACV in biological samples (plasma). QbD factors were employed, which involved screening and optimization design (CCD) for the identification of most influential attributes affecting bioanalytical method performance. The developed plasma recovery procedure was simple, with high accuracy (>96% of recovery) and precision. The required run time for the elution of ACV in plasma was only 10 min. Furthermore, the study of validation suggests that the bioanalytical method is adequate in terms of selectivity, linearity, and sensitivity at a low value of LLOD (30 ng/mL) for the determination of ACV plasma samples. Pharmacokinetic parameters estimated in rat plasma indicated that the method development and validation was suitably implemented for pharmacokinetics parameter assessment after topical application of vesicular ethosomes and elastic liposomes. Gel formulations improved AUC and Cmax compared to respective colloidal elastic liposomes and ethosomes (ACV laden).

Author Contributions

S.M.A.: drafting, methodology, resource, and writing, A.A.: visualization and idea, M.A.A. (Manal A. Alossaimi): review and software validation, M.A.A. (Mohammad A. Altamimi): HSPiP software, review and editing, W.A.M.: drafting, editing, reviewing, and funding acquisition, M.R.: conceptualization, data curation, resources, and analysis, A.H.: Writing and editing only. All authors have read and agreed to the published version of the manuscript.

Funding

This research was funded by the Researchers Supporting Project (number RSP2022R516) at King Saud University, Riyadh, Saudi Arabia. APC was funded by the Researchers Supporting Project.

Institutional Review Board Statement

The animal study was carried out in Wistar albino rats weighing about 200–220 g of both sexes. The animal study protocol was approved by the Institutional Review Board (or Ethics Committee) of PCTE INSTITUTE of Ludhiana, Punjab, (protocol code PCTE/LDH/1370/2013 and 7 February 2013) for studies involving animals (PCTE, PTU, Punjab), in India. The study was carried out as per the Declaration of Helsinki, and approved by the Institutional Review Board (PCTE Institute, PTU, Punjab).

Data Availability Statement

Not applicable.

Acknowledgments

Authors are thankful to Researchers Supporting Project (number RSP2022R516) at King Saud University, Riyadh, Saudi Arabia.

Conflicts of Interest

The authors declare no conflict of interest.

References

  1. Ahronowitz, I.; Fox, L.P. Herpes zoster in hospitalized adults: Practice gaps, new evidence, and remaining questions. J. Am. Acad. Dermatol. 2018, 78, 223–230. [Google Scholar] [CrossRef] [PubMed]
  2. Szabo, S.R.; Fernelius, C.A.; Arora, N.S. Annular elastolytic giant cell granuloma: Mysterious enlarging scarring lesions. Cutis 2019, 1031, E5–E7. [Google Scholar]
  3. Stahl, J.P.; Mailles, A. Herpes simplex virus encephalitis update. Curr. Opin. Infect. Dis. 2019, 32, 239–243. [Google Scholar] [CrossRef] [PubMed]
  4. Kukhanova, M.K.; Korovina, A.N.; Kochetkov, S.N. Human herpes simplex virus: Life cycle and development of inhibitors. Biochemistry 2014, 79, 1635–1652. [Google Scholar] [CrossRef]
  5. Satonin, D.K.; McCulloch, J.D.; Kuo, F.; Knadler, M.P. Development and validation of a liquid chromatography—Tandem mass spectrometric method for the determination of the major metabolites of duloxetine in human plasma. J. Chromatogr. B 2007, 852, 582–589. [Google Scholar] [CrossRef]
  6. Siddiqui, M.R.; AlOthman, Z.A.; Rahman, N. Analytical techniques in pharmaceutical analysis: A review. Arab. J. Chem. 2017, 10, S1409–S1421. [Google Scholar] [CrossRef] [Green Version]
  7. Bangaru, R.; Bansal, Y.; Rao, A.R.M.; Gandhi, T. Rapid, simple and sensitive high-performance liquid chromatographic method for detection and determination of acyclovir in human plasma and its use in bioavailability studies. J. Chromatogr. B 2000, 739, 231–237. [Google Scholar] [CrossRef]
  8. Fernandez, M.; Sepúlveda, J.; Aránguiz, T.; von Plessing, C. Technique validation by liquid chromatography for the determination of acyclovir in plasma. J. Chromatogr. B 2003, 791, 357–363. [Google Scholar] [CrossRef]
  9. Tiwari, G.; Tiwari, R. Bioanalytical method validation: An updated review. Pharm. Methods 2010, 1, 25–38. [Google Scholar] [CrossRef]
  10. Jin, L.; Wei, G.; Lu, W.-Y.; Xu, L.-J.; Pan, J. Quantitative Determination of Acyclovir in Aqueous Humor by LCMS. Chromatographia 2006, 63, 239–242. [Google Scholar] [CrossRef]
  11. Poirier, J.M. Determination of acyclovir in plasma by solid-phase extraction and column liquid chromatography. Ther. Drug Monit. 1999, 21, 129–133. [Google Scholar] [CrossRef] [PubMed]
  12. Wei, Y.-P.; Yao, L.-Y.; Wu, Y.-Y.; Liu, X.; Peng, L.-H.; Tian, Y.-L.; Ding, J.-H.; Li, K.-H.; He, Q.-G. Critical Review of Synthesis, Toxicology and Detection of Acyclovir. Molecules 2021, 26, 6566. [Google Scholar] [CrossRef] [PubMed]
  13. Nebinger, P.; Koel, M. Determination of acyclovir by ultrafiltration and high-performance liquid chromatography. J. Chromatogr. 1999, 619, 342–344. [Google Scholar] [CrossRef]
  14. Jankowski, A.; Jankowska, A.L.; Lamparczyk, H. Determination and pharmacokinetics of acyclovir after ingestion of suspension form. J. Pharm. Biomed. Anal. 1998, 18, 249–254. [Google Scholar] [CrossRef]
  15. Skoulika, S.; Georgiou, C. Rapid, Noninvasive Quantitative Determination of Acyclovir in Pharmaceutical Solid Dosage Forms through Their Poly(Vinyl Chloride) Blister Package by Solid-State Fourier Transform Raman Spectroscopy. Appl. Spectrosc. 2003, 57, 407–412. [Google Scholar] [CrossRef]
  16. Yeh, H.H.; Yang, Y.H.; Chen, S.H. Rapid determination of acyclovir in plasma and cerebrospinal fluid by micellar electrokinetic chromatography with direct sample injection and its clinical application. Electrophoresis 2006, 27, 819–826. [Google Scholar] [CrossRef]
  17. Lasure, A.; Ansari, A.; Kalshetti, M. UV spectrophotometric analysis and validation of acyclovir in solid dosage form. Int. J. Curr. Pharm. Res. 2020, 12, 100–103. [Google Scholar] [CrossRef] [Green Version]
  18. Sandipan, R. Quality by design: A holistic concept of building quality in pharmaceuticals. Int. J. Pharm. Biomed. Res. 2012, 3, 100–108. [Google Scholar]
  19. Patel, K.Y.; Dedania, Z.R.; Dedania, R.R.; Unnati, P. QbD approach to HPLC method development and validation of ceftriaxone sodium. Futur. J. Pharm. Sci. 2021, 7, 141. [Google Scholar] [CrossRef]
  20. Malik, N.; Ahmad, M.; Minhas, M.; Khalid, Q. Determination of acyclovir in rabbit plasma by high performance liquid chromatographic (HPLC) technique. Acta Pol. Pharm. -Drug Res. 2019, 76, 421–429. [Google Scholar] [CrossRef]
  21. Bahrami, G.; Mirzaeei, S.; Kiani, A. Determination of acyclovir in human serum by high-performance liquid chromatography using liquid–liquid extraction and its application in pharmacokinetic studies. J. Chromatogr. B 2005, 816, 327–331. [Google Scholar] [CrossRef] [PubMed]
  22. Alshehri, S.; Hussain, A.; Altamimi, M.A.; Ramzan, M. In vitro, ex vivo, and in vivo studies of binary ethosomes for transdermal delivery of acyclovir: A comparative assessment. J. Drug Deliv. Sci. Technol. 2021, 62, 102390. [Google Scholar] [CrossRef]
  23. Ärlemalm, A.; Helldén, A.; Karlsson, L.; Carlsson, B. Rapid determination of acyclovir, its main metabolite 9-carboxymethoxymethylguanine, ganciclovir, and penciclovir in human serum using LC–MS/MS. Biomed. Chromatogr. 2022, 36, e5315. [Google Scholar] [CrossRef] [PubMed]
  24. Kitak, T.; Dumicicc, A.; Planinsek, O.; Sibanc, R.; Srcicc, S. Determination of solubility parameters of ibuprofen and ibuprofen lysinate. Molecules 2015, 20, 21549–21568. [Google Scholar] [CrossRef]
  25. Hussain, A.; Altamimi, M.A.; Afzal, O.; Altamimi, A.S.A.; Ali, A.; Ali, A.; Martinez, F.; Siddique, M.U.M.; Acree, W.E.; Jouyban, A. Preferential Solvation Study of the Synthesized Aldose Reductase Inhibitor (SE415) in the {PEG 400 (1) + Water (2)} Cosolvent Mixture and GastroPlus-Based Prediction. ACS Omega 2022, 7, 1197–1210. [Google Scholar] [CrossRef]
  26. Boulieu, R.; Gallant, C.; Silberstein, N. Determination of acyclovir in human plasma by high-performance liquid chromatography. J. Chromatogr. B Biomed. Sci. Appl. 1997, 693, 233–236. [Google Scholar] [CrossRef]
  27. Kaur, R.; Saini, S.; Patel, A.; Sharma, T.; Kaur, R.; Katare, O.P.; Singh, B. Developing a Validated HPLC Method for Quantification of Ceftazidime Employing Analytical Quality by Design and Monte Carlo Simulations. J. AOAC Int. 2021, 104, 620–632. [Google Scholar] [CrossRef]
  28. Susantakumar, P.; Gaur, A.; Sharma, P. Comparative Pharmacokinetics, Safety and Tolerability Evaluation of Acyclovir IR 800 Mg Tablet in Healthy Indian Adult Volun-teers Under Fasting and Non-fasting Conditions. J. Bioequiv. Availab. 2011, 3, 6. [Google Scholar] [CrossRef] [Green Version]
  29. ICH. Validation of Analytical Procedures: Text and Methodology. 1995. Available online: https://www.ema.europa.eu/en/documents/scientific-guideline/ich-q-2-r1-validation-analytical-procedures-text-methodology-step-5_en.pdf (accessed on 7 April 2022).
  30. Zendelovska, D.; Simeska, S.; Atanasovska, E.; Georgievska, K.; Kikerkov, I.; Labachevski, N.; Jakovski, K.; Balkanov, T. Determination of Acyclovir in Human Plasma Samples by HPLC Method with UV Detection: Application to Single-Dose Pharmacokinetic Study. Open Access Maced. J. Med. Sci. 2015, 3, 32–36. [Google Scholar] [CrossRef] [Green Version]
  31. Alcorn, J.; McNamara, P.J. Acyclovir, ganciclovir, and zidovudine transfer into rat milk. Antimicrob. Agents Chemother. 2002, 46, 1831–1836. [Google Scholar] [CrossRef] [Green Version]
  32. Monicha, E.; Andayani, R.; Rivai, H. Review of acyclovir analysis in pharmaceutical preparations and biological matrices. World J. Pharm. Pharm. Sci. 2020, 9, 849–875. [Google Scholar]
  33. Volpato, N.M.; Santi, P.; Laureri, C.F.; Colombo, P. Assay of acyclovir in human skin layers by high-performance liquid chromatography. J. Pharm. Biomed. Anal. 1997, 16, 515–520. [Google Scholar] [CrossRef]
  34. Muralidharan, S.; Kalaimani, J.; Parasuraman, S.; Dhanaraj, S.A. Development and Validation of Acyclovir HPLC External Standard Method in Human Plasma: Application to Pharmacokinetic Studies. Adv. Pharm. 2014, 2014, 284652. [Google Scholar] [CrossRef]
  35. Teshima, D.; Otsubo, K.; Yoshida, T.; Itoh, Y.; Oishi, R. A simple and simultaneous determination of acyclovir and ganciclovir in human plasma by high-performance liquid chromatography. Biomed. Chromatogr. 2003, 17, 500–503. [Google Scholar] [CrossRef]
  36. Gupta, M.; Vaidya, B.; Mishra, N.; Vyas, S.P. Effect of surfactants on the characteristics of fluconazole niosomes for enhanced cutaneous delivery. Artif. Cell Blood Substit. Biotechnol. 2011, 39, 376–384. [Google Scholar] [CrossRef]
  37. Estanqueiro, M.; Conceição, J.; Amaral, M.H.; Sousa Lobo, J.M. Characterization, sensorial evaluation and moisturizing efficacy of nanolipidgel formulations. Int. J. Cosmet. Sci. 2014, 36, 159–166. [Google Scholar] [CrossRef]
  38. Sultan, M. Spectrophotometric determination of acyclovir in some pharmaceutical formulations. Il Farmaco. 2002, 57, 865–870. [Google Scholar] [CrossRef]
Figure 1. Chemical structure of ACV with weak acidic and basic functional groups.
Processes 10 02079 g001
Figure 2. Half-normal and Pareto charts depicting the significant effect on bioanalytical attributes: (A,B) retention time (RT) and (C,D) peak area. In Figure 2B,D, the impact of various factors (A–G) has been ordered in the term of rank. These factors have been explained in Table 1 and footnote.
Processes 10 02079 g002
Figure 3. 2D and 3D response surface plots portraying the effect of critical attributes CMPs on various responses, (A,B) retention time and (C,D) peak area.
Processes 10 02079 g003
Figure 4. (A) Blank plasma, (B) chromatogram of ACV in plasma, and (C) calibration plot of ACV in plasma.
Processes 10 02079 g004
Figure 5. In vivo pharmacokinetic study of various formulations (ACV sol, ELP3, ETHO2, ELP3 gel, and ETHO2 gel) in rat plasma following transdermal application.
Processes 10 02079 g005
Table 1. Various critical attributes affecting ACV method development (screening).
ResponsesFactors
ABCDEFG
Peak retention time (Y1, min)−1+1−1+1−1+1−1
Peak area (mAU) as Y2−1+1−1+1−1+1−1
Note: A: Injection volume (µL), B: flow rate (µL/min), C: buffer pH, D: column temperature (°C), E: ACN concentration (%), F: buffer concentration, and G: sample temperature. −1: low level, +1: high level.
Table 2. Matrix of central composite design (CCD) design (optimization) and statistical analysis (three level and two factor against two responses).
Factors and Their LevelsResponsesGoal
Design runAB
10−1Peak retention time (min)Minimum
2−11
300Peak area (mAU)Maximum
400
510
6−1−1
71−1
8−10
900
1000
1111
1201
1300
Levels of optimization study
Responses (Parameters)Low(−1)Middle (0)High(+1)Modelp valueR2
A: Flow rate (mL/min)0.51.01.5Quadratic0.00040.9832
B: Buffer concentration (%v/v)708090Quadratic0.00070.9189
Table 3. Composition and prime characteristic parameters of ethosome and elastic liposome formulations (including respective gels) containing a constant amount of ACV.
ParametersELP3ETHO3ELP3-gelETHO3-gel
Phosphatidylcholine (PC) (%)85608560
Span 80 (%)15-15-
Cholesterol (%)-25-25
PG/ethanol ratio-0.6-0.6
Vesicle size (nm)209122226237
%EE899785.895.3
Carbopol gel (%)--0.50.5
ACV (%w/w)5555
Table 4. Summary of HSP parameters for the drug, solvents, and binary mixture of “ACN + water” and experimental solubility at 30 °C (R = space parameter).
Drug and SolventHSP ParametersExperimental Solubility (mg/mL)
δdδpδhδtR
Acyclovir19.413.613.727.419.8-
Acetonitrile15.616.68.324.39.81.8 ± 0.04
Ethanol15.69.317.225.09.41.1 ± 0.06
Methanol16.412.321.729.910.11.0 ± 0.02
Water15.616.042.047.629.40.7± 0.01
Ethyl acetate15.76.37.518.512.8precipitated
Acetonitrile + water = 1:915.916.138.645.315.62.3 ± 0.05
Table 5. Optimized chromatographic conditions for quantification of ACV in rat plasma samples.
Chromatographic Conditions
Mobile phase ratioPotassium dihydrogen phosphate: ACN (90:10)
pH of buffer6.8
Column dimensions130 × 3.6 mm, 5.0 µm
Detection wavelength (nm)254
Flow rate (mL/min)1
Injection volume (µL)10
Run time (min)10.0
Column temperature (°C)25
Table 6. % Recovery data of optimized bioanalytical method of ACV.
Nominal Concentration (ng/mL)Levels (%)Theoretical Concentration (ng/mL)Recovery Concentration (ng/mL) (Mean ± SD)Recovery CV (%)
40090360.0359.45 ± 6.8199.8%1.9
95380.0377.62 ± 7.1299.3%1.8
100400.0405.55 ± 11.62101.2%2.8
60090540.0534.21 ± 9.2398.9%1.7
95570.0572.91 ± 5.11100.5%0.9
100600.0595.22 ± 7.3199.2%1.2
80090720.0714.65 ± 9.4399.2%1.3
95760.0755.44 ± 10.1299.4%1.4
100800.0792.53 ± 6.3299.0%0.8
Table 7. Intra-day accuracy and precision of ACV in rat plasma samples.
Concentration (ng/mL)Observed Concentration (ng/mL)% AccuracyPrecision (%RSD)
Intra-day
200 (LQC)190.4 ± 8.1295.22.2
500 (MQC)492.7 ± 9.2298.41.8
800 (HQC)789.25 ± 10.6198.61.3
Inter-day
200 (LQC)182.2 ± 9.1291.12.9
500 (MQC)466.1 ± 9.5593.22.0
800 (HQC)774.9 ± 12.3496.81.5
Table 8. Stability studies of ACV in plasma.
MeanCV (%)MeanCV (%)
Initial concentration (ng/mL)500 1000
Freeze–thaw (3 cycles at 4 °C)476.3 ± 7.421.48944.7 ± 10.131.07
Short term (30 °C for 24 h)488.5 ± 7.811.59976.2 ± 11.261.15
Long term (−20 °C for 30 days)481.4 ± 6.371.31967.3 ± 11.741.17
Table 9. Summary of pharmacokinetic data for various formulations.
Pharmacokinetic ParametersACV-SolELP3 gelETHO2 gelELP3ETHO2
Cmax (ng/mL)31.70 ± 3.57223.70 ± 3.76328.09 ± 1.9225.19 ± 16.39325.27 ± 17.71
Tmax (h)4.211.912.488.3
T1/2(h)8.88 ± 1.510.05 ± 2.310.71 ± 1.615.98 ± 1.716.18 ± 3.4
AUC0–∞ (ng.h/mL)1016.73 ± 21.21567.45 ± 26.71798.45 ± 19.92151.97 ± 23.52392.62 ± 63.9
AUMC (ng.h2/mL)26,349.18 ± 43233,147.38 ± 33236,145.14 ± 54150,539.74 ± 39352,587.98 ± 880
MRT (h)11.19 ± 0.8515.26 ± 0.4216.38 ± 0.3318.76 ± 0.9219.76 ± 0.81
Ke (h−1)0.19 ± 0.010.08 ± 0.020.07 ± 0.010.02 ± 0.030.02 ± 0.01
Note: AUC = Area under the curve, AUMC = area under moment curve, and MRT = mean residence time.
Publisher’s Note: MDPI stays neutral with regard to jurisdictional claims in published maps and institutional affiliations.

