Article

Boundary Layer Transition Prediction on Planar Turbine Cascade Using Temperature-Sensitive Paint and Numerical Simulation

1
State Key Laboratory of Aerodynamics, Mianyang 621000, China
2
State Key Laboratory of Hydroscience and Engineering, Department of Energy and Power Engineering, Tsinghua University, Beijing 100084, China
3
High Speed Aerodynamics Institute, Chinese Aerodynamic Research and Development Center, Mianyang 621000, China
*
Author to whom correspondence should be addressed.
Processes 2022, 10(10), 2078; https://doi.org/10.3390/pr10102078
Submission received: 22 August 2022 / Revised: 18 September 2022 / Accepted: 7 October 2022 / Published: 14 October 2022
(This article belongs to the Special Issue Design and Optimization Method of Pumps)

Abstract

:
Advanced measurement technology on boundary layer transition is an effective means to study the flow mechanism and the performance of the cascade. In this research, to investigate the boundary layer transition of transonic VKI-RG turbine cascade, a noncontact measurement technique named temperature-sensitive paint (TSP) that is capable of quantitatively measuring the surface temperature of a model is used. Under the conditions of outlet Mach number (Ma2) = 0.4, 1.03, and 1.2, the transitional location of a cascade is accurately measured by TSP technique. Moreover, a numerical study on the transitional location of a planar cascade was conducted with the conditions of Mach number (Ma) and attack angle (α). The numerical results show that the transitional location moved forward with the increase in Ma2 and α at Ma2 < 1; otherwise, the transitional location moved backward with increasing Ma2 (Ma2 > 1). Lastly, a strong adverse pressure gradient was formed behind the shock wave, which led to the beginning of the transition.

1. Introduction

Aeroengines are not only the power source of aircraft, but also an important driving force for the development of the aviation industry. The turbine cascade is a major part of the aeroengine, and its performance directly affects the performance index of the aeroengine. The complex flow field structure and loss mechanism of cascades have become important research content to improve the performance of aeroengines. The state of the boundary layer on the cascade surface and the transitional location are an important basis for describing the flow mechanism of the cascade and analyzing its performance.
Although the basic theory and occurrence mechanism of boundary layer transition are still under research and development, its importance in engineering practice has become increasingly prominent, and has received extensive and sustained attention [1,2,3]. For example, the transitional location and development process have a significant impact on the lift–drag characteristics, boundary layer separation, and surface aerodynamic heating of the aircraft in aerospace engineering [4,5,6]. Some research on the measurement method and numerical method of the transitional location of the cascade boundary layer was carried out, and it is of great value to further understand the flow mechanism of aeroengine cascades and improve the design level of China’s aeroengines.
In recent years, scholars have carried out a lot of work on flow display technology and measurement methods [7,8,9,10,11,12,13]. Hausmann et al. [12] used the hot-film technique to measure the flow separation and transition on the airfoil surface. Halstead et al. [14] also used hot-film technology to detect the boundary layer state of compressor blades. For the particle image velocimetry (PIV) technique [15], Medina et al. [16] investigated the flow mechanism of the pulsating transition jet. Horstmann et al. [17,18] performed transitional measurements on the boundary layer of airfoils with infrared image technology. Holmes et al. [19] confirmed that shear-sensitive liquid crystal technology can be applied well under different wind-tunnel test conditions of airfoils, and Mee et al. [20] accurately measured the boundary layer transition with this technology. Pressure-sensitive paint (PSP) is a well-established optical pressure measurement technique that can provide qualitative and quantitative surface pressure distributions on models with high spatial resolution. Kameda et al. [21], and Gregory et al. [22] have applications in the flow field and acoustic diagnosis. Although the above-mentioned testing techniques have unique advantages in certain scenarios, they are difficult to operate and cost-limited. For example, infrared thermal imaging equipment is expensive, has low spatial resolution, and has a large influence on background radiation signals in a normal temperature environment. Shear-sensitive liquid crystal technology cannot obtain quantitative temperature field data. Therefore, their applications to cascade transitional measurement are still relatively limited. TSP is used as a similar optical measurement technology to PSP by some researchers [23,24], but is relatively rarely used in the boundary layer transition of the cascade. In addition, some researchers [25,26] used numerical methods to predict the transitional location, and their results were in good agreement with the experimental data.
This paper combines the TSP technique, wind tunnel tests, and computational fluid dynamics (CFD) simulation to carry out predictive research on the boundary layer transition of a cascade. First, a TSP measurement method for the boundary layer transition of the cascade was constructed through the TSP technique and wind-tunnel test devices. Second, the wind-tunnel test of the transonic planar cascade turbine was carried out under different inflow conditions, and the transitional location was obtained. Lastly, the boundary layer transition location was verified by comparing the numerical calculation results. To analyze the variation in the transitional location under different inflow conditions, a large number of numerical simulation calculations of a planar cascade were further carried out.

2. Transitional Measurement Experiment on TSP

2.1. TSP Principle

The TSP technique is a modern optical measurement technology for the measurement of the surface temperature field distribution, and its basic principle is the thermal quenching effect of TSP fluorescent probe molecules. TSP uses luminescent molecules as probes that are mixed into suitable polymer coatings and coated on the surface of the aerodynamic model. Luminescent molecules are sensitive to temperature, and luminescent quantum efficiency decreases with increasing temperature. However, the heat transfer coefficients in the laminar boundary layer and the turbulent boundary layer are different, resulting in differences in the temperature distribution in the laminar and turbulent regions.
In this study, the technique was used to spray temperature-sensitive paint on the surface of a cascade, which is produced by ISSI Inc. in the United States. The specific parameters are shown in Table 1. Laminar and turbulent flow areas showed different luminous characteristics when the light source illuminated the model surface paint. The light-intensity distribution on the surface is captured with a IMPERX B4020 CCD Camera. The camera lens was 50 mm fixed-focus, and a 580 nm high-pass filter was installed in front of the lens to eliminate the influence of excitation light. The light sources were two sets of 400 nm LEDs that were arranged on both sides of the camera. A 400 nm LED light source was used to illuminate the surface of the model sprayed with TSP. At that time, the TSP was excited by the excitation light and emitted red light with a peak wavelength of around 610 nm. Then, a CCD camera was used, and a 580 nm high-pass filter was installed in front of the camera lens to eliminate the influence of excitation light and collect TSP luminous intensity images under different working conditions. The relationship between light intensity I and temperature T can be described by the Arrhenius formula [27]. Using the above collected temperature and light intensity data, the TSP calibration data were fitted on the basis of Equation (1) to obtain the relationship curve between I/Iref and temperature (T) under different pressure conditions; the calibration curve is shown in Figure 1. Therefore, the light intensity distribution could be converted into temperature distribution, and the transitional location could be observed.
I I ref = f ( T T ref )
where Iref is light intensity under the normal temperature (Tref) and pressure.

2.2. Wind-Tunnel Test Device

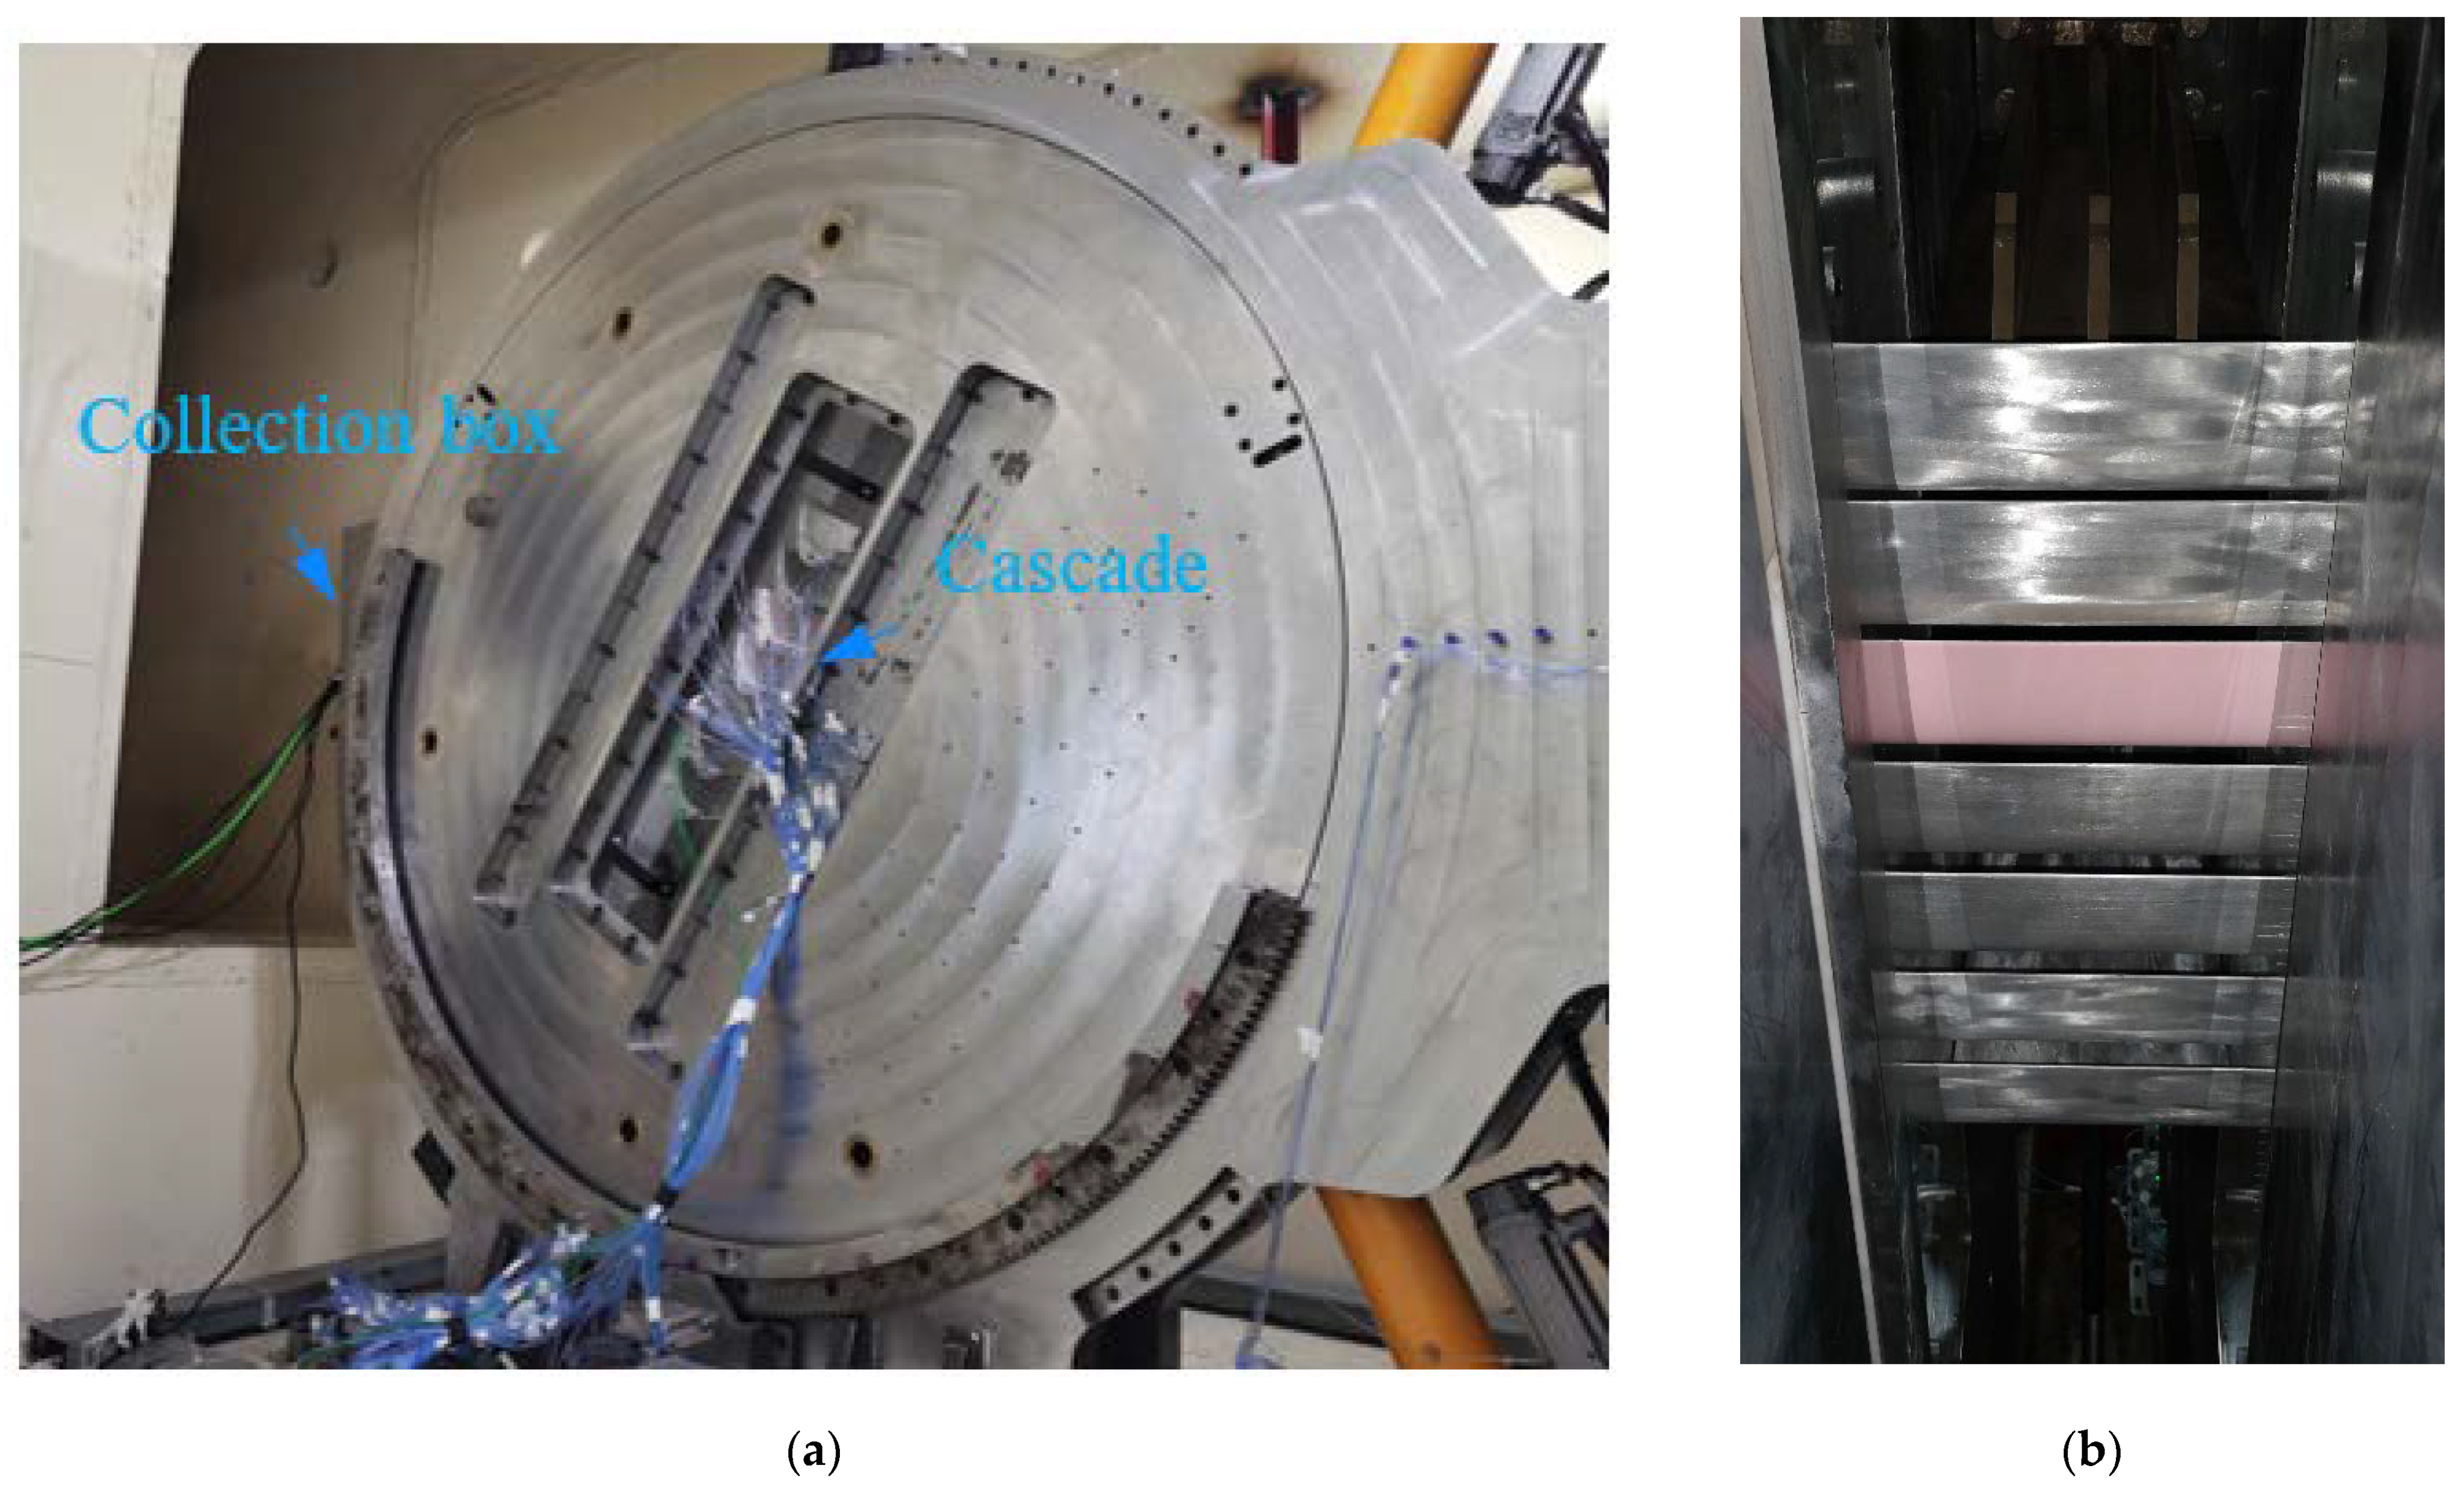
The TSP transitional test was carried out in the turbine cascade test section of the variable density planar cascade wind tunnel, as shown in Figure 2a, where the test section size (width × height) was 190 × 445 mm. The cascade model was placed in the wind-tunnel test section. The camera and excitation light source were integrated into a specially designed collection box and installed above the back of the test section.
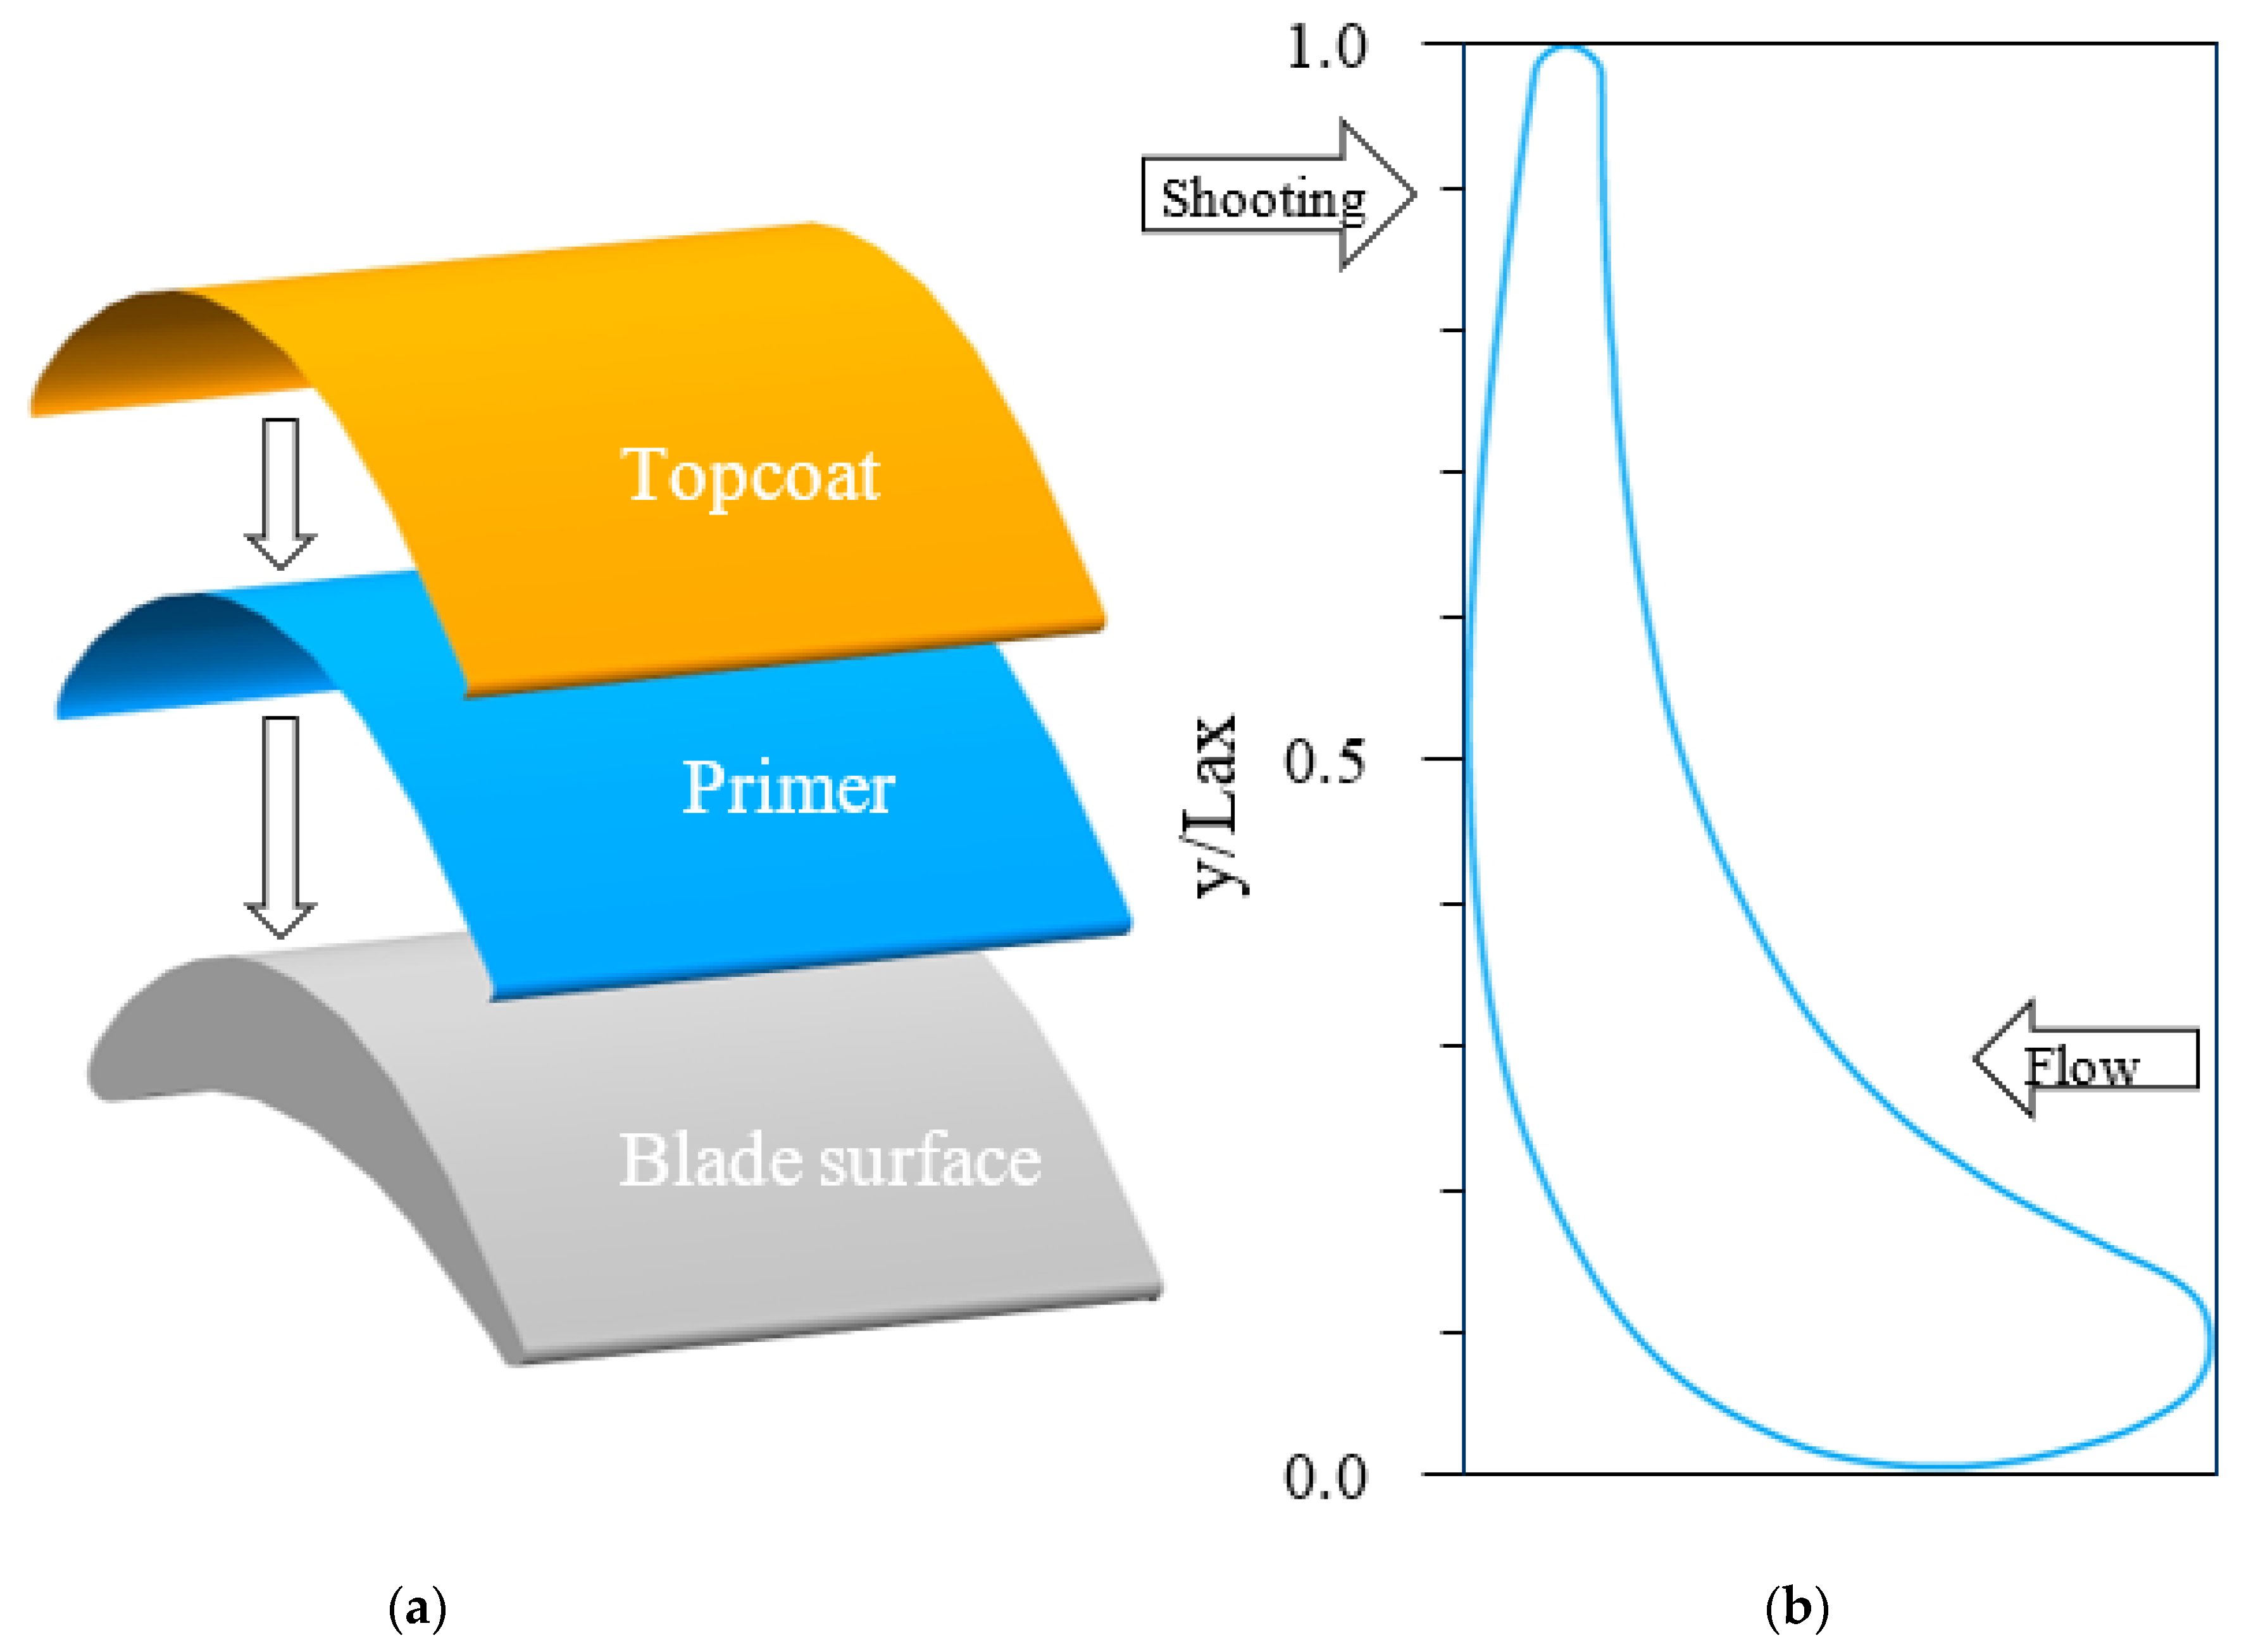
This study takes the transonic VKI-RG turbine blade as the research object, as shown in Figure 2b, and the cascade consisted of seven blades. The distance from the leading edge of the blade to the front of the cascade was 75 mm, the distance from the trailing edge to the rear of the cascade was 43 mm, and its specific parameters are shown in Table 2. The observation blade is a nonmetallic model produced out of epoxy resin material, and the blade surface was sprayed with temperature-sensitive paint. The specific operation was to first clean the surface of the blade with anhydrous alcohol and then spray the primer on the surface of the blade cascade. In order to prevent the induced transition from occurring in advance due to large particles on the surface, the surface was polished with fine sandpaper after the primer had been completely dried and cured, and a luminous topcoat was applied. The schematic diagram of the coating structure is shown in Figure 3a. The excitation light source in the collection box irradiates the temperature-sensitive paint on the blade surface for excitation and then uses a high-speed camera to capture the light intensity. To facilitate the accurate calibration of a transitional location, a schematic diagram of the blade size captured by the high-speed camera is shown in Figure 3b. Lax refers to the length of the blade in the direction perpendicular to the incoming flow when the cascade is set at a position where the vertical line of the forehead line is 30 degrees from the incoming flow.

2.3. Experimental Data Processing and Result Analysis

The wind tunnel test uses a fixed cascade α of 0° to conduct the blowing test, and the inflow conditions include the Ma and Re, whose calculation formula is as follows:
M a = 5 [ ( p t 1 p s 1 ) 1 . 0 ] 2 / 7
R e = 0 . 04766 [ ( 1 + 0 . 2 M a 2 ) 1 + 114 T t 1 ] M a ( 1 + 0.2 M a 2 ) 1.5 T t 1 p t 1 × 10 6
where pt1 is the total pressure of the stable section; ps1 is the average static pressure; Tt1 is the average total temperature of the stable section.
As shown in Table 3, four blowing tests were carried out in which specific test parameters such as outlet Mach number (Ma2) and inlet Reynolds number (Re1), inlet turbulence intensity (TIin), and Ma2 and Re1 were calculated with Equations (2) and (3), respectively.
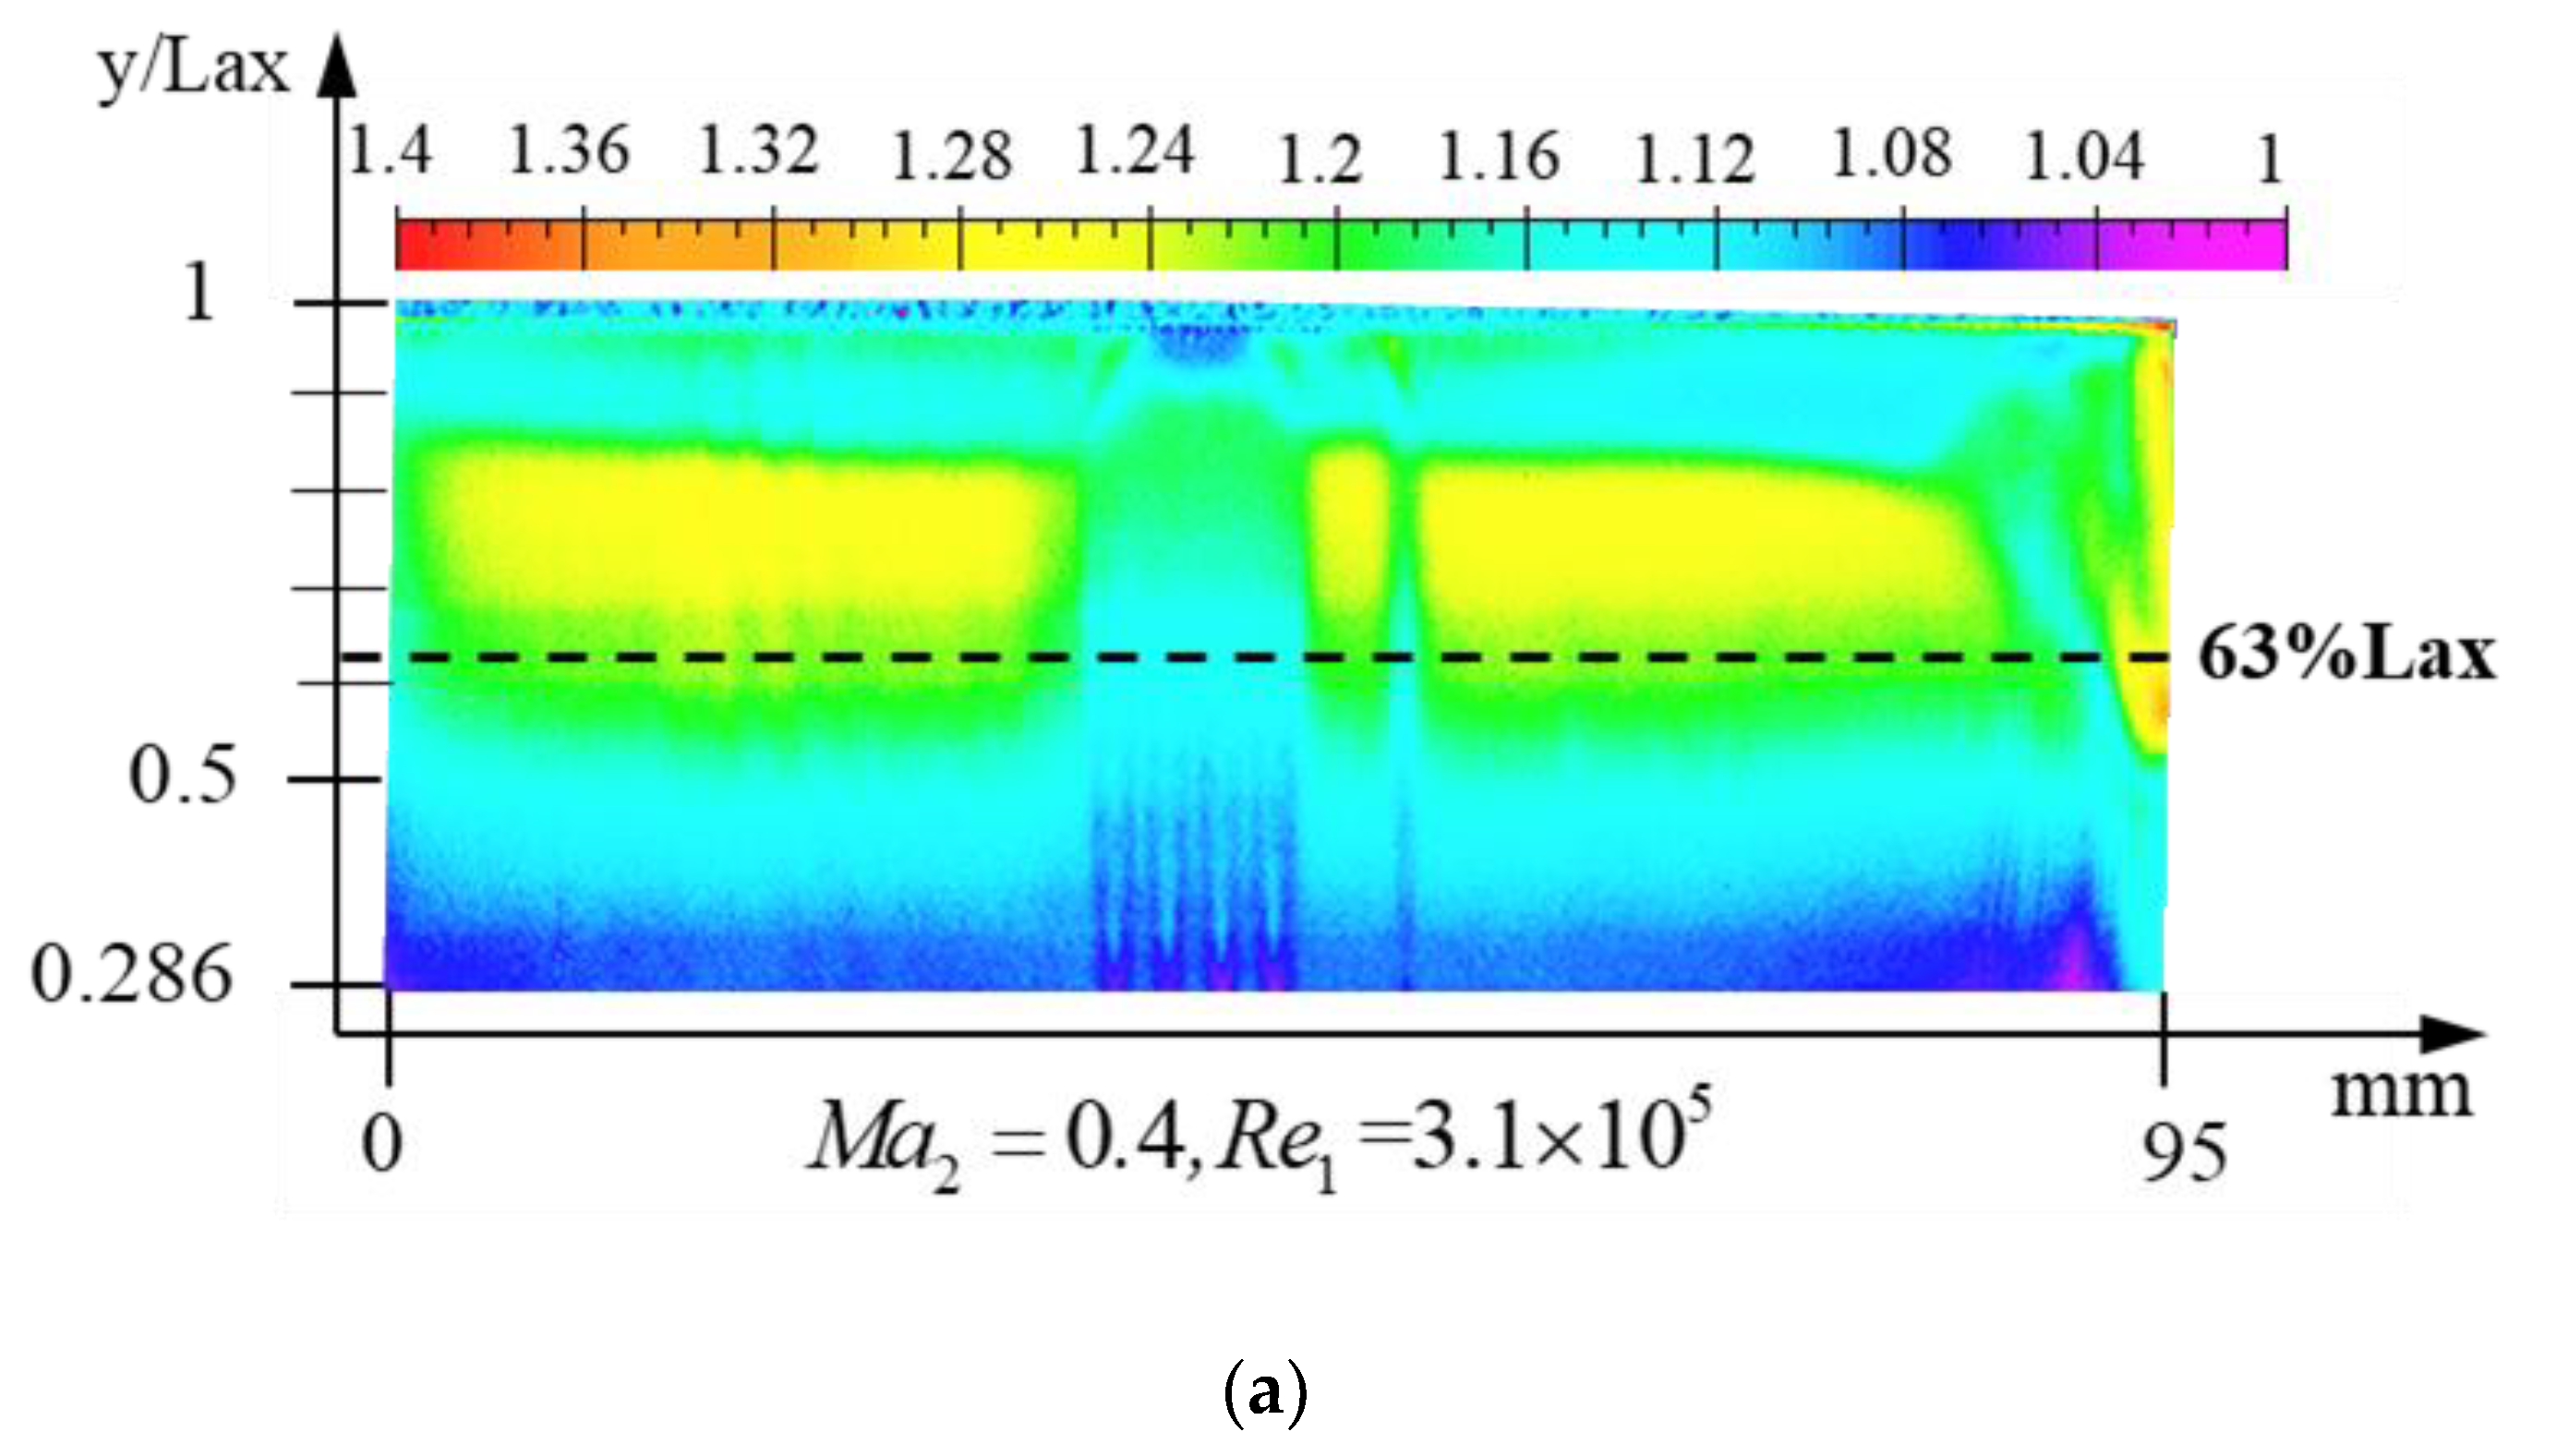
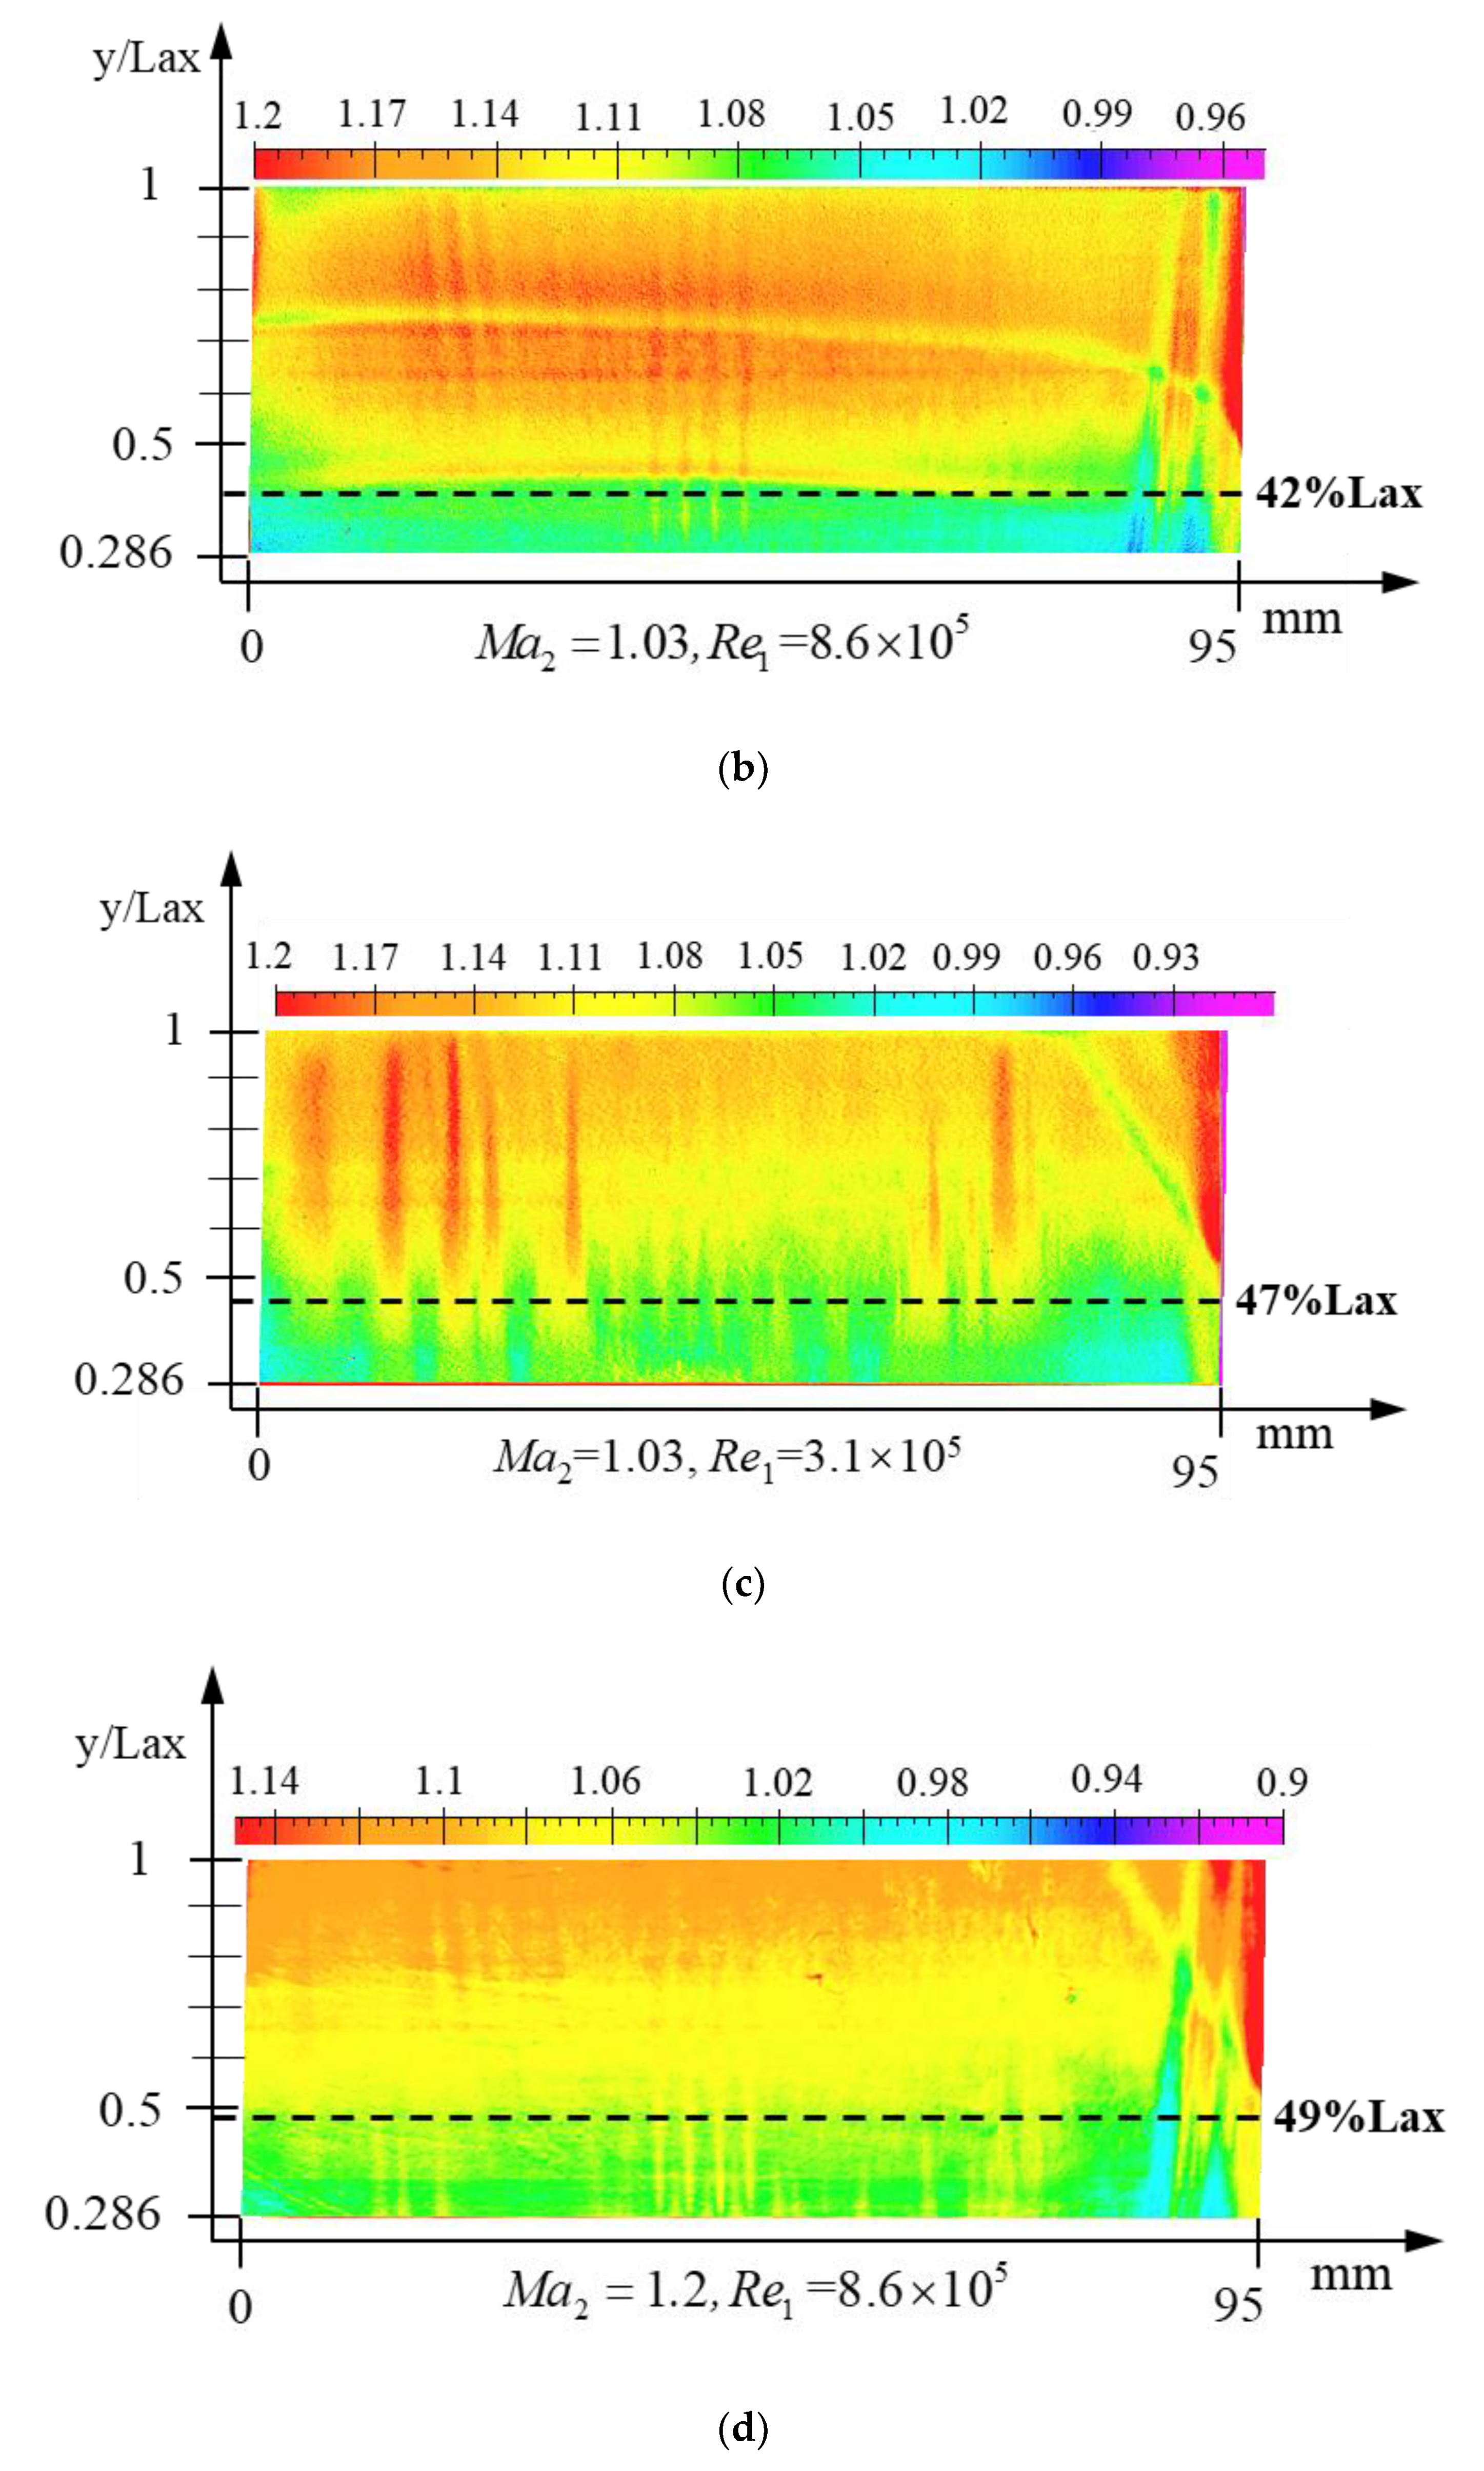
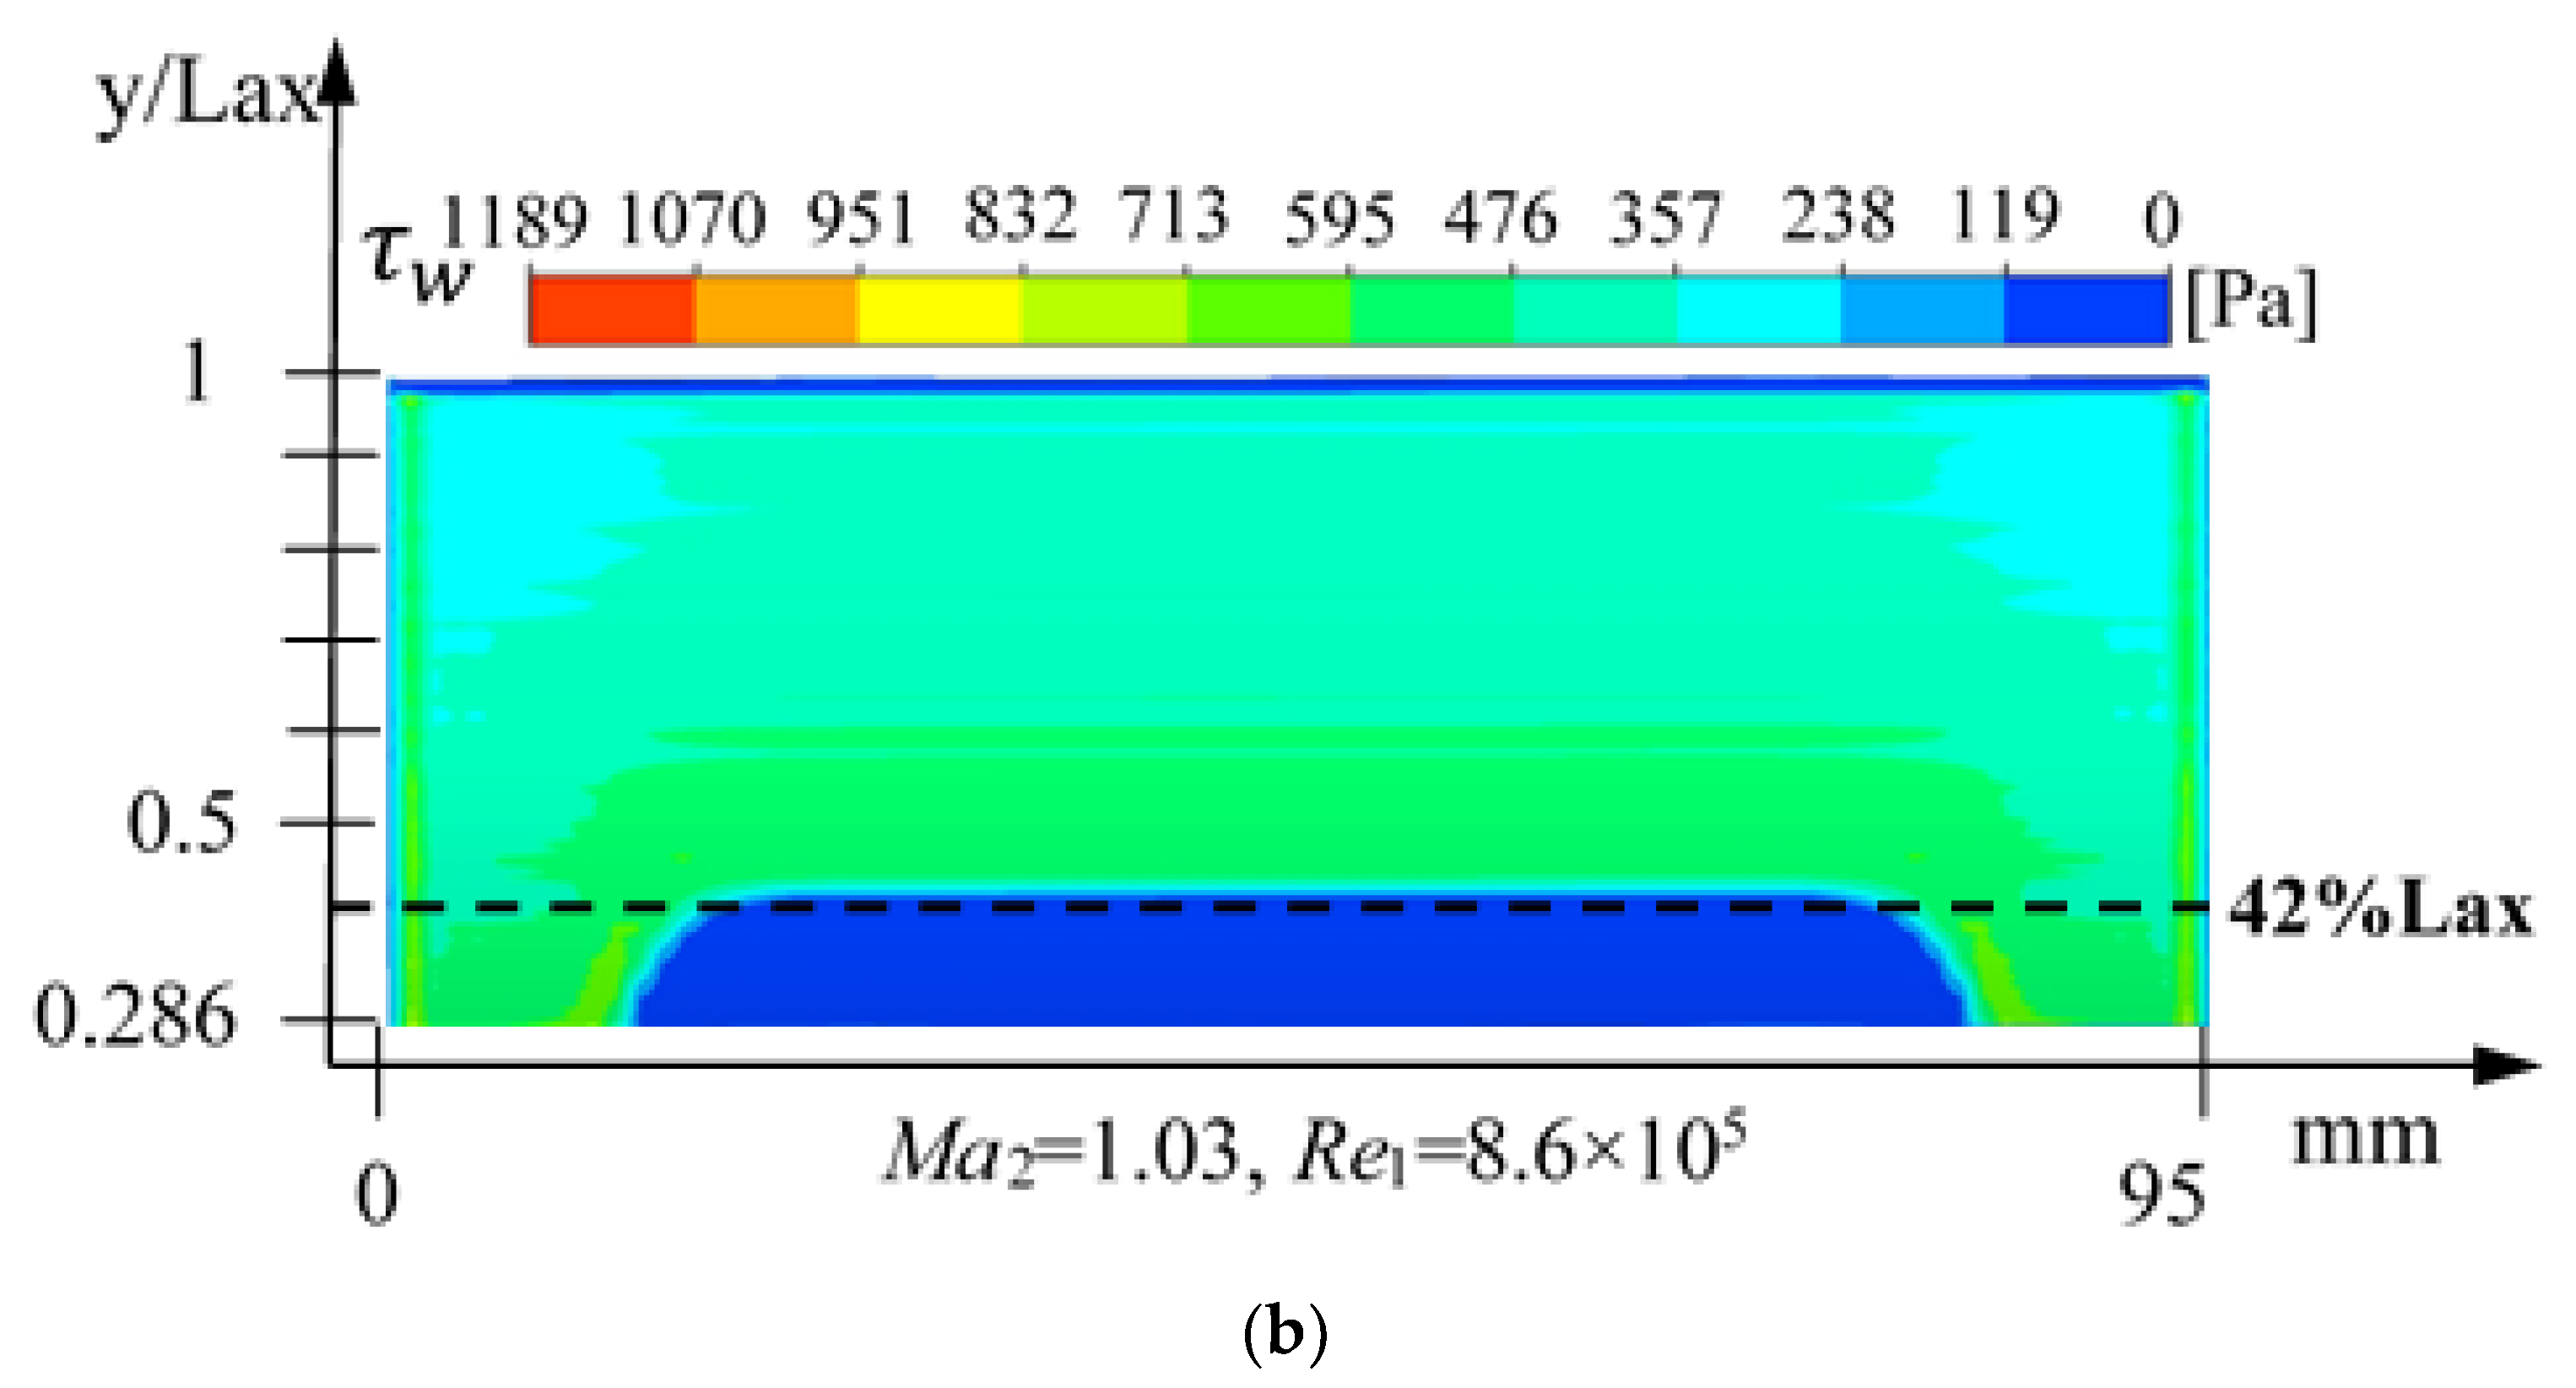
The TSP measurement results at different outlet Mach numbers and inlet Reynolds numbers are shown in Figure 4. The temperature ratio (T/Tref) distribution at both ends of the blade was significantly larger, which was caused by the wall effect. Due to the difference in the heat transfer coefficients of laminar and turbulent flow, there was a significant temperature difference. The slight unevenness of the temperature-sensitive paint spraying on the blade surface and the air flowing through the blade may have been mixed with tiny particles, hitting the blade surface and causing the transition to occur earlier, resulting in a sharp temperature distribution, but the temperature ratio (T/Tref) distribution on the suction surface of the blade changed significantly as a whole, and the occurrence of the transition could be determined. The transitional location was about 0.63 Lax at Ma2 = 0.4, Re1 = 3.1 × 10⁵, as shown in Figure 4a. When Ma2 and Re1 increased to 1.03 and 8.6 × 10⁵, respectively, the boundary layer transition occurred at approximately 0.42 Lax, as shown in Figure 4b. However, with the decrease in Re1, as shown in Figure 4c, the transitional location was moved backward, to about 0.47 Lax. Compared with Figure 4b, the transitional location shifted backward with the increase in Ma2, which occurred at about 0.49 Lax in Figure 4d.

3. Numerical Prediction of Transition

3.1. Numerical Method and Validation

The geometric model of numerical calculation was the transonic VKI-RG cascade, which is the same as the wind-tunnel test model. Since transitional calculation had a high requirement for the mesh refinement of the normal and tangential directions near the wall, the total number of subsequent meshes increased sharply, and the requirements for computing resources were further increased. In addition, the purpose of this study was mainly to focus on the flow of a single blade, so the cascade composed of seven blades was simplified into a single blade, as shown in Figure 5. The inlet was set at 3c from the leading edge of the blade, and the outlet was set at 8c from the trailing edge to ensure the full development of the wake.
To ensure the accuracy of the subsequent numerical calculations, the structured meshes of the geometric model shown in Figure 5 were generated with ICEM CFD software. The blade-shaped part was divided by an O-shaped mesh, and there were 50 mesh nodes along the circumferential direction near the wall. The first-layer height of the mesh was set to 1 × 10⁻⁶ m, which led to y+ < 1 for all test cases. The normal mesh growth ratio is 1.2, and the elements of the 3D computational domain were about 8.01 million. Figure 6 shows the local mesh distribution of the blade cascade. To improve the numerical accuracy of the flow along the flow direction, 240 nodes were arranged along the flow direction, and 120 nodes were arranged along the blade span. Mesh refinement was performed on the trailing part of the edge.
ANSYS CFX software was used to solve the flow field in the computational domain, and all numerical simulations adopted the three-dimensional compressible Reynolds-averaged Navier–Stokes (RANS) equations. The transitional model was the γ-Reθt model proposed by Langtry [28] based on the SST k-ω turbulence model [29], which considers the natural, bypass, and separation-bubble transitions, and can more accurately predict the transitional location [30,31]. Figure 7 shows the boundary condition settings with total pressure at the inlet and static pressure at the outlet, and the specific boundary conditions and solver settings are shown in Table 4.
The reliability of the numerical method was verified by comparing the experimental results of the isentropic Mach number (Mais) and the transitional location on the blade surface. Figure 8 shows the Mais distribution on the surface at 50% blade height when the angle of attack was 0° and the outlet Mach number was 0.78. Overall, the numerical results of the Mais were in good agreement with the experimental results. Figure 9 is a comparison of the transitional location between numerical simulation and experiment, and the transitional locations were basically the same, about 0.42 Lax.

3.2. Numerical Results

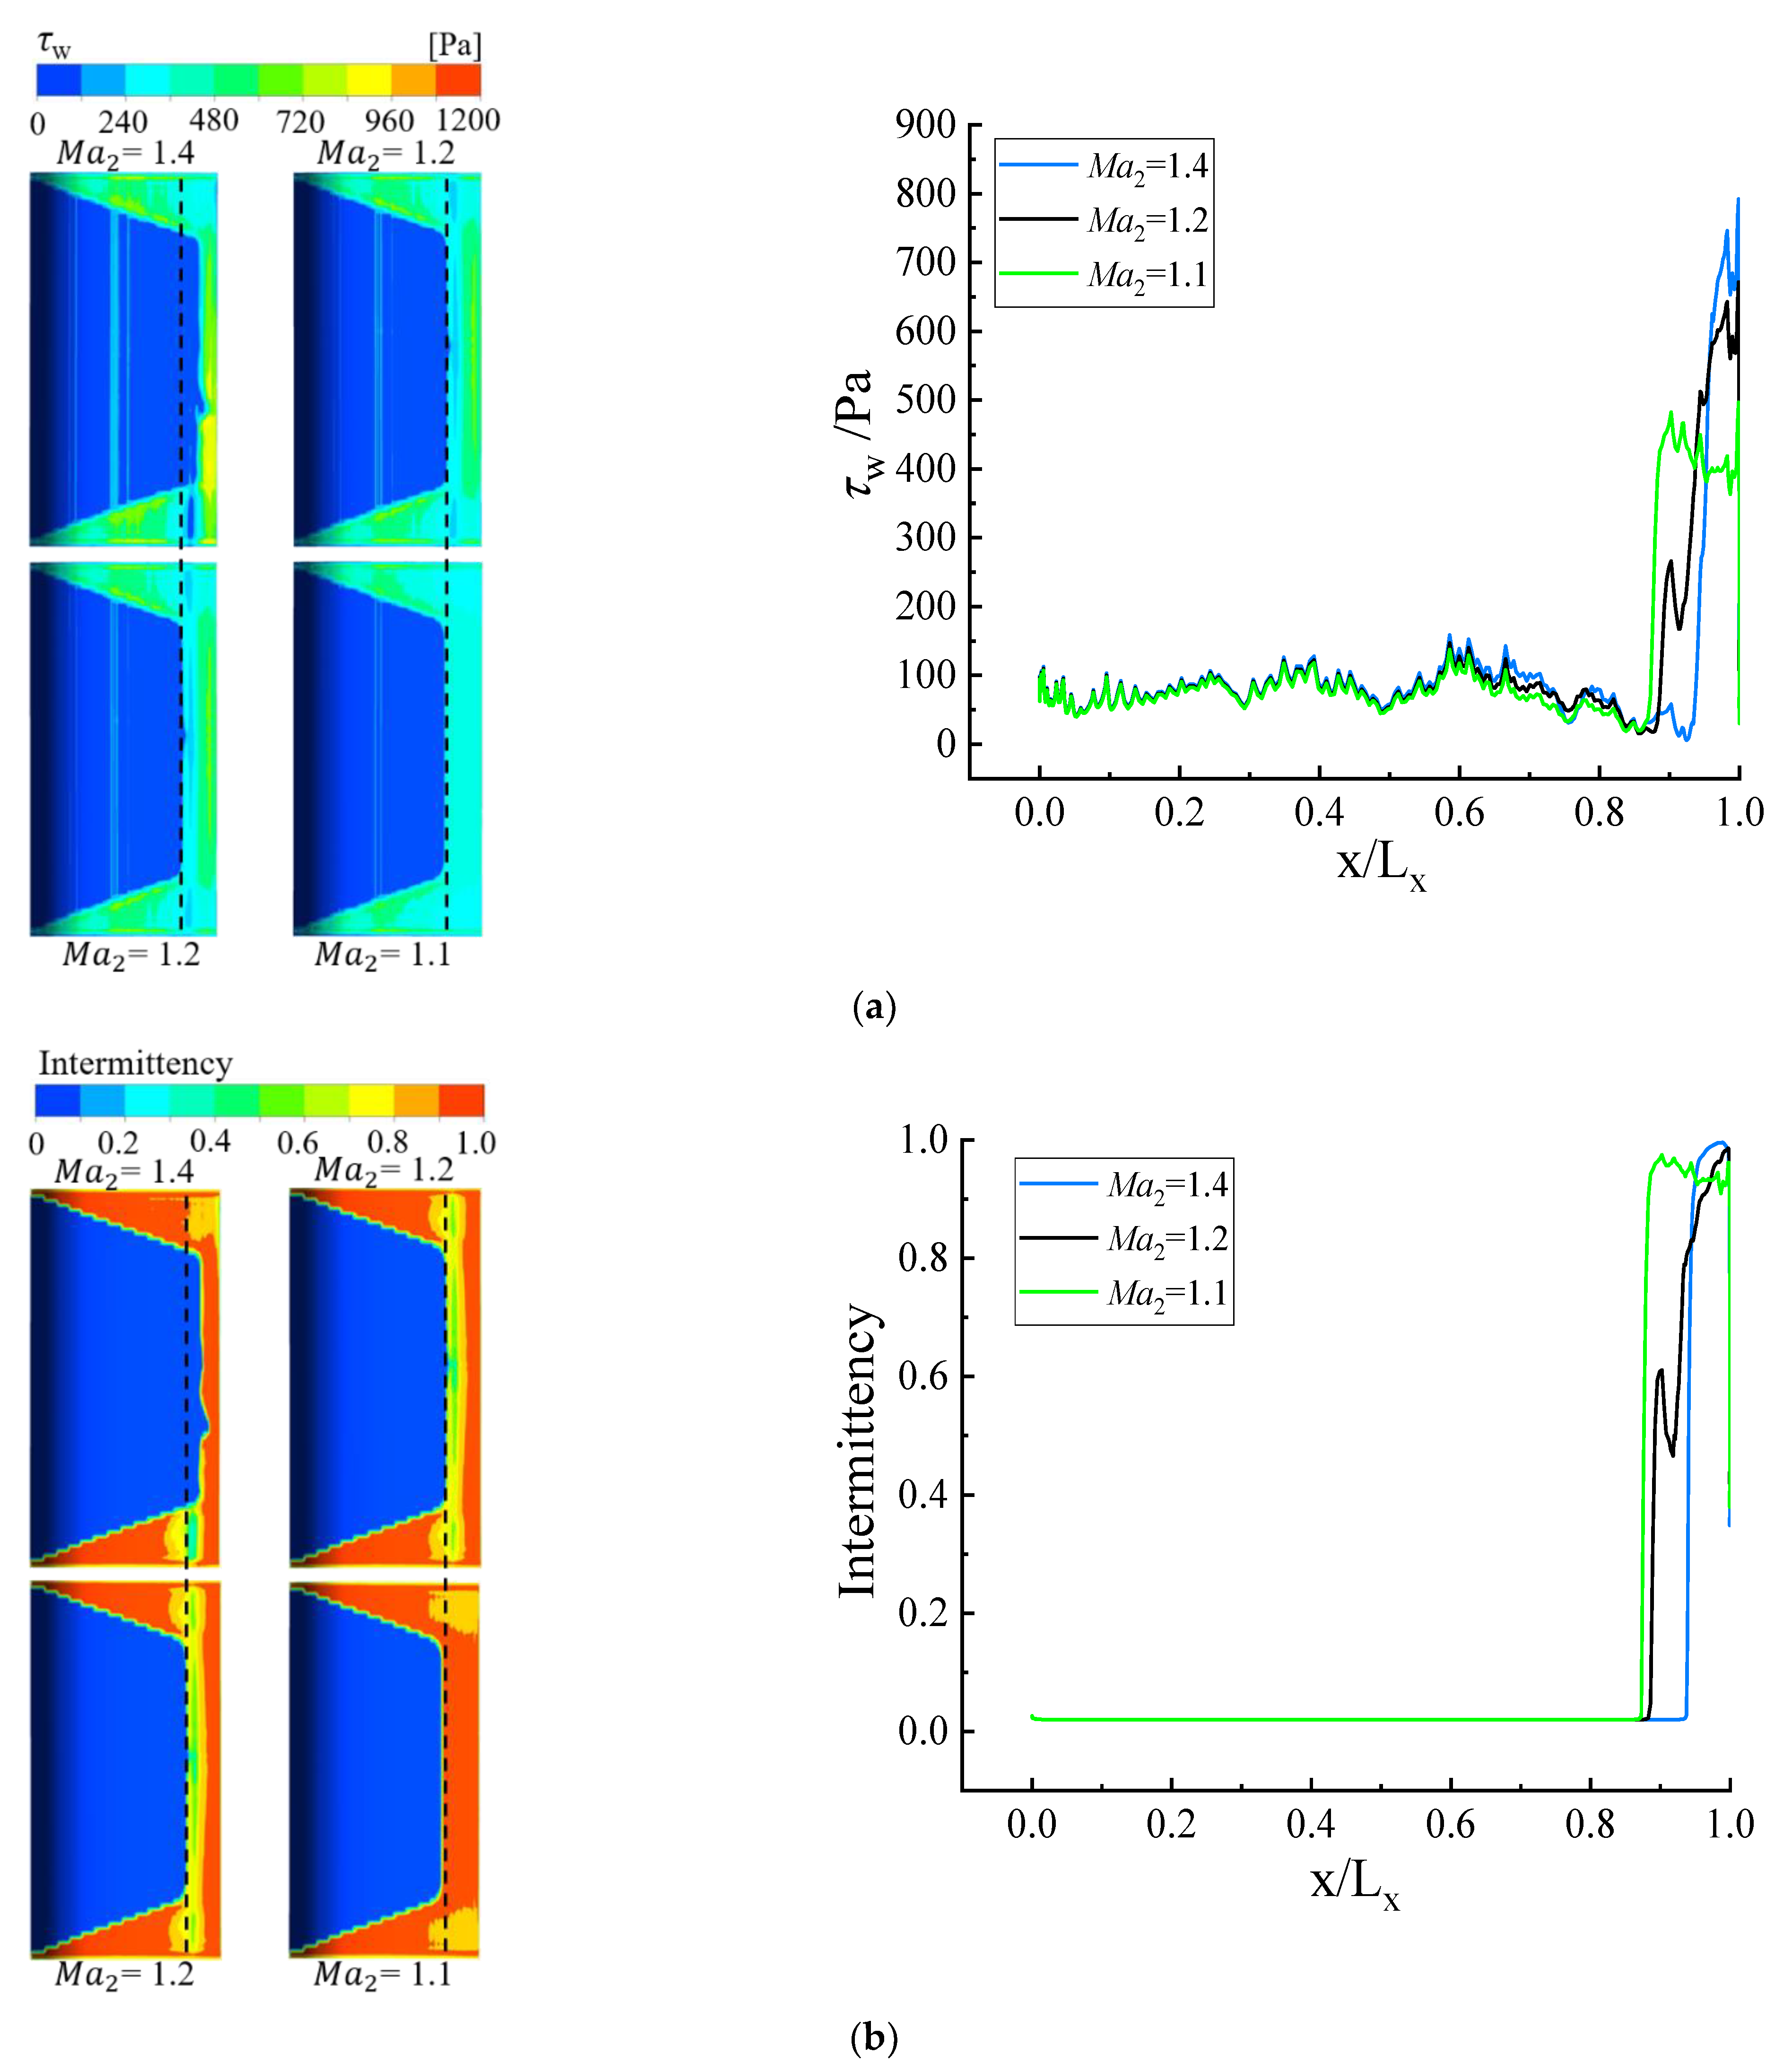
Wall shear and intermittency are more accurate methods to determine the transitional location of the boundary layer. The location where the wall shear begins to increase sharply is the beginning of the transition. Intermittency represents the percentage of time turbulence occurring. When the intermittency is 0, it represents a fully laminar state, and 1 represents a fully turbulent state. The intermittency increases from 0, which represents the beginning of the transition.

3.2.1. Influence of Ma2

To study the effect of the Ma2 on the transitional location of the blade boundary layer, numerical calculations were carried out for Ma2 < 1 and Ma2 > 1 by adjusting the outlet static pressure. Figure 10 shows the distribution of wall shear and intermittency on the suction side of the blade at Ma2 < 1, and the transitional location moved forward with the increase in Ma2. In Figure 10a, the transition occurred at about 60% Lx at Ma2 = 0.56. The transitional location was significantly moved forward, which occurred at 51%Lx at Ma2 = 0.78. With the further increase in Ma2, the transitional location was about 48%Lx at Ma2 = 0.98. Furthermore, the wall shear in the laminar and turbulent parts increased with increasing Ma2. The same transitional location and its variation with Ma2 could be obtained from the intermittency distribution shown in Figure 10b.
Figure 11 is the distribution of wall shear and intermittency on the suction side of the blade at Ma2 > 1, and the transitional location moved backward with the increase in Ma2. In Figure 11a, the transition occurred at about 86% Lx at Ma2 = 1.1. The transitional location was significantly moved backward, which occurred at 88%Lx at Ma2 = 1.2. As Ma2 further increased, the transitional location was about 94% Lx at Ma2 = 1.4. Furthermore, the shear stress in the laminar remained constant, while the wall shear in the turbulent part increased with increasing Ma2. Figure 10b shows the intermittency distribution with different Ma2. The variation trend of intermittency was the same as that of the wall shear.

3.2.2. Influence of Attack Angle

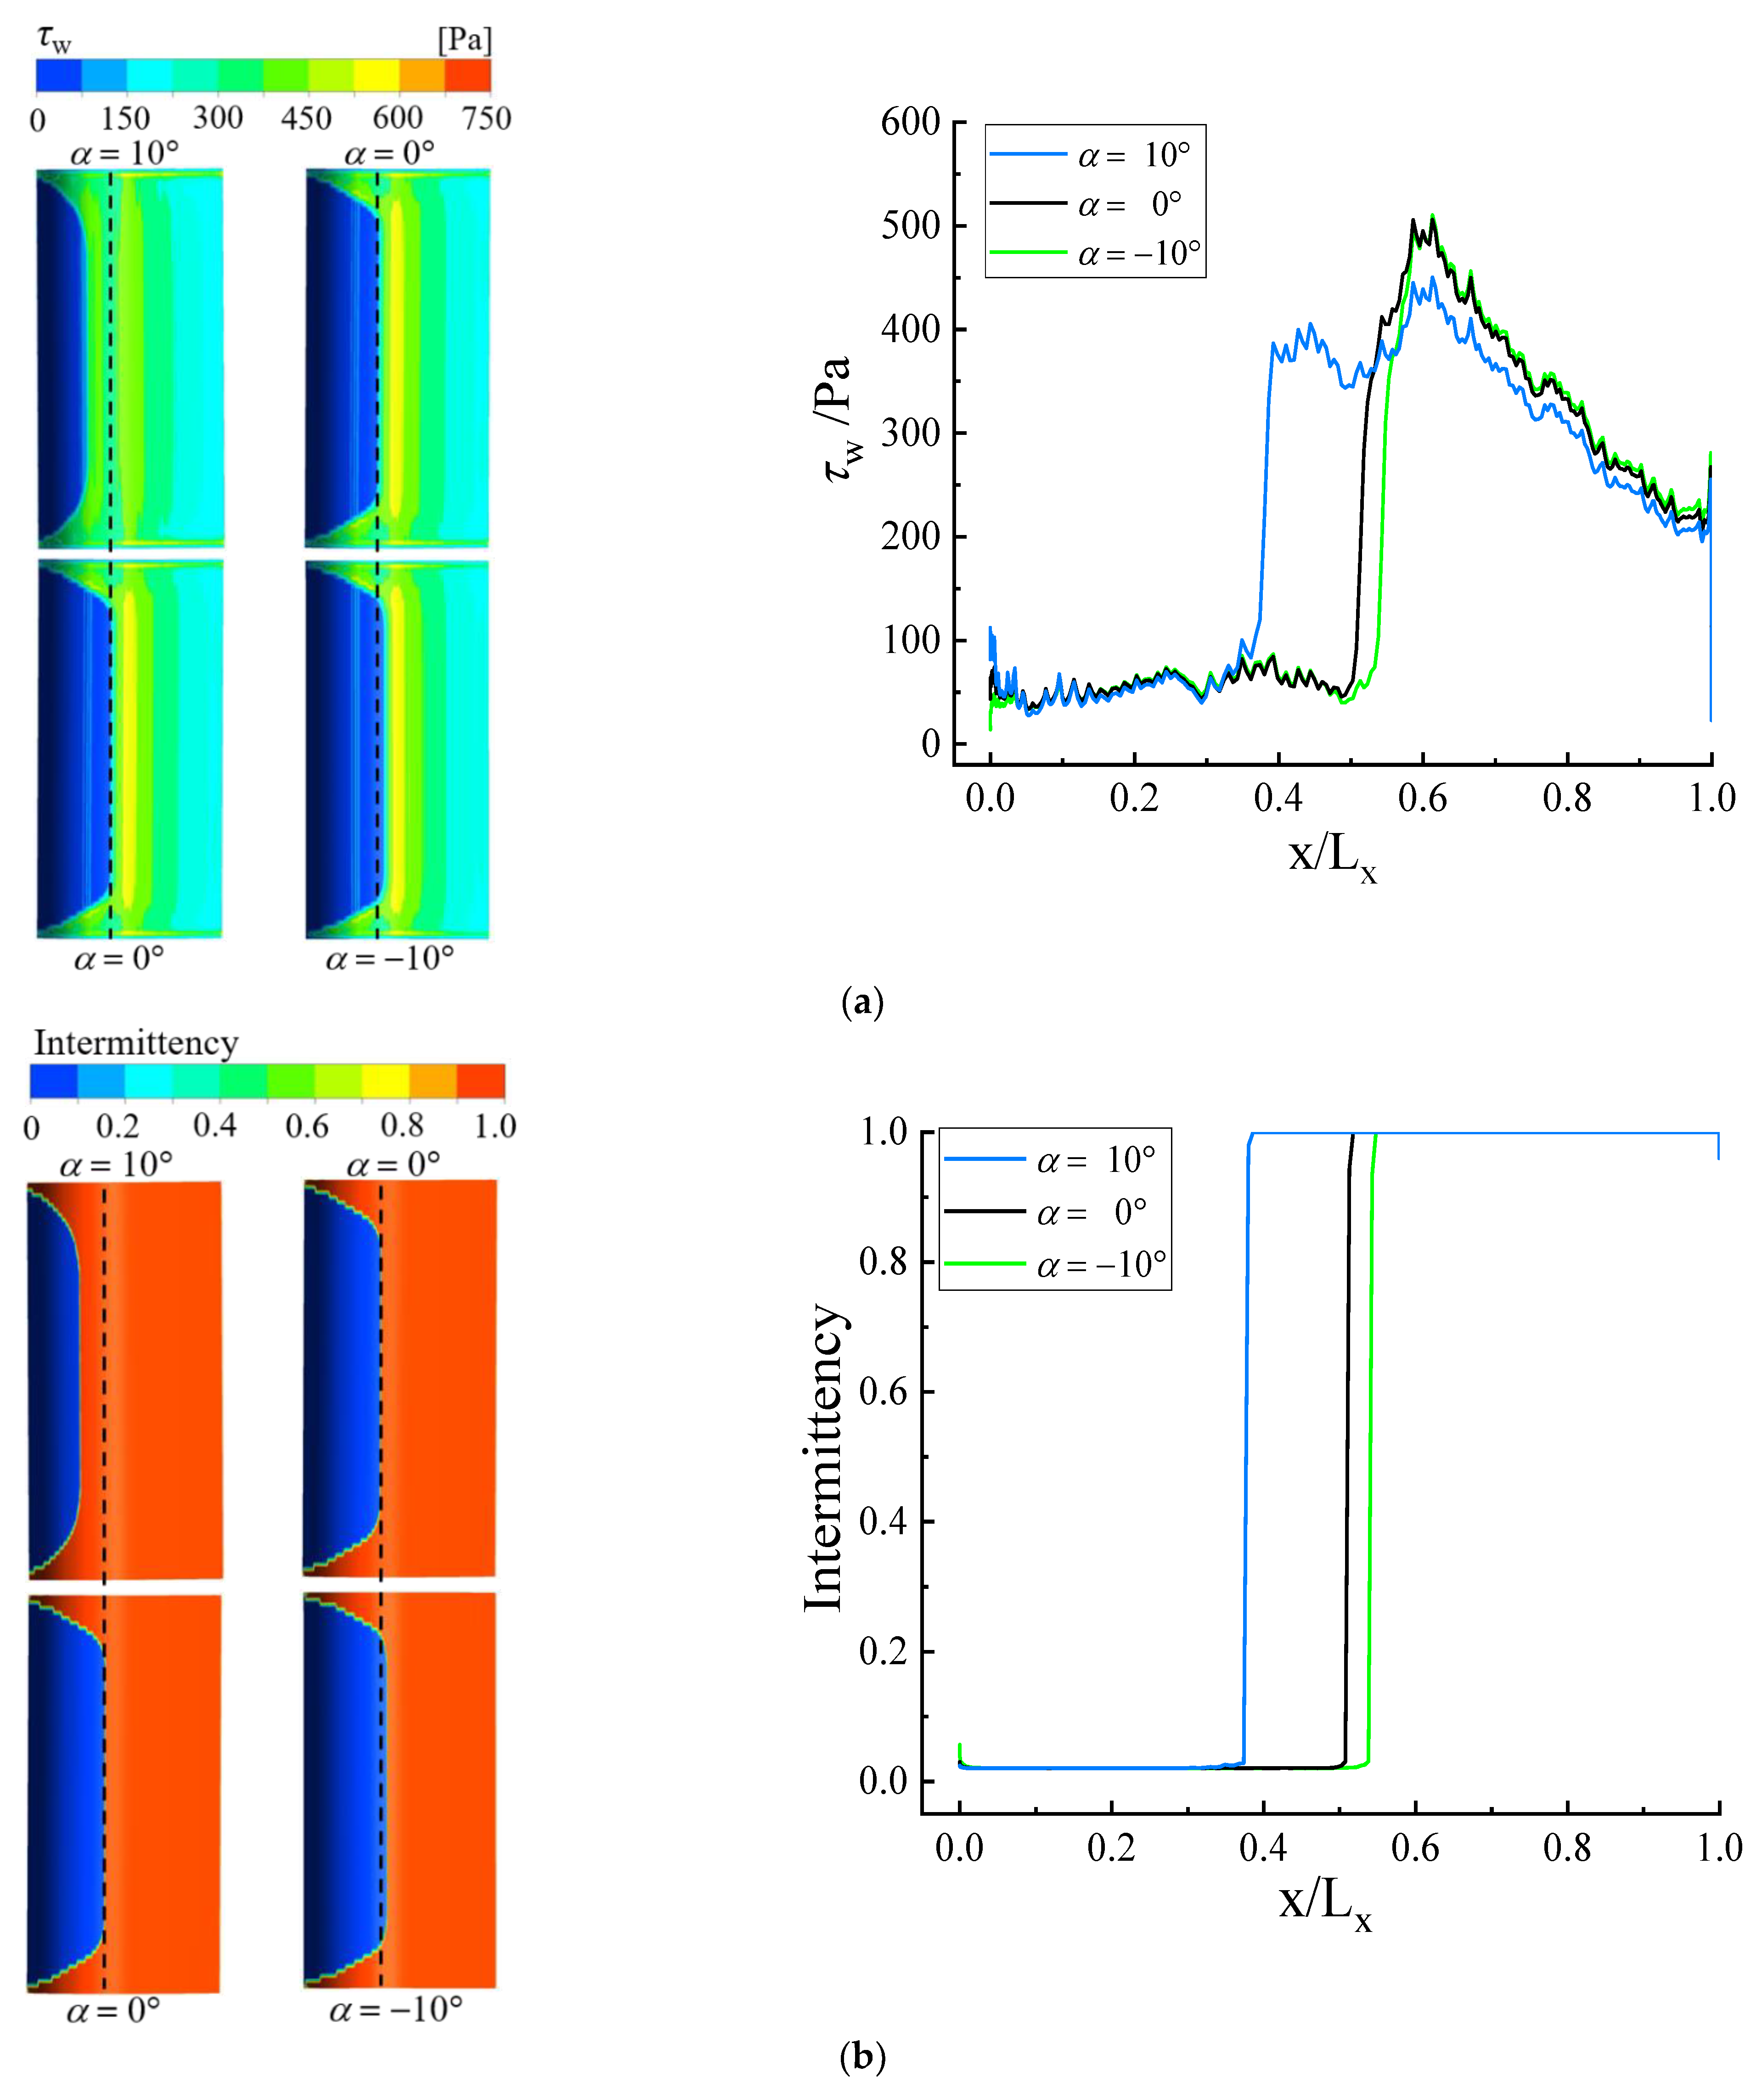
Figure 12 shows the distribution of wall shear and intermittency on the suction side of the blade under different attack angles, and the transitional location moved forward with the increase of α. In Figure 12a, the transition occurred at about 54%Lx at α = −10°. The transitional location was significantly moved forward, which occurred at 51%Lx at α = 0°. With a further increase in the angle of attack, the transitional location was about 37%Lx at α = 10°.
In addition, the shear stress in the laminar remained constant, while the wall shear in the turbulent part decreased slightly with an increased attack angle. The same transitional location and its variation trend with α could be obtained from the intermittency distribution in Figure 12b.

3.2.3. Shock-Wave Influence

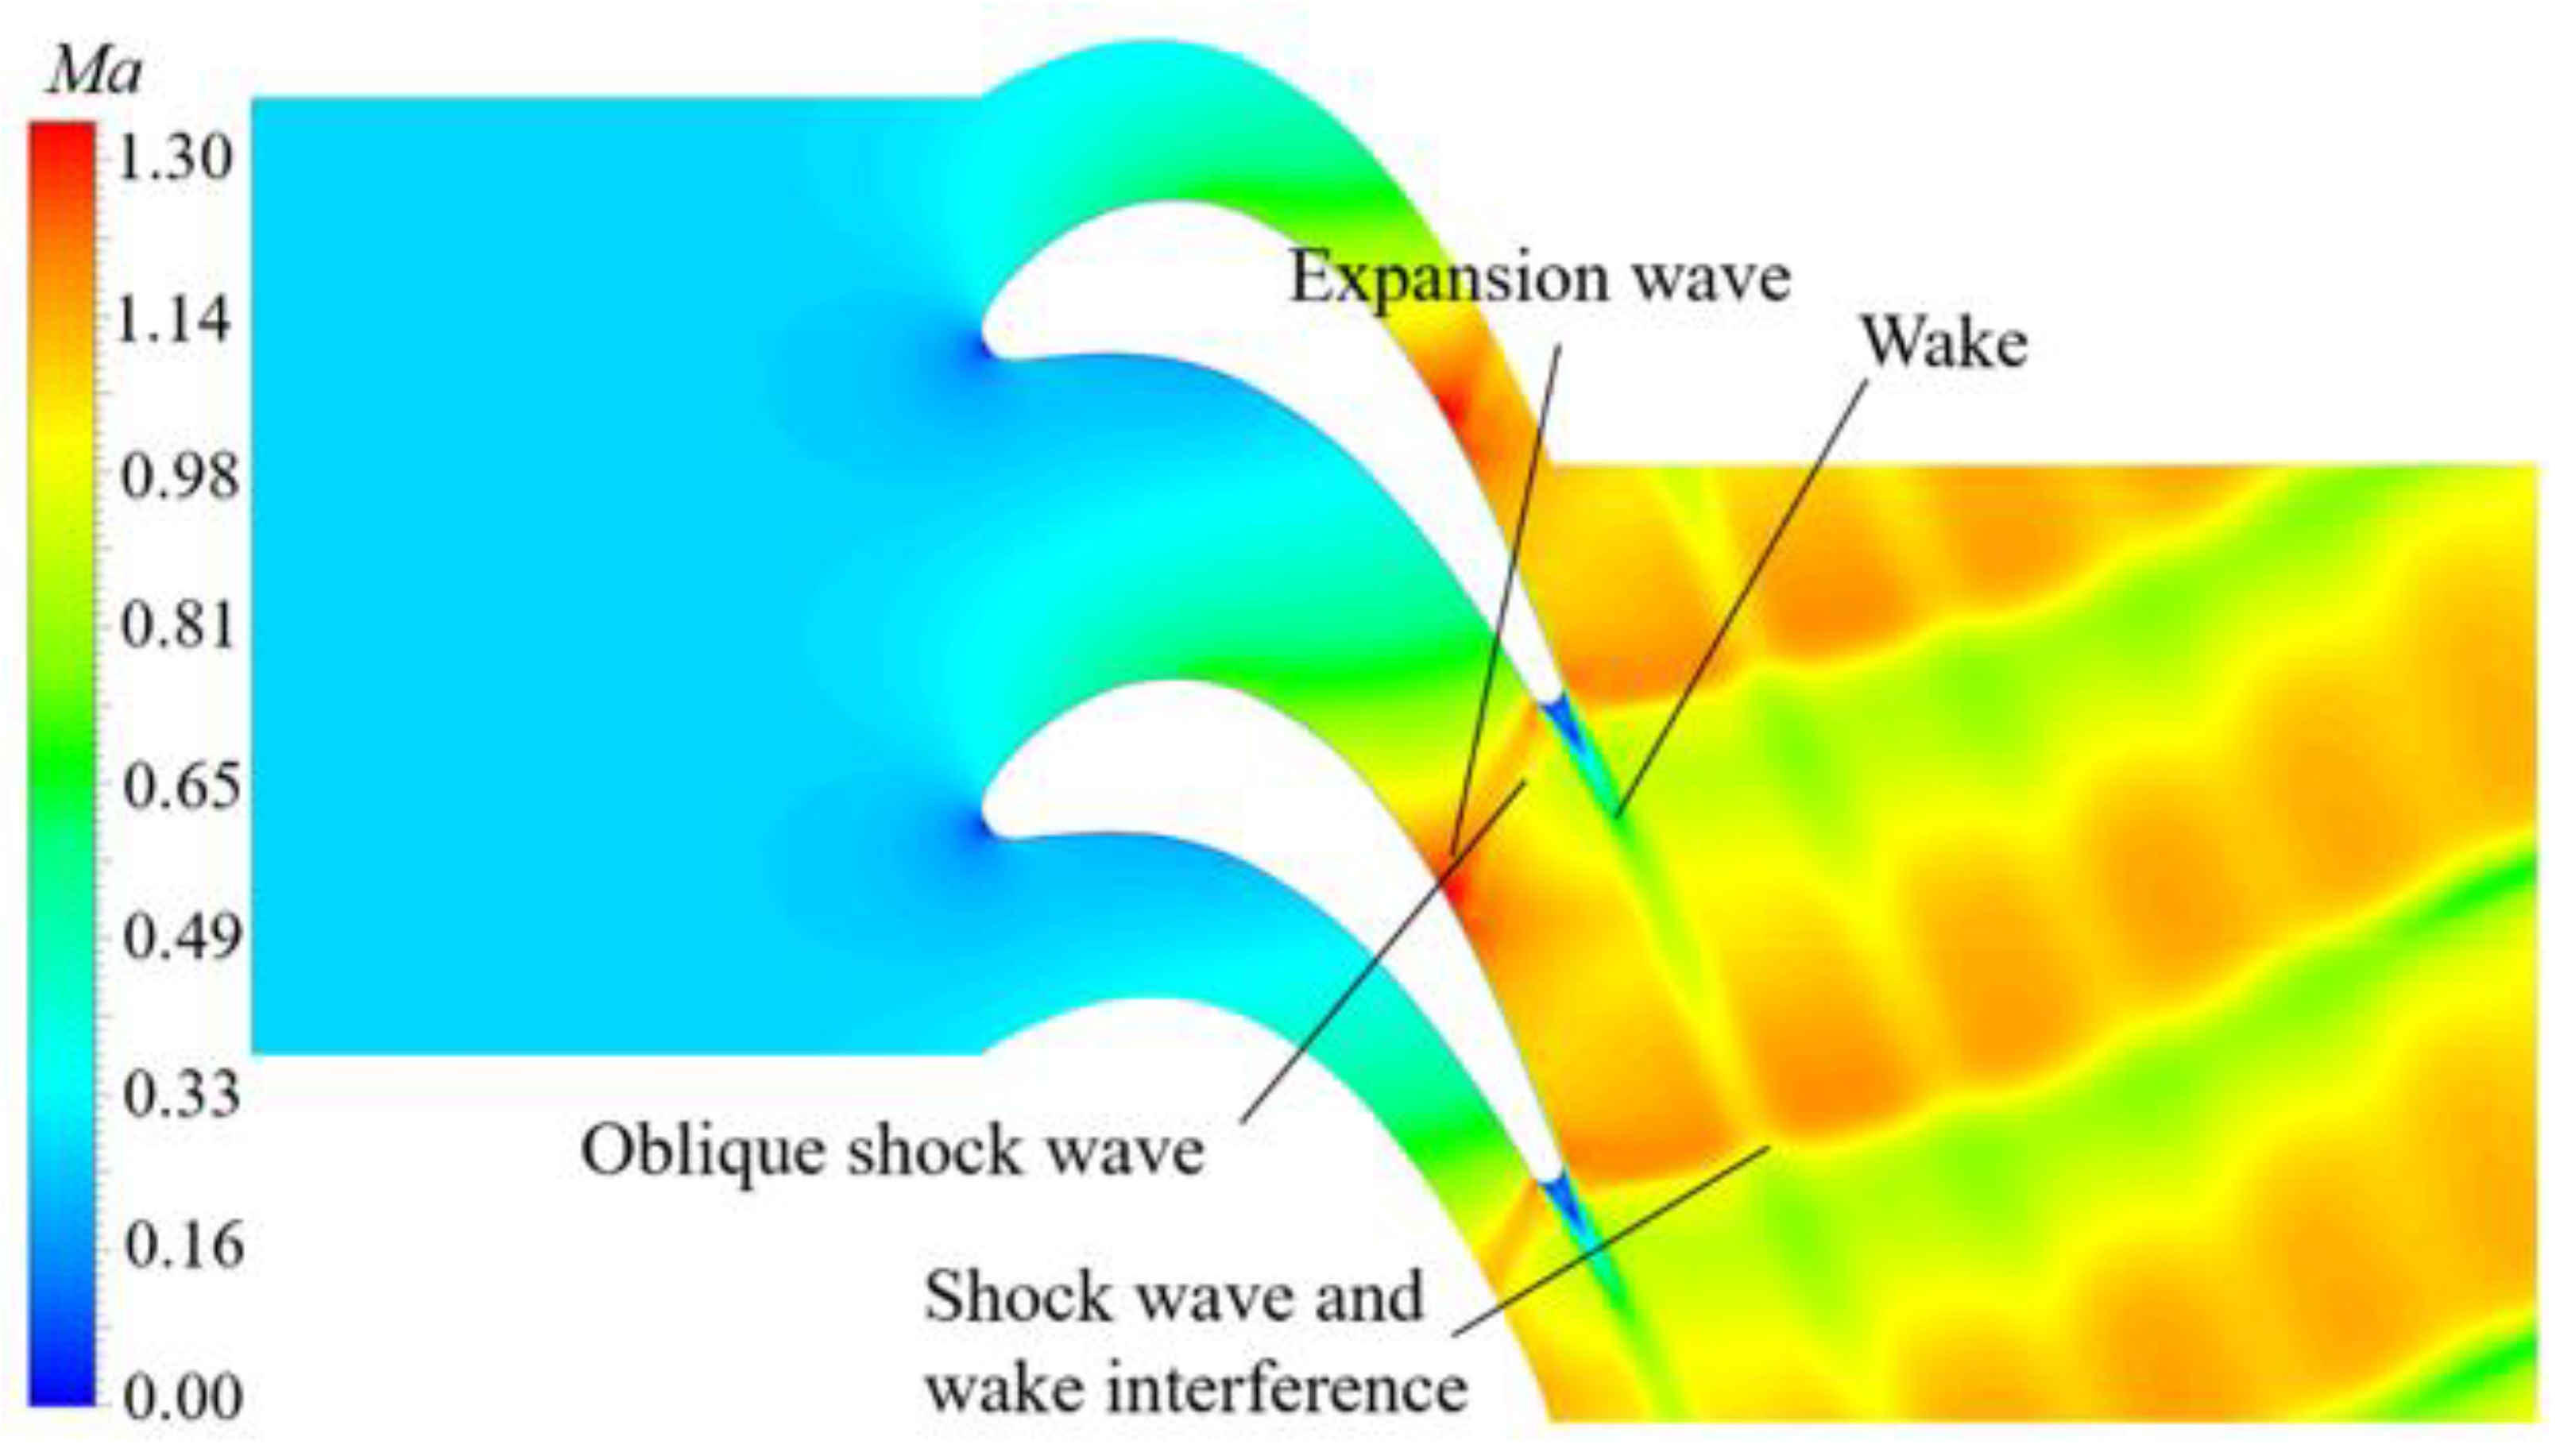
When the Mach number of the flow field is greater than 1, strong disturbances often occur in flows, such as the sudden compression of supersonic airflow. At that time, sudden changes in flow parameters often occur, that is, shock waves. Figure 13 shows the Mach number distribution of the flow field. The airflow flowed into the leading edge and out of the trailing edge. When flowing through the suction side, it first passed through the expansion wave, which caused the pressure here to drop sharply, and then passed through the shock wave, that is, the compression wave, causing the pressure to increase sharply. Moreover, the wake was formed behind the base pressure of the trailing edge, and interference between shock and wake could be seen.
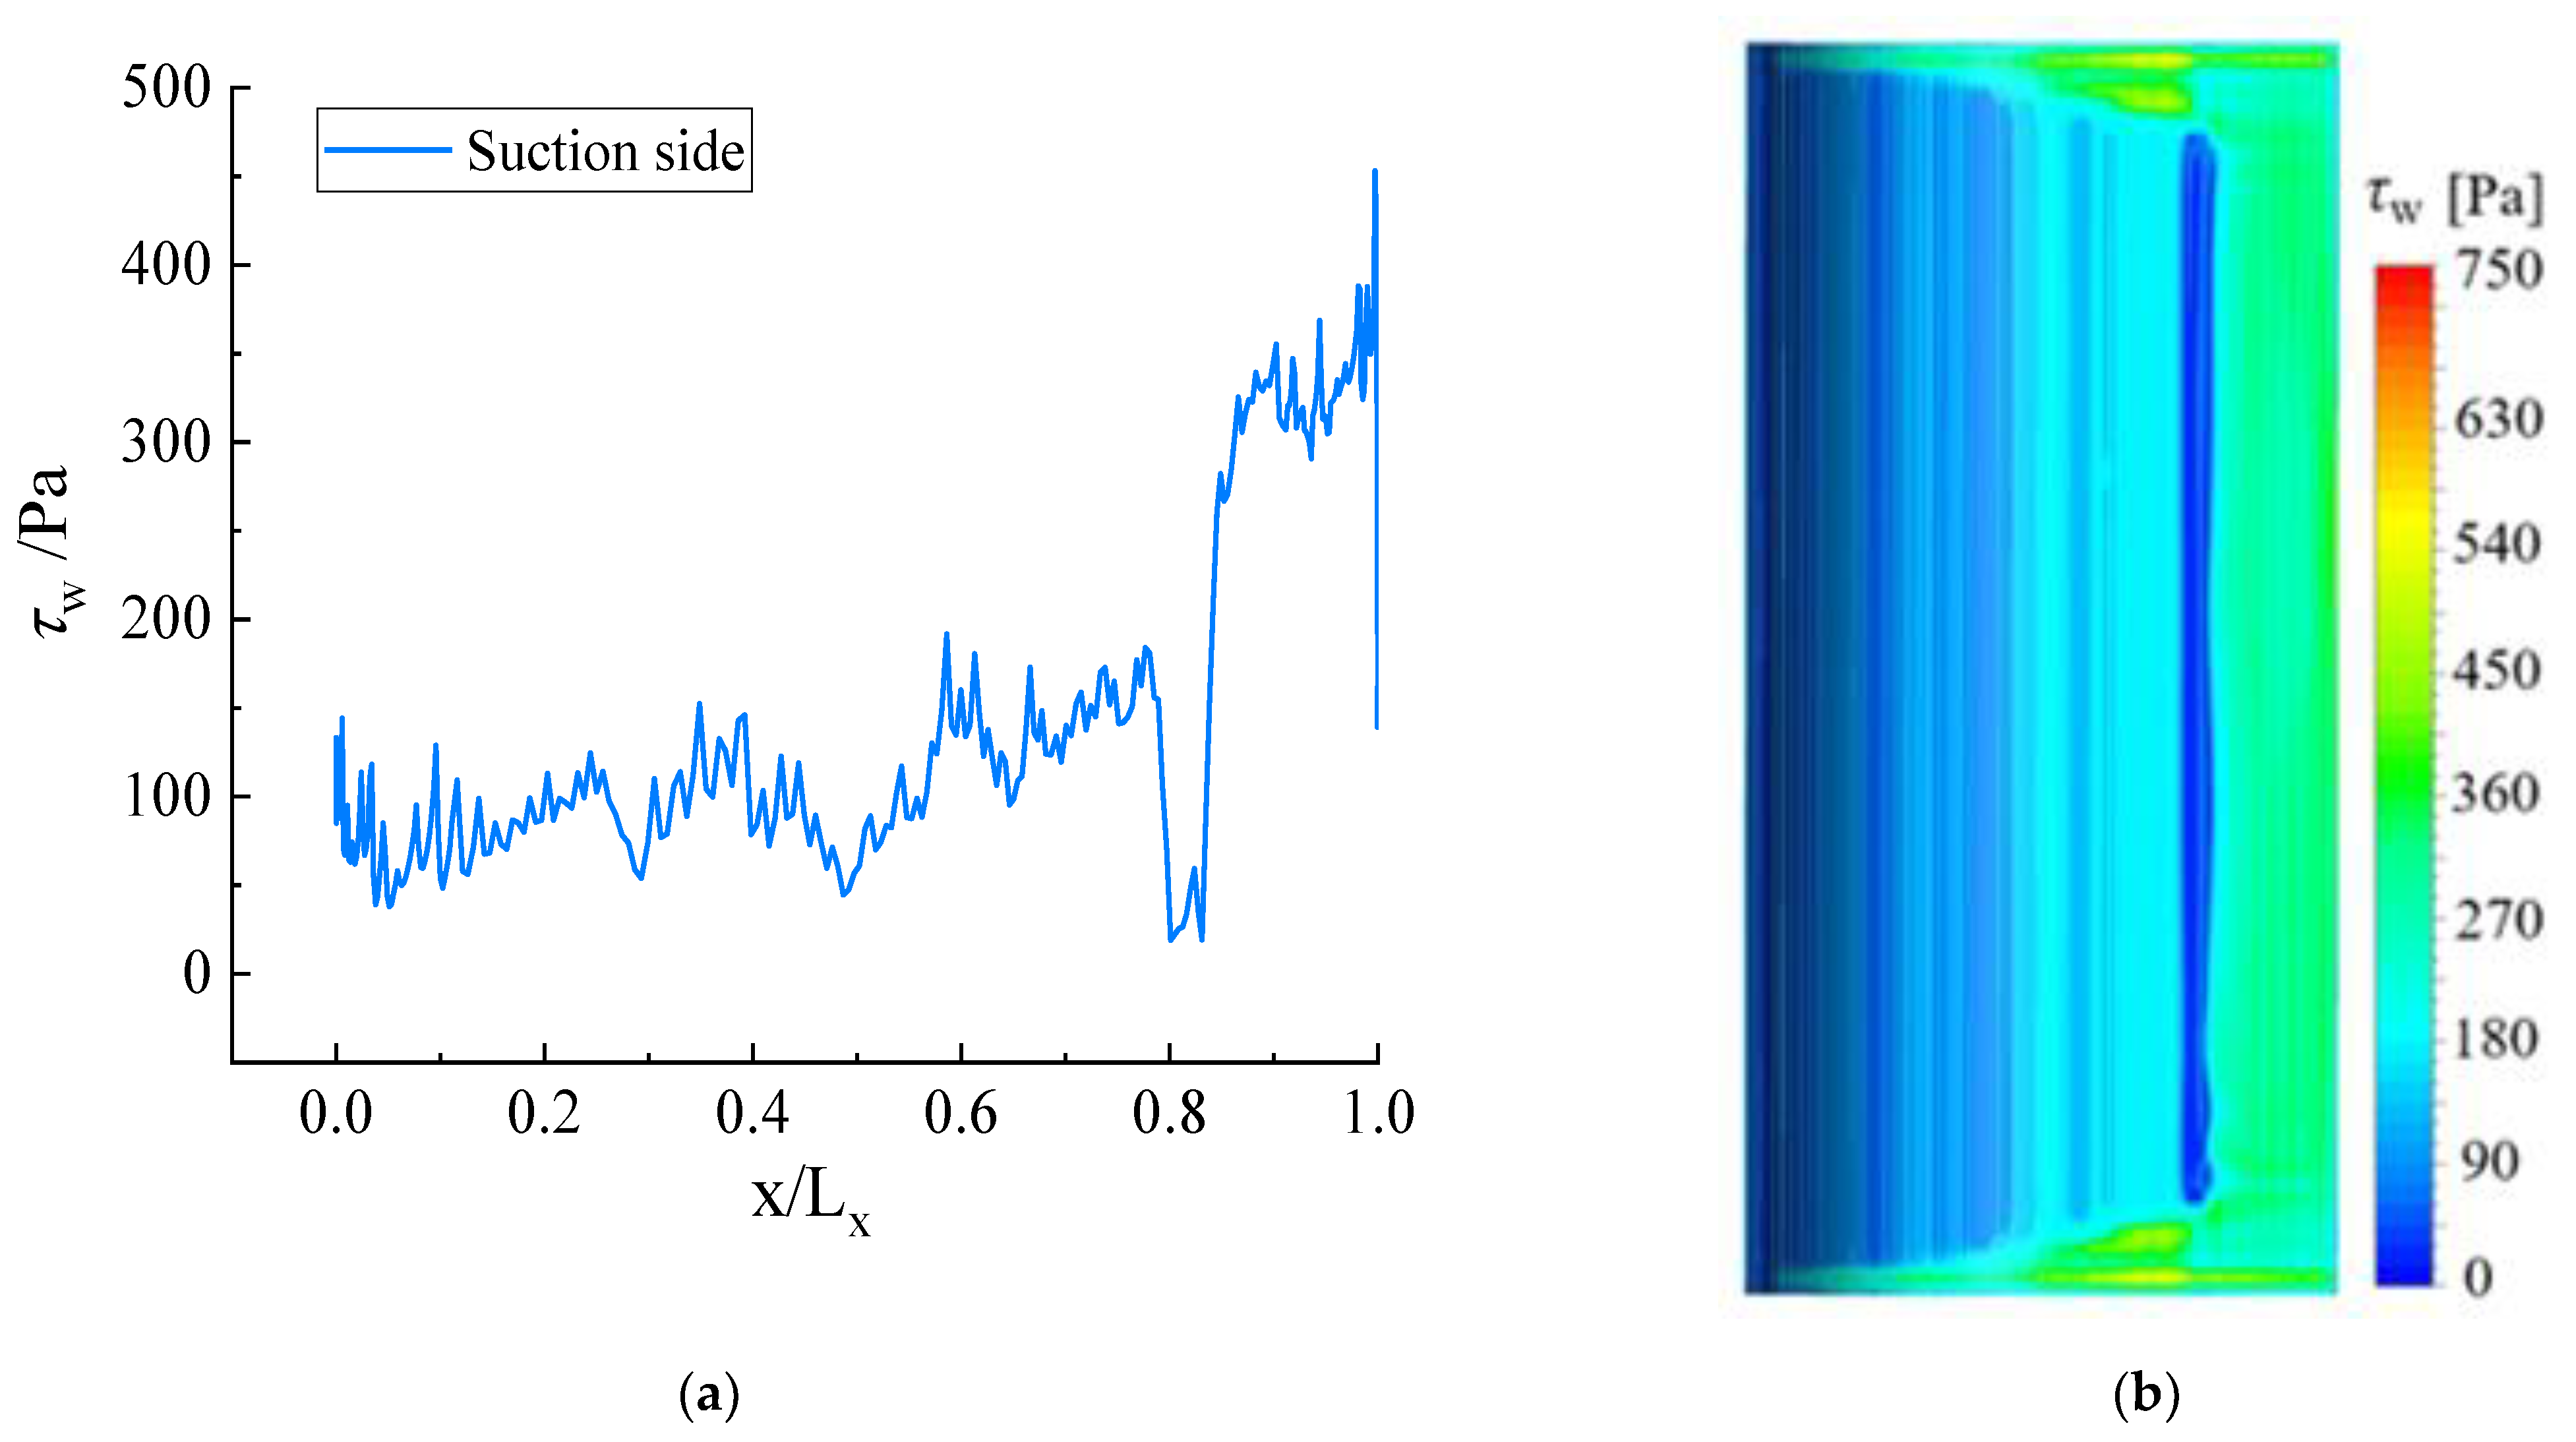
The wall shear distribution at 50% of the blade height in Figure 14 also shows that an expansion wave was generated near 0.8 Lx. The shear stress dropped sharply at the chord length of 80–83%, and the pressure suddenly increased after the shock wave, resulting in a strong reverse pressure gradient that eventually led to laminar boundary layer separation. The local streamlines of the suction side in Figure 15 show the existence of a separation bubble. The laminar separation trigger transition occurred at 0.85 Lx, and the wall shear increased rapidly at 85% Lx.

4. Conclusions

In this paper, to study the transitional prediction of the planar cascade and the variation law of the transitional location, TSP transitional measurement tests were carried out under the conditions of Ma2 = 0.4, 1.03, and 1.2. The numerical simulations of plane cascade transition with different Ma2 (Ma2 = 0.56, 0.78, 0.98, 1.1, 1.2, 1.4) and α (α = −10°, 0°, 10°) were investigated. The main obtained conclusions are as follows:
(1)
TSP transitional measurement results show that the transitional location was about 0.63 Lax at Ma2 = 0.4, Re1 = 3.1 × 10⁵, and transition occurred at approximately 0.42 Lax at Ma2 = 1.03 Re1 = 8.6 × 10⁵. As Re1 decreased, the transitional location moved backward, about 0.47 Lax at Ma2 = 1.03, Re1 = 3.1 × 10⁵. The transitional location shifted backward with the increase in Ma2, occurring at about 0.49 Lax at Ma2 = 1.2, Re1 = 8.6 × 10⁵.
(2)
The numerical calculations of the planar cascade with Ma2 < 1 (Ma2 = 0.56, 0.78, 0.98) and α (α = −10°, 0°, 10°) were completed. The boundary layer transition of the planar cascade moved forward with the increase in Ma2 and α.
(3)
Numerical calculations of the planar cascade with Ma2 > 1 (Ma2 = 1.1, 1.2, 1.4) were carried out. The transitional location of the boundary layer moved backward with the increase in Ma2, which was consistent with the experimental results. In addition, the generation of shock waves formed a large adverse pressure gradient that led to the onset of transition.

Author Contributions

W.K., methodology, numerical simulations, data analysis, writing, and review; H.W., methodology and data curation; W.Z., review and editing, and data curation; K.H.: methodology and review; B.Z., supervision and project administration. All authors have read and agreed to the published version of the manuscript.

Funding

This research was financially supported by the National Natural Science Foundation of China (grant numbers 51736008 and 52109107), Open project of State Key Laboratory of Aerodynamics (grant number SKLA-20190102), the State Key Laboratory of Hydroscience and Hydraulic Engineering (grant number 2021-KY-04), and the Open Research Fund Program of the State Key Laboratory of Hydroscience and Engineering (grant number sklhse-2022-E-03). The authors would like to thank the reviewers for their constructive comments and suggestions.

Data Availability Statement

Data are available in the article.

Acknowledgments

All individuals included in this section have consented to the acknowledgement.

Conflicts of Interest

The authors declare no conflict of interest.

References

  1. Reshotko, E. Boundary-layer stability and transition. Annu. Rev. Fluid Mech. 1976, 8, 311–349. [Google Scholar] [CrossRef]
  2. Moin, P.; Mahesh, K. Direct numerical simulation: A tool in turbulence research. Annu. Rev. Fluid Mech. 1998, 30, 539–578. [Google Scholar] [CrossRef] [Green Version]
  3. Herbert, T. Secondary instability of boundary layers. Annu. Rev. Fluid Mech. 1988, 20, 487–526. [Google Scholar] [CrossRef]
  4. Coull, J.; Hodson, H. Unsteady turbines boundary-layer transition in low-pressure. J. Fluid Mech. 2011, 681, 370–410. [Google Scholar] [CrossRef]
  5. Zhong, X.; Wang, X. Direct numerical simulation on the receptivity, instability, and transition of hypersonic boundary layers. Annu. Rev. Fluid Mech. 2012, 44, 527–561. [Google Scholar] [CrossRef] [Green Version]
  6. Parziale, N.; Shepherd, J.; Hornung, H.G. Differential interferometric measurement of instability in a hypervelocity boundary layer. AIAA J. 2013, 51, 750–754. [Google Scholar] [CrossRef] [Green Version]
  7. Matsumura, S.; Schneider, S.; Berry, S. Flow Visualization Measurement Techniques for High-Speed Transition Research in the Boeing/AFOSR Mach-6 Quiet Tunnel. In Proceedings of the 39th AIAA/ASME/SAE/ASEE Joint Propulsion Conference and Exhibit, Huntsville, AL, USA, 20–23 July 2013. [Google Scholar]
  8. Kwak, D.Y.; Yoshida, K.; Noguchi, M.; Ishikawa, H. Boundary layer transition measurement using Preston tube on NEXST-1 flight test. In Proceedings of the 25th AIAA Applied Aerodynamics Conference, Miami, FL, USA, 25–28 June 2007. [Google Scholar]
  9. Drake, A. Oil film interferometry in the development of long endurance aircraft. In Proceedings of the 48th AIAA Aerospace Sciences Meeting Including the New Horizons Forum and Aerospace Exposition, Orlando, FL, USA, 4–7 January 2010. [Google Scholar]
  10. Hilfer, M.; Dufhaus, S.; Yorita, D.; Klein, C.; Petersen, A. Application of pressure- and temperature-sensitive paint on a highly loaded turbine guide vane in a transonic linear cascade. In Proceedings of the Global Power and Propulsion Society Forum, Zurich, Switzerland, 16–18 January 2017. [Google Scholar]
  11. Fey, U.; Egami, Y.; Konrath, R.; Kirmse, T.; Ahlefeldt, T.; Kompenhans, J. Advanced measurement techniques for high Reynolds number testing in cryogenic wind tunnels. In Proceedings of the 48th AIAA Aerospace Sciences Meeting Including the New Horizons Forum and Aerospace Exposition, Orlando, FL, USA, 4–7 January 2010. [Google Scholar]
  12. Hausmann, F.; Schroeder, W.; Limberg, W. Development of a multi-sensor hot-film measuring technique for transition detection in cruise flight. In Proceedings of the 40th AIAA Aerospace Sciences Meeting & Exhibit, Reno, NV, USA, 14–17 January 2002. [Google Scholar]
  13. Jun, Z.; Zhenghong, G.; Hao, Z.; Junqiang, B. A high-speed nature laminar flow airfoil and its experimental study in wind tunnel with nonintrusive measurement technique. Chin. J. Aeronaut. 2009, 22, 225–229. [Google Scholar] [CrossRef] [Green Version]
  14. Halstead, D.E.; Wisler, D.C.; Okiishi, T.H.; Walker, G.J.; Hodson, H.P.; Shin, H.W. Boundary Layer Development in Axial Compressors and Turbine: Part 1 of 4 Composite Picture. J. Turbomach. 1997, 119, 114–127. [Google Scholar] [CrossRef]
  15. Chen, Z.; Guo, Y.C.; Gao, C. Principle and technology of three-dimensional PIV. J. Exp. Fluid Mech. 2006, 20, 77–82, 105. (In Chinese) [Google Scholar]
  16. Medina, H.; Benard, E.; Huang, J.C.; Raghunathan, S. Study of the fluid mechanics of transitional steady and pulsed impinging jets using a high-speed PIV system. In Proceedings of the 46th AIAA Aerospace Sciences Meeting and Exhibit, Reno, NV, USA, 7–10 January 2008. [Google Scholar]
  17. Horstmann, K.; Redeker, G.; Quast, A.; Dressler, U.; Bieler, H. Flight Tests with a Natural Laminar Flow Glove on a Transport Aircraft. In Proceedings of the AIAA Flight Simulation Technologies Conference and Exhibit, Dayton, OH, USA, 17–19 September 1990. [Google Scholar]
  18. Horstmann, K.H.; Quast, A.; Redeker, G. Flight and wind-tunnel investigation on boundary layer transition at reynold number up to 10 to the 7th. In Proceedings of the 16th ICAS Congress, Jerusalem, Israel, 28 August–2 September 1988; Volume 2, pp. 979–986. [Google Scholar]
  19. Holmes, B.J.; Gall, P.D.; Croom, C.C.; Manuel, G.S.; Kelliher, W.C. A New Method for Laminar Boundary Layer Transition Visualization in Flight: Color Changes in Liquid Crystal Coatings: NASA-TM-87666[R]; NASA: Washington, DC, USA, 1986.
  20. Mee, D.J.; Walton, T.W.; Harrison, S.B.; Jones, T. A comparison of liquid crystal techniques for transition detection: AIAA-1991-0062[R]. In Proceedings of the 29th Aerospace Sciences Meeting, Reston, VA, USA, 7–10 January 1991. [Google Scholar]
  21. Kameda, M. Fast-responding pressure-sensitive paints for unsteady flow measurement. In Proceedings of the 10th Pacific Symposium on Flow Visualization and Image Processing, Naple, Italy, 15–18 June 2015. [Google Scholar]
  22. Gregory, J.W.; Sakaue, H.; Liu, T.; Sullivan, J.P. Fast pressure-sensitive paint for flow and acoustic diagnostics. Annu. Rev. Fluid Mech. 2014, 46, 303–330. [Google Scholar] [CrossRef]
  23. Zhu, Y.; Chen, X.; Wu, J.; Chen, S.; Lee, C.; Gad-el-Hak, M. Aerodynamic heating in transitional hypersonic boundary layers: Role of second-mode instability. Phys. Fluids 2018, 30, 011701. [Google Scholar] [CrossRef]
  24. Fey, U.; Egami, Y.; Engler, R. High Reynolds number transition detection by means of temperature sensitive paint. In Proceedings of the 44th AIAA Aerospace Sciences Meeting and Exhibit, Reno, NV, USA, 9–12 January 2006. [Google Scholar]
  25. Hampali, C.D. Numerical analysis of laminar to turbulent transition boundary layer flow. Mater. Today Proc. 2021, 54, 319–324. [Google Scholar]
  26. DiviaHarshaVardini, R.C.; Arul Prakash, K.; Rajesh, G. An all-speed formulation using a modified γ-model for the prediction of boundary layer transition and heat transfer. Int. J. Heat Mass Transf. 2022, 195, 123121. [Google Scholar]
  27. Liu, T.; Sullivan, J.P. Pressure and Temperature Sensitive Paints; Springer: Berlin/Heidelberg, Germany, 2005. [Google Scholar]
  28. Langtry, R.B. A Correlation-Based Transition Model Using Local Variables for Unstructured Parallelized CFD Codes. Master’s Thesis, University of Stuttgart, Stuttgart, Germany, 2006. [Google Scholar]
  29. Wang, W.; Tai, G.; Pei, J.; Pavesi, G.; Yuan, S. Numerical investigation of the effect of the closure law of wicket gates on the transient characteristics of pump-turbine in pump mode. Renew. Energy 2022, 194, 719–733. [Google Scholar] [CrossRef]
  30. Tomac, M.; Pettersson, K.; Rizzi, A. Calibration and Verification of a γReθt Transition Prediction Method for Airfoil Computations. In Proceedings of the 51st AIAA Aerospace Sciences Meeting including the New Horizons Forum and Aerospace Exposition, Grapevine, TX, USA, 7–10 January 2013. [Google Scholar]
  31. Malan, P.; Suluksna, K.; Juntasaro, E. Calibrating the the Gamma-Re_theta Transition Model for Commercial CFD. In Proceedings of the 47th AIAA Aerospace Sciences Meeting including The New Horizons Forum and Aerospace Exposition, Orlando, FL, USA, 5–8 January 2009. [Google Scholar]
Figure 1. TSP calibration curve.
Processes 10 02078 g001
Figure 2. Diagram of wind tunnel test device. (a) Experimental chamber; (b) cascade (backward sight).
Processes 10 02078 g002
Figure 3. Schematic diagram of blade coating and blade shape. (a) TSP coating structure; (b) dimensional marking of blade shape.
Processes 10 02078 g003
Figure 4. Transitional location measurement results.
Processes 10 02078 g004aProcesses 10 02078 g004b
Figure 5. Computational domain.
Processes 10 02078 g005
Figure 6. Mesh distribution around the blade.
Processes 10 02078 g006aProcesses 10 02078 g006b
Figure 7. Boundary conditions of the computational domain.
Processes 10 02078 g007
Figure 8. Comparison of isentropic Mach number on the blade surface.
Processes 10 02078 g008
Figure 9. Comparison of transitions on the blade surface. (a) Experiment; (b) numerical simulation.
Processes 10 02078 g009aProcesses 10 02078 g009b
Figure 10. Intermittency and wall shear distribution of blade suction surface (Ma < 1). (a) Wall shear; (b) intermittency.
Processes 10 02078 g010
Figure 11. Intermittency and wall shear distribution of blade suction surface (Ma > 1). (a) Wall shear; (b) intermittency.
Processes 10 02078 g011
Figure 12. Intermittency and wall shear distribution of blade suction surface. (a) Wall shear; (b) intermittency.
Processes 10 02078 g012
Figure 13. Mach number distribution of flow field.
Processes 10 02078 g013
Figure 14. Distribution of wall shear on the suction surface. (a) Wall shear distribution at 50% blade height; (b) wall shear contour.
Processes 10 02078 g014
Figure 15. Local pressure and streamline distribution on the suction side.
Processes 10 02078 g015
Table 1. Parameters of UNT-200 one-component TSP.
ItemsValue
Pressure sensitivity0.0%/kPa
Pressure range1 kPa~10 MPa
Temperature sensitivity1.4%/°C
Temperature range10 °C to 80 °C
Response time750 ms
Excitation wavelength400 to 550 nm (peak, 470 nm)
Emission wavelength600 to 750 nm (peak, 620 nm)
Photodegradation rate1%/h
Expiration date12 months
Table 2. Design parameters of transonic VKI-RG turbine.
ParametersValue
Inlet flow angle (β)30°
Blade angle relative to cascade axis (θ)33.3°
Chord length (c)95 mm
Ratio of chord length to grating pitch (σ)1.40845
Aspect ratio (h/c)2.0
Number of blades in the cascade (N)7
Table 3. Wind-tunnel tests.
Testpt1ps1Ma2Re1TIin
1172 kPa86.7 kPa1.038.6 × 1050.3%
2170 kPa72.1 kPa1.28.6 × 1050.3%
359.1 kPa53.1 kPa0.43.1 × 1050.3%
4103 kPa51.1 kPa1.035.1 × 1050.3%
Table 4. Numerical calculation settings.
ItemSetting
Inlet boundary conditionTotal pressure
Inlet total temperature300 K
Inlet turbulence intensity1%
Outlet boundary conditionStatic pressure
Blade wall conditionNo-slip wall
Upper and lower surfacesNo-slip wall
Advection schemeHigh-resolution
Turbulence numericHigh-resolution
Residual convergence criterion1 × 10−5
Publisher’s Note: MDPI stays neutral with regard to jurisdictional claims in published maps and institutional affiliations.