Article

A Development of Welding Tips for the Reflow Soldering Process Based on Multiphysics

by
Jatuporn Thongsri
* and
Thodsaphon Jansaengsuk
Computer Simulation in Engineering Research Group, College of Advanced Manufacturing Innovation, King Mongkut’s Institute of Technology Ladkrabang, Bangkok 10520, Thailand
*
Author to whom correspondence should be addressed.
Processes 2022, 10(11), 2191; https://doi.org/10.3390/pr10112191
Submission received: 30 September 2022 / Revised: 9 October 2022 / Accepted: 13 October 2022 / Published: 25 October 2022
(This article belongs to the Special Issue Green Manufacturing and Sustainable Supply Chain Management)

Abstract

:
A reflow soldering process (RSP) is generally implemented in advanced manufacturing factories for welding small electronic components together to create a product using heat generated at the welding tip (WT). Improper WT design and operating conditions may lead to defects in some products; therefore, optimizing both is immensely significant in developing the RSP. Accordingly, this article proposes a successful RSP development based on multiphysics in a hard disk drive factory consisting of transient thermal-electric and structural simulations. First, a new shape series WT was designed, and a conventional shape, parallel WT, was considered as a case study. Then, they were assembled and experimented with the RSP actual operating conditions to collect essential data. Next, the heat transfer was determined using a transient thermal-electric simulation (TES). The simulation results showed uneven WT temperatures depending on applied voltages, time, and shapes, which were consistent with the experimental results. The higher the applied voltage, the greater the temperature generated at the WT. Finally, after using TES results as loads, the structural simulation showed WT total deformations, which could be consistent with actually occurring defects. The findings from this research are a new design of series WT and proper multiphysics methodology for developing the RSP.

1. Introduction

The hard disk drive (HDD) is a data storage device that was 8.1 times the price (per capacity) lower than the solid-state drive (SSD) in 2019 [1], and the price continuously decreases yearly. It is not only cheaper than the SSD, but also easier to recover data from a malfunctioning state, with higher durability. Accordingly, HDDs are used to back up big data for cloud computing, servers, artificial intelligence (AI) platforms, etc., which do not require an immediate response from the server, while SSD is for a quick response. Therefore, HDD will not be replaced by SSD soon, but both must function together to achieve high-performance usage at the lowest price. In 2019, Thailand had about 17% of world HDD exports with USD 11.15 billion, ranking 2nd among the world’s largest HDD manufacturers [2]. Thailand, therefore, continuously develops technology itself that is used in the HDD manufacturing process.
The reflow soldering process (RSP) is one of the HDD manufacturing processes which welds flexible print circuits (FPC) and print circuit cables (PCC) into a head stack assembly (HSA), one of HDD’s key components. Figure 1 shows the RSP: (a) its outcome positioning in the HDD and (b) an enlarged picture. In (b), silver circle or rectangle areas are FCP, and orange ones are PPC. Each point of the FPC to weld, called a connecting area, has an area of about 0.15 mm2, depending on HDD generation. Note that (a) and (b) are different in shape and size since they are in a different HDD generation. In addition, different HDD generations require different RSP operating conditions. Because HDD has many generations, the RSP conforming to each HDD generation is what a manufacturer is searching for in order to develop the manufacturing process effectively.
This process uses lead as a solder ball (SB) dropped between the FPC and PCC. In a basic concept of RSP, the heat generated from a welding tip (WT) transfers to the SB and melts the SB to connect the FPC and PCC. However, since HDDs are manufactured in large quantities by automated machines in shortened times with small sizes of HDD components, many factors affect the manufacturing process performance, and the RSP needs advanced technology to control the heat generated and deformation at the WT in a transient state. Therefore, the challenge of the RSP is to develop the technology for controlling the heat and force from an automated machine to suit the SB melting in time. Excessive heat causes the FPC and PCC to burn and defect. On the other hand, too-low heat is not enough to melt the SB in time, resulting in the FPC and PCC not connecting. Furthermore, an improper force pressing the WT down causes deformation, leading to the detachment of both components. Accordingly, all defects lead to welding failure and low RSP performance. If the RSP fails, then HDD products will be rejected and will need to be reprocessed.
Previously, the RSP development was based on trial-and-error methods. Engineers at a factory designed and invented the WT and then tested it to find the optimum operating condition in actual usage. Unfortunately, the mentioned method wastes budget and time. Therefore, transient thermal-electric simulation (TES) and a specific experiment have recently been proposed and successfully developed for RSP [3]. It is known from [3] that the WT shape and operating condition affect the RSP performance. Because manufacturers compete on price per storage capacity, HDD component size has become smaller to increase the area density for data storage. Likewise, the WT today was also scaled down to match the HDD generation, with a small size of components for the RSP shown in Figure 1b. Downsizing causes deformation and overheating issues in the WT, leading to defects after finishing the RSP. From the author’s experience, the unsuitable generated heat and temperature can be solved by transient TES, while the improper force can be solved by structural simulation. In brief, the RSP development to achieve the highest performance requires both simulations gathered in multiphysics.
Multiphysics simulation, in short, multiphysics, is the study of multiple interacting physical properties and also combines physical phenomena in a computer simulation [4,5]. Today’s computers are highly capable when combined with multiphysics software such as ANSYS, COMSOL, MSC, etc., which can yield many useful, practical applications. Examples of multiphysics applications follow: Bazzo et al. [6] employed thermal and electrical simulations to optimize a permanent magnet-synchronous generator design. Jansaengsuk et al. [7] used computational fluid dynamics (CFD), structural analysis, and thermal analysis to find a proper shape of trailing edge modification to solve a housing damage problem in a compressor blade in an electrical generator. Thongsri et al. [8] applied the CFD and volume of fluid equations to find a proper position for installing a de-erosion lattice to prevent corrosion on Thailand’s beach. Thongsri et al. [9,10,11] employed harmonic response analysis, CFD, and structural analysis to study transducer vibration and optimize industrial cleaning tanks’ design for ultrasonic cleaning. Boonma et al. [12] used multiphase flow and thermal equations with a numerical method for studying a new generation of compact battery packs for energy storage [12]. Baxi et al. [13] and Thongsri et al. [14] used conjugate heat transfer analysis, consisting of CFD and structural simulation, for studying a supersonic rocket nozzle. Romei et al. [15] employed heat transfer, Navier–Stokes, and Joule heating equations, including a numerical method to study a novel monolithic heat exchanger for electrothermal space propulsion.
This article aims to present the successful use of multiphysics consisting of transient TES and structural simulation to develop the RSP of an HDD manufacturer for solving product defects. First, a new shape with a series WT was designed according to electric current flow directions, and a conventional shape, a parallel WT, was employed as a case study. Second, after being assembled, they were tested using the actual operating conditions to collect essential data for later simulation and validation. Then, the transient TES was used to investigate the heat transfer in both WTs. Next, the simulation results were validated with the experimental results and then applied as loads to the structural analysis to determine the total deformation. Finally, all simulation results were analyzed to find a suitable condition of RSP, which could potentially avoid the defects.
This article is practical research. It benefits are a proper methodology, including multiphysics, and an experiment practically applied to develop an actual HDD manufacturing process in the factory. No research has applied multiphysics to the RSP before.

2. Theoretical Background

This consists of an RSP mechanism, defects, and governing equations in multiphysics, consisting of transient TES and structural simulation.

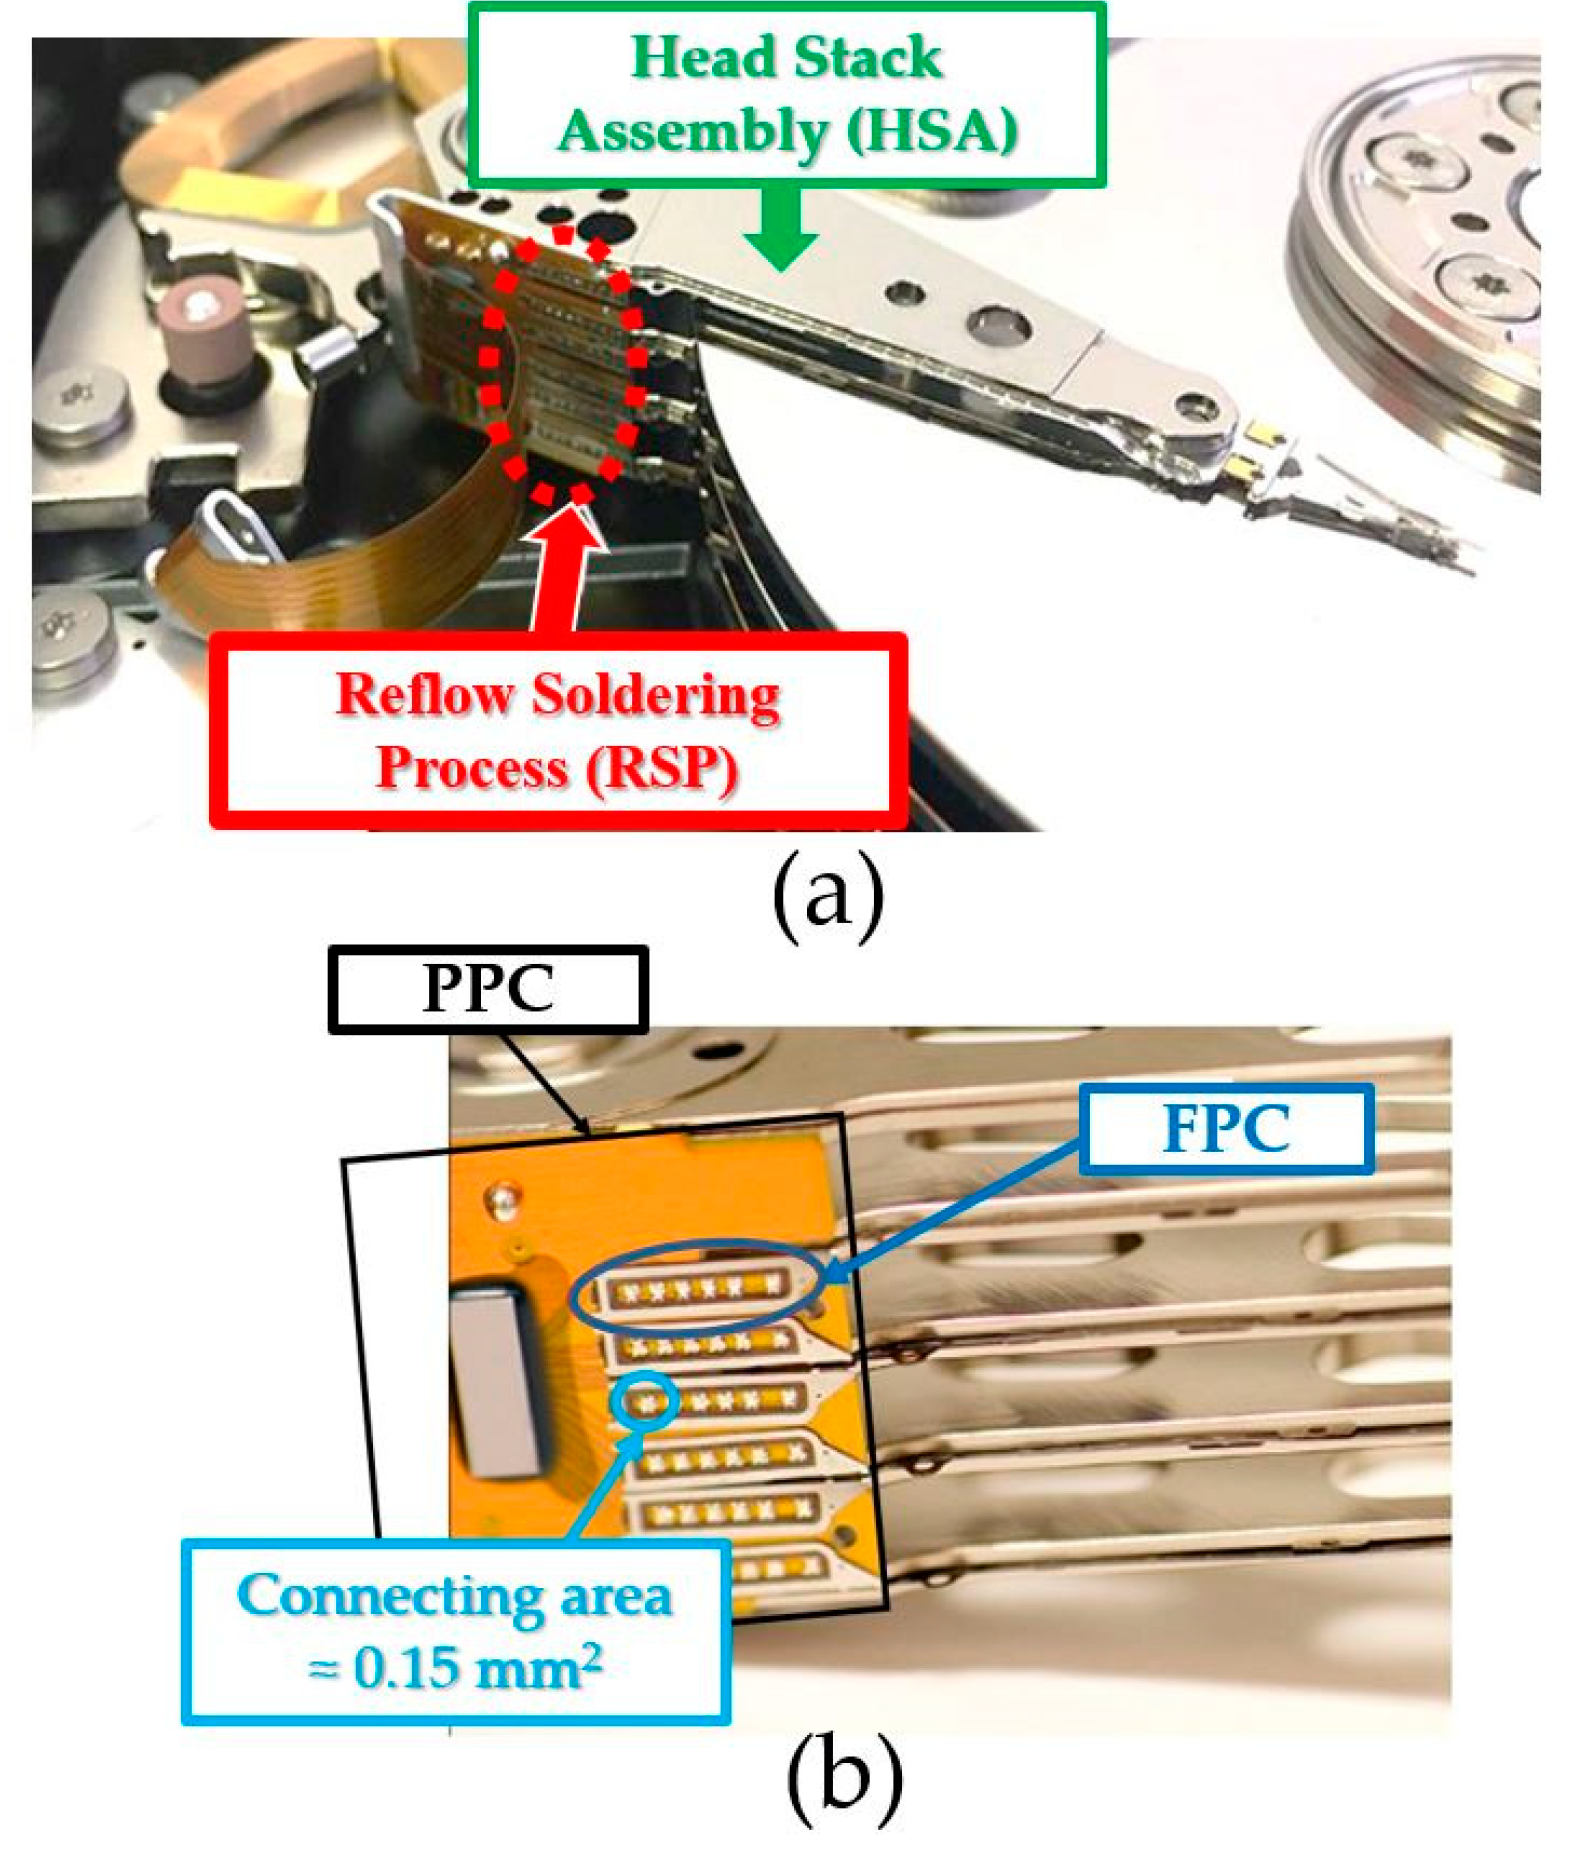
2.1. RSP Mechanism and Defects

Figure 1 can be considered by focusing only on materials related to the RSP mechanism, as shown in Figure 2. The connecting areas of WT were designed to be approximately the same shape and size as the connecting areas on FPC. For example, this product has a connecting area with a length of about 0.381 mm, which is approximately 1/100, and is too small compared to the HSA in Figure 1. An automated machine controls the heat and force operating conditions of WT. When the WT is pressed downward to the connecting area on the FPC surface, heat with force is marked as a red color transmitting to the FPC located below causes heat transfer and temperature to the SB, made of lead, to melt and spread over PCC, creating adhesion between FPC and PPC.
As mentioned previously, WT shape and operating conditions affect the RSP performance, since the connecting area is tiny. A proper operating condition with the optimum WT shape provides high RSP performance, including no burn in materials, thin lead layer thickness, and strong adhesion between materials. On the other hand, an improper operating condition with an inappropriate WT shape tremendously affects the RSP, leading to defects. Examples of defects include (1) burning in FPC, (2) lead not melting, and (3) misaligned welding. Figure 3 presents sketches of material layers in the RSP possibly resulting from Figure 1 to mimic the defects: (a) complete, (b) burning in FPC, (c) lead not melting, and (d) misaligned welding. In (a), all material layers are perfectly arranged and spread. In (b), an FPC top surface is burnt, as seen in the black color, degrading some electric properties from an expected circuit design. In (c), lead does not melt and does not spread on the PCC completely, leading to poor adhesion between the FPC and PCC, detachment, lost electrical signal in the HDD circuit, and other malfunctions. Lastly, in (d), misaligned welding may cause the lead to not melt and lead to the same effect as in (c). For convenience, (a–d) are called complete, burnt, incomplete melt, and misaligned defects, respectively.
Accordingly, a proper operating condition with the optimum shape is a challenge to design and develop in accordance with each HDD generation to solve defect problems and achieve a perfect RSP with high performance. From a discussion between the authors and a failure analysis team, who are engineers from the problematic factory, the key variables used to evaluate the RSP performance and solve the mentioned defects are temperature from the TES and total deformation from structural simulation, which will be determined and investigated in Section 4, results, and discussion.

2.2. Multiphysics

2.2.1. Transient Thermal-Electric Simulation

The WT generates heat based on the Joule heating effect, also named the ohmic heating effect or resistive heating effect. This effect is commonly found in devices such as soldering irons, electric heaters, incandescent light bulbs, fuses, etc. After applying the electric current to the devices, heat is generated. This study in the finite element analysis is called transient thermal-electric simulation. In ANSYS software, a governing equation without thermoelectric effect terms is given by [16,17]
[ C T T 0 0 C V V ] { T ˙ e V ˙ e } + [ K T T 0 0 K V V ] { T e V e } = { Q I }
where [CTT] is a thermal damping matrix, [CVV] is a dielectric damping matrix, [KTT] is a thermal stiffness matrix, [KVV] is an electric stiffness matrix, {I} is an electric current load vector, and {Q} is a combined heat generation loads vector. { T ˙ e } is a nodal velocity vector of temperature, { V ˙ e } is a nodal velocity vector of electric potential, { T e } is a nodal temperature vector, and { V e } is a nodal electric potential vector.
After defining the boundary conditions, such as temperature, voltage, and time, the simulation results from Equation (1) give the temperature in a transient state, which can be applied as loads to the structural simulation explained next.

2.2.2. Structural Simulation

Its governing equation is expressed in terms of transient dynamic analysis by [18,19]
[ M ] { u ¨ } + [ C ] { u ˙ } + [ K ] { u } = { F }
where [M], [C], and [K] are structural mass, damping, and stiffness matrices, respectively, while { u ¨ } , { u ˙ } and { u } are nodal acceleration, velocity, and displacement vectors, respectively. { F } is external load.
The temperature from heat generated at the WT obtained from Equation (1), including forces and essential boundary conditions from all operating conditions, are applied as loads in {F}. Then, solving Equation (2), the simulation results provided {u}, leading to the total deformation for analysis.

3. Methodology

To develop the RSP, Figure 4 presents a flowchart of the methodology used in this research consisting of WT design, experiment, and multiphysics shown in red, yellow, and green colors, which will be reported in Section 3.1Section 3.3, respectively, and can be briefly explained as follows.

3.1. Welding Tip Design

Two WT designs, series and parallel, made from copper, stainless steel, and Haynes 230, have been considered for developing the RSP in this research as cases study. Both were designed and invented based on a difference in the electric current flow direction: series and parallel. In detail, the series WT is a new design first presented in this article and expected to compete with a conventional shape, parallel WT, proposed previously in [3]. However, this conventional shape [3] has a limit on practical application. For an example of a limitation, using the parallel WT in the new HDD generation caused burning, non-melting, and misaligned defects. Therefore, results in comparison regarding defects for both WTs usages are expected.
Figure 5 shows the series WT for (a) the CAD model and (b) the electric current flow direction, and (c) the enlarged head focusing on the connecting area. In a design working principle, when the alternating current (AC) supplied by the automated machine was applied to a tail in (a), the copper resistance (Rc) and Haynes 230 resistance (RH) in (b) were heated to a higher temperature based on the Joule heating effect governed by equation (1). As a result, the RH at the head in (c) has the highest temperature promptly employed to the RSP. Significantly, two RH were connected in a series. In addition, the head in Figure 1a is the top blue color in Figure 2 and Figure 3. There are two RH in Figure 5 because the WT employed as a case in this article was designed to melt two groups of 18 rectangular connecting areas, each 0.381 mm length, with the red color shown in (c), promptly. The stainless-steel resistance was ignored since it is small compared to the WT size. This figure is coarse and not in scale since it is a manufacturer’s technology, not open in more detail.
Similarly, Figure 6 shows the parallel WT for (a) an overview, (b) an electric flow direction, and (c) an enlarged head, focusing on connecting areas. Remarkably, it is a conventional design with the same shape as in [3] and nearly the same size as series WT in Figure 5. It differs according to the current flow direction and RH position. Still, this work modified the parallel WT to generate a higher temperature for other HDD generations working with different conditions from [3].
The purpose of both designed WTs is to connect the FCP and PCC in a new HDD generation requiring 450 °C–500 °C, higher than 400 °C in [3]. The reason behind the need for higher temperature is the changes in the FPC thickness in the new HDD generation from the previous HDD generation. As a result, the WTs must generate a sufficient heat transfer to all material layers (Figure 2) for melting the SB completely without defects, as seen in Figure 3a. In general, SB in the factory is made of a specific lead with a melting point of about 350–400 °C. Therefore, the temperature generated at the designed WTs in the RSP, higher than at the melting point, ensures that the SB is actually melted.

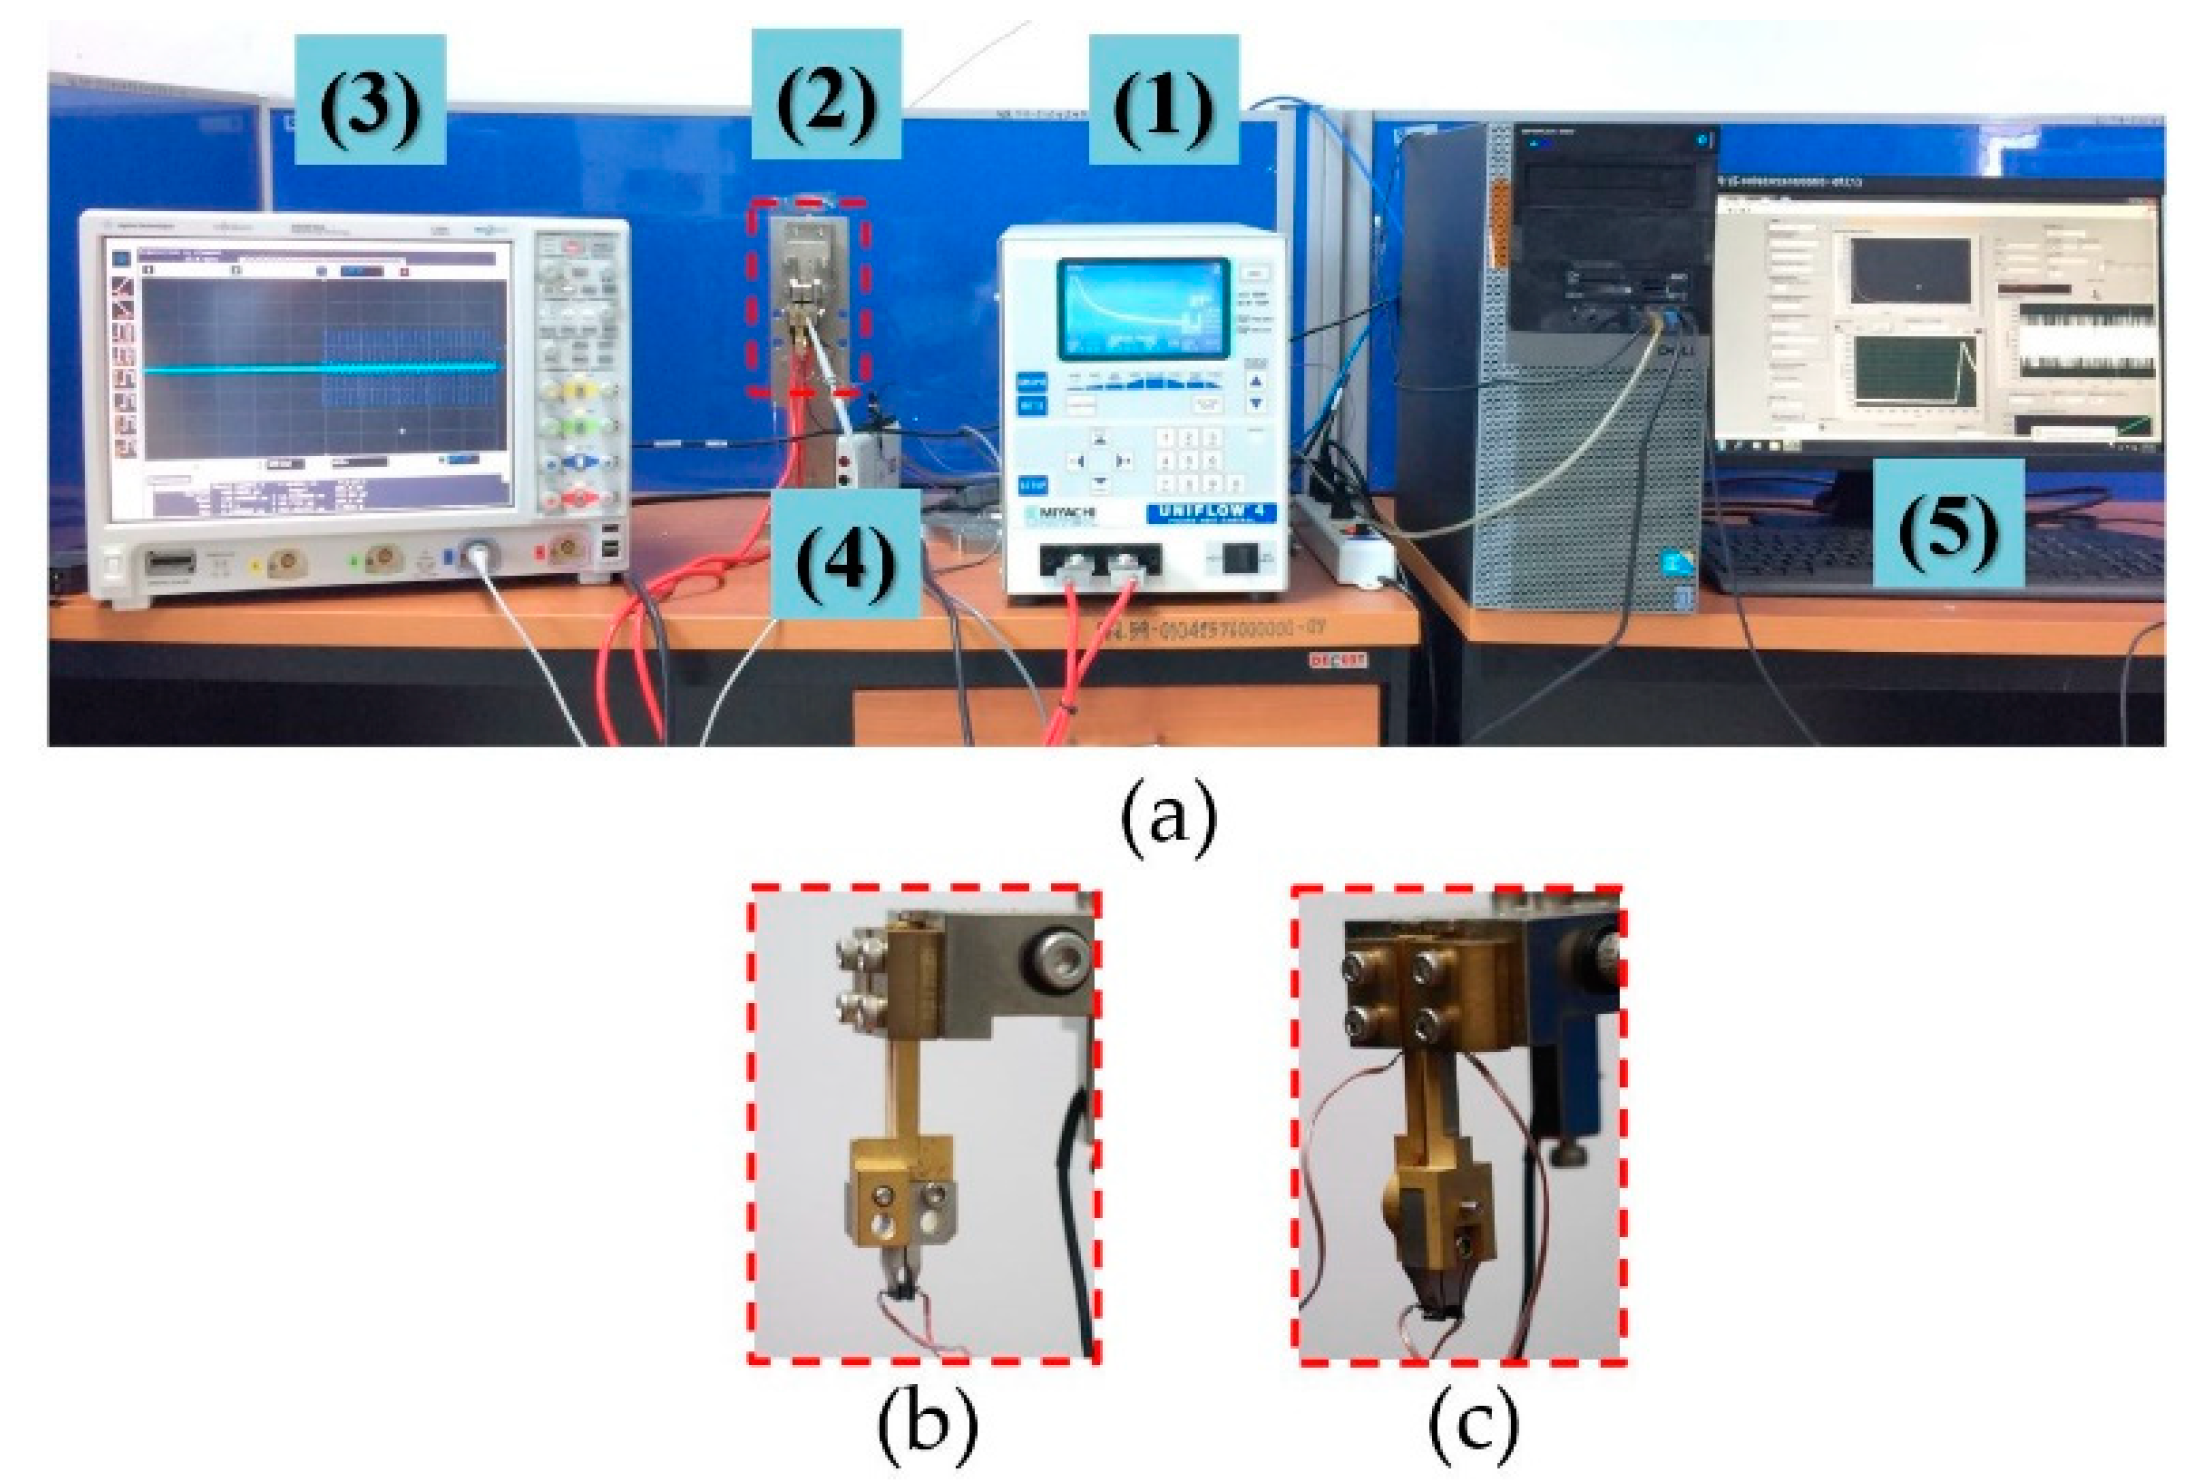
3.2. Experiment and WT Prototypes

Figure 7 presents the experimental setup for (a) overview, (b), and (c). The enlarged figures show prototypes of series and parallel WTs, respectively, installed in the experiment. In (a) overview consists of (1) Uniflow#4, (2) WT, (3) digital oscilloscope, (4) data acquisition (DAQ) with a small thermocouple sensor, and (5) computer with LabVIEW software. The functions of various devices are summarized as follows. First, Uniflow #4 was used to control the voltage and time applied to the WT. The number four (#4) is the fourth generation of the Uniflow upgraded and designed by the factory. Then, the series and parallel WTs were assembled from many materials, as mentioned in Section 3.1, to generate high temperatures. Next, a digital oscilloscope was applied to check the properties of a voltage signal supplied by Uniflow#4. DAQ, with the thermocouple ±0.01 °C in accuracy, was used to measure the real-time temperature in a measuring point at the WT head, and record with a sensitivity of every 0.01 s. Last, a computer with LabVIEW was used to record all data sent from the DAQ. In fact, Uniflow#4 can report transient voltage in its small monitor. Unfortunately, the reported voltage was coarse and unreliable; therefore, it could not be used for boundary conditions and validation. Accordingly, the digital oscilloscope and DAQ have been added to the experiment to achieve precise results.
Figure 8 shows a diagram to summarize the experiment from Figure 7. Uniflow#4 was first adjusted for the applied voltage and time until the WT generated the desired temperature. At this time, the WT also had deformation to be further investigated by the next structural simulation. However, since the deformation was so tiny, there was no instrument capable of measuring it; therefore, the structural simulation was employed instead, reported later in Section 4, results, and discussion. Then, the voltage signal data shown in the digital oscilloscope and temperature measured at the WT by a thermocouple sensor were transferred to the DAQ, and finally recorded by the computer with LabVIEW software. At the end of the experiment, the recording data were transient AC voltage for a boundary condition setting and transient temperature at the WTs for validation, also reported in Section 4. The total time of RSP from the first to the final steps was 2.4 s, corresponding to the actual manufacturing process for a case study product.

3.3. Multiphysics

This section presents mesh models and boundary conditions for transient thermal-electric and structural simulations used to complete the multiphysics.

3.3.1. Mesh Model

In a pre-simulation step, mesh-independent analysis was applied to determine the optimum mesh models, which provide accurate results to suit a computational resource. Figure 9 reveals the optimum mesh model for (a) series and (b) parallel WTs employed in multiphysics. Both are hexahedral mesh models, a highly precise mesh type. In (a), the mesh size was 1.7 nm−0.8 mm, consisting of 48,296 elements and 232,045 nodes, while it was 0.1 nm–0.8 mm with 72,056 elements and 341,593 nodes in (b). The minimum mesh size is near the head with a growth rate of 20% from the minimum to the maximum size to capture a highly accurate temperature. The mesh model in (b) has a fine and a higher number of elements and nodes than in (a) because the parallel WT has a more complicated shape than the series WT. In addition, small figures present enlarged pictures and measuring points in detail, focusing on the meshes near the measuring point, where the temperature is measured by the thermocouple sensor mentioned in Section 3.2.
The temperature for melting the SB in connecting areas is located at the lowest, not in a measuring point. Unfortunately, the temperature at the connecting area cannot be measured in the actual manufacturing process since it was pressed down to the top surface of FPC. Accordingly, installing the thermocouple sensor near the connecting area disturbed the RSP process and maybe increase defects. Therefore, the RSP used the temperature in the measuring point instead of the connecting areas for convenience. From reference [3], it was confirmed that the temperature in the measuring point was nearly the same as in the connecting areas. Finally, the optimum mesh models were put forward to set the boundary conditions.

3.3.2. Boundary Conditions

This is divided into two boundary conditions, transient thermal-electric and structural conditions.
  • Transient Thermal-Electric Simulation
Figure 10 shows the boundary conditions for the transient TES of (a) series and (b) parallel WTs, emulating the actual operating condition in the RSP from the experiment in Section 3.2. It was found that the applied voltage on one side of the tail was V(t) = 2.1Sin [2π(50)t] with an alternating current recorded by digital oscilloscope as mentioned in Section 3.2, while V(t) = 0 was applied on the other tail side. The applied voltage positions were highlighted in red color. The ambient room temperature for the two tail sides was 30 °C. The material properties, including convection film coefficients, h(T), depending on temperature and time, were defined by user-defined function (UDF) according to Table 1 [3].
After completely defining the boundary conditions, the simulation results revealed the temperatures in a transient state, which were used to analyze all defects from heat and apply them as loads for structural simulation, explained next.
  • Structural Simulation
The maximum temperatures provided above by transient TES in the connecting areas were transferred to the structural simulation as loads. Additionally, forces were applied in the connecting areas to mimic a pressing down of WTs to the FPC. This article used the force of 0.5 N, highlighted in red color in Figure 11, for both WTs as a case study. The top surfaces of the WTs, highlighted in blue were applied as fixed supports. Figure 11 reveals the boundary conditions for the structural simulation of (a) series and (b) parallel WTs.
Notably, the boundary conditions applied to both WTs were the same, with one-way simulation and transient thermal-electric to structural simulations, to investigate the response of the WTs from applied voltage and force. In addition, Haynes 230’s properties were significantly defined by boundary conditions in terms of temperature, more detail than others since it has a high sensitivity to temperature, which is an advantage of Haynes 230 in a design concept.

4. Results and Discussion

This section includes validation to confirm the simulation results and development of RSP based on multiphysics to understand the defect occurrences, investigate the RSP performance when implementing the series and parallel WTs, and find ways to improve the RSP.

4.1. Validation and Heat Transfer Behavior

Figure 12 reports temperature comparisons at the measuring points in the transient state for (a) series and (b) parallel WTs, from the experiment and TES presented in the dash and solid lines, respectively. The experimental results were collected by the thermoelectric sensor and recorded by the computer, as mentioned in Section 3.2. In the same way, the simulation results were picked by a probe tool of the software. Small pictures show measuring points positioned on the WT. Under the same operating condition, both results were consistent. The temperatures increased to the maximum and decreased gradually. In addition, the maximum error from the simulation results compared to the experimental results was less than 7.3%.
Figure 13 and Figure 14 show heat transfer behaviors and temperature for (a) series and (b) parallel WTs, under the same operating conditions, as employed in Figure 12, starting from 0.1 s to the end at 2.4 s. Both WTs have the same heat transfer behavior and were consistent with those reported in [3], as expected. The simulation results reveal uneven temperatures in the WTs. However, there was a slight difference in the maximum temperature in terms of time, discussed next. To clarify the heat transfer behavior, the applied voltage caused a higher temperature on the Haynes 230 than on other materials. Moreover, as expected, the highest temperatures of both WTs were at the connecting areas, consistent with a design concept mentioned in Section 3.1 and Section 3.3.2. Additionally, the temperature confirmed that it depends on the time. More results to support this discussion are presented as animation clips included in the Supplementary Materials.
Furthermore, Figure 15 investigates the temperature comparison of the maximum temperatures mentioned in Figure 13 and Figure 14 in more detail. In this figure, the simulation results of temperatures at connecting areas of both WTs were focused and plotted against time. Under the same operating conditions, both temperatures increased with time, reached the maximum, and slowly decreased. However, the temperatures from both WTs in the connecting areas before the maximum were clearly different. The parallel WT gave a higher temperature than the series WT. In addition, the parallel required a shorter time to reach the maximum temperature than the series WT. The parallel WT required around 0.4 s to drive the room temperature to the maximum temperature of 493 °C, while the series needed about 0.6 s to reach 453 °C. The above confirms that operating conditions consisting of the WT shape, design of the electric flow direction, applied voltage, and time affect the temperature and heat transfer of WTs, as expected. Therefore, proper operating conditions and an understanding of the heat transfer of WT will increase the RSP performance and prevent product defects. Consequently, considering the maximum temperature, since the parallel WT generates a higher temperature, it is better than the series WT.
In addition, comparing Figure 12b, using the applied voltage of 2.10 V generating the maximum temperature of 493 °C, and the parallel WT in [3] with 1.66 V generating around 400 °C, the temperatures differed and depended on the applied voltage. Accordingly, the temperature of 2.10 V applied voltage was higher than 1.66 V. As expected, the more applied voltage, the higher the temperature at the WT, consistent with the Joule heating effect principle.
Figure 12, Figure 13, Figure 14 and Figure 15 confirm that the transient TES results are consistent with the experimental results, design concept, previous research, and Joule heating effect principle. Therefore, the simulation results and methodology employed in this research are reliable.
Next, the maximum temperature at 0.4 s for the parallel WT and 0.6 s for the series WT were employed as loads for the structural simulation in a steady state. Actually, the simulation results for other times can be applied as loads, but the authors confirm that employing the maximum temperature at the mentioned times can help the best analysis.

4.2. Development of Reflow Soldering Process

This section explains the structural simulation results to link the defects and ways to develop the RSP to avoid defects.
Figure 16 shows the temperature distributions in the connecting areas for (a) series and (b) parallel WTs at the time with the maximum temperatures and pressing down of 0.5 N of force. In (a), the temperatures were within 455.89–457.03 °C, nearly the same in all areas. The minimum temperatures were around the middle zone. The temperature difference between the maximum and minimum was 1.14 °C. In contrast, in (b), the temperatures were between 481.39–493.37 °C. Again, the temperature difference between the maximum and minimum was 11.98 °C. Significantly, the maximum and minimum temperatures within in each rectangle were very different. The higher the applied voltage, the greater the temperature difference. The very difference in temperature affects the SB melting. For example, the highest temperature may cause a burnt defect in Figure 3b, while the lowest temperature may cause an incomplete melt defect of the SB in Figure 3c. Therefore, the temperature difference confirms an occurrence of incomplete melt defects in some products when using the parallel WT, as expected. Practically, the factory needs a WT that generates a constant temperature. A constant temperature helps the SB to melt evenly over the PCC surface, as seen in Figure 3a. Accordingly, considering temperature distribution, since the series WT generates nearly the same temperature, it is better than the parallel WT.
To analyze the occurrence of misaligned defects in Figure 3d, Figure 17 and Figure 18 present the total deformation from the structural simulation for the series and parallel WTs, respectively, in the same color scale: (a) overviews and (b) sketch pictures focusing on connecting areas in the yz plane. In (a), as expected, the maximum total deformation was in the connecting areas. In (b), examples of the connecting areas with the first two highest total deformations are presented. Grey rectangles represent the original model and the connecting areas without loads, while colored ones are the connecting areas affected by loads. Thus, the temperature and force loads clearly deformed the connecting areas. In addition, both WTs had different total deformation, so the design shapes affect total deformation. In detail, connecting areas of Figure 17b were deformed by −0.106 mm on the y-axis and 0.016 mm on the z-axis at the rim. Near the inside, they were −0.105 mm on the y-axis and 0.013 mm on the z-axis. Hence, the total deformation depends on the position. The highest total deformation was near the rim, and the lowest was at the middle.
Similarly, the highest total deformation in Figure 18b was −0.146 mm on the y-axis and 0.153 mm on the z-axis, also at the rim. The total deformation of parallel WT was higher than the series since the maximum temperature of the parallel WT was greater. Comparing Figure 17 and Figure 18 to Figure 3, the total deformation of connecting areas, a part of WT, has an oblique direction toward the FCP, in line with Figure 3d. Therefore, the misaligned defect in Figure 3d may come from the WTs’ deformation, since the connecting areas of WT were designed to align with the FCP at the beginning of RSP. Thereby, considering total deformation, since the series WT generates lower total deformation, it is better than the parallel WT.
In addition, it can be seen that the total deformation is minimal, approximately less than 5%, compared to the original small-size of connecting areas. However, it is not easy to use any tools to set an experiment to measure the total deformation. For example, suppose engineers want to detect the total deformation in a miniature size. In that case, they have to use a high-resolution 3D laser scanner or microscope camera with additional special devices and settings, which are complicated and expensive. Therefore, multiphysics can deal with this problem. This research is another example of multiphysics’s prominent capability.
All discussions in Figure 16, Figure 17 and Figure 18 confirm the occurrence and causes of defects, which help us better understand the RSP. To develop the RSP, the authors discussed with process engineers and concluded that the series WT is better than the parallel WT and should be employed in the HDD manufacturing process since it had less temperature difference and a lower total deformation than the parallel WT. Therefore, installing the series WT in the RSP may reduce the defects better. In addition, the crucial disadvantages of the series WT are generating a lower temperature and requiring a longer time to drive the generated temperature to the maximum. However, the parallel WT can be used in the RSP but requires more caution. Its usage should first be considered with the heat transfer, and employed with the proper operating conditions investigated by multiphysics, the same methodology as proposed in this article. These results have been employed in actual RSP in the factory and were confirmed to help reduce the defects effectively.

5. Conclusions and Limitations

  • Conclusion
The reflow soldering process (RSP) involves welding small electronic components together to create a product. For example, in the RSP of a hard disk drive factory, a welding tip (WT), a key tool of RSP, was heated by the applied voltage and generated temperature based on the Joule heating principle. Unfortunately, in the past, using WT led to defects in some products, so finding a proper methodology to improve the RSP and avoid defects is imperative. That is the purpose of this article. In this article, multiphysics, which include transient thermal-electric and structural simulations, is presented. This research is divided into three steps: WT design, experiment, and multiphysics. First, in the WT design step, a novel series WT was designed for the first time in this research paper. The series WT and a parallel WT were employed as a case study. Note that the parallel WT is a conventional model used in previous research and was found that it led to defects. Second, in the experiment step, both WTs were assembled according to the design step, and they were then tested under actual operating conditions of a factory. The experimental results revealed the applied voltages and temperatures of the WTs in a transient state, which were used further for boundary condition-setting and validation of simulation results. Third, in the multiphysics step, transient thermal-electric simulation was used to examine the heat transfer behavior of both WTs. The simulation results showed the heat transfer behavior and the uneven temperature, which differed for both WTs. Moreover, the temperature simulation results at the measuring points on both WTs were consistent with the experimental results and corresponded to the occurrence of defects, thus confirming the multiphysics reliability. After applying the mentioned results, including force as loads, to the structural simulation, the simulation results revealed the total deformation of both WTs. The parallel WT yielded higher total deformation than the series WT. Finally, all results were analyzed, concluding that the series WT is more suitable for implementation in the actual RSP than the parallel WT, because it provided more similar temperatures and less total deformation in the connecting areas, the areas for electric welding components, thus potentially reducing product defects. The outcomes of this research are a proper multiphysics methodology for RSP, an understanding of defect occurrences related to RSP, and the series WT with superior performance than the traditional WT. All methods have been applied to develop the WT for actual use in the RSP and it was confirmed that they help reduce defects effectively.
  • Limitations
In an actual HDD manufacturing process, a circulating air system inside and outside the automated machine with the optimum condition is used to prevent a particle contamination problem [20,21,22,23]. This system creates airflow with a temperature below 24.5 °C and a velocity within 0.35–0.55 m/s, approximately. Therefore, convection due to the circulating air system may affect the WT’s temperature, reduce the RSP performance, and question multiphysics’s credibility. To increase the credibility of this research, multiphysics must include conjugate heat transfer analysis [14], adding computational fluid dynamics (CFD) to calculate the mentioned convection from airflow around the WT. Unfortunately, it consumes more computational resources and time. However, from an internal field test from the factory’s process engineers, the convection has such a small effect that it can be ignored. Therefore, the mentioned convection is reasonably neglected.

Supplementary Materials

The following supporting information can be downloaded at: https://www.mdpi.com/article/10.3390/pr10112191/s1; the animation clips supporting the discussion in Figure 13 and Figure 14 are included in the Supplementary Materials.

Author Contributions

Conceptualization, J.T.; methodology, J.T.; software, J.T and T.J.; validation, J.T.; formal analysis, J.T.; investigation, J.T.; resources, J.T.; data curation, T.J.; writing—original draft preparation, J.T.; writing—review and editing, J.T.; visualization, T.J.; supervision, J.T.; project administration, J.T.; funding acquisition, J.T. All authors have read and agreed to the published version of the manuscript.

Funding

The financial support was sponsored by the College of Advanced Manufacturing Innovation, King Mongkut’s Institute of Technology Ladkrabang, grant number 2566-01-02-001.

Data Availability Statement

Not applicable.

Acknowledgments

This research has facilities supported by the College of Advanced Manufacturing Innovation, King Mongkuts’ Institute of Technology Ladkrabang.

Conflicts of Interest

The authors declare no conflict of interest.

Nomenclature

[C]damping matrix (N s/m)
[CVV] dielectric damping matrix (A s/V)
{Q}combined heat generation load (J)
[KVV] electric stiffness matrix (A/V)
{I}electric current load vector (A)
{ F } external load vector (N)
FPCflexible print circuit
HDDhard disk drive
HSAhead stack assembly
{ u ¨ } nodal acceleration vector (m/s2)
{ u } nodal displacement vector (m)
{ V e } nodal electric potential vector (V)
{ T e } nodal temperature vector (K)
{ u ˙ } nodal velocity vector (m/s)
{ V ˙ e } nodal velocity vector of electric potential (V/s)
{ T ˙ e } nodal velocity vector of temperature (K/s)
PCCprint circuit cable
RSPreflow soldering process
SBsolder ball
[M]structural mass matrix (kg)
[K]stiffness matrix (N/m)
[CTT]thermal damping matrix (J s/K)
TESthermal-electric simulation
[KTT] thermal stiffness matrix (J/K)
WTwelding tip

References

  1. Floyer, D. QLC Flash HAMRS HDD. Available online: https://wikibon.com/qlc-flash-hamrs-hdd/ (accessed on 10 September 2022).
  2. Yongpisanphob, W. Industry Outlook 2021–2023: Electronics. Available online: https://www.krungsri.com/en/research/industry/industry-outlook/Hi-tech-Industries/Electronics/IO/io-Electronics-21 (accessed on 11 September 2022).
  3. Thongsri, J. Transient Thermal-Electric Simulation and Experiment of Heat Transfer in Welding Tip for Reflow Soldering Process. Math. Probl. Eng. 2018, 2018, 4539054. [Google Scholar] [CrossRef]
  4. Keyes, D.E.; McInnes, L.C.; Woodward, C.; Gropp, W.; Myra, E.; Pernice, M.; Bell, J.; Brown, J.; Clo, A.; Connors, J.; et al. Multiphysics simulations: Challenges and opportunities. Int. J. High Perform. Comput. Appl. 2013, 27, 4–83. [Google Scholar] [CrossRef] [Green Version]
  5. Peksen, M.; Peksen, M. Chapter 1—Introduction to Multiphysics Modelling. In Multiphysics Modeling: Materials, Components, and Systems; Academic Press: Cambridge, MA, USA, 2018; pp. 1–35. [Google Scholar]
  6. Bazzo, T.d.P.M.; Kölzer, J.F.; Carlson, R.; Wurtz, F.; Gerbaud, L. Multiphysics Design Optimization of a Permanent Magnet Synchronous Generator. IEEE Trans. Ind. Electron. 2017, 64, 9815–9823. [Google Scholar] [CrossRef]
  7. Jansaengsuk, T.; Kaewbumrung, M.; Busayaporn, W.; Thongsri, J. A Proper Shape of the Trailing Edge Modification to Solve a Housing Damage Problem in a Gas Turbine Power Plant. Processes 2021, 9, 705. [Google Scholar] [CrossRef]
  8. Thongsri, J.; Tangsopa, W.; Kaewbumrung, M.; Phanak, M.; Busayaporn, W. Derosion Lattice Performance and Optimization in Solving an End Effect Assessed by CFD: A Case Study in Thailand’s Beach. Water 2022, 14, 1358. [Google Scholar] [CrossRef]
  9. Tangsopa, W.; Thongsri, J. A Dual Frequency Ultrasonic Cleaning Tank Developed by Transient Dynamic Analysis. Appl. Sci. 2021, 11, 699. [Google Scholar] [CrossRef]
  10. Srathonghuam, K.; Wonganu, B.; Busayaporn, W.; Thongsri, J. Vibration Analysis and Development of a Submersible Ultrasonic Transducer for an Application in the Inhibitory Activity of Pathogenic Bacteria. IEEE Access 2021, 9, 142362–142373. [Google Scholar] [CrossRef]
  11. Phophayu, S.; Kliangklom, K.; Thongsri, J. Harmonic Response Analysis of Tank Design Effect on Ultrasonic Cleaning Process. Fluids 2022, 7, 99. [Google Scholar] [CrossRef]
  12. Boonma, K.; Mesgarpour, M.; NajmAbad, J.M.; Alizadeh, R.; Mahian, O.; Dalkılıç, A.S.; Ahn, H.S.; Wongwises, S. Prediction of battery thermal behaviour in the presence of a constructal theory-based heat pipe (CBHP): A multiphysics model and pattern-based machine learning approach. J. Energy Storage 2022, 48, 103963. [Google Scholar] [CrossRef]
  13. Baxi, P.; Jain, R.; Dhadke, Y.; Chhabra, Y.; Khatawate, V.H. In Design and Analysis of Bell-Parabolic De Laval Rocket Exhaust Nozzle. In Proceedings of the 2021 4th Biennial International Conference on Nascent Technologies in Engineering (ICNTE), Navi Mumbai, India, 15–16 January 2021; pp. 1–6. [Google Scholar]
  14. Thongsri, J.; Srathonghuam, K.; Boonpan, A. Gas Flow and Ablation of 122 mm Supersonic Rocket Nozzle Investigated by Conjugate Heat Transfer Analysis. Processes 2022, 10, 1823. [Google Scholar] [CrossRef]
  15. Romei, F.; Grubisic, A. Numerical study of a novel monolithic heat exchanger for electrothermal space propulsion. Acta Astronaut. 2019, 159, 8–16. [Google Scholar] [CrossRef]
  16. Antonova, E.E.; Looman, D.C. Finite elements for thermoelectric device analysis in ANSYS. In Proceedings of the ICT 2005 24th International Conference on Thermoelectrics, Clemson, SC, USA, 19–23 June 2005; IEEE: Piscataway Township, NJ, USA, 2005; pp. 215–218. [Google Scholar]
  17. ANSYS, Inc. Nonlinear and Transient Thermal Analysis, Ansys Mechanical Heat Transfer; ANSYS, Inc.: Canonsburg, PA, USA, 2016. [Google Scholar]
  18. ANSYS, Inc. Module 08: Transient Analysis ANSYS Mechanical Linear and Nonlinear Dynamics; ANSYS Inc: Canonsburg, PA, USA, 2016. [Google Scholar]
  19. Bubpatha, W.; Thongsri, J. A Simulation of Swage Process for Hard Disk Drive Factory Based on Explicit Dynamics Analysis. In Proceedings of the 2022 37th International Technical Conference on Circuit/Systems, Computers and Communications (ITC-CSCC), Phuket, Thailand, 5–8 July 2022; pp. 864–867. [Google Scholar]
  20. Thongsri, J. A Successful CFD-Based Solution to a Water Condensation Problem in a Hard Disk Drive Factory. IEEE Access 2017, 5, 10795–10804. [Google Scholar] [CrossRef]
  21. Khongsin, J.; Thongsri, J. Numerical Investigation on the Performance of Suction Head in a Cleaning Process of Hard Disk Drive Factory. ECTI Trans. Electr. Eng. Electron. Commun. 2020, 18, 28–34. [Google Scholar] [CrossRef] [Green Version]
  22. Puangburee, L.; Busayaporn, W.; Kaewbumrung, M.; Thongsri, J. Evaluation and Improvement of Ventilation System Inside Low-Cost Automation Line to Reduce Particle Contamination. ECTI Trans. Electr. Eng. Electron. Commun. 2020, 18, 35–44. [Google Scholar] [CrossRef] [Green Version]
  23. Thongsri, J.; Tangsopa, W.; Khongsin, J. A Suitable Shape of the Suction Head for a Cleaning Process in a Factory Developed by Computational Fluid Dynamics. Processes 2021, 9, 1902. [Google Scholar] [CrossRef]
Figure 1. The reflow soldering process (RSP): (a) its outcome positioning in the HDD and (b) an enlarged picture.
Processes 10 02191 g001
Figure 2. The RSP mechanism.
Processes 10 02191 g002
Figure 3. Sketches of materials layers in the RSP: (a) complete, (b) burnt defect, (c) incomplete melt defect, and (d) misaligned defect.
Processes 10 02191 g003
Figure 4. A flowchart of the methodology.
Processes 10 02191 g004
Figure 5. A series welding tip for (a) overview, (b) electric flow direction, and (c) enlarged head.
Processes 10 02191 g005
Figure 6. A parallel welding tip for (a) overview, (b) electric flow direction, and (c) enlarge head.
Processes 10 02191 g006
Figure 7. The experimental setup for (a) overview, (b), and (c) the enlarged figures to show prototypes of series and parallel WTs, respectively.
Processes 10 02191 g007
Figure 8. A diagram to summarize the experiment.
Processes 10 02191 g008
Figure 9. The optimum mesh model of (a) series and (b) parallel WTs for simulations.
Processes 10 02191 g009
Figure 10. The boundary conditions for transient thermal-electric simulation of (a) series and (b) parallel WTs.
Processes 10 02191 g010
Figure 11. The boundary conditions for structural simulation of (a) series and (b) parallel WTs.
Processes 10 02191 g011
Figure 12. Temperature comparisons between the simulation and experimental results at measuring point in transient state for (a) series and (b) parallel WTs.
Processes 10 02191 g012
Figure 13. Heat transfer behavior and temperature of the series WT for 0.1 s–2.4 s.
Processes 10 02191 g013
Figure 14. Heat transfer behavior and temperature of the parallel WT for 0.1 s–2.4 s.
Processes 10 02191 g014
Figure 15. Temperature comparison from the transient thermal-electric simulation at the connecting areas for series and parallel WTs.
Processes 10 02191 g015
Figure 16. Temperature distributions in the connecting areas for (a) series and (b) parallel WTs at the time with the maximum temperatures and 0.5 N of force.
Processes 10 02191 g016
Figure 17. Total deformation from the structural simulation for the series WT: (a) overview and (b) sketch picture focusing on connecting areas in the yz plane.
Processes 10 02191 g017
Figure 18. Total deformation from the structural simulation for the parallel WT: (a) overview and (b) an enlarged picture focusing on connecting areas in the yz plane.
Processes 10 02191 g018
Table 1. Material properties for setting in simulations [3].
MaterialTemperature (°C)Specific Heat
(J/kg- °C)
Thermal Conductivity (W/m- °C)Isentropic Resistivity (Ω-m)Convection Film Coefficient (W/m2-K)
Copper alloy25
100
385
385
401
398
1.69 × 10⁻⁸
2.28 × 10⁻⁸
35
35
Density8300 kg/m3
Stainless steel2548015.17.70 × 10−735
Density7750 kg/m3
Haynes 230253978.91.250 × 10−61.8 × 10¹²
10041910.41.258 × 10−68.8 × 10¹¹
20043512.41.265 × 10−64.5 × 10¹¹
30044814.41.273 × 10−63.0 × 10¹¹
40046516.41.284 × 10−61.8 × 10¹¹
Density8970 kg/m3
Publisher’s Note: MDPI stays neutral with regard to jurisdictional claims in published maps and institutional affiliations.

