Article

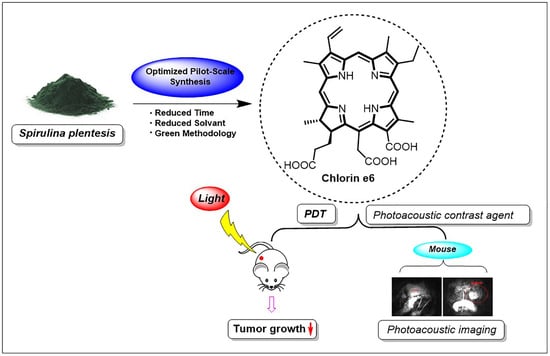
Improved Pilot-Plant-Scale Synthesis of Chlorin e6 and Its Efficacy as a Photosensitizer for Photodynamic Therapy and Photoacoustic Contrast Agent

Dongsung Cancer Center, Dongsung Biopharmaceutical, Daegu 41061, Korea
*
Author to whom correspondence should be addressed.
Processes 2022, 10(11), 2215; https://doi.org/10.3390/pr10112215
Submission received: 7 October 2022 / Revised: 19 October 2022 / Accepted: 24 October 2022 / Published: 27 October 2022

Abstract

:
Photodynamic therapy and photoacoustic (PA) imaging are emerging therapeutic modalities for the diagnosis and treatment of various types of cancer or other diseases. In this study, the second-generation photosensitizer Chlorin e6 was prepared on a pilot scale by using the rapid, simple, and green synthetic method as compared to a conventional protocol. In the modified method, the extraction/reaction time and volume of solvents were significantly reduced. The dark and photodynamic cytotoxicity of Ce6 was measured against B16F10 melanoma cell line. Ce6 did not affect cancer cells in the dark up to 192 µM, ensuring their safety in the absence of light. After PDT, it displayed significant cytotoxicity at lower concentrations (IC50: 18.9 µM). For in vivo study, B16F10 allograft mice were treated with Ce6 at 2.5 mg/kg and then exposed to red light (660 nm) after 3 h. The Ce6-PDT caused the inhibition of tumor growth. Furthermore, Ce6 was also used as a photoacoustic imaging agent in ICR mice to visualize the internal organs. Therefore, this study provides valuable information about Ce6-PDT as a promising strategy for anti-cancer therapy as well as visualization of internal organs without surgery or x-rays.

Graphical Abstract

1. Introduction

Photodynamic therapy (PDT) has emerged as a promising alternative to the existing cancer treatment modalities. In particular, PDT involves the administration of a photosensitizer (PS) followed by harmless visible light incidence, resulting in the generation of cytotoxic reactive oxygen species (ROS) by the interaction of molecular oxygen with the excited PS [1,2,3]. These ROS lead to tumoral cell death by apoptosis and/or necrosis [4]. As a result, various PSs have been clinically approved for the PDT of different types of cancers, including lung, bladder, esophageal, and non-melanoma skin cancer [2]. Melanoma is considered the deadliest form of skin cancer due to its enhanced oxidative stress defense, defect in the apoptotic pathways, and immune evasion [5]. Various therapeutic strategies have been developed for the treatment of melanoma, including surgical resection, chemotherapy, immunotherapy, bio chemotherapy, and targeted therapy [6]. However, PDT has evolved as one of the efficient and nontoxic modalities for the treatment of melanoma.
Over the last decade, photoacoustic (PA) imaging, a hybrid imaging modality of optical contrast and ultrasonic resolution, has emerged as a crucial technique in the biomedical field [7]. During PA imaging, biological samples are illuminated using a nanosecond pulsed laser. Secondly, the acoustic waves generated by the thermoelastic expansion are detected by ultrasonic transducers [8]. Thus, from a clinical standpoint, various imaging applications, including breast, dermatologic, gastrointestinal, and adipose tissue [9] have been devised by distinguishing healthy and diseased tissue with either deeper penetration or higher resolution. In addition, the clinical use of PA imaging comprises not only image-guided therapy and monitoring but also local or systemic drug delivery. However, there are limited relevant FDA-approved contrast agents for efficient PA imaging [10].
Consequently, there is always a need for a compound that can be utilized both as a potential photosensitizer for PDT and as a contrast agent for PA imaging. Such a compound would aid not only in the diagnosis of cancer or other diseases but also actively participate in curing them. Particularly, the plant-derived tetrapyrroles such as Chlorin e6 (Ce6), a second-generation PS, have emerged as potential candidates for dual PDT and PA imaging because of their ability to remarkably absorb high phototoxic red light for better sensitizing efficacy and rapid elimination from the body [11,12,13,14]. Accordingly, various encouraging successes were achieved in the areas of various cancer treatments by Ce6-mediated PDT [15,16]. On the other hand, Ce6 has also been employed as an alternative photoacoustic imaging agent due to its considerable absorption and fluorescence characteristics [17].
Because of the crucial dual application of Ce6, various synthetic methods have been developed for small- to large-scale production. Since the main starting precursor for Ce6 synthesis is chlorophyll a, spirulina, an obligate photoautotroph and filamentous blue-green microalgae, has been extensively studied. Contrary to other algae and higher plants, spirulina only possesses chlorophyll a, which makes it a good natural source for Ce6 production [18]. Several researchers have reported different approaches, including a microwave assisted method [19], ultra-sonication [20], supercritical fluid use [21], etc., for the extraction of chlorophyll a and subsequent Ce6 synthesis. However, an effective and economically viable method for extraction and purification, especially for large-scale setup, is necessary for achieving the high purity that is a prerequisite for PS.
Herein, we demonstrated a new extraction/synthetic methodology for the preparation of Ce6 and compared it against the conventional method. The ultimate objective of this study was to utilize a rapid, green, and environment-friendly approach for the pilot-plant-scale production of Ce6 from Spirulina platensis and explore its PDT as well as PA imaging capability after preparing aqueous soluble formulation coined as Phonozen®, Dongsung Biopharmaceutical. Initial optimization of chlorophyll a extraction by using the response surface methodology (RSM) was also explored to develop a sustainable and efficient methodology for Ce6 production. By using Ce6-mediated PDT, we demonstrated cytotoxicity against melanoma in vitro and in vivo. On the other hand, we revealed the PA images of internal organs of mice such as the liver and spleen, which would be beneficial in the size and position determination for the theranosis of cancer localized in internal organs.

2. Materials and Methods

2.1. Biomass, Chemicals and Reagents

Spirulina platensis distributed by Parry Nutraceuticals, India, was used in this study. Ethanol, acetone, and hexane were purchased from Daejung Chemicals (Busan, South Korea). HPLC grade water, methanol and acetonitrile were purchased from Burdick and Jackson (Muskegon, MI, USA). Thin-layer chromatography was performed with Silica gel 60 F254 (Merck, Darmstadt, Germany).

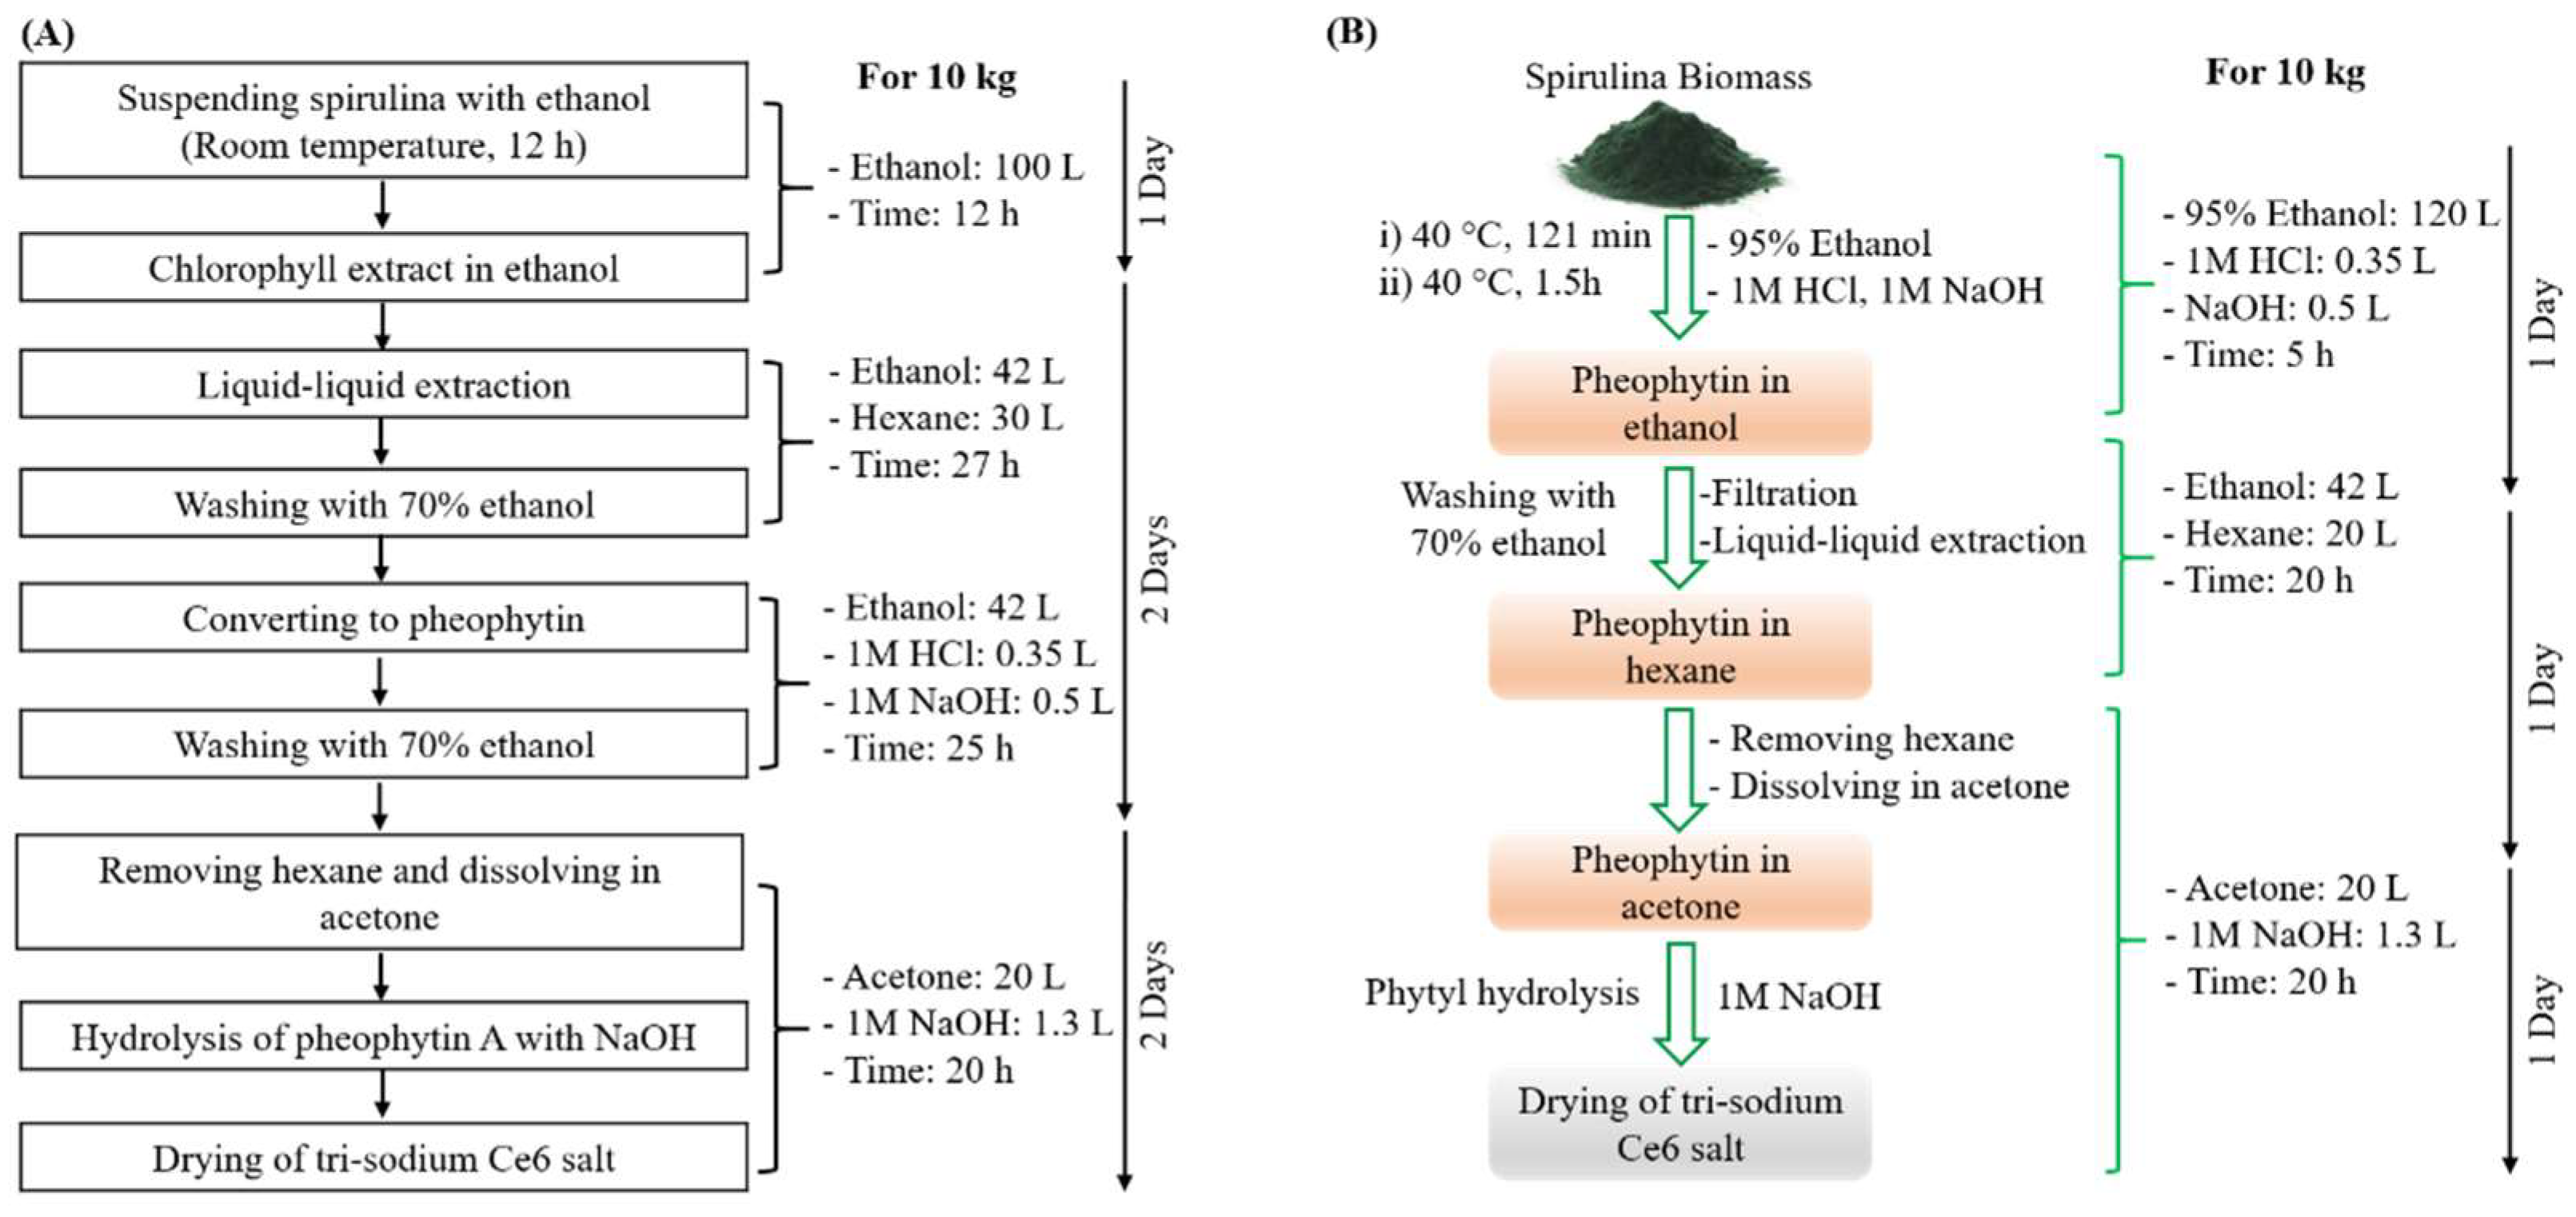
2.2. Pilot-Plant-Scale Synthesis of Ce6 by Conventional Method

Pilot-scale Ce6 synthesis was performed by the conventional method, as illustrated in Scheme 1i. Chlorophyll a was extracted from Spirulina platensis biomass (10 kg) in ethanol (100 L) at room temperature. Spirulina biomass was discarded after filtration. About 80% of the ethanol solution of chlorophyll was evaporated, and hexane (30 L) was added. Distilled water (8.5 L) was then added, maintaining the concentration of ethanol up to 70% by volume to allow phase separation. The aqueous ethanol phase was separated, followed by washing the organic layer with 70% ethanol three times (20 L × 3). The chlorophyll solution in hexane was collected and converted to pheophytin by using 1M HCl solution (0.35 L) at room temperature. The reaction mixture was neutralized with 1M NaOH solution (0.5 L) after completion of the reaction, then washed with 70% ethanol three times (20 L × 3). The pheophytin solution in hexane was evaporated in vacuo, dissolved in acetone (20 L), and heated to reflux, then 1M NaOH (1.3 L) was added to facilitate phytyl hydrolysis and E-ring opening. As the reaction was completed, the reaction mixture was cooled to room temperature, filtered, and vacuum-dried to afford trisodium salt of Ce6 (yield: 127 g, 1.27% of spirulina biomass) as a black solid.

2.3. Optimization of Chlorophyll a Extraction from Spirulina

Since the conventional method of Ce6 production is time-consuming and utilizes large volumes of organic solvent, the necessity of developing a more rapid and cost-effective method appears inevitable. Therefore, the optimization of extraction and reaction conditions was performed in order to find a superior method. Initially, spirulina (1 g) was dispersed in 10 m, equivalent to the solid–liquid ratio (SLR) 0.1 gdry biomass.mLsolvent−1, of four different types of organic solvents (ethanol, methanol, acetone, and 95% ethanol) in separate conical tubes and shaken for 2 h at 25 °C in an incubated shaker (300 rpm, Jeio Tech, Seoul, South Korea). We selected 95% ethanol for optimum temperature determination using the same SLR at different temperature points (30, 40, 50, and 60 °C) for 2 h.
The response surface methodology (RSM) was used to determine the optimum time required for extraction and SLR. The methodology provided the corresponding chlorophyll yield after extraction in different conditions using two independent variables, i.e., extraction time and SLR. The optimization of the process was accomplished by using a central composite rotatable design (CCRD, 22) totalizing 13 extractions, including four extractions for factorial points, four extractions for axial points, and five repetitions of the central point, as shown in Table S1. The designed experiments for the extraction of chlorophyll were accomplished by shaking at 300 rpm in an incubated shaker. At the end of extraction, the spirulina suspension was centrifuged at 3000 rpm for 10 min. The UV absorbance of the supernatant solution was acquired at a wavelength ranging from 300 to 800 nm in a quartz cuvette having a path length of 1 cm (Thermo Scientific, Multiskan GO, Waltham, MA, USA). The chlorophyll quantification was performed according to the previously reported method (Section S2) [22]. The statistical analysis and preparation of the response surface and contour plot were performed using the statistical software Minitab 18.

2.4. Pilot-Plant-Scale Synthesis of Ce6 by Modified Method

With the optimized extraction condition in hand, pilot-plant-scale extraction and synthesis of Ce6 were performed (Figure 1, Scheme 1ii). Spirulina platensis biomass (10 kg) was suspended in 95% ethanol (125 L) and stirred at 40 °C for 121 min under an inert environment. 1M HCl solution (0.35 L) was added in situ to convert chlorophyll a to pheophytin a. After the completion of the reaction, the reaction mixture was cooled to room temperature and neutralized with 1M NaOH (0.5 L). Next, the biomass was separated by filtration. To the 95% ethanol solution of pheophytin (filtrate), water (44.6 L) and hexane (20 L) were added for the liquid–liquid extraction and phase separation. The aqueous ethanol phase was separated, and the organic layer was washed three times with 70% ethanol (20 L × 3). The pheophytin solution in hexane was evaporated in vacuo, dissolved with acetone (20 L), heated to reflux, and 1M NaOH (1.3 L) was utilized to facilitate phytyl hydrolysis and E-ring opening. As the reaction was completed, the reaction mixture was cooled to room temperature, filtered, and vacuum-dried to afford trisodium salt of Ce6 (yield: 135 g, 1.35% of spirulina biomass) as a black solid.

2.5. Purification of Chlorin e6

The process of Ce6 trisodium salt purification is the same for both the conventional and modified methods. Since the modified method displayed slightly improved yield and is the method of concern, hereafter, we used Ce6 obtained by the optimized method only. Thus, the obtained trisodium salt of Ce6 (135 g) was dissolved in distilled water (2.5 L) and neutralized with 1M HCl solution (pH ~7). The reaction mixture was then centrifuged at 10,000 rpm for 1.5 h, and the sediment was separated by filtration. The filtrate was collected and pH 2~3 was adjusted using 1M HCl, which resulted in Ce6 precipitation. The solid Ce6 obtained after filtration was dissolved in acetone (3 L) and pH 6~7 was maintained with 1 M NaOH solution. The solid obtained after filtration was vacuum-dried to obtain Ce6 (28 g, 0.28% of spirulina biomass) as a black solid.

2.6. Cell Culture

B16F10 cells were purchased from Korean Cell Line Bank (KCLB, Seoul, South Korea). They were grown in DMEM supplemented with 10% fetal bovine serum (Life Technologies Corporation, Carlsbad, CA, USA) and 1% penicillin and streptomycin (Life Technologies Corporation, Carlsbad, CA, USA). These cells were cultured at 37 °C in a humidified atmosphere containing 5% CO2.

2.7. Cell Viability Assay

To determine the Ce6 dark and photo-cytotoxicity, the MTT (3-(4,5-dimethylthiazol-2-yl)-2,5-diphenyltetrazolium bromide) experiment was implemented. B16F10 cells were seeded at the density of 1.2 × 10³ cells in a 96-well plate and incubated for 24 h at 37 °C and 5% CO2 before being treated with different doses of Ce6 (0–519 μΜ for dark cytotoxicity and 0–80 μΜ for light cytotoxicity with light of 660 nm at 50 mW (5 J) for 1 min 40 s). The MTT reagent was then added, and the mixture was incubated for 24 h. To dissolve the formazan precipitate, 200 µL dimethyl sulfoxide (DMSO, Sigma, Saint Louis, MO, USA) was added after the spent culture medium was fully removed. A microplate reader (Multiscan GO, Thermo Scientific) was used to measure the absorbance at 590 nm.

2.8. Animal Model

Male mice (n = 10) aged 6 weeks and weighing 20 g were purchased from Orient Bio (Sungnam, Seoul, South Korea) and acclimatized in a controlled animal housing facility of Dongsung Cancer Center, Daegu for 7 days with alternate light and dark cycle of 12 h. Each experimental group consisted of randomly grouped mice of the same weight.

2.9. Allograft Mouse Model Using B16F10 Melanoma Cell

After 1 week of acclimation, 10 mice were randomly selected for the investigation. Among them, the normal group (n = 5) and the treatment group (n = 5) were distributed. We induced allografts of B16F10 melanoma cells by subcutaneously injecting 1 × 105 cells into the right flanks of the mice, and tumor formation was monitored. Subcutaneous tumors induced by B16F10 cells in C57BL6 mice were randomly divided into control and Ce6-PDT groups (5 of each group).

2.10. PDT in Animal Model

After tumor volume reached the size of 90 mm3, the mice in the control and treatment groups were injected via the caudal vein with normal saline and 2.5 mg/kg Ce6 solution, respectively. Tumor sites were irradiated under anesthesia 3 h after drug administration with a 660 nm laser diode (LD, LEMT, Belarus) at a dose of 100 J/cm2 (irradiation fluence rate 200 mw/cm2, irradiation time 500 s, Figure 4A). Tumor volume was recorded every 2 days until animals were euthanized on the 24th day after tumor inoculation (Figure 4B). The tumor volume (v) was determined using the formula; v = l × w2/2, where l and w were the length and width of the tumor, respectively. All of the mouse experiments were reviewed and carried out with the approval of the Institutional Animal Care and Use Committee of the Dongsung Cancer Center under protocol IACUC #ds002106117-2.

2.11. Photoacoustic (PA) Imaging

The in vitro PA imaging capability of Ce6 was established by acquiring PA signals of normal saline, Ce6 in concentrations of 50 and 100 μM, and methylene blue (1 mM) as a control in the tubes. The PA signals were recorded at 680, 700, 720, 740, and 760 nm wavelengths. To study the PA imaging characteristics of Ce6 in vivo, an ICR mouse was intravenously injected with 2.5 mg/kg Ce6 solution, and PA images of the organs, especially the spleen and liver, were obtained at 0, 0.5, 1, 2, and 3 h post-injection through an Endra Nexus 128 tomography system (Endra Inc., Ann Arbor, MI, USA) under 680–950 nm pulsed laser irradiation [23].

3. Results

3.1. Extraction of Chlorophyll a Using 95% Ethanol

For the commencement of an improved method for Ce6 preparation, the study was initiated by screening different polar solvents for their ability to extract chlorophyll a from 1 g spirulina powder at 25 °C (Figure S1). Methanol and 95% ethanol showed the highest extraction efficiency of 11.5 and 10.6 mg/g of chlorophyll a, respectively. Interestingly, pure ethanol gave a lower (5.96 mg/g) chlorophyll a yield, which is comparable to pure acetone, showing the lowest chlorophyll a yield of 3.09 mg/g. Although methanol displayed the most efficient results for the extraction of chlorophyll a, it was discarded considering its potential toxicity. Ethanol (95%), the second best solvent, was selected for further study, considering its non-toxic and environmentally friendly nature. Subsequently, the optimum temperature (40 °C) was determined using 95% ethanol by screening at 30, 40, 50, and 60 °C (Figure S2). In addition, using 95% ethanol as the solvent of choice to extract chlorophyll a at 40 °C, the influence of independent variables such as SLR and extraction time on the chlorophyll a yield was studied by the response surface methodology. The operational conditions were optimized by central composite rotatable design (CCDR, 22) and the corresponding response surface plot and contour plot were prepared (Figure 2). The experimental design provided the yield of chlorophyll a (mg/g) as a relative response of two independent variables, i.e., SLR and time. The model predicted a theoretical maximum extraction yield of 14.1 mg/g (Figure S3) while using SLR of 0.08 gdry biomass.mLsolvetnt−1 and an extraction time of 121 min. The accuracy and precision of the model equations were validated by statistical analysis using analysis of variance (ANOVA) (Table S2). R-sq and R-sq (adj) were obtained as 0.9755 and 0.9581, suggesting an acceptable goodness-of-fit. According to the normal probability plot, the response model for chlorophyll a extraction was fixed to the normal distribution (Figure S4).

3.2. Efficient Pilot-Plant Synthesis of Ce6

In the course of finding an efficient synthesis methodology for Ce6, two approaches, the conventional and modified methods, were compared in terms of extraction/reaction time, solvents used, and ease of processing (Scheme 2). The efficiency of the modified method to extract chlorophyll a from Spirulina platensis is summarized in Table 1. The conventional approach involves time-consuming (12 h) chlorophyll a extraction at room temperature using ethanol (Scheme 2A). On the other hand, heating the spirulina-95% ethanol mixture significantly reduced the extraction time by six-fold (121 min). Applied heat might have assisted in breaking the plant cell wall, resulting in a faster chlorophyll extraction rate. Aqueous acid was added to the extraction mixture after 2 h in situ (Scheme 2B). Interestingly, the time required for the conversion of chlorophyll a to pheophytin a (demetallation) was reduced by 50% under heating conditions (1.5 h) as compared to the conventional approach (3 h). Since the chlorophyll a extracted from spirulina was converted to pheophytin a in situ, the chlorophyll a washing step was removed from the modified method. Therefore, Ce6 could be efficiently synthesized by utilizing the rapid, cost-effective, and environmentally friendly modified method. During the process of Ce6 preparation, the hexane and acetone could be recycled by vacuum evaporation of the used solvents so that the Ce6 preparation was eco-friendly as well as cost-effective.

3.3. Purification of Ce6 and Its Spectral Properties

The synthesized crude trisodium salt of Ce6 contains primary metabolites such as proteins, carbohydrates, and carotenoids since the starting material is spirulina, which is a well-known superfood rich in proteins [24]. To remove such non-Ce6-related impurities, a water solution of Ce6 at pH 7 was centrifuged to eliminate such unnecessary materials. Moreover, water-soluble impurities were also removed while filtering and washing at pH 2~3. Later on, at the final step of Ce6 purification (pH~7), most of the Ce6-related impurities were also removed during filtration and washing with acetone. As a result, the HPLC purity of final Ce6 (pH~7) obtained was about 98% without primary metabolites (Figure S6). Thus, the formed Ce6 was also analyzed through 1H NMR, exhibiting –OH peaks of three carboxylic acids at chemical shift δ 13.9 (1H) and 12.4 (2H) (Figure S5). The UV absorbance of Ce6 obtained from both conventional and modified methods was analyzed, which displayed one similar Soret band (402 ± 2 nm) and four Q bands at wavelengths (502 ± 2), (533 ± 2), (608 ± 2), and (662 ± 2) nm (Figure S7). Moreover, the FT-IR spectra of Ce6 were also studied (Figure S8). The results displayed the carboxylic C=O characteristic peaks at 1650–1695 cm−1 and −CH2, −CH peaks at 2958, 1420, and 1383 cm−1.

3.4. Cytotoxicity of Ce6 PDT In Vitro

For successful PDT, the PS should show minimal toxicity in the absence of light. The dark cytotoxicity of the Ce6 was measured against B16F10 melanoma cell line. The cells were treated with increasing concentrations (12–768 µM, 24 h) of Ce6, and then cell viability was determined by MTT assay. The dark cytotoxicity suggested that higher concentration of Ce6 showed cytotoxicity on B16F10 cells with an IC50 value of 519.6 µM (Figure 3A). On the other hand, when cells were exposed to light of 660 nm at 50 mW (5 J) for 1 min 40 s (Figure 3B), pronounced light-induced cytotoxicity was observed with a 27-fold lower concentration against the tested cells (IC50 18.9 µM). This analysis demonstrated that Ce6 exhibits minimal dark cytotoxicity in cancer cells but that following PDT, it has a strong cell killing effect in cancer cells.

3.5. Ce6 PDT Effects on Allograft Mouse Model Using B16F10 Melanoma Cells

We next sought to determine whether Ce6 PDT had a comparable effect on allograft tumor growth in the mouse model. We decided to test the PDT efficacy of Ce6 in vivo utilizing B16F10, a murine melanoma cancer cell. As shown in the experimental scheme, mice were intravenously injected with Ce6 (2.5 mg/kg), followed by laser irradiation (3 h post-injection) when the tumor volume reached 90 mm3 (Figure 4A). Compared with the vehicle-treated control group (normal saline), the tumor growth rates were significantly lower in mice treated with Ce6 and PDT (Figure 4B). No significant differences were observed in the body weight gains of PDT-treated mice when compared to the control groups (Figure 4C).

3.6. Ce6 as a PA Contrast Agent

Although Ce6 displays visible region absorption, it can be used as a PA imaging contrast agent to determine the size and position of internal organs. At first, PA signal intensity was obtained in vitro by irradiating normal saline, Ce6 (50 and 100 μM), and methylene blue (1 mM) in the tubes with visible to NIR light. A notable PA signal was observed, and the PA amplitude was enhanced with an increase in Ce6 concentration (Figure 5A–C). Furthermore, in vivo PA imaging characteristics of Ce6 were studied using an ICR mouse after intravenous injection (2.5 mg/kg). PA images of the liver and spleen were recorded at the predetermined time points (0, 0.5, 1, 2, and 3 h) post-administration (Figure 5D). A prominent PA signal was observed immediately after injection in the liver, which reached its maximum at 1 h and started diminishing afterward. Similarly, the maximum PA intensity was observed at 680 nm, and the intensity decreased with the increase in wavelength. A PA image of the spleen was obtained from the anterior side, and then the mouse was tilted slightly backward for a better view (Figure 5E). As shown in Figure 5D,E, the size and position of the liver and spleen could be accurately determined by using Ce6 as a PA imaging contrast agent, which was further confirmed by autopsy (Figure S9). Thus, the PA imaging ability of Ce6 allowed us to localize internal organs of interest rapidly, which might be beneficial for the theranosis of cancer in internal organs.

4. Discussion

The search for efficient methodologies to prepare biologically active compounds is always of interest. We have developed a new synthesis strategy for the production of Ce6. Initial optimization of chlorophyll in different conditions (solvent, time, and SLR) endorsed the pilot-plant-scale synthesis of Ce6. Alcoholic solvents such as ethanol and methanol have superior chlorophyll-extracting ability from different species [25]. However, ethanol is the prime choice for the extraction of biomass due to its non-toxic and green nature [26]. Moreover, aqueous ethanol solution (95–96%) has been established as a solvent of choice for chlorophyll and carotenoids extraction since ethanol and water form an azeotropic solution at this composition, resulting in the same solvent concentration even after evaporation during the extraction process [27]. Elevated temperature plays a crucial role during extraction by increasing the rate of cellular component transfer to the solvent. Nevertheless, the pigment of interest, such as chlorophyll, is very susceptible to degradation by denaturation at temperatures greater than 60 °C. A similar trend of increased chlorophyll yield from Chlorella vulgaris at elevated temperatures was investigated [28]. Therefore, our experiments were performed at 30, 40, 50, and 60 °C, showing the optimum of 40 °C as the best selection. Furthermore, the use of a statistical tool such as the response surface methodology (RSM) is the most popular method to optimize SLR and reaction time duration to find the optimum yield [29]. This methodology has been significantly applied to the optimization of the extraction of chlorophyll from Chlorella vulgaris [28], Spirulina maxima [30], and Laminaria japonica [31]. Thus, our result with RSM by using 95% ethanol extraction of SLR of 0.12 gdry biomass.mLsolvetnt−1 in 121 min at 40 °C yielded an extraction time reduced by six-fold as well as a single-step preparation of pheophytin in the same reactor with the exclusion of solvents for chlorophyll washing. By using the optimized chlorophyll extraction process, our modified method provided the pilot-plant-scale production of Ce6 by using 10 kg of spirulina in a sustainable and green process. In the line of pilot-scale production, the Moreira group has also demonstrated the pilot-scale production of bioactive compounds including chlorophyll from micro algae [32].
A PS administered to treat tumors during PDT may reach healthy cells nearby and may also possess dark cytotoxicity, which can limit its use in vivo. Therefore, photosensitizing effects of Ce6 in both the dark and the presence of light were evaluated against the B16F10 melanoma cell line. The revealed IC50 (18.9 μM, 519.6 μM) of Ce6 with or without light, respectively, demonstrated that Ce6 PDT has a strong toxicity effect in cancer cells but less toxicity in the absence of light, even at the higher concentration. The consistent results were also suggested by Yang et al., where free Ce6 showed an IC50 of 131.56 μM (dark) and 23.27 μM (light) in B16F10 cells [33]. B16F10 is a commonly used mouse melanoma cell for the allograft mouse model due to its relative ease of use and highly reproducible results [34]. We demonstrated remarkable tumor growth inhibition after Ce6 PDT on a murine model of melanoma, which is in line with the study performed by Son et al., who demonstrated similar suppression of tumor growth by gelatin-Ce6-PDT [16].
Over the past decade, various PA contrast agents have been discovered, including cyanine-based dyes, perylene diimide, melanin, Alexa Fluor 750, IRdye800, and methylene blue [35]. However, some PA contrast agents display significant drawbacks, such as methylene blue (>2 mg/kg), which has revealed negative impacts on health, including respiratory distress, abdominal disorders, blindness, digestive problems [36], and central nervous system toxicity [37]. Consequently, non-toxic, biocompatible, plant-derived Ce6, having similar NIR light-absorbing characteristics, might be a better alternative as a PA contrast agent in clinical diagnostic areas. Recently, Ce6 and derivative-conjugated nanoparticles such as AuNSs@PDA [38], TiO2-x [39], and PFH@HSC [17] have been extensively studied for their PA imaging ability, which is in line with our results for liver-spleen visualization using Ce6 only. However, the use of Ce6 alone as a PA contrast agent in the visible region (680 nm) has not been properly investigated before. Therefore, further analysis of Ce6 as a PA imaging agent without being capsuled by nanoparticles would be a promising subject for future studies.

5. Conclusions

In summary, we performed the efficient extraction of chlorophyll a by using a surface response methodology and the synthesis of Ce6 from Spirulina platensis in a pilot-plant-scale setup. The modified synthetic method provided a rapid, green, and sustainable protocol with better Ce6 yield. The in vitro result suggested that Ce6 possesses high photo-induced cytotoxicity but less in the absence of light, indicating its high PDT effectiveness with minimal toxicity. Ce6 also inhibited tumor growth in B16F10 melanoma mouse models. In addition, Ce6 enhanced cell contrast for better PA imaging of the mouse liver and spleen after 1 h post-injection at the 680 nm wavelength. However, further research is required to elucidate the anticancer mechanistic action of Ce6 and its application as a PA contrast agent. Therefore, this study provides information on not only green pilot synthesis of Ce6 but also research areas of anti-cancer therapy as well as its applicability in PA imaging.

Supplementary Materials

The following supporting information can be downloaded at: https://www.mdpi.com/article/10.3390/pr10112215/s1, Section S1: General information; Section S2: Quantification of Chlorophyll a; Figure S1: Screening of various solvents for chlorophyll a extraction by using 1 g Spirulina at 25 °C for 2 h shaking (300 rpm) in incubated shaker; Figure S2: Screening of various temperatures for chlorophyll a extraction by using 1 g Spirulina in 95% ethanol for 2 h shaking (300 rpm) in incubated shaker; Figure S3: Process optimization curve for the extraction of chlorophyll a; Figure S4: Normal probability plot of the residuals; Figure S5: 1H NMR of Ce6 (modified method); Figure S6: HPLC and ESI-MS chromatogram of Chlorin e6 (modified method), Figure S7: Comparative figure of UV and fluorescence absorbance of Ce6 (conventional and modified method); Figure S8: Comparative figure of FT-IR of Ce6 (conventional and modified method); Figure S9: PA image of liver compared with liver autopsy; Table S1: Real and coded values of the optimization process expressed by the yields of chlorophyll extracted from Spirulina maxima by CCRD 22 using 95% ethanol as solvent; Table S2: ANOVA for the optimization of chlorophyll a extraction.

Author Contributions

Y.-W.K. and T.B.T.M. were responsible for the conception of this present work. T.B.T.M., R.S. and P.G. drafted the manuscript and created the images. J.L. reviewed and made significant contributions to the manuscript. All authors have read and agreed to the published version of the manuscript.

Funding

This work was supported by the Korea Medical Device Development Fund grant funded by the Korea government (the Ministry of Science and ICT, the Ministry of Trade, Industry and Energy, the Ministry of Health & Welfare, the Ministry of Food and Drug Safety) (NTIS Number: 1711174319, RS-2020-KD000106).

Institutional Review Board Statement

Not applicable.

Informed Consent Statement

Not applicable.

Data Availability Statement

All the data are contained within the manuscript and Supplementary Materials.

Conflicts of Interest

The authors declare no conflict of interest.

References

  1. Josefsen, L.B.; Boyle, R.W. Photodynamic Therapy and the Development of Metal-Based Photosensitisers. Met.-Based Drugs 2008, 2008, 276109. [Google Scholar] [CrossRef] [PubMed] [Green Version]
  2. Correia, J.H.; Rodrigues, J.A.; Pimenta, S.; Dong, T.; Yang, Z. Photodynamic Therapy Review: Principles, Photosensitizers, Applications, and Future Directions. Pharmaceutics 2021, 13, 1332. [Google Scholar] [CrossRef]
  3. Plaetzer, K.; Krammer, B.; Berlanda, J.; Berr, F.; Kiesslich, T. Photophysics and Photochemistry of Photodynamic Therapy: Fundamental Aspects. Lasers Med. Sci. 2009, 24, 259–268. [Google Scholar] [CrossRef] [PubMed]
  4. Sai, D.L.; Lee, J.; Nguyen, D.L.; Kim, Y.-P. Tailoring Photosensitive ROS for Advanced Photodynamic Therapy. Exp. Mol. Med. 2021, 53, 495–504. [Google Scholar] [CrossRef] [PubMed]
  5. Pardo-Sánchez, I.; García-Moreno, D.; Mulero, V. Zebrafish Models to Study the Crosstalk between Inflammation and NADPH Oxidase-Derived Oxidative Stress in Melanoma. Antioxidants 2022, 11, 1277. [Google Scholar] [CrossRef]
  6. Domingues, B.; Lopes, J.M.; Soares, P.; Pópulo, H. Melanoma Treatment in Review. ImmunoTargets Ther. 2018, 7, 35–49. [Google Scholar] [CrossRef] [Green Version]
  7. Kim, C.; Favazza, C.; Wang, L.V. In Vivo Photoacoustic Tomography of Chemicals: High-Resolution Functional and Molecular Optical Imaging at New Depths. Chem. Rev. 2010, 110, 2756–2782. [Google Scholar] [CrossRef] [Green Version]
  8. Miyata, A.; Ishizawa, T.; Kamiya, M.; Shimizu, A.; Kaneko, J.; Ijichi, H.; Shibahara, J.; Fukayama, M.; Midorikawa, Y.; Urano, Y.; et al. Photoacoustic Tomography of Human Hepatic Malignancies Using Intraoperative Indocyanine Green Fluorescence Imaging. PLoS ONE 2014, 9, e112667. [Google Scholar] [CrossRef]
  9. Attia, A.B.E.; Balasundaram, G.; Moothanchery, M.; Dinish, U.S.; Bi, R.; Ntziachristos, V.; Olivo, M. A Review of Clinical Photoacoustic Imaging: Current and Future Trends. Photoacoustics 2019, 16, 100144. [Google Scholar] [CrossRef]
  10. Han, S.; Lee, D.; Kim, S.; Kim, H.-H.; Jeong, S.; Kim, J. Contrast Agents for Photoacoustic Imaging: A Review Focusing on the Wavelength Range. Biosensors 2022, 12, 594. [Google Scholar] [CrossRef]
  11. Plekhova, N.; Shevchenko, O.; Korshunova, O.; Stepanyugina, A.; Tananaev, I.; Apanasevich, V. Development of Novel Tetrapyrrole Structure Photosensitizers for Cancer Photodynamic Therapy. Bioengineering 2022, 9, 82. [Google Scholar] [CrossRef]
  12. Ethirajan, M.; Chen, Y.; Joshi, P.; Pandey, R.K. The Role of Porphyrin Chemistry in Tumor Imaging and Photodynamic Therapy. Chem. Soc. Rev. 2011, 40, 340–362. [Google Scholar] [CrossRef]
  13. Dąbrowski, J.M.; Arnaut, L.G.; Pereira, M.M.; Monteiro, C.J.P.; Urbańska, K.; Simões, S.; Stochel, G. New Halogenated Water-Soluble Chlorin and Bacteriochlorin as Photostable PDT Sensitizers: Synthesis, Spectroscopy, Photophysics, and in Vitro Photosensitizing Efficacy. ChemMedChem 2010, 5, 1770–1780. [Google Scholar] [CrossRef]
  14. Chen, H.; Humble, S.W.; Jinadasa, R.G.W.; Zhou, Z.; Nguyen, A.L.; Vicente, M.G.H.; Smith, K.M. Syntheses and PDT Activity of New Mono- and Di-Conjugated Derivatives of Chlorin E6. J. Porphyr. Phthalocyanines 2017, 21, 354–363. [Google Scholar] [CrossRef] [Green Version]
  15. Beack, S.; Kong, W.H.; Jung, H.S.; Do, I.H.; Han, S.; Kim, H.; Kim, K.S.; Yun, S.H.; Hahn, S.K. Photodynamic Therapy of Melanoma Skin Cancer Using Carbon Dot – Chlorin E6 – Hyaluronate Conjugate. Acta Biomater. 2015, 26, 295–305. [Google Scholar] [CrossRef]
  16. Son, J.; Yi, G.; Kwak, M.-H.; Yang, S.M.; Park, J.M.; Lee, B.-I.; Choi, M.-G.; Koo, H. Gelatin–Chlorin E6 Conjugate for in Vivo Photodynamic Therapy. J. Nanobiotechnol. 2019, 17, 50. [Google Scholar] [CrossRef] [Green Version]
  17. Li, Z.; Yang, F.; Wu, D.; Liu, Y.; Gao, Y.; Lian, H.; Zhang, H.; Yin, Z.; Wu, A.; Zeng, L. Ce6-Conjugated and Polydopamine-Coated Gold Nanostars with Enhanced Photoacoustic Imaging and Photothermal/Photodynamic Therapy to Inhibit Lung Metastasis of Breast Cancer. Nanoscale 2020, 12, 22173–22184. [Google Scholar] [CrossRef]
  18. Bui, H.T.H.; Pham, T.T.; Nguyen, H.T.T.; Do, T.M.; Nga, V.T.; Bac, N.D.; Huyen, V.T.B.; Le, H.M.; Tran, Q.C. Transformation Chlorophyll a of Spirulina Platensis to Chlorin E6 Derivatives and Several Applications. Open Access Maced. J. Med. Sci. 2019, 7, 4372–4377. [Google Scholar] [CrossRef] [Green Version]
  19. Tong, Y.; Gao, L.; Xiao, G.; Pan, X. Microwave Pretreatment-Assisted Ethanol Extraction of Chlorophylls from Spirulina platensis. J. Food Process Eng. 2012, 35, 792–799. [Google Scholar] [CrossRef]
  20. Minchev, I.; Petkova, N.; Milkova-Tomova, I. Ultrasound-Assisted Extraction of Chlorophylls and Phycocyanin from Spirulina platensis. Biointerface Res. Appl. Chem. 2020, 11, 9296–9304. [Google Scholar] [CrossRef]
  21. Tong, Y.; Gao, L.; Xiao, G.; Pan, X. Supercritical CO2 Extraction of Chlorophyll a from Spirulina Platensis with a Static Modifier. Chem. Eng. Technol. 2011, 34, 241–248. [Google Scholar] [CrossRef]
  22. Lichtenthaler, H.K. Chlorophylls and Carotenoids: Pigments of Photosynthetic Biomembranes. In Plant Cell Membranes; Packer, L., Douce, R., Eds.; Methods in Enzymology Volume 148; Academic Press: Cambridge, MA, USA, 1987; pp. 350–382. [Google Scholar]
  23. Van de Sompel, D.; Sasportas, L.S.; Jokerst, J.V.; Gambhir, S.S. Comparison of Deconvolution Filters for Photoacoustic Tomography. PLoS ONE 2016, 11, e0152597. [Google Scholar] [CrossRef] [PubMed] [Green Version]
  24. Lafarga, T.; Fernández-Sevilla, J.M.; González-López, C.; Acién-Fernández, F.G. Spirulina for the Food and Functional Food Industries. Food Res. Int. 2020, 137, 109356. [Google Scholar] [CrossRef] [PubMed]
  25. Sartory, D.P.; Grobbelaar, J.U. Extraction of Chlorophyll a from Freshwater Phytoplankton for Spectrophotometric Analysis. Hydrobiologia 1984, 114, 177–187. [Google Scholar] [CrossRef]
  26. Nutrizio, M.; Maltar-Strmečki, N.; Chemat, F.; Duić, B.; Jambrak, A.R. High-Voltage Electrical Discharges in Green Extractions of Bioactives from Oregano Leaves (Origanum vulgare L.) Using Water and Ethanol as Green Solvents Assessed by Theoretical and Experimental Procedures. Food Eng. Rev. 2021, 13, 161–174. [Google Scholar] [CrossRef]
  27. Wasmund, N.; Topp, I.; Schories, D. Optimising the Storage and Extraction of Chlorophyll Samples. Oceanologia 2006, 48, 125–144. [Google Scholar]
  28. Kong, W.; Liu, N.; Zhang, J.; Yang, Q.; Hua, S.; Song, H.; Xia, C. Optimization of Ultrasound-Assisted Extraction Parameters of Chlorophyll from Chlorella vulgaris Residue after Lipid Separation Using Response Surface Methodology. J. Food Sci. Technol. 2014, 51, 2006–2013. [Google Scholar] [CrossRef] [Green Version]
  29. Weremfo, A.; Abassah-Oppong, S.; Adulley, F.; Dabie, K.; Seidu-Larry, S. Response Surface Methodology as a Tool to Optimize the Extraction of Bioactive Compounds from Plant Sources. J. Sci. Food Agric. 2022. [Google Scholar] [CrossRef]
  30. Martins, M.; Albuquerque, C.M.; Pereira, C.F.; Coutinho, J.A.P.; Neves, M.G.P.M.S.; Pinto, D.C.G.A.; Faustino, M.A.F.; Ventura, S.P.M. Recovery of Chlorophyll a Derivative from Spirulina Maxima: Its Purification and Photosensitizing Potential. ACS Sustain. Chem. Eng. 2021, 9, 1772–1780. [Google Scholar] [CrossRef]
  31. Lu, J.; Feng, X.; Han, Y.; Xue, C. Optimization of Subcritical Fluid Extraction of Carotenoids and Chlorophyll a from Laminaria japonica Aresch by Response Surface Methodology. J. Sci. Food Agric. 2014, 94, 139–145. [Google Scholar] [CrossRef]
  32. Pérez-López, P.; González-García, S.; Ulloa, R.G.; Sineiro, J.; Feijoo, G.; Moreira, M.T. Life Cycle Assessment of the Production of Bioactive Compounds from Tetraselmis suecica at Pilot Scale. J. Clean. Prod. 2014, 64, 323–331. [Google Scholar] [CrossRef]
  33. Yang, C.; Fu, Y.; Huang, C.; Hu, D.; Zhou, K.; Hao, Y.; Chu, B.; Yang, Y.; Qian, Z. Chlorin E6 and CRISPR-Cas9 Dual-Loading System with Deep Penetration for a Synergistic Tumoral Photodynamic-Immunotherapy. Biomaterials 2020, 255, 120194. [Google Scholar] [CrossRef]
  34. Potez, M.; Trappetti, V.; Bouchet, A.; Fernandez-Palomo, C.; Güç, E.; Kilarski, W.W.; Hlushchuk, R.; Laissue, J.; Djonov, V. Characterization of a B16-F10 Melanoma Model Locally Implanted into the Ear Pinnae of C57BL/6 Mice. PLoS ONE 2018, 13, e0206693. [Google Scholar] [CrossRef]
  35. Wu, D.; Huang, L.; Jiang, M.S.; Jiang, H. Contrast Agents for Photoacoustic and Thermoacoustic Imaging: A Review. Int. J. Mol. Sci. 2014, 15, 23616–23639. [Google Scholar] [CrossRef]
  36. Khan, I.; Saeed, K.; Zekker, I.; Zhang, B.; Hendi, A.H.; Ahmad, A.; Ahmad, S.; Zada, N.; Ahmad, H.; Shah, L.A.; et al. Review on Methylene Blue: Its Properties, Uses, Toxicity and Photodegradation. Water 2022, 14, 242. [Google Scholar] [CrossRef]
  37. Gillman, P.K. CNS Toxicity Involving Methylene Blue: The Exemplar for Understanding and Predicting Drug Interactions That Precipitate Serotonin Toxicity. J. Psychopharmacol. 2011, 25, 429–436. [Google Scholar] [CrossRef]
  38. Hu, D.; Zhong, L.; Wang, M.; Li, H.; Qu, Y.; Liu, Q.; Han, R.; Yuan, L.; Shi, K.; Peng, J.; et al. Perfluorocarbon-Loaded and Redox-Activatable Photosensitizing Agent with Oxygen Supply for Enhancement of Fluorescence/Photoacoustic Imaging Guided Tumor Photodynamic Therapy. Adv. Funct. Mater. 2019, 29, 1806199. [Google Scholar] [CrossRef]
  39. Jiao, X.; Zhang, W.; Zhang, L.; Cao, Y.; Xu, Z.; Kang, Y.; Xue, P. Rational Design of Oxygen Deficient TiO2−x Nanoparticles Conjugated with Chlorin E6 (Ce6) for Photoacoustic Imaging-Guided Photothermal/Photodynamic Dual Therapy of Cancer. Nanoscale 2020, 12, 1707–1718. [Google Scholar] [CrossRef]
Scheme 1. Synthesis scheme of Chlorin e6 from Spirulina platensis through conventional method (i) and modified method (ii).
Processes 10 02215 sch001
Figure 1. Process flow diagram for the extraction of chlorophyll a and synthesis of Ce6 by modified method.
Processes 10 02215 g001
Figure 2. (A) Response surface plot and (B) contour of the CCRD 22 obtained for the combined effect of SLR and time of extraction optimization using 95% ethanol as solvent.
Processes 10 02215 g002
Scheme 2. Schematic representation of Ce6 synthesis by: (A) conventional method and (B) modified method. Represented time (day) denotes the reaction and working duration in between the steps.
Processes 10 02215 sch002
Figure 3. Cytotoxicity of Ce6 PDT to B16F10 cells. Analysis was performed after incubating the cells with 12–768 μΜ and 2.5–100 μΜ of Ce6 for (A) dark cytotoxicity and (B) photo-induced cytotoxicity.
Processes 10 02215 g003
Figure 4. Inhibitory effect of Ce6 PDT on tumor growth in mice with transplanted B16F10 cells. The mice were subcutaneously injected in the right flanks with 0.1 mL of B16F10 cells (1 × 10⁵ cells/mL). The control group was not exposed to any treatment, while Ce6 (2.5 mg/kg) followed by irradiation was given to the treatment groups. (A) Scheme showing the protocol of allograft model. (B) The values of tumor volume in vehicle-treated control and treatment groups, and (C) body weight changes. Data are expressed as mean ± SEM, n = 5.
Processes 10 02215 g004
Figure 5. PA imaging potential of contrast agent Ce6. (A) In vitro PA imaging setup showing normal saline, Ce6 (50 and 100 µM), and methylene blue in the tubes. (B) PA images. (C) PA signal intensity of Ce6 at different concentrations and wavelength. In vivo (D) PA images of mouse liver at 0, 30, 60, 120 and 180 min. post intravenous injection of Ce6. (E) PA images of mouse spleen at 680, 700 and 850 nm wavelength from anterior side and after tilting slightly backward.
Processes 10 02215 g005
Table 1. Efficiency of new modified method over conventional method.
ParametersConventional MethodEfficient Pilot Method
SolventEthanol95% Ethanol
Extraction time12 h2 h
Demetallation time3 h1.5 h
Ethanol184 L160 L
Hexane30 L20 L
Total time5 days3 days
Publisher’s Note: MDPI stays neutral with regard to jurisdictional claims in published maps and institutional affiliations.

