Article

Research on Co-Combustion Behaviors of Binary and Ternary Blends of Coal, Walnut Shell, and Biochar by TGA

1
Institute of New Energy, Jiangsu Ocean University, No.59 Cangwu Road, Lianyungang 222005, China
2
School of Agricultural Engineering and Food Science, Shandong University of Technology, No.266 Xincun West Road, Zibo 255000, China
*
Author to whom correspondence should be addressed.
Processes 2022, 10(11), 2264; https://doi.org/10.3390/pr10112264
Submission received: 19 October 2022 / Revised: 31 October 2022 / Accepted: 1 November 2022 / Published: 2 November 2022

Abstract

:
In this paper, the co-combustion behavior of the walnut shell, biochar, and coal, and the respective binary and ternary blends were investigated by thermogravimetric analysis (TGA) in the oxy-fuel atmosphere (21% O2/79% CO2). The combustion reactivity of coal was similar to biochar but lower than that of the walnut shell. The presence of the walnut shell improved the combustion performance of coal and biochar. The interaction between only biochar and coal was inhibited in the binary blends. The presence of the walnut shell in the ternary blend covered up the inhibition between biochar and coal. The average activation energy of each sample was obtained using the Kissinger-Akahira-Sunose (KAS) and Flynn-Wall-Ozawa (FWO) kinetic models. The results of this study provide a reference for the rational utilization of biomass and biochar and the practical improvement of the thermal conversion efficiency of coal.

1. Introduction

Since the 21st century, energy demand has been increasing due to rapid economic development and the continuous improvement of the living standard of people [1]. Coal is the primary source of the current energy consumption in China, and it is expected to remain for a long time in the future. With the extensive use of traditional fossil energy sources such as coal, the problems of ozone layer thinning, acid rain, and sea level rise are becoming more serious; thus, how to conserve and efficiently use fossil energy has become an urgent problem for all countries around the world [2,3].
Currently, many countries are focusing on the development and utilization of biomass energy. Biomass is a renewable green energy source and is the ideal energy source to replace traditional fossil energy sources. The lower density and calorific value of biomass tend to cause unstable combustion in boilers. Hence, the economics of boilers cannot be guaranteed [4]. Although the current application scenarios of biomass energy are much less than those of coal and oil, biomass energy still has a position in the global energy consumption structure that cannot be ignored [5]. The promotion and rational use of biomass energy have become a strategic choice to solve the energy problem in China. It is also an effective technical way to achieve "double carbon", following the current trend of energy saving, environmental protection, and low carbon economy development.
The research and application of biochar are very extensive, and the biomass charring industry of China is also in a rapid development stage. Hence, developing the high potential of biochar is of great significance in realizing the resource utilization of agricultural waste. Biochar is a porous, high surface area, black powdered substance formed by the pyrolysis of biomass, and it has wide environmental applications [6]. In the past decades, it has been widely used in the fields of wastewater treatment, soil fertility enhancement, and carbon sequestration. The powder mobility of biochar is effectively improved compared to biomass. The high porosity also makes the gas atmosphere more accessible to the active site, leading to better combustibility, and allowing its large-scale blending with other materials in boilers and gasifiers [7]. Moreover, the conversion of renewable and cheap agricultural waste into efficient and high-quality biochar can improve the national energy reserves and reduce the environmental pollution caused by improper disposal, which is beneficial to the sustainable development of the country.
Compared to the air atmosphere (21% O2/79% N2), combustion in the oxy-fuel (21% O2/79% CO2) atmosphere achieves large-scale CO2 capture and avoids the formation of thermal NOx due to the presence of N2 [8]. However, CO2 has a higher gas density and specific heat capacity than N2. Therefore, replacing N2 in the air atmosphere with CO2 may reduce the flame stability and the gas temperature propagation rate, which shifts the primary combustion process to a higher temperature interval [9]. It has been demonstrated that the combustion characteristics of the same material in the air atmosphere differ from the oxy-fuel atmosphere. Riaza et al. [10] compared the results obtained in three oxy-fuel atmospheres (21% O2/79% CO2, 30% O2/70% CO2, and 35% O2/65% CO2) with the air atmosphere. The results showed that, when the concentration of O2 is 21%, replacing N2 with CO2 increases the ignition temperature and burnout temperature. When the O2 concentration increases to 30% and 35%, the ignition and burnout temperature are lower than the air atmosphere. In addition, the NO emissions in the oxy-fuel atmosphere are lower than air atmosphere. Xiao et al. [11] studied the combustion characteristics of lignite, three components of biomass, and their mixtures in the oxy-fuel and air atmospheres. They considered that replacing N2 with 79% CO2 resulted in a slight delay in the degradation of cellulose and hemicellulose, while the degradation of lignin was significantly delayed. Additionally, it has been confirmed that O2/CO2 combustion technology can efficiently reduce the concentration of pollutants in the exhaust gas and the loss of available energy during the conversion of chemical energy to heat [12].
The interaction between materials during co-combustion has been extensively studied. Some researchers believe that the main reason for the interaction between biomass and coal is the ability of biomass to generate hydrogen-rich reactive radicals such as H and OH in the lower temperature interval and combine with the radicals formed on the coal surface, which promotes the degradation process [13]. Wu et al. [14] considered that the catalytic effect of minerals in biomass also contributed to the synergistic interaction between biomass and coal, thus reducing char formation. However, some researchers have deduced less interaction between coal and biomass during co-combustion or co-pyrolysis. Vuthaluru [15] conducted co-pyrolysis experiments of bituminous coal with wheat straw and wood in different blending ratios. He deduced that a linear relationship exists between the char yield and the blending proportion of the materials, which implies that there is no interaction between the materials during co-pyrolysis.
The co-combustion of biomass with coal has been widely studied. Many researchers have concluded that biomass can provide extra heat for coal combustion in the low-temperature region to promote the process of coal devolatilization, leading to a more complete combustion of coal [16,17]. However, few studies tackled the co-combustion characteristics and interactions between coal and biochar. In this paper, the combustion characteristics of walnut shells, biochar, and coal, as well as their blends, were investigated by thermogravimetric analysis (TGA). The TG and DTG curves of each sample at different heating rates were obtained, and the interactions of walnut shells, biochar, and coal in the co-combustion process were studied in detail. In addition, the average activation energy was obtained using the Kissinger-Akahira-Sunose (KAS) and Flynn-Wall-Ozawa (FWO) methods, and the experimental and theoretical values of the average activation energy of different blends were compared. The results of this study are intended to provide a valuable basis for the industrial application of biomass, biochar, and coal during co-combustion.

2. Materials and Methods

2.1. Sample Preparation

Brown coal (C) was obtained from Inner Mongolia, China, and the walnut shell (W) was selected from Jiangsu Province, China. The corn stover was obtained from Henan Province, China. The biochar (B) used in the experiments was prepared by the pyrolysis of corn stover in a carbonization device at a constant temperature of 500 °C. The pyrolysis can increase the density of the materials and reduce the volume of biomass compared to pretreatment methods such as acidification, microwaving, and baking [18]. The selected materials were first dried at room temperature for one week. They were then ground and screened to a particle size of approximately 100 μm. Afterwards, they were placed in a desiccation oven at 120 °C for 24 h to remove moisture. Finally, the prepared materials to be tested were placed in a desiccator for use. The ultimate analysis of the selected materials was performed in an elemental analyzer (Vario MACRO cube, Germany), and an automatic proximate analyzer (5E-MAG6600, China) was used to perform proximate analysis based on the GB212-91 standard. The ultimate and proximate analysis of the selected materials is presented in Table 1.

2.2. Experiment Design and Procedure

The experiments were performed on three materials using the thermogravimetric analyzer (HCT-3, Hengjiu Scientific Instrument Factory, Beijing, China) to study the thermal behavior of the samples. The material was placed ((10 ± 1) mg) each time in the ceramic crucible and heated from ambient temperature (28 °C) to 800 °C at three different ramping rates of 10, 20, and 30 °C/min. The gas atmosphere was 21% O2/79% CO2, and the gas flow rate was 80 mL/min. The thermogravimetric analyzer recorded the sample mass variation function of the temperature during this procedure. In all the experiments, the proportions of materials in the binary and ternary mixtures were 1:1 and 1:1:1, denoted by C-W, C-B, W-B, and C-W-B, respectively. To validate the accuracy of the data obtained from these experiments, each sample was repeated at least two times under the same experimental conditions.

2.3. Kinetic Model

The weight loss data recorded by the thermogravimetric analyzer at three different heating rates (β = dT/dt) were employed to plot the TG and DTG curves for each sample. The activation energy of the reaction can be calculated by further analyzing the TG curves, where the activation energy is the minimum energy required for the reaction to proceed [19].
According to the Arrhenius equation, the kinetic equation based on the degree of conversion α can be expressed as:
d α d t = k T f α = A e x p E R T f α
where t is time, T is the reaction temperature, A is the pre-exponential factor, E is the activation energy, f(α) is the reaction model function, and R is the universal gas constant usually considered as 8.3145 J/(mol·K).
The degree of conversion α of the sample can be computed as:
α = W 0 W t / W 0 W f
where W0 and Wf respectively represent the initial weight and final weight of the sample, and Wt represents the weight of the sample at moment t.
By substituting the heating rate β = dT/dt into Equation (1), the following is obtained:
d α d T = A β e x p E R T f α
The integration of Equation (3) can be written as:
G α = 0 α d α f α = A β T 0 T e x p E R T d T
where T0 is the initial temperature, and the reaction temperature is T = T0 + βt.
Let P u = u e x p ( u ) / ( u 2 ) d u ; then, Equation (4) can be rewritten as [20]:
G α = A E β R P u
where u = E/RT.
After the approximation and simplification of Equation (5), the KAS method is obtained:
l n β T 2 = l n A R E G α E R T
Based on Doyle’s approximation [21], if P u = 0.00484 e x p ( 1.0516 u ) , then the FWO method can be obtained by substituting into Equation (5):
l n β = l n A R E G α 5.331 1.052 E R T
In this paper, the KAS and FWO iso-conversion methods were used. Note that in these methods, the reaction mechanism is not required.

2.4. Interaction between Materials

To study the interaction between materials, theoretical TG curves were introduced. The difference between the theoretical and experimental TG curves was employed to explore whether synergistic or inhibitory effects exist between binary and ternary blends at each temperature in detail. The theoretical TG curves were calculated from Equation (8) [22].
T G T = x i T G i
where xi represents the proportion of each material in the blends, TGi represents the TG curves experimentally obtained for each material, and TGT represents the theoretical weight loss ratio of the blends. If the experimental weight loss ratio is higher than the theoretical weight loss ratio, the interaction between the materials is synergistic, while the opposite represents inhibition.
Moreover, the impact of adding a third substance on the weight loss proportion of the binary blends was studied. When the heating process finished, if the weight loss proportion of the ternary blends was higher than that of the binary blends, the addition of the third substance had a promoting effect on the binary blends. However, if the weight loss proportion of the ternary blends was lower than that of the binary blends, the addition of the third substance had an inhibitory effect on the binary blends.

3. Results and Discussion

3.1. Thermal Behavior of Individual Material

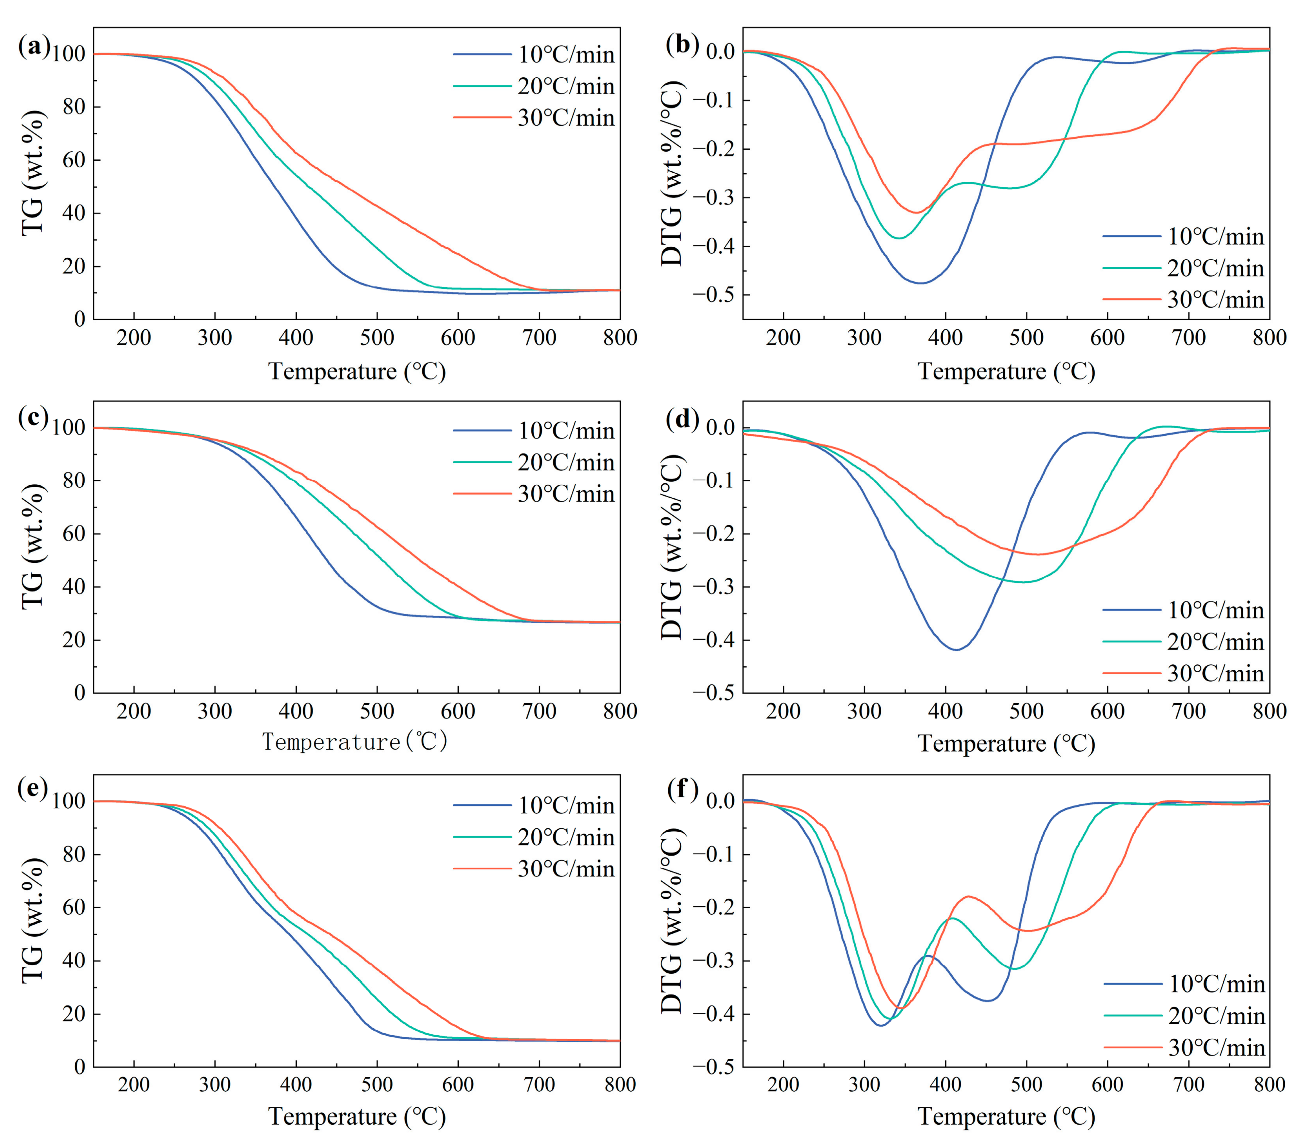
Figure 1 shows the thermogravimetry (TG) and differential thermogravimetry (DTG) curves of coal, walnut shell, and biochar at different heating rates. The degradation parameters of the three materials are presented in Table 2.
The combustion processes of coal, walnut shell, and biochar can all be divided into three stages (dehydration, devolatilization, and carbonization) [23], as shown in Figure 1. Typically, coal mainly consists of highly cross-linked aromatic hydrocarbons, internally bound by highly stable C-C bonds [24]. Similarly, if the coal contains more C-C bonds, it will generate fewer volatiles under the same experimental conditions, which can somewhat affect the ignition temperature. It can be seen from Figure 1a that for coal, the first stage of decomposition persisted from 150 °C to almost 258 °C with a mass loss of approximately 1.62%, which is mainly due to the evaporation of residual moisture and light volatiles inside the material. With the temperature increase, at the stage of 258–689 °C, the coal started to considerably decompose with a mass loss of almost 67.22%. It can be observed from Figure 1b that a DTG peak appeared at around 440 °C, mainly owing to the violent combustion of volatile components in the coal. The third stage proceeded from 689 °C to 800 °C. The TG curve gradually became smooth in this stage, and only a minor mass loss was observed, which was mainly due to the slow decomposition of the residual char [25].
Biomass mainly comprises hemicellulose, cellulose, and lignin, which are connected by R-O-R bonds with relatively weak stability [26]. For walnut shells, it can be seen from Figure 1c that the first stage of the decomposition process continued from 150 °C to 226 °C with a mass loss of approximately 1.54%, and the mass loss in this stage was mainly the result of dehydration and the precipitation of small amounts of adsorbed gases. The second stage is the primary decomposition process of walnut shells, which proceeded from 226 °C to almost 603 °C. However, it can be deduced from Figure 1d that there was a prominent DTG peak around 330 °C, probably due to the significant decomposition of hemicellulose accompanied by the decomposition of slight amounts of cellulose and lignin. As the reaction proceeded, a smaller DTG peak appeared around 450 °C. The peak temperature corresponding to this DTG peak is widely considered to be the temperature of the beginning of massive cellulose decomposition [27]. A significant mass loss of almost 89.87% was observed in the second stage. However, the decomposition of lignin occurred throughout the combustion process and showed no significant DTG peak in the DTG curve [28].
Biochar has a lower volatile content and higher fixed carbon content than walnut shells, as shown in Table 1. Compared to biomass, the combustion characteristics of biochar are relatively closer to coal. However, the ignition and burnout temperature of biochar are relatively lower than that of coal. It can be seen from Figure 1e that the primary degradation process of biochar started at almost 243 °C and ended at nearly 621 °C. The mass loss at this stage was approximately 80.05%, which delayed the degradation process of walnut shells. However, it can be seen from Figure 1f that only one distinct DTG peak appeared in the degradation process of biochar, which differs from the decomposition process of the walnut shell. This may be attributed to the delay of the decomposition of cellulose in biochar during the primary degradation process and the overlapping with the decomposition of hemicellulose.

3.2. Thermal Behavior of Binary Blends

This section describes the combustion behavior of binary blends at different heating rates. The TG and DTG curves of three binary blends at different heating rates are shown in Figure 2. The degradation parameters of the three materials are presented in Table 3.
It can be deduced from Figure 2a that the decomposition process of the blend of coal and walnut shell can be divided into three stages. The first stage proceeded from 150 °C to 221 °C, corresponding to the evaporation of water from the blend. The second stage moved from 221 °C to 625 °C, representing the primary decomposition process of the blend, with a mass loss of approximately 87.10%. Two apparent DTG peaks can be observed in Figure 2b. The first DTG peak appeared around 360 °C, corresponding to the massive decomposition of walnut shell, while the weak peak on the right side corresponded to the decomposition of coal. By comparing Figure 2a and Figure 1a,c, it can be deduced that the ignition temperature of the blend is similar to that of walnut shell but lower than that of coal, which indicates that the presence of walnut shell degraded the ignition temperature of coal, which may be due to the devolatilization process of coal and walnut shells that occurred in different temperature ranges by respective structural differences. When both materials are co-combusted, the relatively easy decomposition of the walnut shell creates a high concentration of volatile components around coal. The free radicals in the volatile component combine with the small molecules in the coal produced by the depolymerization of the macromolecule [29]. Thus, more volatile components can be released, which causes the barrier of coal degradation to decrease accordingly to some extent.
Figure 2c,d shows that the decomposition of the blend of coal and biochar can be divided into three stages. The first stage started at 150 °C and finished at almost 238 °C. The mass loss in this stage is approximately 1.33%, which is attributed to moisture removal. The second stage lasted from 238 °C to 645 °C, and the mass loss in this stage was approximately 71.28%. Only one relatively pronounced DTG peak was observed in this stage, which indicates that the main decomposition processes of coal and biochar overlapped. The blend of walnut shell and biochar decomposition also consisted of three stages, as shown in Figure 2e. The first stage of the decomposition process started at 150 °C and ended at 226 °C, corresponding to the removal of water in the blend. The second stage continued from 226 °C to 637 °C, and the mass loss in this stage was approximately 88.11%. Two clear DTG peaks can be observed in Figure 2f, similar to the DTG curve of the blend of walnut shell and coal. The first DTG peak corresponded to the decomposition of walnut shell, while the weak peak on the right corresponded to the decomposition of biochar. Finally, it can be deduced that the decomposition process of walnut shell was not synchronized with coal and biochar (Figure 2b,d,f), and the initially relatively low ignition temperature of the walnut shell was not significantly postponed by the addition of other materials.

3.3. Thermal Behavior of Ternary Blends

Figure 3a shows the combustion behavior of the coal, walnut shell, and biochar blends at different heating rates. The degradation process of the ternary blends can also be divided into three stages. The first stage proceeded from 150 °C to 238 °C, where light volatiles and moisture were decomposed. The second stage moved from 238 °C to 650 °C, and the mass loss in this stage was approximately 85.07%. It can be observed from Figure 3b that two DTG peaks appeared in this stage. The first DTG peak corresponded to a peak temperature of almost 350 °C, which matched the massive decomposition of the walnut shell. The second DTG peak corresponded to the enormous decomposition of coal and biochar. By comparing Figure 2b,f with Figure 3b, it can be deduced that the primary decomposition process of the blend became relatively complicated after the addition of walnut shells, which was verified by the appearance of two separated peaks in the corresponding DTG curves. This may be since the walnut shells still contained a high proportion of volatiles compared to coal and biochar, which shifts the primary combustion process toward the low temperature interval. Moreover, different components of the blends individually react due to differences in their physical properties. The ignition temperatures of the blends are similar to those of substances with a higher content of volatile compounds in the blends [30].

3.4. Influence of the Heating Rate on the Combustion Behaviors of the Samples

This section combines Figure 1, Figure 2 and Figure 3 to study the influence of the heating rate on the combustion behavior of the selected samples. It can be deduced from Figure 1, Figure 2 and Figure 3 that the degradation trend of the same material significantly differed with the increase of the heating rate. The TG-DTG curve shifted toward the high temperature regions; thus, the ignition, peak, and burnout temperature increased accordingly. This may be because when the heating rate increases, the heat transmission rate between the TGA and the sample reduces, and the surface temperature of the materials is higher than the internal temperature, which causes the samples that are not uniformly heated to keep reacting at a relatively high temperature [31]. Hence, when the heating rate is increased, the combustion process of the sample gradually shifts toward the high temperature range, and the intensity of the combustion reaction is increased. However, the lower heating rate facilitates the sample to be heated uniformly, which shifts the primary combustion process to a relatively low temperature interval [32,33].

3.5. Interactions between Materials

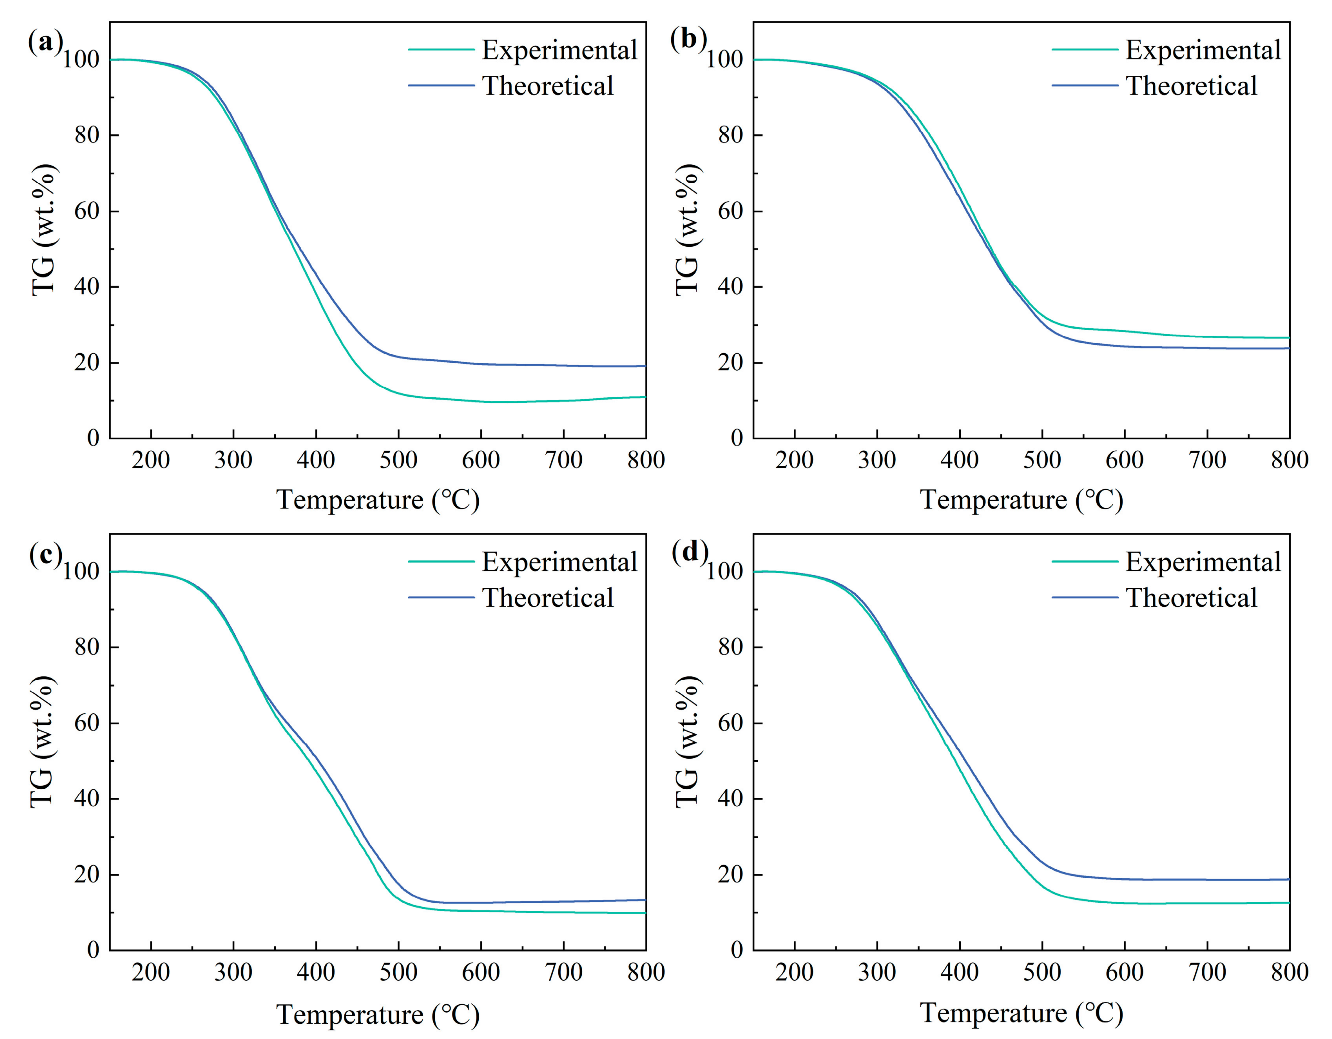
The investigation of the potential interactions between different materials is essential to obtain insight into the combustion process [34]. In this section, the corresponding theoretical TG curves are calculated using Equation (8) to study the interactions between binary and ternary blends. The theoretical TG curves are compared with the experimental TG curves to assess the interactions between materials.
It can be seen from Figure 4 that the theoretical and experimental TG curves of all the blends up to 325 °C almost overlapped (i.e., the mass loss is additive), which indicates that the interactions between different materials were virtually ignored when the temperature was low. As the temperature increased, the interactions between the materials tended to gradually expand. The trend stabilized when the degradation process proceeded to almost 500 °C and continued until the end of the reaction.
It can be observed from Figure 4a,c,d that the experimental TG curves of the blends were all lower than the corresponding theoretical TG curves after 325 °C if the blends had the addition of walnut shell, which indicates that the interactions between the materials were synergistic. The existence of walnut shell improved the combustion performance of the blends. This may be due to the volatile–volatile and volatile–char interaction [35]. Since the process of the devolatilization of walnut shells started before 325 °C, by its lower ignition temperature, many soft residues were generated, which adhere to the surface of coal or biochar particles and reduce the heating efficiency of coal or biochar to some extent. However, when the reaction temperature increased, the soft residue produced by the walnut shell at the beginning of the reaction started to flow and decompose since the gas expansion caused an increase in pressure inside the particles. The free radicals/hydrogen of the soft residue reacted with the free radicals/hydrogen in the coal or biochar, which promoted the combustion of the coal or biochar [36].
It can be seen from Figure 4b that, when biochar and coal were co-combusted, the experimental TG curve was higher than the theoretical TG curve during the whole degradation process, which indicates that the interaction between the materials sometimes also exerted a specific inhibitory effect on the thermal decomposition process. The content of volatile components in the material directly determined the ignition temperature. On the contrary, the higher content of fixed carbon in the material indicates that the material was more tolerant toward high temperatures and difficult to degrade [37]. It can be deduced from Table 1 that the volatile component of biochar was lower, and the fixed carbon content was promoted compared to the walnut shell. The reduction of volatile components resulted in the enlargement of the pores of biochar particles. When the biochar and coal are co-combusted, the coal particles may block the pore structure of the biochar and inhibit the contact between the biochar and the air, which shifts the whole co-combustion process toward the high temperature region and leaves more residues at the end of the degradation process [38].

3.6. Impact of the Third Material Addition on the Binary Blends

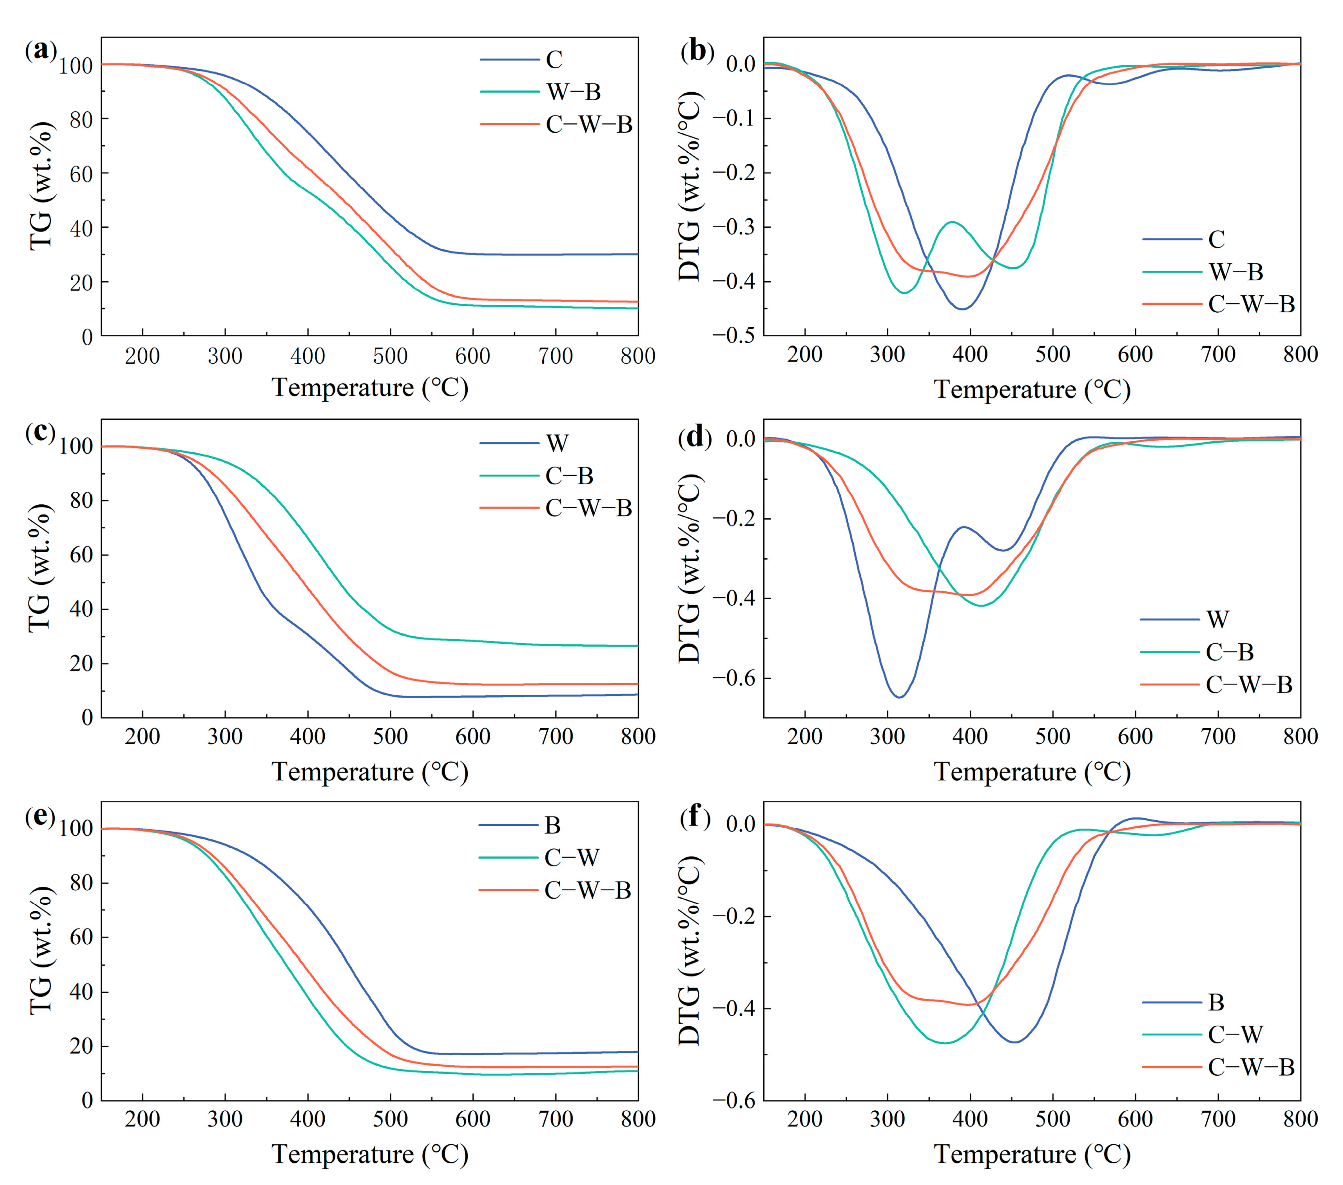
It can be concluded from the analysis presented in the previous section that the overall combustion performance is improved if the walnut shell exists in either the binary blend or the ternary blend. However, it is unclear whether the presence of biochar or coal inhibits the combustion performance of the ternary blend. This section describes the impact of the third material addition on the combustion behavior of binary blends at a heating rate of 10 °C/min. The obtained results are presented in Figure 5.
It can be seen from Figure 5a,b that, when coal was added to the binary blend consisting of walnut shell and biochar, the TG curve of the ternary blend was distributed between coal and the binary blend. However, the peak temperature of the ternary blend was closer to that of the coal. This demonstrated that the coal controlled the peak temperature of the ternary blend, shifted the DTG peak of the binary blend toward the high temperature region, and slowed down the degradation process. In addition, the mass loss of the ternary blend was lower than that of the binary blend but higher than that of the coal, which indicates that the presence of coal suppressed the overall combustion performance of the ternary blend. Figure 5c,d shows the influence of adding walnut shell on the combustion behavior of the binary blend consisting of coal and biochar. It can be deduced that the TG curve of the ternary blend was still distributed between the walnut shell and the binary blend, but it was different from that in Figure 5a. The mass loss of the ternary blend was higher than that of the binary blend due to the presence of walnut shells, which indicates that the overall combustion performance was improved, and it further confirmed the conclusion obtained in the previous section. The addition of walnut shell to the binary blend shifted the peak temperature of the ternary blend toward the low temperature region compared to the binary blend, as shown in Figure 5d. Therefore, the addition of walnut shells improved the combustion performance of the ternary blend. Figure 5e,f shows the influence of adding biochar on the combustion behavior of the binary blend consisting of coal and walnut shell. The TG curve of the ternary blend was distributed between the biochar and the binary blend at this time, similar to the curve in Figure 5a. However, the mass loss of the ternary blend was lower than that of the binary blend but higher than that of biochar. It can be seen from Figure 5f that the existence of biochar increased the peak temperature of the ternary blend. It shifted the primary degradation process to the high temperature region, which reduced the mass loss of the ternary blend to some extent. Hence, the presence of biochar also suppressed the overall combustion performance of the ternary blend.

3.7. Kinetic Analysis

The analysis of kinetics is essential in the combustion field, and the correct determination of kinetic parameters is crucial for the comprehension of the whole combustion process [39]. In this study, the activation energy was calculated using two kinetic models, KAS and FWO, to avoid potential errors by selecting the inappropriate reaction mechanism function. In the two kinetic models, the activation energy E is obtained by the slope of the linear fitting curves plotted by ln(β/T2) versus 1/T and ln(β) versus 1/T, respectively [40]. The activation energy was calculated using three heating rates: 10 °C/min, 20 °C/min, and 30 °C/min.
In addition, the degree of conversion α ranges between 0.1 and 0.9 with a step size of 0.1, thus obtaining enough data points to calculate the activation energy at each α to better characterize the combustion process of each sample [41]. The calculated activation energies and correlation coefficients R2 are shown in Table 4. It can be observed that the R2 values of all the fitted curves were greater than 0.98, which indicates that the fit results were good and they obtained activation energies with a certain accuracy. It can be observed from Table 4 that coal and walnut shell have the highest and lowest average activation energy, respectively. In addition, the average activation energy of the blend is between the corresponding samples compared to the single sample.
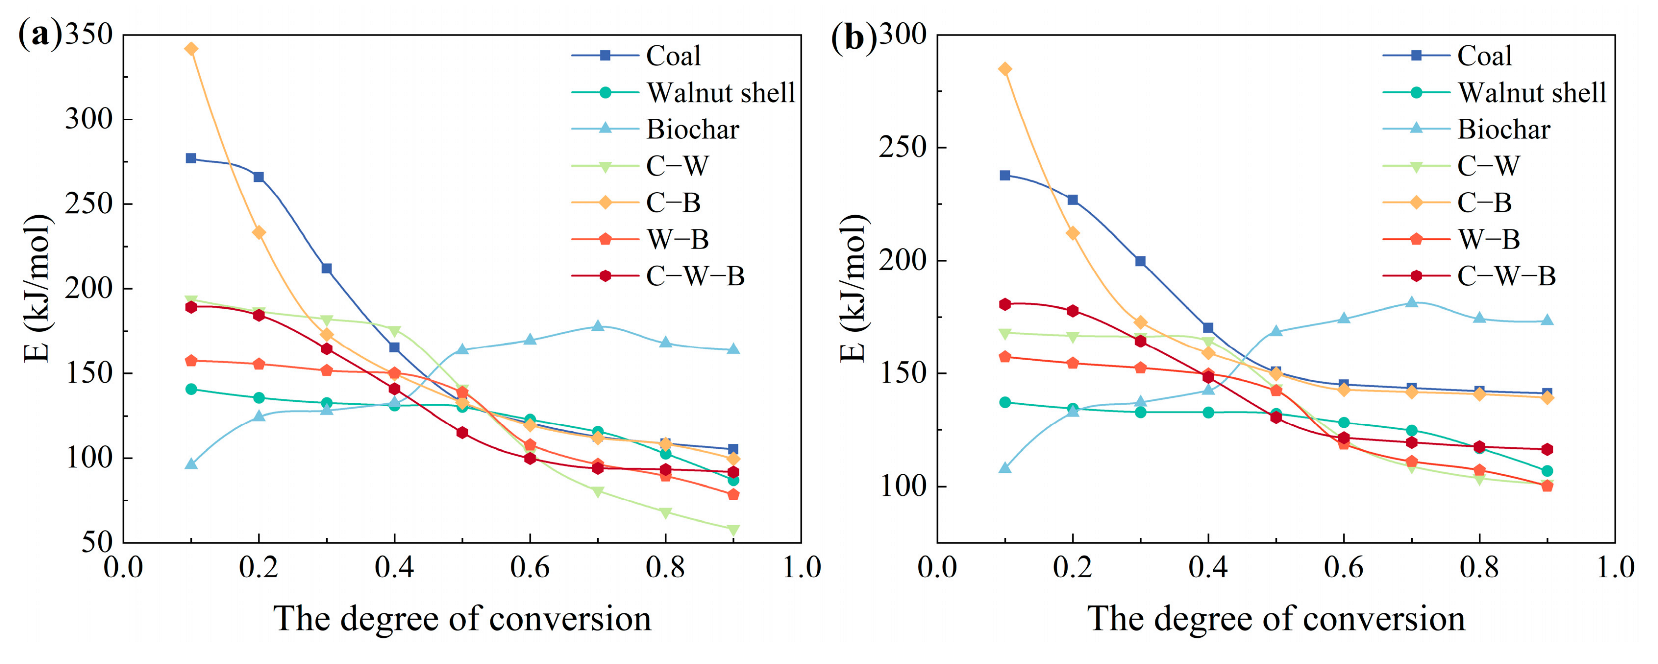
The tendency of the activation energy for all the samples at each α is shown in Figure 6. The values of the activation energy calculated using the KAS and FWO kinetic models were slightly different but shared the same variation trend. As α increased from 0.1 to 0.9, the change of activation energy for all the samples was not linear and had almost no noticeable trend, which was mainly attributed to the structural differences of individual materials and the interactions existing in the blends during co-combustion, further indicating the complexity of the co-combustion process.
The activation energy of biochar gradually increased with the increase of α, which differentiates it from walnut shells and coal. As α increased from 0.1 to 0.7, E of the biochar continued to increase from 95.93 kJ/mol to 177.54 kJ/mol (from 107.76 kJ/mol to 181.09 kJ/mol) and remained high after α became greater than 0.7. This may be because the biochar residue became increasingly difficult to degrade and consequently required more energy to activate the combustion process, demonstrating that fixed carbon combustion is the primary degradation process of biochar.
The activation energy of coal showed a gradual decrease with the increase of α. The combustion process is characterized by segmentation, and the average activation energy in the low temperature region (α ≤ 0.5) is higher than that in the high temperature region (α > 0.5): 210.68 kJ/mol and 197.03 kJ/mol (α ≤ 0.5), 111.70 kJ/mol and 143.03 kJ/mol (α > 0.5). This indicates that the initial temperature was insufficient to provide enough energy to break and decompose the side chains in the coal structure. The activation energy gradually decreased and was approximated to be constant with the temperature increase, indicating that an extensive thermal degradation of the macromolecular chains in the coal had occurred [42]. However, E of the walnut shell was maintained at a relatively low level at different α and showed a tendency to gradually decrease. This indicates that walnut shell is relatively easy to degrade and does not require high external energy.
E of the binary and ternary blends showed a gradual decrease with the increase of α (0.1 ≤ α ≤ 0.9), which is consistent with the conclusions reached in [43]. At higher α (α > 0.5), E of the blends started to become smaller than the single sample, indicating that there are interactions between different materials at high temperatures, which affects the combustion process. In addition, the decrease of activation energy in the low temperature region (α ≤ 0.5) was higher than that in the high temperature region (α > 0.5). This indicates that, when α = 0.5, the components of the blend have already lost most of the low molecular components and volatiles, and the subsequent combustion process mainly proceeds with the slow degradation of the more recalcitrant residues and char since they also have low reactivity [44].
Figure 7 compares the experimental and theoretical values of the average activation energies calculated using the KAS and FWO kinetic models for each blend. The theoretical values of the average activation energy were computed as [45]:
E T = x i E i
where xi is the proportion of the blend occupied by the single sample, and Ei is the average activation energy obtained by the kinetic model (Table 4).
It can be observed from Figure 7 that the values of the average activation energy under the two kinetic models were not significantly different, and the deviation was within 5%. Furthermore, the results obtained by the KAS method were all slightly lower than those obtained by the FWO method, which only depends on the structural differences of the kinetic models. The experimental values of the average activation energy were higher than the theoretical values when the biochar and coal were co-combusted, which indicates that the existence of the biochar hindered the degradation process of the coal. However, the experimental values of the blends containing walnut shells were all lower than the theoretical values, which demonstrates that the addition of walnut shells improved the combustion performance of the blends to some extent. It also confirms that a proper co-combustion induces synergistic effects between the materials.
Biochar has a lower volatile content and a higher fixed carbon content than biomass. Therefore, it is more similar to coal. That is, its combustion behavior is more identical to coal. Higher oxygen content in the material indicates that it tends to ignite more easily under the same reaction conditions [46]. On the contrary, walnut shell contains a higher oxygen content than biochar, indicating better thermal reactivity than biochar. Moreover, the reactive H radicals in biomass and inorganic substances in biomass ash can play a specific catalytic role in the co-combustion process, resulting in a higher mass loss of the blend [47,48]. This explains why the average activation energy of walnut shells with higher oxygen and volatile components content is lower than the theoretical value when blended with biochar and coal during co-combustion. Based on the above analysis, it can be concluded that the addition of walnut shells can promote the combustion performance of the blend. Furthermore, biochar and coal do not seem to have significant potential to compensate for their shortcomings.

4. Conclusions

In this paper, the thermodynamic and kinetic behaviors of walnut shells, biochar, and coal as well as their blends at three heating rates, were studied using thermogravimetric analysis. It was deduced that walnut shell is relatively easy to react due to its higher thermochemical reactivity and volatile content. In comparison, the combustion characteristics of biochar are closer to coal with less reactivity. Fixed carbon combustion is the primary degradation process for coal and biochar, while devolatilization and gas phase combustion are the main processes for walnut shell. The increase of the heating rate can lead to a decrease in the heat transfer efficiency, which delays the ignition temperature of the material and shifts the primary degradation process to a higher temperature interval. The presence of the walnut shell can lead to an increase in the thermochemical reactivity of the blend and shift the primary combustion process to a lower temperature interval. The kinetic results showed that the coal and walnut shells obtained the highest and lowest activation energies, respectively. The activation energies of the binary blends were all between the corresponding pure materials, and the activation energies of the ternary blends were higher than walnut shells but lower than biochar and coal. The interaction between only biochar and coal was inhibited and unsuitable for co-combustion. However, the presence of walnut shell in the ternary mixture compensates for the inhibition between biochar and coal.

Author Contributions

Conceptualization, Z.L.; methodology, Z.L.; software, R.W. and X.S.; validation, Z.L.; formal analysis, R.W. and X.S.; investigation, Z.L.; resources, Z.L.; data curation, R.W. and Z.L.; writing—original draft preparation, R.W.; writing—review and editing, R.W.; visualization, R.W. and X.S.; supervision, Z.L.; project administration, Z.L.; funding acquisition, S.L. All authors have read and agreed to the published version of the manuscript.

Funding

This work was funded by National Key Research and Development Program of China (No. 2019YFD1100602) and National Natural Science Foundation of China (No. 52176193).

Data Availability Statement

The data presented in this study are available in the article.

Conflicts of Interest

Authors declare no conflict of interest.

References

  1. Zhao, Z.-Y.; Cao, F.; Fan, M.-Y.; Zhang, W.-Q.; Zhai, X.-Y.; Wang, Q.; Zhang, Y.-L. Coal and Biomass Burning as Major Emissions of NOx in Northeast China: Implication from Dual Isotopes Analysis of Fine Nitrate Aerosols. Atmos. Environ. 2020, 242, 117762. [Google Scholar] [CrossRef]
  2. Munir, S.; Nimmo, W.; Gibbs, B.M. The Effect of Air Staged, Co-Combustion of Pulverised Coal and Biomass Blends on NOx Emissions and Combustion Efficiency. Fuel 2011, 90, 126–135. [Google Scholar] [CrossRef]
  3. Picciano, P.; Aguilar, F.X.; Burtraw, D.; Mirzaee, A. Environmental and Socio-Economic Implications of Woody Biomass Co-Firing at Coal-Fired Power Plants. Resour. Energy Econ. 2022, 68, 101296. [Google Scholar] [CrossRef]
  4. Toptas, A.; Yildirim, Y.; Duman, G.; Yanik, J. Combustion Behavior of Different Kinds of Torrefied Biomass and Their Blends with Lignite. Bioresour. Technol. 2015, 177, 328–336. [Google Scholar] [CrossRef] [PubMed]
  5. Gohar, H.; Khoja, A.H.; Ansari, A.A.; Naqvi, S.R.; Liaquat, R.; Hassan, M.; Hasni, K.; Qazi, U.Y.; Ali, I. Investigating the Characterisation, Kinetic Mechanism, and Thermodynamic Behaviour of Coal-Biomass Blends in Co-Pyrolysis Process. Process Saf. Environ. Prot. 2022, 163, 645–658. [Google Scholar] [CrossRef]
  6. Liu, Z.; Balasubramanian, R. A Comparison of Thermal Behaviors of Raw Biomass, Pyrolytic Biochar and Their Blends with Lignite. Bioresour. Technol. 2013, 146, 371–378. [Google Scholar] [CrossRef]
  7. Wei, X.; Huang, S.; Wu, Y.; Wu, S. Effects of Washing Pretreatment on Properties and Pyrolysis Biochars of Penicillin Mycelial Residues. Biomass Bioenergy 2022, 161, 106477. [Google Scholar] [CrossRef]
  8. Qi, S.; Wang, Z.; Costa, M.; He, Y.; Cen, K. Ignition and Combustion of Single Pulverized Biomass and Coal Particles in N2/O2 and CO2/O2 Environments. Fuel 2021, 283, 118956. [Google Scholar] [CrossRef]
  9. Zou, H.; Liu, C.; Evrendilek, F.; He, Y.; Liu, J. Evaluation of Reaction Mechanisms and Emissions of Oily Sludge and Coal Co-Combustions in O2/CO2 and O2/N2 Atmospheres. Renew. Energy 2021, 171, 1327–1343. [Google Scholar] [CrossRef]
  10. Riaza, J.; Gil, M.V.; Álvarez, L.; Pevida, C.; Pis, J.J.; Rubiera, F. Oxy-Fuel Combustion of Coal and Biomass Blends. Energy 2012, 41, 429–435. [Google Scholar] [CrossRef]
  11. Xiao, Z.; Wang, S.; Luo, M.; Cai, J. Combustion Characteristics and Synergistic Effects during Co-Combustion of Lignite and Lignocellulosic Components under Oxy-Fuel Condition. Fuel 2022, 310, 122399. [Google Scholar] [CrossRef]
  12. Gil, M.V.; Riaza, J.; Álvarez, L.; Pevida, C.; Pis, J.J.; Rubiera, F. Kinetic Models for the Oxy-Fuel Combustion of Coal and Coal/Biomass Blend Chars Obtained in N2 and CO2 Atmospheres. Energy 2012, 48, 510–518. [Google Scholar] [CrossRef] [Green Version]
  13. Rago, Y.P.; Collard, F.-X.; Görgens, J.F.; Surroop, D.; Mohee, R. Co-Combustion of Torrefied Biomass-Plastic Waste Blends with Coal through TGA: Influence of Synergistic Behaviour. Energy 2022, 239, 121859. [Google Scholar] [CrossRef]
  14. Wu, Z.; Wang, S.; Zhao, J.; Chen, L.; Meng, H. Synergistic Effect on Thermal Behavior during Co-Pyrolysis of Lignocellulosic Biomass Model Components Blend with Bituminous Coal. Bioresour. Technol. 2014, 169, 220–228. [Google Scholar] [CrossRef] [PubMed]
  15. Vuthaluru, H.B. Thermal Behaviour of Coal/Biomass Blends during Co-Pyrolysis. Fuel Process. Technol. 2004, 85, 141–155. [Google Scholar] [CrossRef] [Green Version]
  16. Ashraf, A.; Sattar, H.; Munir, S. A Comparative Performance Evaluation of Co-Combustion of Coal and Biomass in Drop Tube Furnace. J. Energy Inst. 2022, 100, 55–65. [Google Scholar] [CrossRef]
  17. Galina, N.R.; Romero Luna, C.M.; Arce, G.L.A.F.; Ávila, I. Comparative Study on Combustion and Oxy-Fuel Combustion Environments Using Mixtures of Coal with Sugarcane Bagasse and Biomass Sorghum Bagasse by the Thermogravimetric Analysis. J. Energy Inst. 2019, 92, 741–754. [Google Scholar] [CrossRef] [Green Version]
  18. Keivani, B.; Gungor, A. Techno-Economic Assessment of Coal and Torrefied Biomass Co-Combustion: A Case Study of Oxy-Combustion Carbon Capture Power Plants in Turkey. J. CO2 Util. 2022, 62, 102103. [Google Scholar] [CrossRef]
  19. Wang, Y.; Li, Y.; Wang, G.; Wu, Y.; Yang, H.; Jin, L.; Hu, S.; Hu, H. Effect of Fe Components in Red Mud on Catalytic Pyrolysis of Low Rank Coal. J. Energy Inst. 2022, 100, 1–9. [Google Scholar] [CrossRef]
  20. Hu, J.; Shao, J.; Yang, H.; Lin, G.; Chen, Y.; Wang, X.; Zhang, W.; Chen, H. Co-Gasification of Coal and Biomass: Synergy, Characterization and Reactivity of the Residual Char. Bioresour. Technol. 2017, 244, 1–7. [Google Scholar] [CrossRef]
  21. Tong, W.; Liu, Q.; Ran, G.; Liu, L.; Ren, S.; Chen, L.; Jiang, L. Experiment and Expectation: Co-Combustion Behavior of Anthracite and Biomass Char. Bioresour. Technol. 2019, 280, 412–420. [Google Scholar] [CrossRef] [PubMed]
  22. Tian, H.; Jiao, H.; Cai, J.; Wang, J.; Yang, Y.; Bridgwater, A.V. Co-Pyrolysis of Miscanthus Sacchariflorus and Coals: A Systematic Study on the Synergies in Thermal Decomposition, Kinetics and Vapour Phase Products. Fuel 2020, 262, 116603. [Google Scholar] [CrossRef]
  23. Tran, K.-Q.; Werle, S.; Trinh, T.T.; Magdziarz, A.; Sobek, S.; Pogrzeba, M. Fuel Characterization and Thermal Degradation Kinetics of Biomass from Phytoremediation Plants. Biomass Bioenergy 2020, 134, 105469. [Google Scholar] [CrossRef]
  24. Chansa, O.; Luo, Z.; Yu, C. Study of the Kinetic Behaviour of Biomass and Coal during Oxyfuel Co-Combustion. Chin. J. Chem. Eng. 2020, 28, 1796–1804. [Google Scholar] [CrossRef]
  25. Magdziarz, A.; Wilk, M. Thermogravimetric Study of Biomass, Sewage Sludge and Coal Combustion. Energy Convers. Manag. 2013, 75, 425–430. [Google Scholar] [CrossRef]
  26. Liang, W.; Jiang, C.; Wang, G.; Ning, X.; Zhang, J.; Guo, X.; Xu, R.; Wang, P.; Ye, L.; Li, J.; et al. Research on the Co-Combustion Characteristics and Kinetics of Agricultural Waste Hydrochar and Anthracite. Renew. Energy 2022, 194, 1119–1130. [Google Scholar] [CrossRef]
  27. Wani Likun, P.K.; Zhang, H. Insights into Pyrolysis of Torrefied-Biomass, Plastics/Tire and Blends: Thermochemical Behaviors, Kinetics and Evolved Gas Analyses. Biomass Bioenergy 2020, 143, 105852. [Google Scholar] [CrossRef]
  28. Zhu, H.; Lang, L.; Fang, G.; Na, D.; Yin, X.; Yu, X.; Wu, C.; Bridgwater, A.V. Thermogravimetric Characteristics and Kinetics of Herb Residues Catalyzed by Potassium Carbonate. J. Anal. Appl. Pyrolysis 2021, 156, 105170. [Google Scholar] [CrossRef]
  29. Feng, P.; Li, X.; Wang, J.; Li, J.; Wang, H.; He, L. The Mixtures of Bio-Oil Derived from Different Biomass and Coal/Char as Biofuels: Combustion Characteristics. Energy 2021, 224, 120132. [Google Scholar] [CrossRef]
  30. Muigai, H.H.; Choudhury, B.J.; Kalita, P.; Moholkar, V.S. Co–Pyrolysis of Biomass Blends: Characterization, Kinetic and Thermodynamic Analysis. Biomass Bioenergy 2020, 143, 105839. [Google Scholar] [CrossRef]
  31. Yuan, Y.; Zuo, H.; Wang, J.; Gao, Y.; Xue, Q.; Wang, J. Co-Combustion Behavior, Kinetic and Ash Melting Characteristics Analysis of Clean Coal and Biomass Pellet. Fuel 2022, 324, 124727. [Google Scholar] [CrossRef]
  32. Xinjie, L.; Singh, S.; Yang, H.; Wu, C.; Zhang, S. A Thermogravimetric Assessment of the Tri-Combustion Process for Coal, Biomass and Polyethylene. Fuel 2021, 287, 119355. [Google Scholar] [CrossRef]
  33. Jiang, L.; Zhou, Z.; Xiang, H.; Yang, Y.; Tian, H.; Wang, J. Characteristics and Synergistic Effects of Co-Pyrolysis of Microalgae with Polypropylene. Fuel 2022, 314, 122765. [Google Scholar] [CrossRef]
  34. Mundike, J.; Collard, F.-X.; Görgens, J.F. Co-Combustion Characteristics of Coal with Invasive Alien Plant Chars Prepared by Torrefaction or Slow Pyrolysis. Fuel 2018, 225, 62–70. [Google Scholar] [CrossRef]
  35. Hou, Y.; Feng, Z.; He, Y.; Gao, Q.; Ni, L.; Su, M.; Ren, H.; Liu, Z.; Hu, W. Co-Pyrolysis Characteristics and Synergistic Interaction of Bamboo Residues and Disposable Face Mask. Renew. Energy 2022, 194, 415–425. [Google Scholar] [CrossRef]
  36. Lv, P.; Bai, Y.; Wang, J.; Song, X.; Su, W.; Yu, G.; Ma, Y. Investigation into the Interaction of Biomass Waste with Industrial Solid Waste during Co-Pyrolysis and the Synergetic Effect of Its Char Gasification. Biomass Bioenergy 2022, 159, 106414. [Google Scholar] [CrossRef]
  37. Bi, H.; Wang, C.; Lin, Q.; Jiang, X.; Jiang, C.; Bao, L. Combustion Behavior, Kinetics, Gas Emission Characteristics and Artificial Neural Network Modeling of Coal Gangue and Biomass via TG-FTIR. Energy 2020, 213, 118790. [Google Scholar] [CrossRef]
  38. Ma, L.; Goldfarb, J.L.; Song, J.; Chang, C.; Ma, Q. Enhancing Cleaner Biomass-Coal Co-Combustion by Pretreatment of Wheat Straw via Washing versus Hydrothermal Carbonization. J. Clean. Prod. 2022, 366, 132991. [Google Scholar] [CrossRef]
  39. Riaza, J.; Ajmi, M.; Gibbins, J.; Chalmers, H. Ignition and Combustion of Single Particles of Coal and Biomass under O2/CO2 Atmospheres. Energy Procedia 2017, 114, 6067–6073. [Google Scholar] [CrossRef]
  40. Ma, L.; Yu, S.; Chen, X.; Fang, Q.; Yin, C.; Zhang, C.; Chen, G. Combustion Interactions in Oxy-Fuel Firing of Coal Blends: An Experimental and Numerical Study. J. Energy Inst. 2021, 94, 11–21. [Google Scholar] [CrossRef]
  41. Magalhaes, D.; Kazanc, F. Influence of Biomass Thermal Pre-Treatment on the Particulate Matter Formation during Pulverized Co-Combustion with Lignite Coal. Fuel 2022, 308, 122027. [Google Scholar] [CrossRef]
  42. Liu, Z.; Hu, W.; Jiang, Z.; Mi, B.; Fei, B. Investigating Combustion Behaviors of Bamboo, Torrefied Bamboo, Coal and Their Respective Blends by Thermogravimetric Analysis. Renew. Energy 2016, 87, 346–352. [Google Scholar] [CrossRef]
  43. Azizi, K.; Moshfegh Haghighi, A.; Keshavarz Moraveji, M.; Olazar, M.; Lopez, G. Co-Pyrolysis of Binary and Ternary Mixtures of Microalgae, Wood and Waste Tires through TGA. Renew. Energy 2019, 142, 264–271. [Google Scholar] [CrossRef]
  44. Boumanchar, I.; Chhiti, Y.; M’hamdi Alaoui, F.E.; Elkhouakhi, M.; Sahibed-dine, A.; Bentiss, F.; Jama, C.; Bensitel, M. Investigation of (Co)-Combustion Kinetics of Biomass, Coal and Municipal Solid Wastes. Waste Manag. 2019, 97, 10–18. [Google Scholar] [CrossRef] [PubMed]
  45. Zhong, S.; Zhang, B.; Liu, C.; Shujaa aldeen, A. Mechanism of Synergistic Effects and Kinetics Analysis in Catalytic Co-Pyrolysis of Water Hyacinth and HDPE. Energy Convers. Manag. 2021, 228, 113717. [Google Scholar] [CrossRef]
  46. Singh, S.; Patil, T.; Tekade, S.P.; Gawande, M.B.; Sawarkar, A.N. Studies on Individual Pyrolysis and Co-Pyrolysis of Corn Cob and Polyethylene: Thermal Degradation Behavior, Possible Synergism, Kinetics, and Thermodynamic Analysis. Sci. Total Environ. 2021, 783, 147004. [Google Scholar] [CrossRef]
  47. Buyukada, M. Uncertainty Estimation by Bayesian Approach in Thermochemical Conversion of Walnut Hull and Lignite Coal Blends. Bioresour. Technol. 2017, 232, 87–92. [Google Scholar] [CrossRef]
  48. Zhuang, X.; Song, Y.; Zhan, H.; Yin, X.; Wu, C. Synergistic Effects on the Co-Combustion of Medicinal Biowastes with Coals of Different Ranks. Renew. Energy 2019, 140, 380–389. [Google Scholar] [CrossRef]
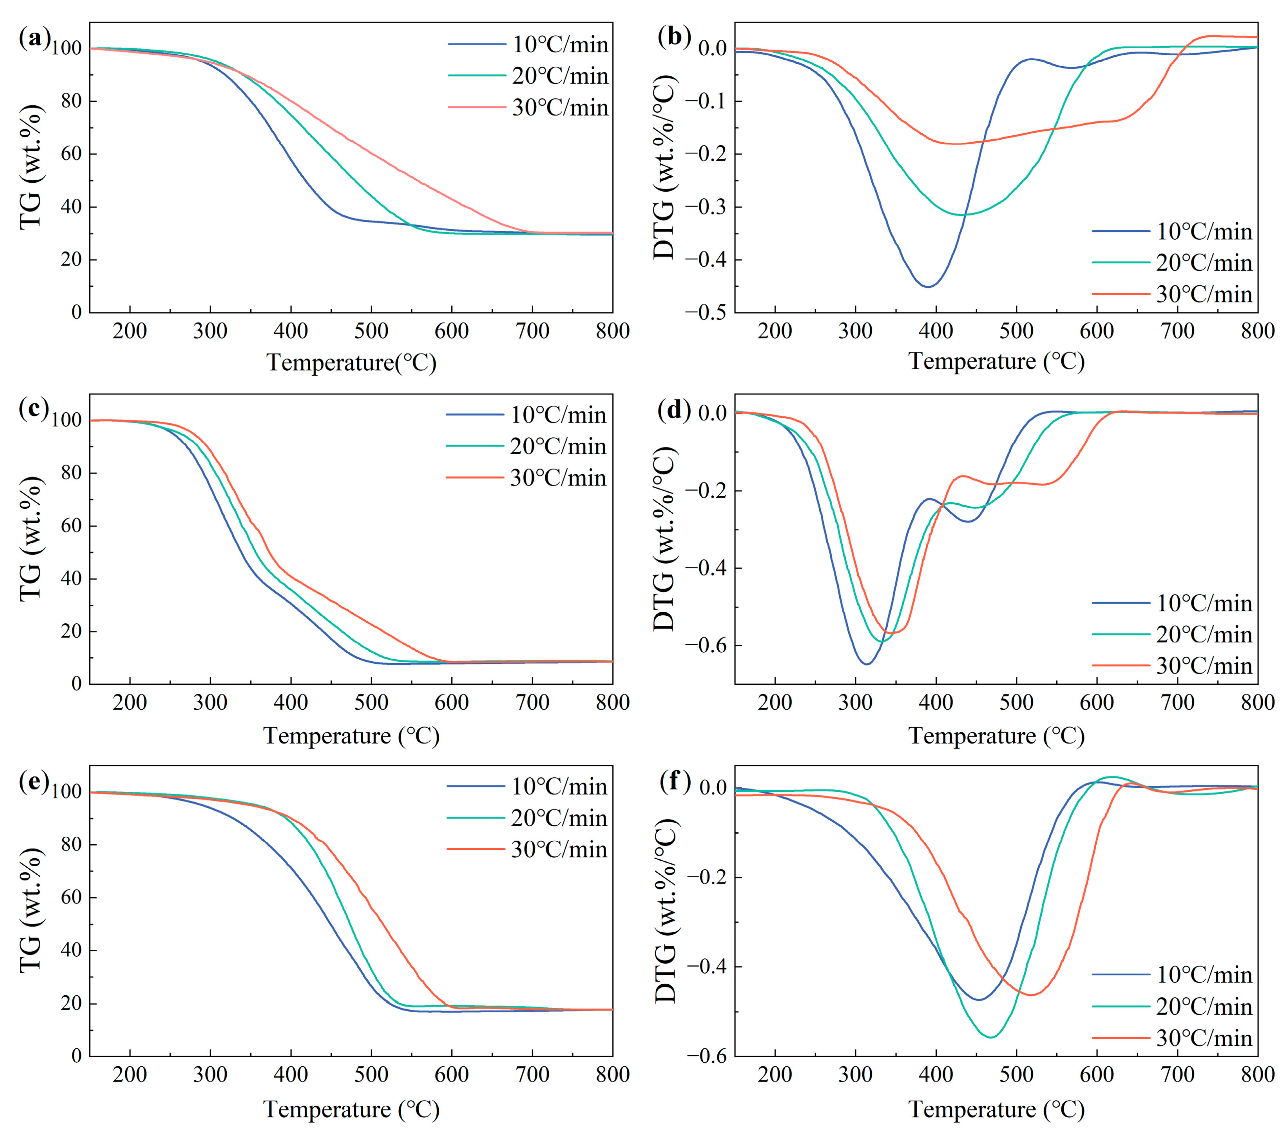
Figure 1. TG and DTG curves of (a,b) coal, (c,d) walnut shell, and (e,f) biochar at different heating rates of 10, 20, and 30 °C/min.
Processes 10 02264 g001
Figure 2. TG and DTG curves of (a,b) coal and walnut shell, (c,d) coal and biochar, and (e,f) walnut shell and biochar at different heating rates of 10, 20, and 30 °C/min.
Processes 10 02264 g002
Figure 3. (a) TG and (b) DTG curves of ternary blends at heating rates of 10, 20, and 30 °C/min.
Processes 10 02264 g003
Figure 4. Experimental and theoretical values of the weight loss of (a) coal and walnut shell, (b) coal and biochar, (c) walnut and biochar, and (d) coal, walnut shell, and biochar at a heating rate of 10 °C/min.
Processes 10 02264 g004
Figure 5. Impact of the third material addition on the binary blends at a heating rate of 10 °C/min: (a,b) coal as the third material; (c,d) walnut shell as the third material; (e,f) biochar as the third material.
Processes 10 02264 g005
Figure 6. Apparent activation energy of the samples tested under each conversion: (a) KAS; (b) FWO.
Processes 10 02264 g006
Figure 7. Comparison between the experimental and theoretical average activation energies of the tested blends: (a) KAS; (b) FWO.
Processes 10 02264 g007
Table 1. Ultimate and proximate analysis of samples.
CoalWalnut ShellBiochar
Ultimate analysis (wt.%)
C74.4449.8768.73
H4.686.535.92
O *19.4342.9724.18
N1.180.491.05
S0.270.140.12
Proximate analysis (wt.%)
Volatile matter29.4477.0546.85
Fixed carbon49.4818.6443.27
Moisture9.872.940.32
Ash11.211.379.56
* Calculated by Difference.
Table 2. The degradation parameters of the individual material.
StagesParametersCoalWalnut ShellBiochar
Stage 1Temperature range (°C)150–258150–226150-243
Weight loss (wt.%)1.621.541.49
Stage 2Temperature range (°C)258–689226–603243-621
Weight loss (wt.%)67.2289.8780.05
Stage 3Temperature range (°C)689–800603–800621-800
Weight loss (wt.%)0.780.140.51
Residual weight at 800 °C (wt.%)30.388.4517.95
Table 3. The degradation parameters of the binary blends.
StagesParametersC-WC-BW-B
Stage 1Temperature range (°C)150–221150–238150–226
Weight loss (wt.%)1.491.330.93
Stage 2Temperature range (°C)221–625238–645226–637
Weight loss (wt.%)87.1071.2888.11
Stage 3Temperature range (°C)625–800645–800637–800
Weight loss (wt.%)0.470.610.92
Residual weight at 800 °C (wt.%)10.9426.7810.04
Table 4. Combustion kinetic parameters at different conversion degrees determined using the KAS and FWO methods.
KASFWO KASFWO
αER2ER2 αER2ER2
(kJ/mol) (kJ/mol) (kJ/mol) (kJ/mol)
Coal0.1277.000.999237.750.998C-W0.1193.600.989168.120.993
0.2266.010.998226.800.9860.2186.600.981166.630.983
0.3211.890.999199.660.9990.3182.080.999166.230.987
0.4165.320.997170.170.9940.4175.660.987164.400.983
0.5133.190.985150.750.9960.5141.090.983143.480.984
0.6120.670.983145.110.9930.6103.300.989120.790.988
0.7112.540.992143.560.9990.781.000.997108.870.987
0.8108.530.987142.150.9980.868.160.991103.600.988
0.9105.080.998141.280.9870.958.200.987101.140.986
average 166.69 173.03 average 132.19 138.14
Walnut shell0.1140.850.999137.330.999C-B0.1341.610.999284.870.999
0.2135.730.990134.510.9930.2233.310.994212.210.999
0.3132.620.999132.950.9990.3173.090.999172.710.989
0.4131.120.989132.810.9930.4149.770.992159.020.983
0.5130.250.981132.220.9810.5132.890.998149.770.997
0.6122.890.991128.360.9890.6119.490.997142.830.995
0.7115.570.985124.640.9910.7111.860.998141.740.988
0.8102.640.997116.920.9940.8108.210.998140.820.989
0.987.090.993106.830.9930.999.560.992139.300.999
average 122.08 127.39 average 163.31 171.47
Biochar0.195.930.992107.760.995W-B0.1157.420.990157.310.990
0.2124.250.997132.730.9980.2155.410.983154.510.986
0.3128.030.997137.170.9980.3151.730.990152.390.988
0.4132.570.995142.420.9980.4150.100.984149.660.987
0.5163.590.983168.370.9850.5138.940.984142.430.981
0.6169.590.987174.090.9870.6107.790.988118.630.987
0.7177.540.989181.090.9940.796.320.985111.010.983
0.8167.860.987174.300.9880.889.420.990107.230.987
0.9163.920.988173.280.9890.978.610.982100.190.982
average 147.03 154.58 average 125.08 132.59
C-W-B0.1189.120.986180.650.989
0.2184.490.998177.730.998
0.3164.530.994164.390.996
0.4140.970.999148.370.999
0.5114.940.986130.590.998
0.699.910.991121.410.996
0.793.960.998119.350.991
0.893.300.991117.480.999
0.991.790.986116.340.997
average 130.33 141.81
Publisher’s Note: MDPI stays neutral with regard to jurisdictional claims in published maps and institutional affiliations.