Abstract
The conventional disposal of green straws through burning can be eliminated in a biorefinery that converts them into a range of sustainable commercial products. However, this leads to the generation of green straw biorefinery effluent (GSBE). Green straw biorefineries discharge wastewater into the ecosystem that contains high concentrations of COD and NH4+−N. It is one of the most notable sources of visual pollution and disruption of aquatic life as well as public health that requires treatment prior to discharge. To improve the GSBE quality for environmental sustainability, the attainment of sustainable development goals 6, 9, and 14, “clean water and sanitation”, “inorganic and organic waste utilization for added values from material”, and “life below water” is very important. Therefore, the effectiveness of the continuous mode activated sludge (CMAS) system and the biocomposite-based–continuous mode activated sludge (SB-CMAS) system in the treatment of GSBE was investigated in this study. Response surface methodology (RSM) was used to optimize the process variables. At their optimized conditions, the performances of CMAS and SB-CMAS were analyzed in terms of COD and NH4+−N. Findings showed 81.21% and 95.50% COD and 78.31% and 87.34% NH4+−N reduction in concentration for CMAS and SB-CMAS, respectively. The high COD and NH4+−N removal efficiencies indicate the better performance of CMAS and SB-CMAS. The first- and second-order models and the modified Stover–Kincannon biokinetic models were utilized to analyze substrate removal rates. It was discovered that the modified Stover models were ideal for the measured data with R2 values 0.99646 and 0.91236 attained for COD and NH4+−N, respectively, in CMAS. The SB-CMAS had 0.99932 and 0.99533 for COD and NH4+−N, respectively. Maximum contaminant elimination was attained at 60% GSBE and 2-day HRT. Thus, to achieve the UN SDGs for 2030, findings from this study have the potential to answer goals 6, 9, and 14.
1. Introduction
Globally, respiratory issues affect a large population of persons in adjacent towns and villages. The haze can sometimes totally obscure the sun. Every year, the country is blanketed by haze that lasts for months. These are mostly caused by the burning of rice straw by farmers. To avert these, an agro-waste pulp and paper packaging material company uses the rice straw as a raw material. These give rise to green straw biorefinery effluent (GSBE) production [1]. This reduces climate change impacts, as well as sustainable technologies, biotechnology, green technology strategies, and makes compostable packaging products from waste rice straw using the circular economy model. One of the largest freshwater consumers in the world, green straw biorefineries produce an enormous amount of wastewater [2].
Biorefinery categorization can be divided into four categories: namely, thermochemical/biotechnology biorefinery processes, products, and intermediates and raw materials. Significantly, the handling techniques can be divided into primary and secondary refining. The primary refining procedure requires biomass pretreatment and isolation of usable intermediates, whereas secondary refining encompasses chemical or biological conversion of intermediates to semifinished or completed products. To produce paper packaging materials, cellulose fiber materials from rice straw, rice husks, and papaya latex are isolated and removed by breaking down the complex cellulose into its simplest form. The pulp is then combined with latex taken from immature papaya skins, removed without harming the fruit, and lastly, molded into packaging products. When the protease serene enzymes in papaya latex are exposed to humidity, they quickly decompose into compost. The production process is in line with the USA Cleantech Open, USA Global Environmental Foundation (GEF) and inspired by United Nations (UNIDO) Global Cleantech Innovation Programmes. It is also environmentally friendly and gives rice farmers a new lease of life by converting their rice trash into riches and enabling them to potentially receive an additional 20% increase in annual revenue. This aids in increasing farmer income, reducing plastic waste in society, lowering CO2 emissions, and meeting SDG goals.
During the production stages of pulping, bleaching, and washing, untreated GSBE is frequently produced. This wastewater is classed as complex organic-rich effluent and is produced in enormous quantities. It may contain harmful chemicals [3]. The existence of bleaching chlorides, as well as organic and nutritional content, distinguishes GSBE. GSBE’s direct release has the potential to harm the environment. In the discharged GSBE, excess nutrients and biodegradable organics can reduce dissolved oxygen levels and promote the growth of slime and scum in neighboring waterbodies. To avoid this, it is typically necessary to construct advanced treatment systems in order to comply with environmental discharge laws [4]. Owing to the availability of complex residual organic matter in the treated effluents, green straw biorefineries are now dealing with a variety of problems while treating and reusing effluents. It is necessary to treat the leftover organic debris that contains possibly harmful chlorinated chemicals [5]. Therefore, adopting a sustainable GSBE treatment is highly significant for both economic and environmental sustainability. Several treatment techniques have previously been suggested as efficient strategies to remove phenolic chemicals from wastewater [6]. The issues that underlie physicochemical treatments are those that are connected to cost and reliability. The electrochemical treatment is effective in the elimination of recalcitrant contaminants. However, its adoption was limited due to its high energy consumption. Coagulation and precipitation result in a thick sludge that is extremely challenging to dewater. The pH must be readjusted to neutral before discharge since optimal therapy typically requires an extreme pH range [7]. Ozone and hydrogen peroxide-based oxidation are expensive, and chlorine-based oxidation results in the production of secondary contaminants including chlorinated organics. Pretreatment and a substantial capital expenditure are needed for the membrane procedures. Another issue with the membrane approach is membrane fouling. Biotechnological techniques have the potential to lessen the drawbacks of physicochemical techniques [3]. To that effect, researchers are continuously re-evaluating their efforts on maximizing the utilization of biomass waste as raw material for industrial wastewater treatment processes.
Biological treatment processes such as aerobic, anaerobic, and aerobic/anaerobic have several merits due to their eco-friendly approaches and economic benefits [8]. Organic matter degradation has a profound influence on NH4+− N removal in biological wastewater treatment systems. Biological nutrient elimination processes include: (i) microbe consumption during cell synthesis and energy transmission and (ii) biomass removal from the system. NH4+−N, organic nitrogen, nitrite, and nitrate are all forms of nitrogen found in wastewater. Organic nitrogen is degraded to NH4+−N, which is then digested by bacterial cells and oxidized to nitrite and nitrate [9,10]. With little to no aeration time in the cycle, NH4+−N concentration in biological wastewater treatment processes rises during the influent and return activated sludge flow. It is possible that this is due to insufficient hydraulic mixing in the bioreactor tank. As a result, using a bioreactor with a high DO concentration could result in total NH4+−N removal and nitrification.
Several aerobic methods have been used to investigate the performance of activated sludge systems treating GSBE [4]. In GSBE treatment, biochar has been used to improve the system’s overall performance. Due to the biochar’s suitable surface area, micropores, variable and high degree of surface chemistry, as well as the high organic matter removal, the biosorption process has gained attention recently [11]. The rough, porous medium surface of the biochar allows for the absorption of organic matter and serves as an ideal surface for the attachment and growth of active biomass [5]. However, commercial biochar is expensive [12]. Due to its shown effectiveness, affordability, and availability, wastewater specialists have assessed the efficacy of resins and biochar derived from waste biomass as a biosorption and bioremediation material [13]. As a waste biomass, alum sludge contains large amounts of the metal aluminum as well as several different types of oxides. It has phytotoxic characteristics. It contains a variety of organic and inorganic debris, suspended particles, humic substances, heavy metals, microbes, chemical substances, loam, and sand, among other impurities and pollutants. It is not contaminated and does not have any dangerous elements. However, before alum sludge can be recycled and used in other applications, it is crucial to understand its properties [14]. All water authorities across the world continue to face a difficult environmental and financial dilemma with the management of alum sludge [15]. Reusing alum sludge in the creation of pollutant removal agents is a conventional method of managing alum sludge (biosorbents). It is a very effective, reasonably priced biosorbent for removing a variety of contaminants from wastewater [16]. Following this, alum sludge’s economic value is increased, and a potential waste management strategy for it is created.
Alum sludge could be potentially converted to biochar [17]. A biomass residue called biochar is created when biomass thermally decomposes in the absence of oxygen. It is a solid that contains a lot of carbon and is simple to make at temperatures between 300 and 700 °C by pyrolyzing a variety of solid wastes from a variety of inexpensive sources. However, biochar’s fundamental drawback is that it has a negatively charged surface, which renders it less efficient, particularly in the biosorption of anionic pollutants. Various forms of modification have been found to increase the biosorption ability of biochar. This includes composite formation [18]. According to the literature, green-waste-derived biochar composites are promising biosorbents in the practical application of removing contaminants from industrial effluents. The derivative is now being investigated as a potential precursor for the creation of various biocomposites with applications to the treatment of water and wastewater. Mesocarp fibers (MF) are an abundant oil palm waste. Environmental pollution may result from improper management of this significant volume of waste. To remove contaminants from biorefinery effluents, biomass redirection in the creation of composite biosorbents with high biosorption capability would be of considerable benefit [19].
There are not many studies looking into the usage of activated sludge and biosorption techniques in tandem to remove organic matter and nutrients from GSBE utilizing ASMF-C. As a result, waste would be used as a biosorbent in this study’s treatment of GSBE in the combined system. RSM would be used to optimize the performance of the CMAS and SB-CMAS bioreactor systems based on a central composite design (CCD). The operating parameters for optimization would be efficient factors such as GSBE concentration and HRT. Therefore, the goal of this work was to develop a sustainable method of recycling mesocarp fiber with dewatered alum sludge. The study prepared an alum sludge-based biochar-mesocarp fiber biocomposite (ASMF-C) for contaminant biosorption. ASMF-C would be synthesized and characterized alongside GSBE. The study also determined if the application of ASMF-C in SB-CMAS would yield higher removal efficiencies than in the CMAS bioreactor system. The biosorption performance for the focused contaminants (COD and NH4+−N) removal from GSBE was studied, as well as the biosorption biokinetics. As far as we are aware, this is the first report on the use of the activated sludge and biosorption processes in combination for the treatment of GSBE employing ASMF-C.
2. Materials and Methods
2.1. Materials
Alum sludge cake (moisture content 64–71%) was collected from the sludge dewatering unit of a water treatment plant in Kampung Senin, Perak, Malaysia. The sample was collected after centrifugation from the water treatment plant. The sludge was stored in a well-covered environment to prevent the effect of the air-drying process on the moisture content of the sludge, which resulted in the anaerobic condition of the sludge during the ageing phase [20]. The MF was obtained from an indigenous oil palm waste processing company in Perak, Malaysia [21]. The GSBE that was used originated in Kedah, Malaysia.
2.2. Bioreactor Experimental Set-Up
The experiment entailed running two parallel, 10 L aerobic GSBE-fed laboratory-scale continuous mode activated sludge bioreactors. The designed bioreactor was constructed with an acrylic glass of 5 mm thickness and a sizable proportion of tube diffusers to always ensure a DO of 2.0 mg/L [22]. The bioreactors were attached to the influent tank with a capacity of 20 L. While the SB-CMAS bioreactor received an addition of SB to study its impact on the treatment of the GSBE, the CMAS bioreactor operated without ASMF-C. Using a peristaltic pump, influent GSBE was constantly fed into the bioreactors [4]. To maintain consistency of feed characteristics, the feed container was set above a magnetic stirrer. To change the required flow rates to the reactors, peristaltic pumps were used. A fan kept the bioreactors’ temperature at 25 °C [23]. To avoid algal growth that could alter the experimental findings, the inner part of the bioreactors was cleaned by a brush at least once a week. The pH of the influent GSBE was maintained in the neutral range.
2.3. Activated Sludge Characteristics and Acclimatization Process
The CMAS and SB-CMAS bioreactors were inoculated with activated sludge (AS). The characteristics of the AS were pH 7.89–8.02, settleability 275.1, MLSS 1550–2080, MLVSS 800–1210 (mg/L), and SVI 98.3–102.5 mL/g. As a feedstock for the maturation of the bioreactor, a mixture of the STP initial raw sludge at 90% and raw GSBE at 10% was aerated for 24 h, and 0.5 L of the supernatant was withdrawn and replaced with 0.5 L of GSBE to acclimate the AS to its full strength. After that, the treatment was resumed every day with a 0.5 L supernatant withdrawal until the AS had adjusted after 10 to 14 days. In subsequent experiments, the acclimated AS was utilized as seed in the reactors, and GSBE was fed in increments in accordance with the experimental design. pH, COD, and NH4+−N removal were all observed.
2.4. Alum Sludge-Mesocarp Fiber Biocomposite (ASMF-C) Preparation
Biochar was made using the dried and sieved dewatered alum sludge. The dewatered alum sludge was placed in an oven and heated at 105 °C for 24 h to eliminate any remaining water before pyrolysis. This was performed after collection and natural drying in the sun. The sludge was subsequently put inside a fixed bed reactor made of a quartz tube. The reaction zone height was 680 mm, and the reactor inner diameter was 27 mm. The distributor plate had a porosity of 3 (16–40 µm) and was 320 mm above the reactor’s bottom. An amount of 200 g of the alum sludge was put in a ceramic cup and heated in an electrical tube furnace prior to the pyrolysis. In the furnace, pyrolysis was carried out for two hours at a temperature increase rate of 17 °C/min [24]. The biochar samples were then cooled until they reached a consistent weight while being kept at room temperature. For improved biosorption performance efficiency, they were later washed with deionized water, and dried at 70 °C [25]. Aqueous acetic acid solution (V/V) containing 2 percent acetic acid was added to a 50 mL round bottom flask along with 1.05 g of MF and the mixture was magnetically agitated for 30 min at 60 °C. After 30 min of vigorous stirring, 0.45 g of the produced biochar was added to the mixture. The next stage involved adding 20 mL of NaOH solution dropwise to the acetic acid solution, MF, and charcoal. The liquid was placed into a stainless-steel autoclave after 2 h of stirring (100 mL). The autoclave was subsequently sealed, maintained at 140 °C for 10 h, and then allowed to cool naturally [26]. Finally, the ASMF-C was collected, washed with deionized H2O, filtered, and dried at 70 °C. Figure 1a–e depicts oven-dried alum sludge, calcinated alum sludge, mesocarp fiber, produced alum sludge-based biochar, and influent GSBE.
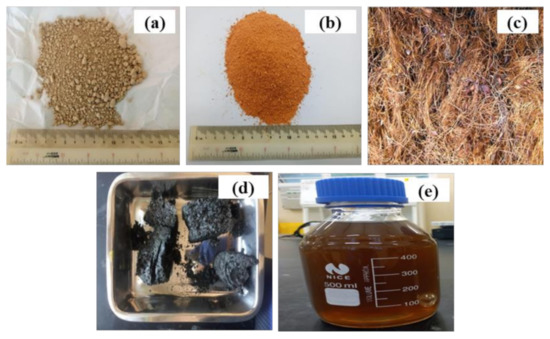
Figure 1.
Pictorial view of (a) oven-dried alum sludge, (b) calcinated alum sludge, (c) mesocarp fiber, a (d) Alum sludge-based biochar, and (e) influent GSBE.
2.5. ASMF-C Characterizations
Characterization of the ASMF-C was conducted. The specific surface area as a vital factor for the biosorbent structure was determined. Micrometric ASAP 2020 then used the N2 adsorption-desorption isotherm to assess the results. By employing the Zeiss super 55 VP instrument for field emission scanning electron microscopy (FESEM), the biochar made composite surface was examined. The samples were coated with 200 AO Gold-Palladium before examination. The biocomposite samples were scanned from 400 to 4000 cm−1, at 100 cycles and 4 cm−1 resolutions, to record the spectrum and determine the material’s functional group as well as investigate the particles’ absorption and transmission, producing a molecular impression. A Varian 3100 FTIR and a Varian 600 UMA FTIR were used to evaluate the materials. Using the KBr pellet technique, PerkinElmer’s Fourier-transform infrared spectroscopy (FTIR) was utilized. The chemical structure of the ASMF-C and the changes in essential functional groups during the biochar manufacturing process were studied based on the obtained FTIR spectra of the structure.
2.6. Analytical Methods
The GSBE sample was placed in the COD digestion reagent vials, and the DRB200 Reactor was used to digest it. This complies with the HACH 8000 technique. The ammonia-nitrogen concentrations in the influent and effluent GSBE were measured using the USEPA Nessler Method (Method 8038). For the GSBE samples, the absorbance of COD and ammonia was measured using the HACH DR3900 spectrophotometer. The pH of the GSBE’s original solution was adjusted using sodium hydroxide and sulfuric acid solutions [27]. Every measurement was performed three times, with the average results being presented. Equation (1) was used to determine the pollutants removal efficiencies. For data analysis, Origin software was employed [28].
2.7. Process Optimization by RSM
A group of mathematical methods known as “response surface methodology” (RSM) explain how numerous independent variables relate to one or more responses. It is used to model and analyze a problem using experimentally derived quantitative data to derive model equations using regression. The responses to changes in the process parameters are optimized by this technique. It has long been a popular method for creating experiments [29]. The RSM approach is based on the fitting of mathematical models to the experimental data produced by the planned experiment and the statistical validation of the model. The design of experiments (DOE) is a key tool in engineering that is frequently used for optimization, predictions, or interpretation that ultimately improves process performance, reduces the number of variables in the process by accounting for only the most important factors, and reduces operation costs and experimental time [30].
Due to the complicated behavior of activated sludge and wastewater composition under a variety of loading scenarios and environmental variables, predicting the performance of a bioreactor is challenging. To predict the individual and interactive influences of various inputs on the responses (output) in a smaller number of experimental iterations, which can be used for the design of experiments, modelling, and to forecast the ideal performance parameters, a clear and accurate mathematical link between input and output data must be established. RSM has been used to model the characteristics and behavior of the bioreactor using a range of prediction methodologies and to understand the association between the input and output variables because of its accuracy, precision, and capacity to learn and adapt. With a limited number of tests, RSM is a powerful numerical parameter tool for examining the mathematical relationship between independent and dependent responses. This strategy is helpful when multiple independent variables have an impact on one or more responses.
For biosorption optimization, a variety of design techniques have been used, with the central composite design being the most prevalent (CCD). For creating second and third order models for the response variables, it is helpful. The CCD produces the same amount of data as the 3n complete factorial design, but it necessitates fewer experimental trials than the FFD. High-quality predictions of the effects of parameter interactions, both linear and quadratic, are provided by the CCD. Center points, which correspond to the middle level of the factors, and axial points, which rely on the specific features sought for the design and the number of parameters associated, are the two levels at which the entire factorial or fractional factorial design is contained in the CCD [31,32,33,34].
The RSM employed in this investigation was a CCD with two independent variables: GSBE concentration and HRT. Using Design Expert (version 11), the design matrix was examined [35], and optimization was carried out to increase the elimination of COD and NH4+−N. The effects of the two independent variables (GSBE concentration and HRT) on the removal of COD and ammonia were examined in the current work using a typical CCD with two variables. A total of 2 k factorial points, 2 k axial points, and a center point made up the design, where z is the number of variables. Two dependent parameters, namely, COD and NH4+−N removal were evaluated as responses to achieve the ideal GSBE concentration and HRT.
Eleven tests in total were carried out for the study. To fit the second-order polynomial models and establish an experimental error for this investigation, three replicates were used at the center locations. Three levels were used to code each operating parameter: low (−1), central (0), and high (+1). The mathematical relationship between biosorption (percent) and other variables, such as COD and ammonia, was found and approximately represented by the quadratic model equation. Table 1 gives the CCD for the variable at the selected level and range. The variables were GSBE concentration (20, 60, and 100%) and HRT (1, 2, and 3 d). HRT was chosen as an independent variable.

Table 1.
Design matrix for COD and NH4+−N removal.
Following the experimentation, Equations (2) and (3) were used to compute the polynomial model’s coefficients,
where the linear and quadratic coefficients, respectively, are x and y. The input variables are kx, and ky, while is the random error, and the factors m and z represent the projected response and the number of factors analyzed, respectively. The regression coefficients for the intercept, linear, quadratic, and interaction terms are 0, x (x = 1, 2, …, z), y, (x = 1, 2, …, k), and λxy (x = 1, 2, …, z; y = 1, 2, …, z), respectively.
Using a 95 percent confidence threshold, the p-value was used to choose or reject model terms [27]. The regression coefficient λ, the number of factors evaluated and optimized during the experiment, and the random error (,) are the three quadratic coefficients. The experiments were conducted using the optimization design, and the outcomes were further examined [31]. Based on the impact of the two elements’ respective levels, three-dimensional plots and their corresponding contour plots were produced. The primary parameters in the overlay plot were used to determine the best region. The coefficient of determination (R2) of the quadratic model demonstrated its degree of fit, and the F-test was utilized [32].
2.8. Biokinetic Study
The biosorption kinetics model is defined by the rate of solute extraction that controls the adsorbents retention time at the solid–liquid interface. It is critical to recognize the kind of mechanism at work inside a given biosorption system. It is used for the optimization and prediction of reactor performance [5]. Additionally, knowledge on contaminant absorption kinetics is required to determine the best situation for comprehensive contaminant removal operations. Several kinetic models have been used by scientists. This study established the limiting phases in the biosorption process and estimated the biosorbent uptake rate using the following models:
2.8.1. First-Order Kinetic Model
If first-order kinetics prevails in well-agitated systems, the rate of change in substrate concentration in a full mixed system could be described as follows:
At steady state circumstances, the rate of substrate change (ds/dp) within the bioreactor is negligible; hence, Equation (4) can be condensed to produce Equation (5):
Plotting Meff versus [(Min − Meff)/δ] in Equation (5), which is created by rearranging Equation (2), will yield the value of Equation (4). The slope of the line can be used to determine the value of Cs.
The starting and effluent substrate contaminant concentrations are Min and Meff, the hydraulic retention time is , the bioreactor capacity is , the influent flow rate is l/q, and Cs is the first-order substrate removal rate constant (1/d). When the substrate concentration is significantly lower than half the saturation constant, it is anticipated that the inaccuracy in this model will be modest.
2.8.2. Grau Second-Order Kinetic Model
It is a more extensive version of the Monod model. This approach, which works with multicomponent mixtures, is based on the linear removal principle. Equation (6) is used to define the general equation of the Grau second-order kinetic model
Through the integration of Equation (6) and, subsequently, linearizing it, Equation (7) can be obtained:
where C2 = second-order contaminant removal rate constant, (1/d).
From the left-hand side, ()/ is expressed as the contaminant removal efficiency and is epitomized as .
Nevertheless, if the second factor in the right portion of Equation (7) is considered an allowed constant, then Equation (8) happens:
The slope and intercept will be produced by plotting versus , where u is a constant value and equal to and b is a dimensionless constant in the model that is close to one and reflects the impossibility of attaining a zero value of substrate concentration.
2.8.3. Modified Stover–Kincannon Model
Regardless of the sequence of reaction kinetics and under any loading scenario, the modified Stover–Kincannon model is utilized to calculate the substrate removal rate at the steady-state condition. The effluent substrate concentration for a given volume or the volume needed to achieve the specified effluent substrate concentration might both be determined using the model. One can sum up the modified Stover–Kincannon model as follows:
Through the integration of Equation (9) and, subsequently, linearizing it, Equation (10) can be obtained as follows:
Equation (10) will be linearized to produce Equation (8):
By plotting versus , slope and intercept will be equal to and , respectively, where Umx and Cv are max. contaminant removal rate and saturation value constant (g/L d), respectively.
3. Results and Discussion
3.1. GSBE Characteristics
Effluent for the present investigation was collected from a green straw-based pulp and paper mill located in Kedah, Malaysia. Samples were collected periodically from an existing aeration pond at the mill by grab sampling technique. Immediately after effluent collection, it was brought to environmental research laboratory (ERL) in the institute of sustainable building, UTP, for preservation and further analysis. The samples were filtered through a 0.5 mm sieve to remove suspended particles and stored at 4 °C. The GSBE samples were analyzed for wastewater parameters with results highlighted in Table 2.
Table 2.
GSBE characteristics and standard discharge limits.
To further raise the caliber of the released wastewater, this study offers useful data on the pollutant load of GSBE. The processing is to blame for the extraordinarily high COD in this study. Tannins have been found in wastewater from industrial debarking and digestion procedures, and they make up 50% of the COD in the effluent [33]. Furthermore, the elevated COD levels seen could be the result of their gradual breakdown and accumulation. Even if some chemicals break down, they still could have high COD levels and cause dangerous effects. In digester house liquors, there are lots of chemicals, lignin, leftover fibers, and other impurities. As a result, the COD and BOD values in these discharges are high. The high BOD concentration in the wastewater indicates that there is less oxygen available for aquatic life, which increases the toxicity of the effluent [34]. The presence of salts and ions may be the cause of the wastewater’s high EC value. The properties of GSBE contaminants revealed a high pH. The elevated pH may be caused by sodium hydroxide and sodium sulphide residues left over from the pulping process [35]. The samples’ bleaching and the mill’s black liquor could both have contributed to the elevated pH. A diverse mixture of organic and inorganic chemicals was found in the GSBE as recalcitrant contaminants even after secondary pond treatment.
3.2. FTIR
To identify the functional groups and bonds that were present in the ASMF-C, FTIR analysis was used. The functional groups and linkages either originated from the mesocarp fiber or the alum sludge biochar or were produced during pyrolysis.
The ASMF- C many bends were scanned by FTIR at various wavenumbers and intensities. The composite biosorbents’ FTIR spectra at various raised temperatures are shown in Figure 2. The bands’ heights are 3696.16, 3620.62, 3434.05, 1645.37, 1432.64, 1032.21, 1009.63, 913.95, 695.75, 539.92, and 469.70 cm−1. Their groups generated several noncovalent forces between the adsorbate and the adsorbent, such as hydrogen bonds, which assisted in effectively removing the pollutant from the effluent [36]. The formation of O2 and the elimination of COD were both aided by the presence of oxygen functional groups, specifically C=O/C-O. The presence of free and intermolecularly attached O-H and NH groups, as well as the stretching vibrations of the OH group (hydroxyl) and adsorbed water molecules on the precursor surface, serve as its defining characteristics. With an increase in activation temperature, peak intensity gradually fell. This has an impact on the typical absorption peaks. Higher activation temperatures led to the disappearance of the absorption bands, particularly those around 3420–1640 cm−1 [37].
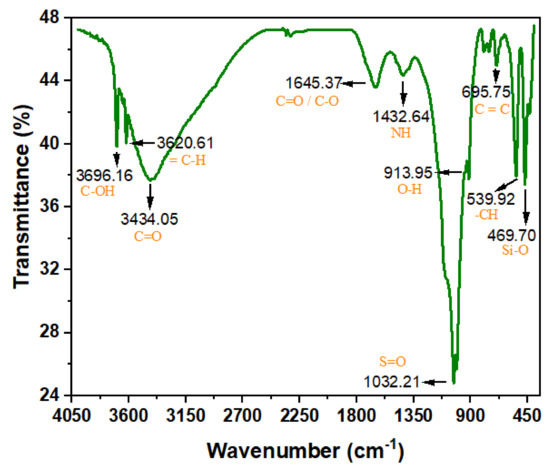
Figure 2.
FTIR spectra of ASMF-C.
At 1432.64 cm−1, the water-related absorption peaks associated with the bending vibration of the OH and NH groups of the hydrated reaction products can be seen. This is a sign of carboxylic anhydrides or deformation of the carboxylic group. After samples were exposed to higher temperatures, this peak underwent a critical sign of composite bingeing: a shift to the right and a slight rise [38]. This shift shows that the dihydroxylation process resulted in an increase in the amount of Si-O-T bonds, which are composed of a succession of peaks that partially overlap one another. Al atoms were introduced into the composite’s network during the pyrolysis procedure, increasing the proportion of oxygen atoms that are not bridged.
3.3. Oxide Composition, Physical Properties, and Elemental Analysis of ASMF-C
The oxide components of ASMF-C and the results are shown in Table S1. The table provides information on the chemical makeup of ASMF-C. Al2O3, SO3, SiO2, CaO, Fe2O3, and MgO were added together to make up 63.75% of the composite. MnO, P2O5, K2O, and Cl, in that order, made up 0.73%, 0.89%, 0.56%, and 0.97% of the ASMF-C. Al2O3 is the element in ASMF-C with the highest abundance, as can be seen. Its high content (37.51%) may be connected to the alum sludge’s aluminum content. SiO2, produced because of the carbonization of the material in MF, came next. ASMF-C’s properties are like other biosorbents made from biomass materials and utilized for biosorption in biological treatment systems. The measured elemental composition of the ASMF-C is depicted in Table 3.
Table 3.
Elemental analysis of ASMF-C.
Table S2 highlights the surface area, radius, pH, pore volume, and size. The ASMF-C was found to have enough BET surface area, total pore volume, average pore radius, and average pore size of 110 m2/g, 0.387 cm3/g, 73.56 (Å), 1.871 nm. This might be connected to structural restructuring brought on by carbonation.
3.4. FESEM
In Figure 3, one can see micrographs of the ASMF- C surface morphology after pyrolysis (a and b). It was evident from micrographs that the particles that were crushed and scattered randomly had more pores than the other types of particles. After pyrolysis, the composite’s microstructure revealed a breakdown matrix with increased porosity. These slits could significantly reduce ion diffusion resistances, enhance ion transport kinetics, and lessen the ion-sieving impact during the electrochemical reaction. The successful construction of interconnected porous graphitized carbon nanoflake structures can be attributed to the interaction between the precursor’s composition and structure and the in situ carbonization-activation process [39]. The ASMF-C microstructure qualities were improved using mesocarp fiber in the composite. Its rule as an active site caused the development of excessive products, and through reaction and product formation, it created a variety of products that were visible in micrographs. For the amorphous structure of the ASMF-C sample, it shows unreacted mesocarp fiber particles, reaction products, voids, and cracks. A small quantity of hydration with microcrystalline and fibrous structure were detected. Little hexagonal crystals of CH were employed to disperse all generated hydration products. In addition, numerous unreacted grains, minor amounts of calcite, and hexagonal plates that were scattered with the matrix could all be clearly identified. This result is consistent with findings from several sludge biochar composites that have been discovered in the literature [40].
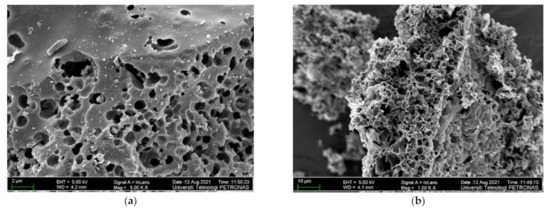
Figure 3.
FESEM images at @ (a) 2 µm and (b) 10 µm for ASMF-C.
3.5. Impact of GSBE Concentration and HRT on COD and NH4+−N Removal
3.5.1. COD Removal
All sample ports’ time course profiles for COD concentration are shown. According to Figure 4, there were oscillations in the effluent COD concentrations from both bioreactors at the start of the investigation until steady--state conditions were reached. However, biodegradation of organic matter was seen in all the bioreactors. This was anticipated since the biomass may have adapted to the incoming GSBE. On day 20, the biosorbent (biochar) was added to the aeration tank of the SB-CMAS bioreactor. All the reactors were monitored continuously until the SB-CMAS bioreactor became acclimatized to the added biochar. The substrates and microbes in the bioreactor attached to the biochar, as seen under a microscope. By offering many places for reactions between the substrates and the microorganisms, the additional biochar may have increased the likelihood that the substrates and the bacteria would come into contact. This could have facilitated the substrate degradation by bacteria. The breakdown of substrates by microorganisms took place in a suspended state prior to the addition of biochar to the base solution. It indicates that the likelihood of bacteria and substrates coming into contact or interacting determined how quickly the substrate would degrade. As reaction sites between microbes and substrates, biochar additions can raise these possibilities. The biochar has substrates and microorganisms linked to it, making it simple for microbes to break down the substrate. This demonstrates that the biochar has assisted in the bacteria’s biodegradation of organic materials.
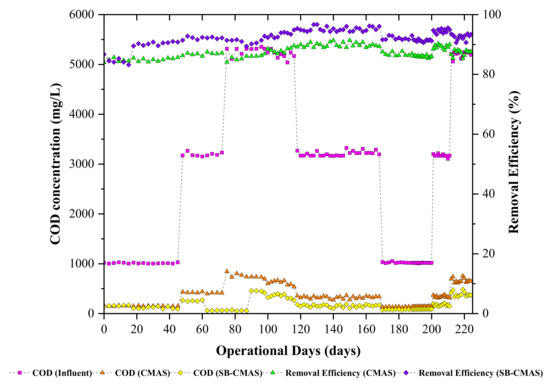
Figure 4.
The CMAS and SB-CMAS bioreactor results in terms of COD concentrations and their removal efficiencies.
The experimental data for the influence of HRT on COD removal are presented. The COD removal was in the range of 59.4–81.21% and 76.4–95.51% for the CMAS and SB-CMAS bioreactors. It is possible to explain the high COD removal in the aerobic bioreactor due to the oxidation of organic matter to CO2, water, and biomass when oxygen serves as an electron acceptor. A similar finding was made by [41], who observed that COD removal was higher in the first reactor (C1) compared to the second reactor (C2) of simultaneous biosorption and biodegradation packed with a biochar biosorbent. The authors observed that COD removal in C1 was in the range of 63–71%, whereas about a 10–16% addition was achieved in C2. The overall substrate removal rate increased with aan increased organic loading rate.
Findings from the literature revealed that, as HRT decreases, the HLR increases. This suggests that more wastewater is entering the bioreactor, which could shorten the time needed for the substrate and the microorganisms to interact and begin to degrade it, leading to incomplete biodegradation. In a bioreactor using activated carbon as a biosorbent, a study found that COD removal reduces between 88, 72.4, 51, and 23.71 percent with decreasing HRT between 4, 3, 2, and 1 day [42]. In a related study, the overall COD removal increased in the range of 7.58, 9.89, 12.41, and 16.20 g COD/L.d with HRT decreasing in the range of 9.6, 7.2, 4.8, and 3.6 days [43]. It is well-known that the decrease of HRT coincides with an increase of organic loading rate, which provides more substrate for microbial consumption. Thus, metabolic activities at a higher organic loading rate were high, resulting in the removal of more substrate.
3.5.2. NH4+−N Removal
The long-term presence of high quantities of NH4+−N in biorefinery effluents is one of the most serious issues faced by operators of green straw-based biorefineries. High concentrations of unprocessed NH4+−N can hasten eutrophication, reduce dissolved oxygen levels, and reduce the effectiveness of biological treatment systems. As a result, aquatic organisms are very poisonous to NH4+−N. In CMAS and SB-CMAS bioreactors, the effect of HRT on NH4+−N removal from GSBE was examined. The time course profiles of NH4+−N concentrations at all sampling points are shown in Figure 5. The experiment began with an HRT of 3 days at an initial NH4+−N concentration of 12.5 mg/L. The overall NH4+−N removal was in the range of 63.42–77.32% and 72.72–87.34% for the CMAS and SB-CMAS bioreactors, respectively. According to the literature, NH4+−N removal from wastewater normally involves a nitrification and denitrification process. The major process that could be involved during NH4+−N removal in GSBE was nitrification because the anoxic section was not included in the bioreactors’ design and the systems operated an extended aeration process. The bioreactors exhibited good NH4+−N oxidation capacity. This was observed through the NO3-N concentration in the aerobic unit with decreasing HRT. The addition of biochar-activated sludge reactors improved the biological treatment of GSBE’s nitrification efficiency. After the reactors were started, it was shown that NH4+−N was effectively oxidized, and the Nitrosomonas and Nitrobacter bacteria then transformed it to nitrite and, eventually, nitrate.
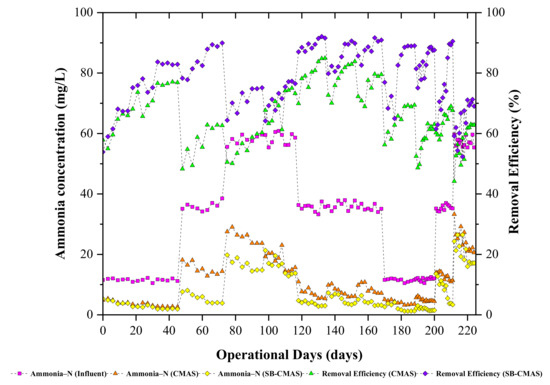
Figure 5.
The CMAS and SB-CMAS bioreactor results in terms of NH4+-N concentrations and their removal efficiencies.
NH4+−N removal was largely influenced by nitrification. The higher metabolic activities which occurred because of nitrification largely influenced the growth and synthesis of new microbial cells. In the overall results for both bioreactors, high NH4+−N removal was achieved even at short HRT of 1 days. This coincides with the findings by [44], where it was reported that NH4+−N removal efficiency increased with decreasing HRT because the decrease of HRT coincides with the increase of hydraulic loading rate which can interfere with the biodegradation and interaction time between the microorganisms and the substrate and subsequently cause an incomplete biodegradation. A similar result was observed by [45], where it was noted that NH4+−N removal was in the range of 99.42–77.58% with HRT decreasing in the range of 4,3, 2, and 1 day in a biological treatment system. Thus, it was concluded that short HRT alters the dynamic balance, composition, and spatial distribution of the ecological structure of microbial systems and could decrease removal efficiency. Short HRT induces high substrate loading to the bioreactor system. A study reported that the residual NH4+−N concentration increased with decreasing HRT [46]. Thus, the increase in effluent substrate concentration was caused by insufficient time for interaction between microorganisms and substrate which caused an incomplete biodegradation at short HRT. In a study by [47], three different HRTs (6, 3, and 2 d) were used on an activated sludge process and the results obtained in the present study are in line with their findings.
3.6. CMAS and SB-CMAS Optimization Output for COD and NH4+−N Removal
3.6.1. Model Fitting and Statistical Analysis
To optimize the operating conditions, regression model equations were built using quantitative data from the properly planned experiments depicted in Table 3. This statistical model was made possible by the experiment design. Here, optimal COD and NH4+−N biosorption parameters on alum sludge-based biochar were refined using the CCD of RSM. The Design Expert software’s numerical node was also used to optimize the procedure under optimal circumstances. The methodology is useful since it made use of experimental data to investigate the interactive impacts of the factors on the efficiency of the entire process. The levels of these independent variables are shown in Table 4, both coded and uncoded.
Table 4.
Design of experiment for the optimization of COD and NH4+−N removal.
In CMAS and SB-CMAS bench-scale bioreactors, GSBE treatment was carried out. Experimental data were statistically analyzed by being fitted to a general model equation. The obtained experimental findings and the input functional variables were fitted. CCD was used in the experiments, and the findings are provided. The polynomial equations are presented in Equations (12) and (13) for CMAS and Equations (14) and (15) for SB-CMAS as follows:
COD removal (%) = +76.53 − 6.27A − 4.20B + 1.96AB − 6.5A² − 1.94B²
NH4+−N removal (%) = +75.93 − 2.89A − 1.77B + 1.18AB − 8.42A² + 0.3366B²
COD removal (%) = +95.10 − 6.56A − 0.1051B + 0.8375B − 7.97A² − 3.08B²
NH4+−N removal (%) = +86.12 − 3.82A − 1.22B − 3.74AB − 5.54A² − 05703B²
The resulting polynomial regression problem was solved using sequential quadratic programming in MATLAB 7. The highest percentages of COD and NH4+−N removal were achieved with a 60% GSBE concentration and a 2-day HRT, respectively. The maximal elimination of COD and NH4+−N under these ideal conditions was calculated to be 78.7% and 69.5%, respectively. The final equation produced for COD and NH4+−N removal is reported in terms of actual (natural) factors in Table S3, which displays the updated model equation in terms of coded and real components.
3.6.2. 3D Response Surface Plots
To better comprehend the effects of independent variables and their interactions on the dependent variable, 3D response surface plots for the measured responses were produced. While keeping the values of the other variables constant, response surface and contour plots were produced for various interactions of any two independent variables. Such three-dimensional surfaces generate precise geometrical representations and offer helpful data regarding the system’s behavior within the experimental setup. The dependent variable is shown on the upper horizontal axis in the 3D response displays. The 3D response surface plots for percentage elimination of COD and NH4+−N as a function of GSBE concentration and HRT are displayed in Figure 6a–d. COD and NH4+−N removal in this study increased as GSBE concentration grew (from 20% to 60%), and as GSBE concentration rose further (to 100%), the removal of COD and NH4+−N started to reduce. It might be caused by a large rise in the concentration of contaminants. Within their respective experimental ranges, the proportion of pollutants removed likewise rose with rising HRT and decreasing GSBE concentration. However, compared to 3 days of HRT, the effect of HRT on the elimination percentage was more pronounced at 2 days. Increases in HRT (1–2 days) and subsequent increases in GSBE concentration were shown to be the main factors for the increased percentage elimination of both pollutants (20–60%). However, the number of pollutants removed considerably decreased at 100% GSBE concentration. As a result of the small number of adsorption sites, the percentage of removal would fall. The results of this study are comparable to those of [48], who found that the highest removal of COD from waste-derived biochar occurred within 1–2 days after the start of treatment. As the initial increase in GSBE concentration increases, so does the percent elimination of COD and NH4+−N. As the biosorbent dose was fed into the SB-CMAS bioreactor, the curve part in 3D plot Figure 7a–d revealed that significant COD and NH4+−N reduction was found to have good interaction influence.
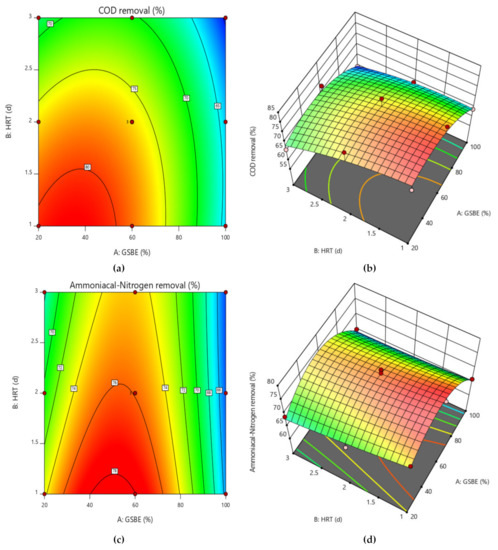
Figure 6.
Contour and surface plot for (a,b) COD removal percent and (c,d) NH4+−N removal percent from the CMAS bioreactor system.
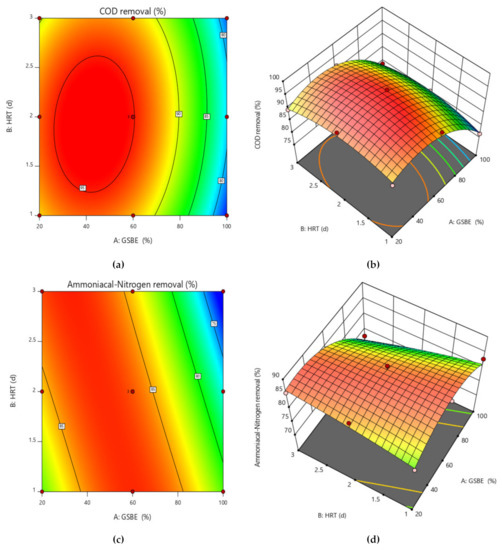
Figure 7.
Contour and surface plot for (a,b) COD removal percent and (c,d) NH4+−N removal percent from the SB-CMAS bioreactor system.
Due to the small number of accessible binding sites in the CMAS bioreactor, there was less opportunity for interaction between pollutants, which led to a reduced removal rate. Because there were more biosorption sites available for both COD and NH4+−N absorption, it was indicated that an increase in biosorbent dose would probably result in a comparable increase in percentage removal. The nature of the response surface curves demonstrates how the variables interact. The relatively semi flat curve indicates that NH4+−N is less sensitive to changes in HRT. The literature states that elliptical or saddle-shaped graphs show a significant interaction between the respective variables, while parallel lines imply that no substantial interaction occurred. Plots of expected values and actual amounts were examined to see if the built models were suitable. Figure 8a–d display the plots of all the answers’ projected values versus their actual values in the CMAS bioreactor. Similarly, Figure 9a–d projected for values in the SB-CMAS bioreactor. The figures demonstrate that nearly all the points were evenly distributed and quite close to the line of equality, demonstrating the models’ high level of fitting accuracy.
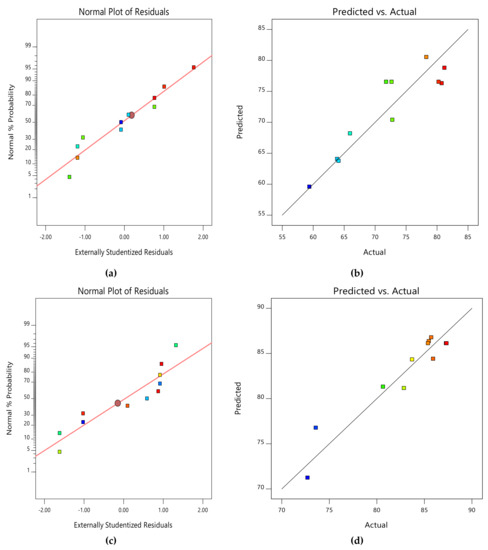
Figure 8.
Normal plots of residuals and predicted versus actual plots of CMAS bioreactor for COD (a,b) and NH4+−N (c,d) removal.
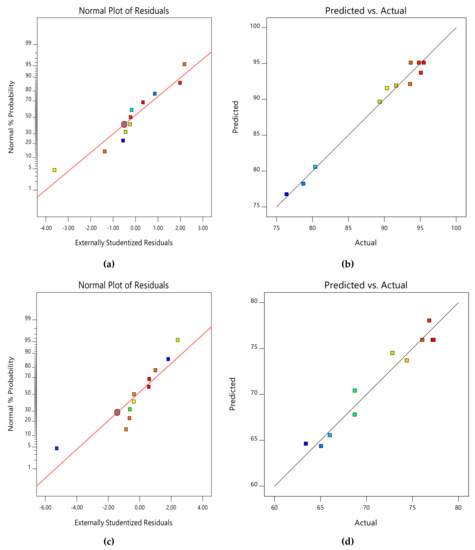
Figure 9.
Normal plots of residuals and predicted versus actual plots of SB-CMAS bioreactor for COD (a,b) and NH4+−N (c,d) removal.
3.6.3. Analysis of Variance (ANOVA)
ANOVA is a statistical method for assessing variance that breaks down the total variation in a set of data into constituent components linked to certain sources of variation to test hypotheses about the model’s parameters. ANOVA was used to evaluate the findings of this study as well as the interactions between the independent variables and responses. The projected response surface quadratic model’s ANOVA is shown in Table 5 without the nonsignificant model terms. The ratio of mean square regression to mean square residual was used to determine the model F-value. The significance of each coefficient was examined using the P values, which were then utilized to determine the pattern of the interdependent relationships between the test variables.
Table 5.
Analysis of variance by RSM for COD and NH4+−N removal efficiencies.
To determine whether F is large enough to show statistical significance, the accompanying p-values are used. The significance of the associated coefficient increased with decreasing p-value magnitude. The model terms are not important if the value is bigger than 0.1000. According to the p-values, the linear, square, and interaction effects of GSBE concentration were significant process variables for COD and NH4+−N reduction among the test variables utilized in the study. Unfitness is undesirable. It is alarming that this likelihood is so low (10%). The model F-values in the SB-CMAS bioreactor are 59.64 and 10.25, respectively, reiterating the model’s significance. The relevant model terms for COD and NH4+−N elimination are A, A2, B2, and A, AB, A2. The lack of fit is not substantial in comparison to pure error, according to the lack of fit F-values of 2.65 and 5.69 for COD and NH4+−N elimination, respectively, and there is a 28.60% and 15.32% chance that noise could be the root cause of such a huge F-value. Positive is a minor lack of fit. It is desired that the model fit.
3.6.4. Fit Statistics
Table 6 displays the model fit summary for the quadratic model for both contaminants. R2, which measures how well the model fits the data, was found to be higher than 0.84 for both responses [49]. The “Pred R2” of 0.2210 and the “Adj R2” of 0.6868 are reasonably in accord for COD in the CMAS bioreactor. The precision with which the treatments are compared is shown by the coefficient of variation (CV) [50]. The “Pred R2” of 0.6716 and the “Adj R2” of 0.8987 for NH4+−N are likewise reasonably consistent. The COD and NH4+−N present ratios of 6.576 and 11.033, respectively, suggest a sufficient signal. To move around the design space, utilize this model. In terms of the SB-CMAS, the “Pred R2” of 0.9835 and the “Adj R2” of 0.9670 are reasonably in agreement. The “Pred R2” of 0.9111 for NH4+−N is likewise reasonably consistent with the “Adj R2” of 0.8221. A sufficient signal was shown by the present removal ratios of 19.262 and 9.691 for COD and NH4+−N, respectively. Using this method, the design space may also be investigated. Table S4 provides a description of the statistics used for model comparison.
Table 6.
Fit Statistics.
When all other variables remain unchanged, the coefficient estimates in Table 7 show the expected change in response per unit change in factor value. The average response of all the runs is the intercept in an orthogonal design. Based on the factor settings, the coefficients modify the average around it. When the factors are orthogonal, the VIFs are 1.
Table 7.
Coefficients in terms of coded factors for the responses.
3.6.5. Effect of HRT on GSBE Treatment in CMAS and SB-CMAS
The HRT had no impact on the GSBE concentration in this investigation, according to the perturbation plot. When compared to GSBE concentration and biosorbent dose, the HRT had little effect on the treatment procedure. It is obvious that the GSBE concentration had the greatest impact on the response. For the COD removal, comparable profiles were seen.
The close contact between air molecules and microorganisms was good at lower HRT. However, the contact between air and bacteria decreases with higher HRTs because of a decrease in air retention time. The build-up of inorganic salts, which decrease microbial activity, may be the cause of this. As a result, at greater flow rates, the fraction of COD and NH4+−N drops. Similar profiles were achieved for the SB-CMAS bioreactor’s COD and NH4+−N reduction. These line up with the outcomes produced by [49]. As was previously mentioned, increasing HRT has a negative effect. Contaminant elimination reduced as the HRT was extended beyond 1–3 days. This might be caused by the sludge’s disintegration at greater HRT.
3.6.6. Optimized GSBE Treatment Process
The optimized wastewater treatment process as one of the important results of RSM analysis could best be explained by desirability plots and numerical ramps. Figure 10a depicts the removal overlay and desirability solution produced from modelled parameters by Design Expert following optimization. The optimal solution showed a high desirability of 0.982184. The numerical solution ramp for the response is presented in Figure 10b. Based on the RSM analysis for the numerical optimization, the optimum concentration of GSBE is 40.2234%. The HRT value was found to be 2.45699. These optimized parameters confirm the viability of improving the treatment system with 95.5101% and 86.8237% removals for COD and NH4+−N, respectively. For GSBE concentration and HRT, the optimization ramp demonstrates the attractiveness of dependent variables. That is, each dot on the ramp represents the desired variable and response behavior target.
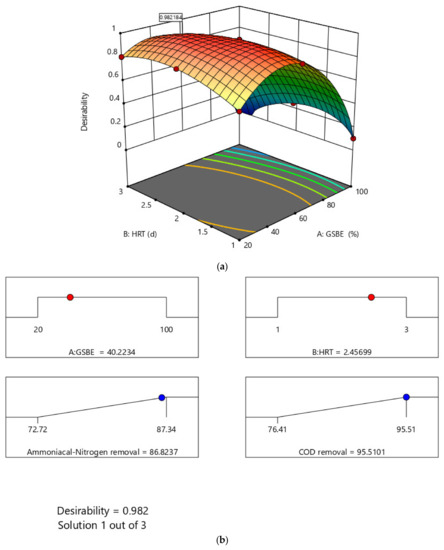
Figure 10.
(a) Numerical ramps for response optimization and (b) desirability plot for the bioreactor system.
3.7. Biokinetic Models for GSBE Treatment in the CMAS and SB-CMAS Bioreactors
Biological kinetic models can be used as an indirect method to estimate the biodegradability of pollutants (such as COD and NH4+−N), although they are typically employed for the design and optimization of industrial-scale applications. This model’s substrate utilization rate given as organic loading is frequently utilized in wastewater biological reactor kinetic modelling. Based on the input parameters, the constructed model can gauge the effectiveness of the biological system and assess its performance. The first-order model, the Grau second-order model, and the modified Stover–Kincannon model were used to study the biokinetics of process parameters chosen for the experiment, such as COD and NH4+−N removal. The well-established biokinetic models were used in the study of water as well as wastewater using biological treatment systems. The study was conducted in a steady-state system after acclimatization.
3.7.1. First-order Model
With variations in the starting wastewater concentrations, the first-order model was used to calculate the first-order kinetic constant (Cs) for the removal of COD and NH4+−N in various bioreactor configurations. The experimental values for the and terms were plotted in Figure 11a–d. The correlation coefficients (R2) for effluents in CMAS and SB-CMAS were 0.32326 and 0.52723, respectively, for COD and 0.29298 and 0.56916, respectively, for NH4+−N. Even though the SB-CMAS had significantly higher R2 values than the CMAS bioreactor, all could be regarded as low compared to other biokinetic models. The two bioreactors’ COD and NH4+−N removal is less likely to follow first-order COD and NH4+−N removal, according to the lower R2 values. Additionally, it showed that the obtained first-order kinetics coefficients could not be accurately fitted. In this investigation, the constant value of Cs was a crucial element for determining the pace at which the concentrations of COD and NH4+−N dropped over time. Based on a best-fit straight line, the value of Cs for COD and NH4+−N removal in each bioreactor for all beginning concentrations was calculated. The Cs for COD in CMAS and SB-CMAS bioreactors were 1.86322 and 2.94399, respectively, while for NH4+−N removal were 0.55325 and 1.10971/day, respectively. The Cs value was low in first-order kinetics. It was discovered that the bioreactors’ average total biomass concentration (X) ranged from 6.23 to 9.05 g VSS/L. The correlation coefficients (R2) for effluents A, B, C, and D in a study by [4] were 0.65, 0.85, 0.82, and 0.98, respectively. With an average total biomass concentration of 3.42 g VSS/L, the first-order kinetic constants (Cs) for effluents A, B, C, and D were 6.67, 1.80, 1.19, and 0.61/day, respectively. In a comparable investigation, Cs decreased with increasing starting pollutant concentration in the bioreactor A’s first-order model. This declining Cs rate indicated a decline in the rate of contaminant removal. The first-order model demonstrated the best correlation with experimental kinetic data from bioreactors B and D (R2 > 90%), demonstrating the model’s capacity to describe the kinetics of COD removal in bioreactors B and D [5].
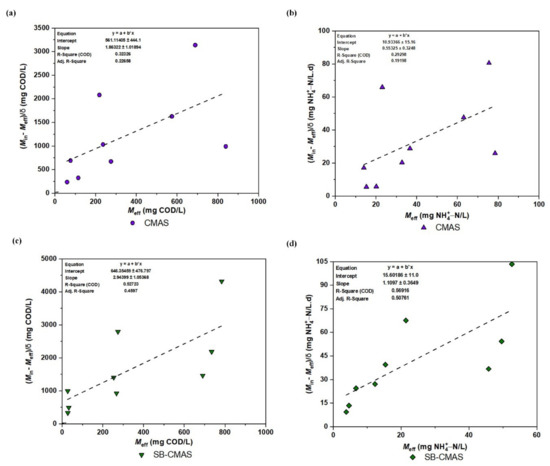
Figure 11.
First-order kinetic plot: (a) COD for CMAS, (b) NH4+−N for CMAS, (c) COD for SB-CMAS, and (d) NH4+−N for SB-CMAS.
3.7.2. Grau second-order model
As shown in Figure 12a–d, the experimental data was used to plot versus based on the Grau second-order model to produce the biokinetic coefficients. When the influent substrate concentration was at its lowest level, the best correlation coefficients were attained. For the GSBE pollutants in the CMAS and SB-CMAS bioreactors, the high correlation coefficients (R2) were 0.96408 and 0.57201 for COD and 0.90771 and 0.51355 NH4+−N, respectively. This shows that the model can correctly forecast the removal of pollutants and that it well matched the recent experimental results [51]. The slope and intercept of each line, respectively, are used to illustrate the amounts of u and b values [52]. The u and b kinetic parameters are represented, respectively, by the trend line’s intercept and slope. According to the intercept and slope of the plot lines in Figure 12, the values for the kinetic parameters u and b for the CMAS bioreactor were computed to be 0.11153 per day and 1.13184, respectively. Therefore, the effluent substrate COD concentration can be calculated using Equation (16) below:
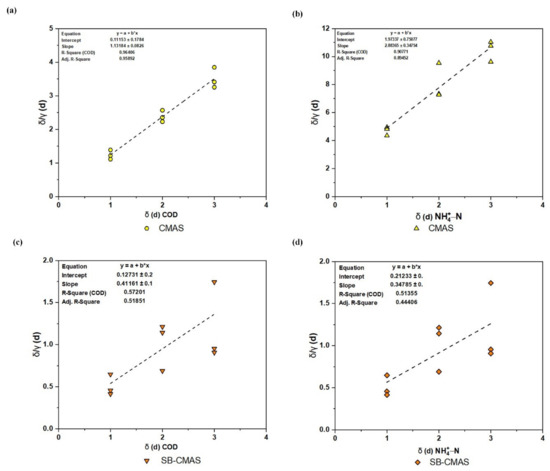
Figure 12.
Second-order kinetic plot: (a) COD for CMAS, (b) NH4+−N for CMAS, (c) COD for SB-CMAS, and (d) NH4+−N for SB-CMAS.
Similarly, using the intercept and slope of the plot lines in Figure 12b, the values of u and b for CMAS were determined to be 1.97337 per day and 2.88365. Therefore, the effluent substrate NH4+−N concentration can be calculated by Equation (17) below:
According to the intercept and slope of the plot lines in Figure 12c, the values for the kinetic parameters u and b for CMAS in the SB-CMAS bioreactor were calculated to be 0.12731 per day and 0.41161, respectively. Therefore, the effluent substrate COD concentration can be calculated by Equation (18) below:
Similarly, using the intercept and slope of the plot lines in Figure 12d, the values of u and b for CMAS were computed to be 15.60186 per day and 1.1097, respectively. Therefore, the effluent substrate NH4+−N concentration can be calculated by Equation (19) below:
where is measured in days, which can range from one to three (24 to 72 h).
Calculations and Figure 12b data revealed that the m coefficient rises as concentration rises, whereas the u value had the opposite effect. The findings of [53], in which n and m were found to be 1.007 and 0.047, respectively, are almost in agreement with the results of the u and b values. In another study, the u (0.033) and b (1.192) value reported by [4] was in conformity with the result of this study. The second-order contaminant removal rate constant (C2) in the unit of time, calculated from the equation u = /(C2) as 4.73 per day, indicated substrate removal for each unit of microorganism. The value of C2 relies on the concentrations of COD, NH4+−N, and biomass in the reactor’s influent, and it rises as substrate removal efficiency rises [54]. C2 = 10−3 was the constant value in this study’s Grau second-order model that was derived for COD. For the elimination of COD and NH4+−N, the results linked to this model suit the data well. The substrate removal constant obtained in this investigation fit the range of C2 values reported in earlier studies, according to the Grau second-order model.
3.7.3. Modified Stover–Kincannon Kinetic Models
Regardless of whether they are used in an aerobic or anaerobic condition throughout wastewater treatment, the concepts and methods used in the Stover–Kincannon model seem to be transferable to a variety of other bioreactors with different configurations, such as fixed-film reactors, trickling filters, etc. [4]. The modified Stover–Kincannon model was also used to examine the kinetic reaction of the developed bioreactors in this study. To determine the values of the kinetic parameters, the obtained experimental data were processed using the linearized model. The maximal COD and NH4+−N removal rates (Umx) and the saturation constant Cv are comparable to the slope and intercept, respectively. To obtain the kinetic parameters Cv and Umx, was plotted against (Figure 13). The intercept of the trend line represents , while the gradient represents . The Stover–Kincannon model for the removal of COD and NH4+−N from GSBE in both bioreactors is presented in Figure 13a–d. It could be depicted that R2 values for all the effluents were >0.99 except for 0.91236 obtained for NH4+−N in the CMAS bireactor. An important finding in the present study was the obtained values of correlation coefficient (R2) at 0.99932 and 0.99533 for COD and NH4+−Nremoval, respectively, in the bioreactor supported with ASMF-C. To be more specific, the modified Stover–Kincannon model was shown to be the best fit for the observed data. Accurate biodegradable organic removal predictions can be made with this model. The necessary excellent correlation coefficients were obtained. When the maximal COD and NH4+−N removal from the experiments and biokinetic models were compared, a good correlation was observed. The Umx values for CMAS and SB-CMAS were 0.9108 and 1.1207 g/L.d, respectively, for COD removal. Consequently, Umx coefficients for CMAS and SB-CMAS were 0.9682 and 2.7190 g/L.d, respectively, for NH4+−N removal.
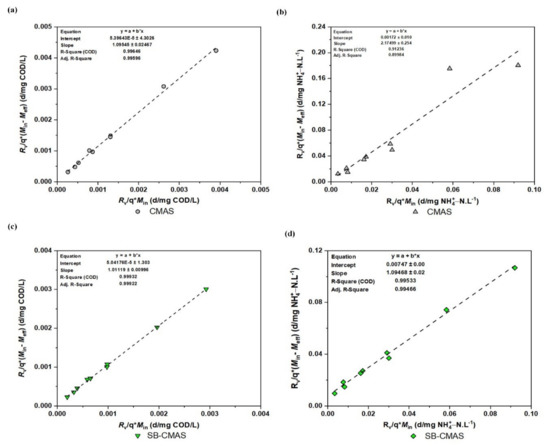
Figure 13.
Modified Stover kinetic plot: (a) COD for CMAS, (b) NH4+−N for CMAS, (c) COD for SB-CMAS, and (d) NH4+−N for SB-CMAS.
The maximal Cv for R1 and R2 were 0.929 and 1.108 g/L.d, respectively. In a study by [55], R2 was discovered to have a higher value than R1, according to the reported values of Umx coefficients. The Umx was 11.13, 10.46, 4.63, and 5.31 gCOD/L.day for mill effluents A, B, C, and D, respectively. The following numbers, respectively, represent the Cv for mill effluents A, B, C, and D: 20.12, 14.95, 10.10, and 9.97 gCOD/L.day. This discovery was found to be consistent with the outcomes of a recent study that evaluated the efficacy of novel biocarriers for the removal of organic matter from industrial wastewater in a biosorbent-assisted bioreactor using the Stover–Kincannon equation. Using a biochar adsorbent, the study’s highest values of Umx and Cv were 0.679 g/(L.d) and 0.874 g/(L.d), respectively. According to these authors, the non-biosorbent-supported bioreactor outperformed the biosorbent-supported bioreactor due to its capacity to offer a broad porous structure for bacterial immobilization, which in turn produced effective substrate biodegradation. The performance of bioreactors could be impacted by these additional variables [51]. The Stover–Kincannon equation is believed to be followed by experimental data when R2 is greater than 0.98, according to research by [2] and several other researchers. The findings of this study showed that the bioreactor constructed with the addition of the biochar composite eliminating COD and NH4+−N from GSBE had high precision and applicability. The model’s kinetic correlations could be used to anticipate performance and reactor volume requirements for pilot and large commercial applications.
4. Conclusions
There has been an intensified effort to enhance the treatment of different wastewater effluents before the disposal process with the objective of sustained environmental and public health, decreasing liquid waste pollution footprints, and resource recovery. This study evaluated the feasibility and effectiveness of CMAS and SB-CMAS systems for the biosorption of organic matter and nutrients from GSBE. The following conclusions can be drawn from the research:
- A high degree of removal rate of COD and NH4+−N can be achieved when the process variables were optimized in CMAS and SB-CMAS systems.
- Modified Stover–Kincannon biokinetic models were a better fit for enhanced substrate removal of organic matter and nutrients.
- A significant contaminant removal efficiency of about 60% can be attained at a 2-day hydraulic retention time in both CMAS and SB-CMAS process systems of GSBE.
- The study was limited to COD and NH4+−N removal; however, further evaluation of other by-products should be studied to prevent the possibility of recontamination, and the viability of the process at field scale for adoption is necessary for sustainable and safe industrial wastewater disposal.
- The utilization of waste materials to create biocomposites and the removal of COD and NH4+−N from GSBE can serve as an inventive way to reduce our solid and liquid waste pollution footprint in the environment sustainably.
Supplementary Materials
The following supporting information can be downloaded at: https://www.mdpi.com/article/10.3390/pr10112262/s1, Table S1. Chemical composition (wt%) of ASMF-C: Table S2. ASMF-C surface and structural properties: Table S3. Final Equation in Terms of Actual Factors: Table S4. Model Comparison Statistics.
Author Contributions
Conceptualization, A.H.J. and S.R.M.K.; methodology, S.R.M.K. and L.B.; supervision, S.R.M.K., L.B. and G.H.; project administration, S.R.M.K. and G.H.; funding acquisition, S.R.M.K., L.B. and G.H.; software, M.M.; validation, A.T.B.T., M.M. and I.M.L..; formal analysis, A.H.J. and. I.M.L.; resources, S.R.M.K.; data curation, A.H.B., A.T.B.T. and M.M.; writing—original draft preparation, A.H.J.; writing—review and editing, A.H.J., S.R.M.K. and L.B.; visualization, A.H.B. and A.T.B.T.; All authors have read and agreed to the published version of the manuscript.
Funding
This research was funded by Universiti Teknologi PETRONAS (UTP) and Universiti Tenaga Nasional (UNITEN) BOLD Refresh Fund 2022.
Institutional Review Board Statement
Not applicable.
Informed Consent Statement
Not applicable.
Data Availability Statement
The data presented in this study are available from the corresponding authors upon reasonable request.
Acknowledgments
The authors would like to express their gratitude to Universiti Teknologi PETRONAS (UTP) and the Ministry of Higher Education of Malaysia, Universiti Tenaga Nasional (UNITEN) for supporting the research.
Conflicts of Interest
The authors declare no conflict of interest.
References
- Sera, P.R.; Diagboya, P.N.; Akpotu, S.O.; Mtunzi, F.M.; Chokwe, T.B. Potential of valourized Moringa oleifera seed waste modified with activated carbon for toxic metals decontamination in conventional water treatment. Bioresour. Technol. Rep. 2021, 16, 100881. [Google Scholar] [CrossRef]
- Majumdar, S.; Paul, I.; Dey, S.; Dutta, S.; Mandal, T.; Mandal, D.D. Biotransformation of paper mill sludge by Serratia marcescens NITDPER1 for prodigiosin and cellulose nanocrystals: A strategic valorization approach. Biochem. Eng. J. 2020, 164, 107766. [Google Scholar] [CrossRef]
- Al-dhawi, B.N.S.; Kutty, S.R.M.; Baloo, L.; Almahbashi, N.M.Y.; Ghaleb, A.A.S.; Jagaba, A.H.; Kumar, V.; Saeed, A.A.H. Treatment of synthetic wastewater by using submerged attached growth media in continuous activated sludge reactor system. Int. J. Sustain. Build. Technol. Urban Dev. 2022, 2–10. [Google Scholar]
- Bajpai, P. Biological treatment of pulp and paper mill effluents. In Biotechnology for Pulp and Paper Processing; Springer: Singapore, 2018; pp. 313–369. [Google Scholar]
- Brink, A.; Sheridan, C.; Harding, K. A kinetic study of a mesophilic aerobic moving bed biofilm reactor (MBBR) treating paper and pulp mill effluents: The impact of phenols on biodegradation rates. J. Water Process Eng. 2017, 19, 35–41. [Google Scholar] [CrossRef]
- Birniwa, A.H.; Abdullahi, S.S.; Mahmud, H.N.M.E. Study on physico-mechanical behaviour of acacia nilotica (gum tree) and glass fiber blend reinforced epoxy resin composite. ChemSearch J. 2019, 10, 46–53. [Google Scholar]
- Muhamad, M.H.; Abdullah, S.R.S.; Hasan, H.A.; Bakar, S.N.H.A. Multimedia-sequencing batch biofilm reactor in treating recycled paper mill effluent containing high level of pentachlorophenol: Long-term performance, mechanism and kinetic studies. J. Water Process Eng. 2020, 37, 101522. [Google Scholar] [CrossRef]
- Birniwa, A.H.; Abubakar, A.S.; Huq, A.O.; Mahmud, H.N.M.E. Polypyrrole-polyethyleneimine (PPy-PEI) nanocomposite: An effective adsorbent for nickel ion adsorption from aqueous solution. J. Macromol. Sci. Part A Pure Appl. Chem. 2021, 58, 206–217. [Google Scholar] [CrossRef]
- Yang, Y.; Zhao, Y.; Kearney, P. Influence of ageing on the structure and phosphate adsorption capacity of dewatered alum sludge. Chem. Eng. J. 2008, 145, 276–284. [Google Scholar] [CrossRef]
- Jagaba, A.H.; Kutty, S.R.M.; Naushad, M.; Lawal, I.M.; Noor, A.; Affam, A.C.; Birniwa, A.H.; Abubakar, S.; Soja, U.B.; Abioye, K.J. Removal of nutrients from pulp and paper biorefinery effluent: Operation, kinetic modelling and optimization by response surface methodology. Environ. Res. 2022, 214, 114091. [Google Scholar] [CrossRef]
- Zaini, M.A.A.; Zakaria, M.; Setapar, S.M.; Che-Yunus, M. Sludge-adsorbents from palm oil mill effluent for methylene blue removal. J. Environ. Chem. Eng. 2013, 1, 1091–1098. [Google Scholar] [CrossRef]
- Jagaba, A.H.; Kutty, S.R.M.; Noor, A.; Isah, A.S.; Lawal, I.M.; Birniwa, A.H.; Usman, A.K.; Abubakar, S. Kinetics of Pulp and Paper Wastewater Treatment by High Sludge Retention Time Activated Sludge Process. J. Hunan Univ. Nat. Sci. 2022, 49, 242–251. [Google Scholar] [CrossRef]
- Rathnayake, N.; Patel, S.; Halder, P.; Aktar, S.; Pazferreiro, J.; Sharma, A.; Surapaneni, A.; Shah, K. Co-pyrolysis of biosolids with alum sludge: Effect of temperature and mixing ratio on product properties. J. Anal. Appl. Pyrolysis 2022, 163, 105488. [Google Scholar] [CrossRef]
- Jagaba, A.H.; Kutty, S.R.M.; Salih, G.H.A.; Noor, A.; Hafiz, M.; Yaro, N.S.A.; Saeed, A.A.H.; Lawal, I.M.; Birniwa, A.H.; Kilaco, A.U. Palm Oil Clinker as a Waste by-Product: Utilization and Circular Economy Potential; IntechOpen: London, UK, 2021; Volume 1. [Google Scholar]
- Manyatshe, A.; Cele, Z.E.; Balogun, M.O.; Nkambule, T.T.; Msagati, T.A. Chitosan modified sugarcane bagasse biochar for the adsorption of inorganic phosphate ions from aqueous solution. J. Environ. Chem. Eng. 2022, 10, 108243. [Google Scholar] [CrossRef]
- Aghamohammadi, N.; Ain Abdul Aziz, H.; Isa, M.H.; Zinatizadeh, A.A. Powdered activated carbon augmented activated sludge process for treatment of semi-aerobic landfill leachate using response surface methodology. Bioresour. Technol. 2007, 98, 3570–3578. [Google Scholar] [CrossRef] [PubMed]
- Jagaba, A.H.; Kutty, S.R.M.; Isa, M.H.; Ghaleb, A.A.S.; Lawal, I.M.; Usman, A.K.; Birniwa, A.H.; Noor, A.; Abubakar, S.; Umaru, I. Toxic effects of xenobiotic compounds on the microbial community of activated sludge. ChemBioEng Rev. 2022, 9, 497–535. [Google Scholar] [CrossRef]
- Aziz, S.Q.; Aziz, H.A.; Yusoff, M.S.; Bashir, M.J. Landfill leachate treatment using powdered activated carbon augmented sequencing batch reactor (SBR) process: Optimization by response surface methodology. J. Hazard. Mater. 2011, 189, 404–413. [Google Scholar] [CrossRef]
- Yaro, N.S.A.; Sutanto, M.H.; Habib, N.Z.; Napiah, M.; Usman, A.; Muhammad, A. Comparison of Response Surface Methodology and Artificial Neural Network approach in predicting the performance and properties of palm oil clinker fine modified asphalt mixtures. Constr. Build. Mater. 2022, 324, 126618. [Google Scholar] [CrossRef]
- Birjandi, N.; Younesi, H.; Bahramifar, N.; Ghafari, S.; Zinatizadeh, A.A.; Sethupathi, S. Optimization of coagulation-flocculation treatment on paper-recycling wastewater: Application of response surface methodology. J. Environ. Sci. Health Part A 2013, 48, 1573–1582. [Google Scholar] [CrossRef]
- Jagaba, A.H.; Kutty, S.R.M.; Baloo, L.; Noor, A.; Abubakar, S.; Lawal, I.M.; Umaru, I.; Usman, A.K.; Kumar, V.; Birniwa, A.H. Effect of Hydraulic Retention Time on the Treatment of Pulp and Paper Industry Wastewater by Extended Aeration Activated Sludge System. In Proceedings of the 2021 Third International Sustainability and Resilience Conference: Climate Change (IEEE 2021), Sakheer, Bahrain, 15–16 November 2021; pp. 221–224. [Google Scholar]
- Asfaram, A.; Ghaedi, M.; Agarwal, S.; Tyagi, I.; Gupta, V.K. Removal of basic dye Auramine-O by ZnS: Cu nanoparticles loaded on activated carbon: Optimization of parameters using response surface methodology with central composite design. RSC Adv. 2015, 5, 18438–18450. [Google Scholar] [CrossRef]
- Jagaba, A.H.; Kutty, S.R.M.; Noor, A.; Affam, A.C.; Ghfar, A.A.; Usman, A.K.; Lawal, I.M.; Birniwa, A.H.; Kankia, M.U.; Afolabi, H.K. Parametric optimization and kinetic modelling for organic matter removal from agro-waste derived paper packaging biorefinery wastewater. Biomass Convers. Biorefinery 2022, 1–18. [Google Scholar] [CrossRef]
- Bhateria, R.; Dhaka, R. Optimization and statistical modelling of cadmium biosorption process in aqueous medium by Aspergillus niger using response surface methodology and principal component analysis. Ecol. Eng. 2019, 135, 127–138. [Google Scholar] [CrossRef]
- Jagaba, A.H.; Kutty, S.R.M.; Baloo, L.; Birniwa, A.H.; Lawal, I.M.; Aliyu, M.K.; Yaro, N.S.A.; Usman, A.K. Combined treatment of domestic and pulp and paper industry wastewater in a rice straw embedded activated sludge bioreactor to achieve sustainable development goals. Case Stud. Chem. Environ. Eng. 2022, 6, 100261. [Google Scholar] [CrossRef]
- Dhiman, N.; Shukla, S.; Kisku, G. Statistical optimization of process parameters for removal of dyes from wastewater on chitosan cenospheres nanocomposite using response surface methodology. J. Clean. Prod. 2017, 149, 597–606. [Google Scholar]
- Jagaba, A.H.; Kutty, S.R.M.; Lawal, I.M.; Birniwa, A.H.; Affam, A.C.; Yaro, N.S.A.; Usman, A.K.; Umaru, I.; Abubakar, S.; Noor, A. Circular economy potential and contributions of petroleum industry sludge utilization to environmental sustainability through engineered processes—A review. Clean. Circ. Bioeconomy 2022, 3, 100029. [Google Scholar] [CrossRef]
- Sathian, S.; Rajasimman, M.; Radha, G.; Shanmugapriya, V.; Karthikeyan, C. Performance of SBR for the treatment of textile dye wastewater: Optimization and kinetic studies. Alex. Eng. J. 2014, 53, 417–426. [Google Scholar] [CrossRef]
- Birniwa, A.H.; Mohammad, R.E.A.; Ali, M.; Rehman, M.F.; Abdullahi, S.S.; Eldin, S.M.; Mamman, S.; Sadiq, A.C.; Jagaba, A.H. Synthesis of Gum Arabic Magnetic Nanoparticles for Adsorptive Removal of Ciprofloxacin: Equilibrium, Kinetic, Thermodynamics Studies, and Optimization by Response Surface Methodology. Separations 2022, 9, 322. [Google Scholar] [CrossRef]
- Borghei, S.; Sharbatmaleki, M.; Pourrezaie, P.; Borghei, G. Kinetics of organic removal in fixed-bed aerobic biological reactor. Bioresour. Technol. 2008, 99, 1118–1124. [Google Scholar] [CrossRef]
- Faridnasr, M.; Ghanbari, B.; Sassani, A. Optimization of the moving-bed biofilm sequencing batch reactor (MBSBR) to control aeration time by kinetic computational modeling: Simulated sugar-industry wastewater treatment. Bioresour. Technol. 2016, 208, 149–160. [Google Scholar] [CrossRef]
- Faekah, I.N.; Fatihah, S.; Mohamed, Z.S. Kinetic evaluation of a partially packed upflow anaerobic fixed film reactor treating low-strength synthetic rubber wastewater. Heliyon 2020, 6, e03594. [Google Scholar] [CrossRef]
- Usman, A.; Sutanto, M.H.; Napiah, M.; Zoorob, S.E.; Yaro, N.S.A.; Khan, M.I. Comparison of performance properties and prediction of regular and gamma-irradiated granular waste polyethylene terephthalate modified asphalt mixtures. Polymers 2021, 13, 2610. [Google Scholar] [CrossRef]
- Yaro, N.S.A.; Napiah, M.B.; Sutanto, M.H.; Usman, A.; Saeed, S.M. Modeling and optimization of mixing parameters using response surface methodology and characterization of palm oil clinker fine modified bitumen. Constr. Build. Mater. 2021, 298, 123849. [Google Scholar] [CrossRef]
- Usman, A.; Sutanto, M.H.; Napiah, M.B.; Yaro, N.S.A. Response surface methodology optimization in asphalt mixtures: A review. In Response Surface Methodology in Engineering Science; IntechOpen: London, UK, 2021. [Google Scholar]
- Yaro, N.S.A.; Sutanto, M.H.; Habib, N.Z.; Napiah, M.; Usman, A.; Al-Sabaeei, A.M.; Rafiq, W. Mixture Design-Based Performance Optimization via Response Surface Methodology and Moisture Durability Study for Palm Oil Clinker Fine Modified Bitumen Asphalt Mixtures. Int. J. Pavement Res. Technol. 2022, 1–28. [Google Scholar] [CrossRef]
- Jagaba, A.H.; Kutty, S.R.M.; Abubakar, S.; Birniwa, A.H.; Lawal, I.M.; Umaru, I.; Usman, A.K.; Yaro, N.S.A.; Al-Zaqri, N.; Al-Maswari, B.M. Synthesis, Characterization, and Performance Evaluation of Hybrid Waste Sludge Biochar for COD and Color Removal from Agro-Industrial Effluent. Separations 2022, 9, 258. [Google Scholar] [CrossRef]
- Birniwa, A.H.; Mahmud, H.N.M.E.; Abdullahi, S.S.; Habibu, S.; Jagaba, A.H.; Ibrahim, M.N.M.; Ahmad, A.; Alshammari, M.B.; Parveen, T.; Umar, K. Adsorption Behavior of Methylene Blue Cationic Dye in Aqueous Solution Using Polypyrrole-Polyethylenimine Nano-Adsorbent. Polymers 2022, 14, 3362. [Google Scholar] [CrossRef] [PubMed]
- Jagaba, A.H.; Kutty, S.R.M.; Lawal, I.M.; Aminu, N.; Noor, A.; Al-dhawi, B.N.S.; Usman, A.K.; Batari, A.; Abubakar, S.; Birniwa, A.H.; et al. Diverse sustainable materials for the treatment of petroleum sludge and remediation of contaminated sites: A review. Clean. Waste Syst. 2022, 2, 100010. [Google Scholar] [CrossRef]
- Birniwa, A.H.; Abubakar, A.S.; Mahmud, H.N.M.E.; Kutty, S.R.M.; Jagaba, A.H.; Abdullahi, S.S.; Zango, Z.U. Application of Agricultural Wastes for Cationic Dyes Removal from Wastewater. In Textile Wastewater Treatment; Springer: Berlin/Heidelberg, Germany, 2022; pp. 239–274. [Google Scholar]
- Jagaba, A.H.; Kutty, S.R.M.; Hayder, G.; Baloo, L.; Noor, A.; Yaro, N.S.A.; Saeed, A.A.H.; Lawal, I.M.; Birniwa, A.H.; Usman, A.K. A systematic literature review on waste-to-resource potential of palm oil clinker for sustainable engineering and environmental applications. Materials 2021, 14, 4456. [Google Scholar] [CrossRef]
- Abdullahi, S.S.; Musa, H.; Habibu, S.; Birniwa, A.H.; Mohammad, R.E.A. Facile synthesis and dyeing performance of some disperse monomeric and polymeric dyes on nylon and polyester fabrics. Bull. Chem. Soc. Ethiop. 2021, 35, 485–497. [Google Scholar] [CrossRef]
- Abubakar, S.; Lawal, I.; Hassan, I.; Jagaba, A. Quality water analysis of public and private boreholes (a case study of Azare Town, Bauchi, Nigeria). Am. J. Eng. Res. 2016, 5, 204–208. [Google Scholar]
- Birniwa, A.H.; Abdullahi, S.S.; Yakasai, M.Y.; Ismaila, A. Studies on physico-mechanical behaviour of kenaf/glass fiber reinforced epoxy hybrid composites. Bull. Chem. Soc. Ethiop. 2021, 35, 171–184. [Google Scholar] [CrossRef]
- Abdullahi, S.S.; Musa, H.; Habibu, S.; Birniwa, A.H.; Mohammad, R.E.A. Comparative study and dyeing performance of as-synthesized azo heterocyclic monomeric, polymeric, and commercial disperse dyes. Turk. J. Chem 2022, 46, 1–12. [Google Scholar]
- Jagaba, A.H.; Kutty, S.R.M.; Isa, M.H.; Affam, A.C.; Aminu, N.; Abubakar, S.; Noor, A.; Lawal, I.M.; Umaru, I.; Hassan, I. Effect of environmental and operational parameters on sequential batch reactor systems in dye degradation. In Dye Biodegradation, Mechanisms and Techniques; Springer: Berlin/Heidelberg, Germany, 2022; pp. 193–225. [Google Scholar]
- Lawal, I.M.; Bertram, D.; White, C.J.; Jagaba, A.H.; Hassan, I.; Shuaibu, A. Multi-criteria performance evaluation of gridded precipitation and temperature products in data-sparse regions. Atmosphere 2021, 12, 1597. [Google Scholar] [CrossRef]
- Ghaleb, A.; Kutty, S.; Ho, Y.; Jagaba, A.; Noor, A.; Al-Sabaeei, A.; Kumar, V.; Saeed, A. Anaerobic Co-Digestion for Oily-Biological Sludge with Sugarcane Bagasse for Biogas Production under Mesophilic Condition. In IOP Conference Series: Materials Science and Engineering, Proceedings of the 5th International Conference of Chemical Engineering and Industrial Biotechnology (ICCEIB 2020), Kuala Lumpur, Malaysia, 9–11 August 2020; IOP Publishing: Bristol, UK, 2020; p. 012084. [Google Scholar]
- Jagaba, A.H.; Kutty, S.R.M.; Noor, A.; Birniwa, A.H.; Affam, A.C.; Lawal, I.M.; Kankia, M.U.; Kilaco, A.U. A systematic literature review of biocarriers: Central elements for biofilm formation, organic and nutrients removal in sequencing batch biofilm reactor. J. Water Process Eng. 2021, 42, 102178. [Google Scholar] [CrossRef]
- Sayed, K.; Baloo, L.; Kutty, S.R.B.; Al Madhoun, W.; Kankia, M.U.; Jagaba, A.H.; Singa, P.K. Optimization of palm oil mill effluent final discharge as biostimulant for biodegradation of tapis light crude petroleum oil in seawater. J. Sea Res. 2022, 188, 102268. [Google Scholar] [CrossRef]
- Abedinzadeh, N.; Shariat, M.; Monavari, S.M.; Pendashteh, A. Evaluation of color and COD removal by Fenton from biologically (SBR) pre-treated pulp and paper wastewater. Process Saf. Environ. Prot. 2018, 116, 82–91. [Google Scholar] [CrossRef]
- Al-Mahbashi, N.M.Y.; Kutty, S.R.M.; Bilad, M.R.; Huda, N.; Kobun, R.; Noor, A.; Jagaba, A.H.; Al-Nini, A.; Ghaleb, A.A.S.; Al-dhawi, B.N.S. Bench-Scale Fixed-Bed Column Study for the Removal of Dye-Contaminated Effluent Using Sewage-Sludge-Based Biochar. Sustainability 2022, 14, 6484. [Google Scholar] [CrossRef]
- Yaro, S.N.A.; Sutanto, M.H.; Usman, A.; Jagaba, A.H.; Sakadadi, M.Y. The influence of waste rice straw ash as surrogate filler for asphalt concrete mixtures. Construction 2022, 2, 118–125. [Google Scholar] [CrossRef]
- Gomes, S.D.C.; Zhou, J.L.; Zeng, X.; Long, G. Water treatment sludge conversion to biochar as cementitious material in cement composite. J. Environ. Manag. 2022, 306, 114463. [Google Scholar] [CrossRef]
- Jagaba, A.; Kutty, S.; Hayder, G.; Elsadig, E.; Lawal, I.; Sayed, K.; Abubakar, S.; Hassan, I.; Umaru, I.; Zubairu, I. Evaluation of the Physical, Chemical, Bacteriological and Trace Metals Concentrations in Different Brands of Packaged Drinking Water. Eng. Lett. 2021, 29, 9. [Google Scholar]


Publisher’s Note: MDPI stays neutral with regard to jurisdictional claims in published maps and institutional affiliations. |
© 2022 by the authors. Licensee MDPI, Basel, Switzerland. This article is an open access article distributed under the terms and conditions of the Creative Commons Attribution (CC BY) license (https://creativecommons.org/licenses/by/4.0/).