Article

Limited Phosphorous Supply Improved Lipid Content of Chlorella vulgaris That Increased Phenol and 2-Chlorophenol Adsorption from Contaminated Water with Acid Treatment

1
Department of Environmental Sciences, Quaid-i-Azam University, Islamabad 45320, Pakistan
2
Department of Civil Engineering, College of Engineering, University of Ha’il, Ha’il 55425, Saudi Arabia
3
International Research Center in Critical Raw Materials and Advanced Industrial Technologies, Universidad de Burgos, 09001 Burgos, Spain
*
Authors to whom correspondence should be addressed.
Processes 2022, 10(11), 2435; https://doi.org/10.3390/pr10112435
Submission received: 26 October 2022 / Revised: 9 November 2022 / Accepted: 14 November 2022 / Published: 17 November 2022
(This article belongs to the Special Issue Recent Advances in Pollutant Biosorption Processes)

Abstract

:
Phenolic compounds are toxic and ominously present in industrial effluents, which can end up in water bodies, causing potential damage to living organisms. This study employed the dried biomass of freshwater green microalgae Chlorella vulgaris to remove phenol and 2-chlorophenol from an aqueous environment. C. vulgaris was grown under different phosphorus- (P) starved conditions, and biomass was treated with sulfuric acid. It was observed that reducing the P level enhanced the lipid content by 7.8 times while decreasing protein by 7.2 times. P-starved C. vulgaris dried biomass removed phenol and 2-chlorophenol by 69 and 57%, respectively, after 180 min from the contaminated water. Acid-treated P-starved C. vulgaris dried biomass removed phenol and 2-chlorophenol by 77 and 75%, respectively, after 180 min. Thus, an economical and eco-friendly P-starved and acid treated C. vulgaris biomass has better potential to remove phenol and 2-chlorophenol from contaminated ground water and industrial wastewater.

Graphical Abstract

1. Introduction

Since World War II, rapid industrialization and technological advancements have made life safer and more comfortable. Aside from the improvements, it also brought changes to the environment that damaged living organisms in the long run [1,2]. This advancement brings pollution, a serious concern as it negatively impacts the environmental fabric [3]. One such nuisance is associated with phenolic compounds introduced into the environment through many natural and anthropogenic sources [4]. As a result of the vehicular discharge, phenolic compounds are also released into the atmosphere [5]. Significant portions of domestic waste also contain phenolic compounds, as these compounds are used in pharmaceuticals, disinfectants, perfumes, paints, antiseptics, toys, and varnish removers [6]. Anthropogenic sources pose a significant threat. These compounds can enter human and animal bodies through the skin and the gastrointestinal tract. They metabolize into different forms, particularly quinone moieties, which form a covalent bond with protein and disturb its function. This causes DNA damage and disturbs the movement of electrons towards the energy-transducing membrane, which leads to heart, kidney, and liver damage, and even death [7].
Many conventional techniques are available to break down the phenol chemically, including ozonation, photocatalytic degradation, extraction, the Electro-Fenton method, and adsorption [8]. Recently, bioremediation has diverted the attention of researchers towards more sophisticated methods. Bioremediation is the exploitation of microorganisms or their metabolites to degrade or prevent pollution [9]. This technique alters, degrades, or immobilizes pollutants through bacteria, algae, fungi, and plants [10]. Phycoremediation is more convenient, relying on algae for remediation [11]. Microalga is an excellent biological agent for the decontamination of water. El-Gendy and Nassar [12] have extensively reviewed and reported the potential of microalgae for removing phenolic compounds from environmental matrices, using the genus of Chlamydomonas, Chlorococcum, Chlorella, Chroococcus, Gloeocystis, Limnothrix, Lyngbya, Oscillatoria, Phormidium, Planktothrix, Scenedesmus, and Ulothrix.
The microalgae-based biosorbent techniques are efficient and can be used even if a pollutant is present in trace amounts [13]. There are many functional groups in the cell wall of microalgae that adsorb the pollutant to its surface, making it the first significant barrier [14]. The presence of functional groups on the cell wall of algae helps to bioaccumulate the pollutant intracellularly. This can also lead to inactive adsorption of the pollutant to its surface [15]. The dead biomass of algae is not affected by pollutant toxicity. It requires very minimal maintenance and space. As a result, it has an added advantage over living algae [16]. This study utilizes the dried algal biomass of C. vulgaris for biosorption. The reason to use dried biomass for the bio-adsorption, compared to live algae, is that the cultivation of the latter is energy-intensive, requires nutrients, has issues with reuse, and most importantly, the pollutant overdose can lead to the death of algae, limiting its application [12,13].
Pretreatment of algae with acid elutes the pollutants and ions present on the surface in order to create additional sites for the adsorption of pollutants under study. Furthermore, it dissolves the polysaccharide component of the cell and promotes the adsorption of pollutants. Pretreatment can enhance sorption by producing chemical sites on algal biomass [17]. Phosphorus is an essential and cost-limiting nutrient. It plays a significant role in the growth of algae, since it is the primary nutrient of algae. In addition to pretreatment, phosphorus starvation enhances the microalgae’s lipid content, which could enhance the microalgae’s biosorption capacity [18]. Hence, the main objective of this study is to test the efficiency of phosphorus-starved and acid-pretreated dried algal biomass for the bioadsorption of phenolic compounds at different time intervals.
Numerous studies examined the impact of nutrient limitations on the lipid production by microalgae [18]. A research gap exists on how nutrient limitation affects contaminant bioadsorption capabilities to microalgal biomass. Therefore, this study examined the effects of phosphorous stress on metal bioadsorption to microalgal biomass. Moreover, it was reported that acid treatment of dead algal biomass improves the bioadsorption capabilities of microalgae [17,19]. This research, thus, identifies peculiar microalgal biomass that could be utilized for specific wastewater treatment applications. Based on the efficacy of this study, it is evident that waste microalgal biomass can be used as a biosorption agent for phenols.

2. Materials and Methods

2.1. Chlorella vulgaris Growth Conditions

The algal sample of pure C. vulgaris was provided by Dr. Naim Rashid from COMSATS University Islamabad (CUI), Lahore Campus. This alga was cultured in the laboratory in order to obtain the required active biomass. This phase of culturing algae was carried out in the Bold Basal Media solution, and was supplemented with proper aeration, CO2 supply (6 bubbles per minute), and adequate timing of photoperiod (18 h light day−1) was provided by incandescent bulbs. BBM consisted of macronutrients and micronutrients. Macronutrients included NaNO3 (25 g L−1), CaCl2·2H2O (2.5 g L−1), MgSO4·7H2O (7.5 g L−1), K2HPO4 (7.5 g L−1), KH2PO4 (17.5 g L−1), NaCl (2.5 g L−1), EDTA (50 g L−1), and KOH (31 g L−1), prepared together, FeSO4·7H2O (4.98 g L−1) prepared with H2SO4 (1 mL), and H3BO3 (11.42 g L−1). Micronutrients included ZnSO4·7H2O (8.82 g L−1), MnCl2·4H2O (1.44 g L−1), MoO3 (0.71 g L−1), CuSO4·5H2O (1.57 g L−1), and Co(NO3)2·6H2O (0.49 g L−1) [20,21]. Microalgal growth was visible within 3–4 days. Twenty-day-old cells were harvested through centrifugation. Biomass was then washed with phosphate-free media and centrifuged again at 1000 rpm. The buffer rinsed biomass was used to study the phosphate limitation and impact of starvation on lipid production [21].

2.2. C. vulgaris Growth at Different Phosphorus Concentrations & Biomass Harvesting

The centrifuged biomass was poured into the media containing different phosphorus concentrations. Phosphorus is an essential nutrient required for the growth of algae. Phosphorus in growing media was reduced to 100, 75, 50, 25, and 0%, respectively [22]. Phosphorus is present in the form of dipotassium hydrogen phosphate (K2HPO4) and potassium dihydrogen phosphate (KH2PO4) [23]. Both nutrients were reduced collectively. The centrifuged microalgae were then poured equally into five different phosphorus concentration media and allowed to grow for 7 days. The biomass was harvested after 7 days through centrifugation. The biomass required for lipids and protein analysis was separated, and the remainder was dried in an oven at 80 °C. Protein content was determined through the Lowry method, as was performed by Mota et al. [24]. At the same time, lipid content was determined through the Bligh and Dyer method, as was performed by Chen et al. [25].

2.3. Acid Treatment of Dried Powder of C. vulgaris

C. vulgaris dried biomass was pulverized into powder form and treated with 0.1 N H2SO4. The protonated/acid-treated microalgae biomass was washed with distilled water and air dried. Finally, the biomass that was previously starved and then treated with acid was stored at room temperature and used for further adsorption experiment.

2.4. Adsorption Experiment with C. vulgaris Dried Biomass

The adsorption experiment was performed in an orbital shaker. The effect of different concentrations of algal biomass was examined with different concentrations of phenol and 2-chlorophenol under different time intervals. C. vulgaris-dried biomass of 50, 100, and 200 mg L−1 was used with 100 and 200 mg L−1 for phenol and 70 and 150 mg L−1 for 2-chlorophenol solution separately. Sample were taken after 60, 120, and 180 min intervals and analyzed. Samples were filtered with filter paper and retained for analysis on a UV visible spectrophotometer in the dark. The samples for phenol were analyzed at 270 nm. The removal percentage of phenol and 2-chlorophenol was determined by using the formula as given below [23].
%   removal =   Initial   concentration   Final   concentration Initial   concentration × 100
The initial concentration is the concentration used for the experiment, and the final concentration is the amount left in the solution after the experiment. Results were further statistically analyzed.

2.5. Statistical Analysis

A statistical test was performed using Microsoft Excel and SPSS software. Furthermore, an analysis of variance (one-way ANOVA) was performed, and the Duncan test was used to evaluate the significance level (p < 0.05). In order to check the normality of data, a Shapiro–Wilk normality test was performed. Further, the two-way MANOVA (multivariate analysis of variance) was performed for the 5 provided factors. These factors included dried biomass (50, 100, and 200 mg L−1), contaminants concentration (0, 100, and 200 mg L−1 for phenol, and 0, 70, and 150 mg L−1 for 2-chlorophenol), time (60, 120, and 180 min), modification (acid-modified or non-modified), and starvation (phosphorus starvation at 0, 25, 50, 75, and 100%). The individual and combined effect of the supplied factors was investigated. Hence, in this way, 5 individual conditions, 10 conditions with two factors, 10 conditions with three factors, 5 conditions with four factors, and 1 condition with all five factors were analyzed using statistical analysis (details for the number of observations are presented in Supplementary Table S1). Lastly, hierarchical clustering was performed to check the link and relationship between the studied factor, and the results are presented in a dendrogram. The data for the agglomeration schedule are presented in Supplementary Table S2.

3. Results

3.1. Effect of Phosphorous Starvation on the Lipid and Protein Content of C. vulgaris

Phosphorus (P) limitation enhanced the lipid content while reducing protein content in C. vulgaris (Table 1). The highest lipid content of 117 mg g−1 DW (dried weight) was determined at complete starvation of P in media, and was 7.8 times more than the lipid content when C. vulgaris was grown in normal media (no P starvation). The lowest protein content of 0.017% was determined at 100% P starvation condition, and was 7.2 times lower than that of the C. vulgaris growing in normal media (no P starvation) (Table 1).

3.2. Phenol Removal by Dried C. vulgaris

3.2.1. Effect of Phosphorus Starvation on Phenol Removal

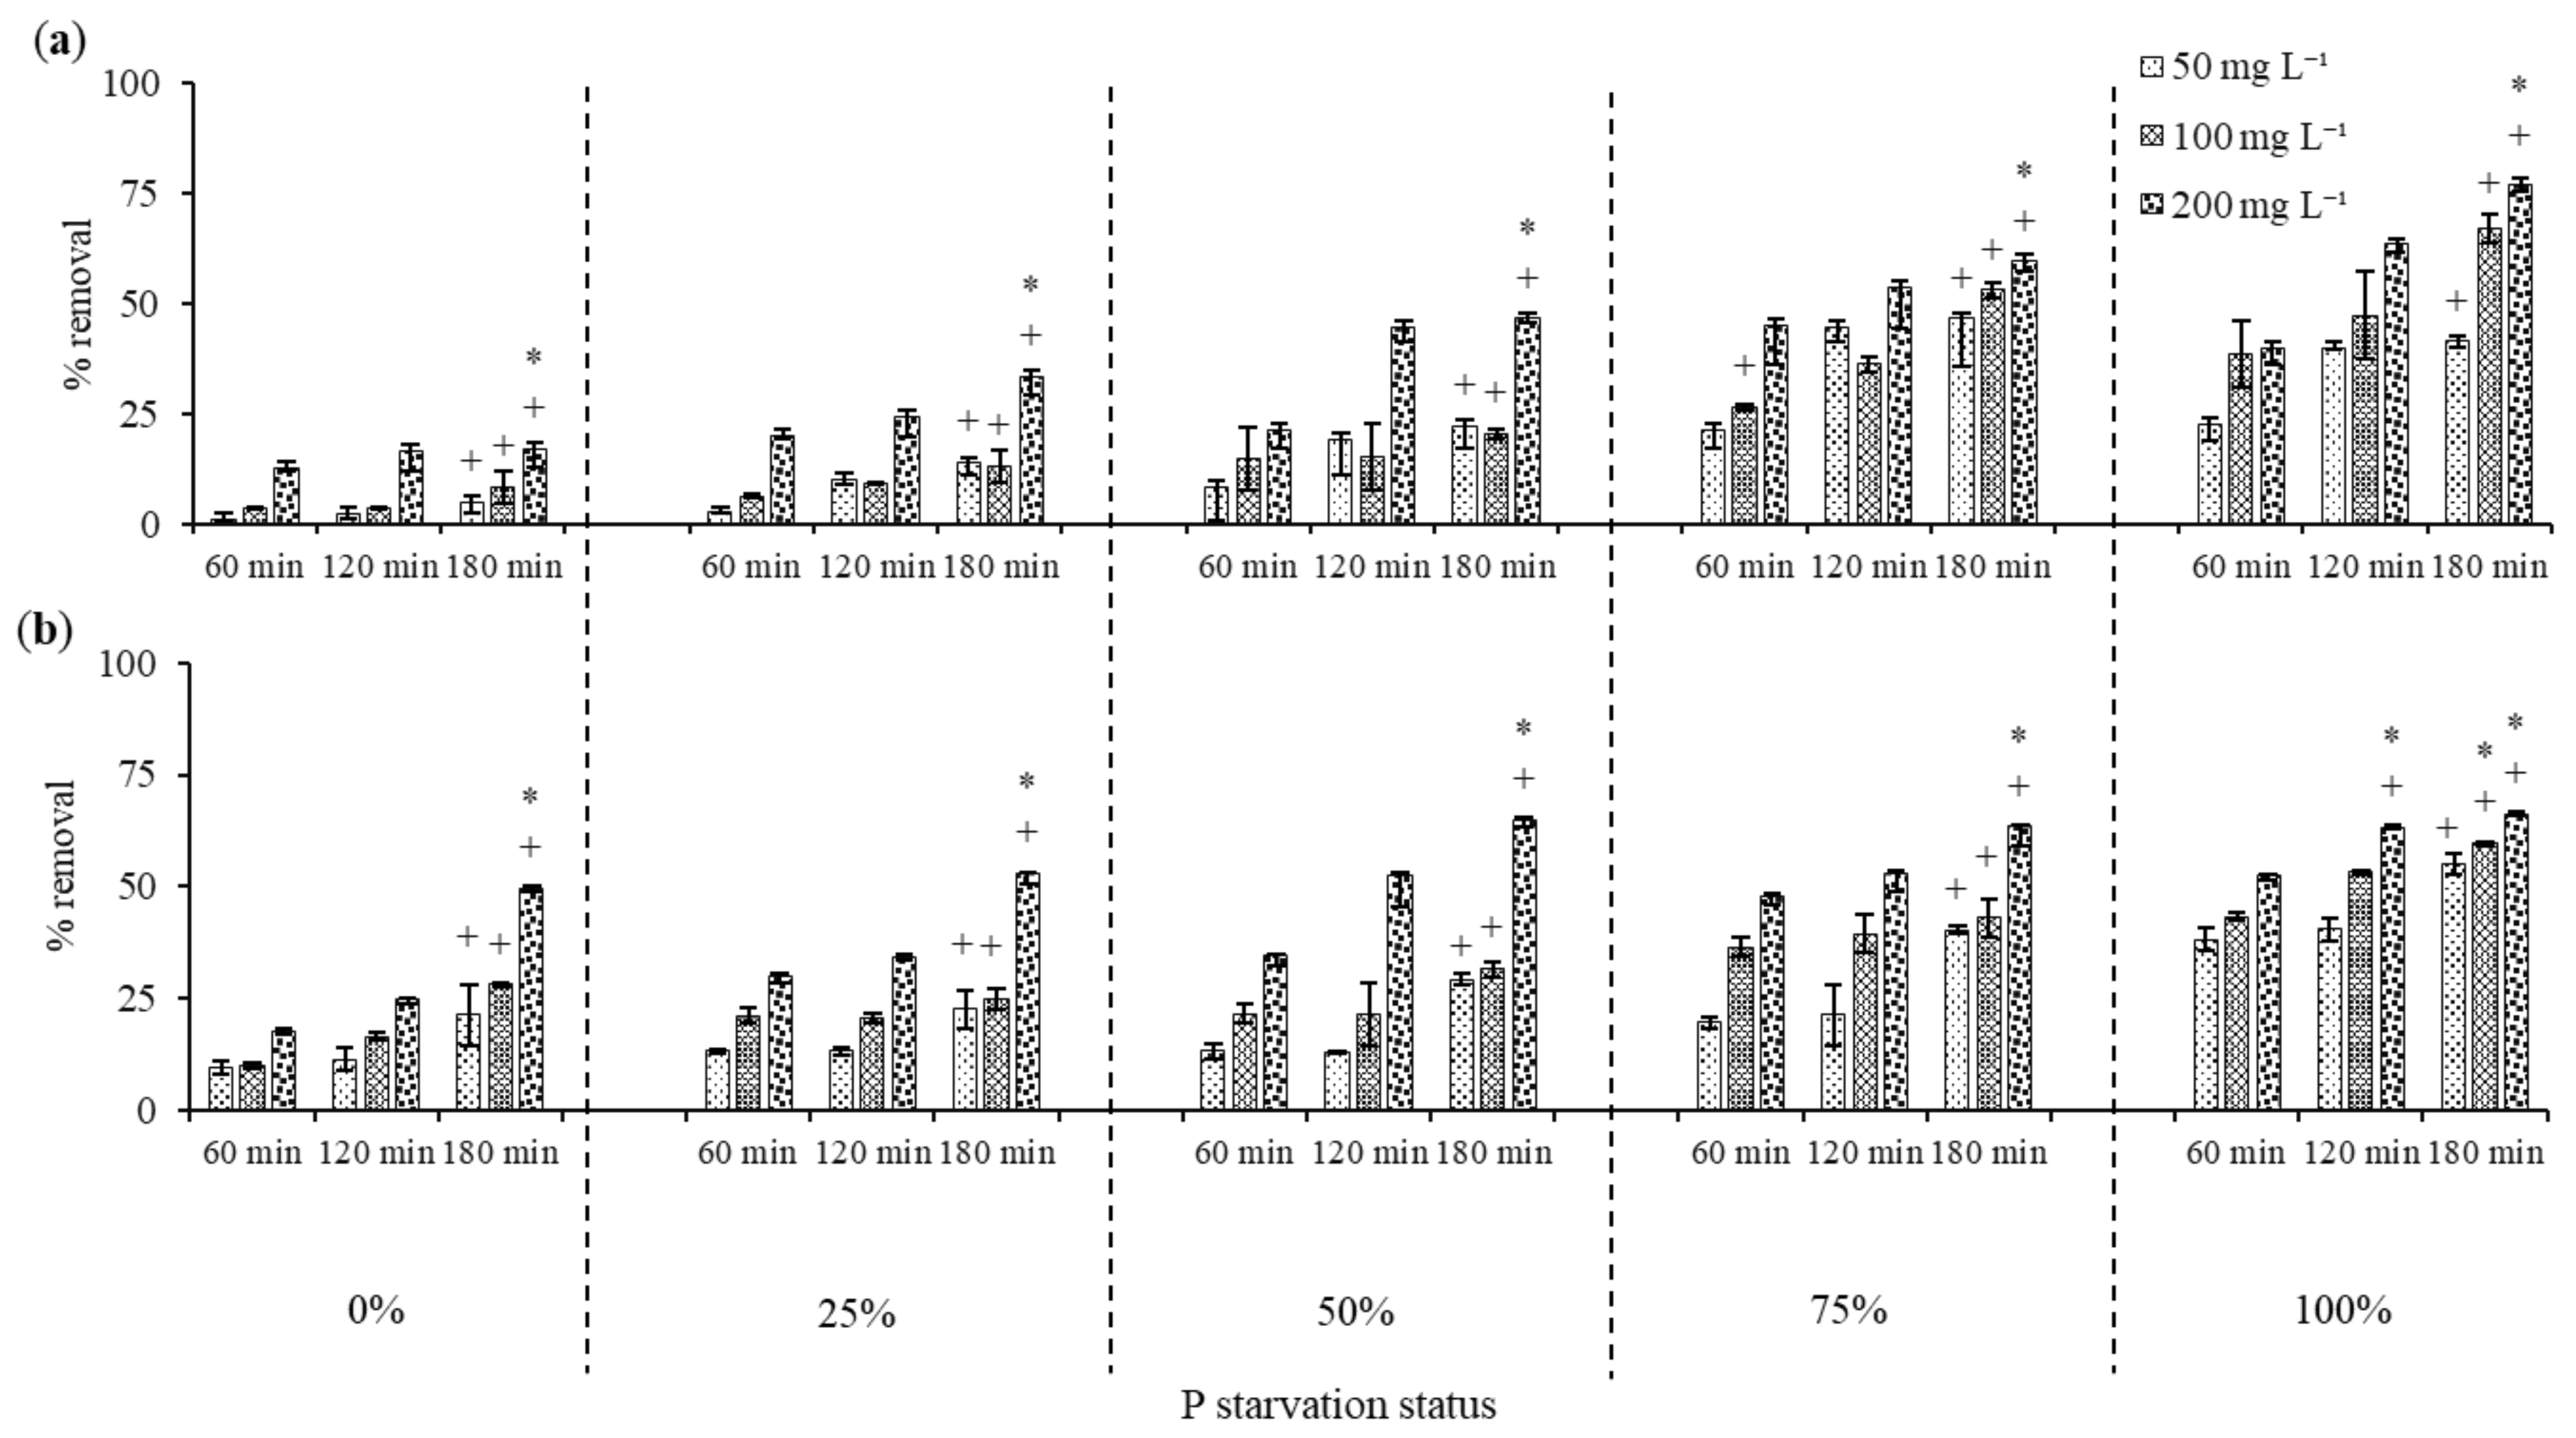
Phenol removal increased significantly when the C. vulgaris biomass obtained during the phosphorus (P) starved conditions was used as adsorbent (Figure 1). Initially, the removal of phenol by the biomass of 200 mg L−1 from non P-starved C. vulgaris was 9% at 100 mg L−1 phenol concentration after 180 min (Figure 1a). Phenol removal increased significantly with increasing time, and as the P in the growth medium of C. vulgaris reduced. Maximum phenol removals of 18, 33, 54, and 69% were determined after 180 min by 200 mg L−1 of biomass when C. vulgaris was grown at 25, 50, 75, or 100% P-starved conditions, respectively (Figure 1a). At biomass 50 and 100 mg L−1, the maximum phenol removal was 41 and 67% after 180 min at 100% P starvation, respectively. At 200 mg L−1 phenol concentration, the maximum removal of phenol after 60 min was 39% by C. vulgaris when grown in completely P-starved conditions (Figure 1b). In the case of 200 mg L−1 phenol in the solution, less removal by the biomass of C. vulgaris was determined as compared to that of 100 mg L−1 phenol concentration (Figure 1a,b). Maximum phenol removal at 200 mg L−1 of phenol was 59% after 180 min by 200 mg L−1 of C. vulgaris biomass, which was grown in 100% P starvation conditions (Figure 1b).

3.2.2. Phenol Removal by Acid Treated C. vulgaris Biomass

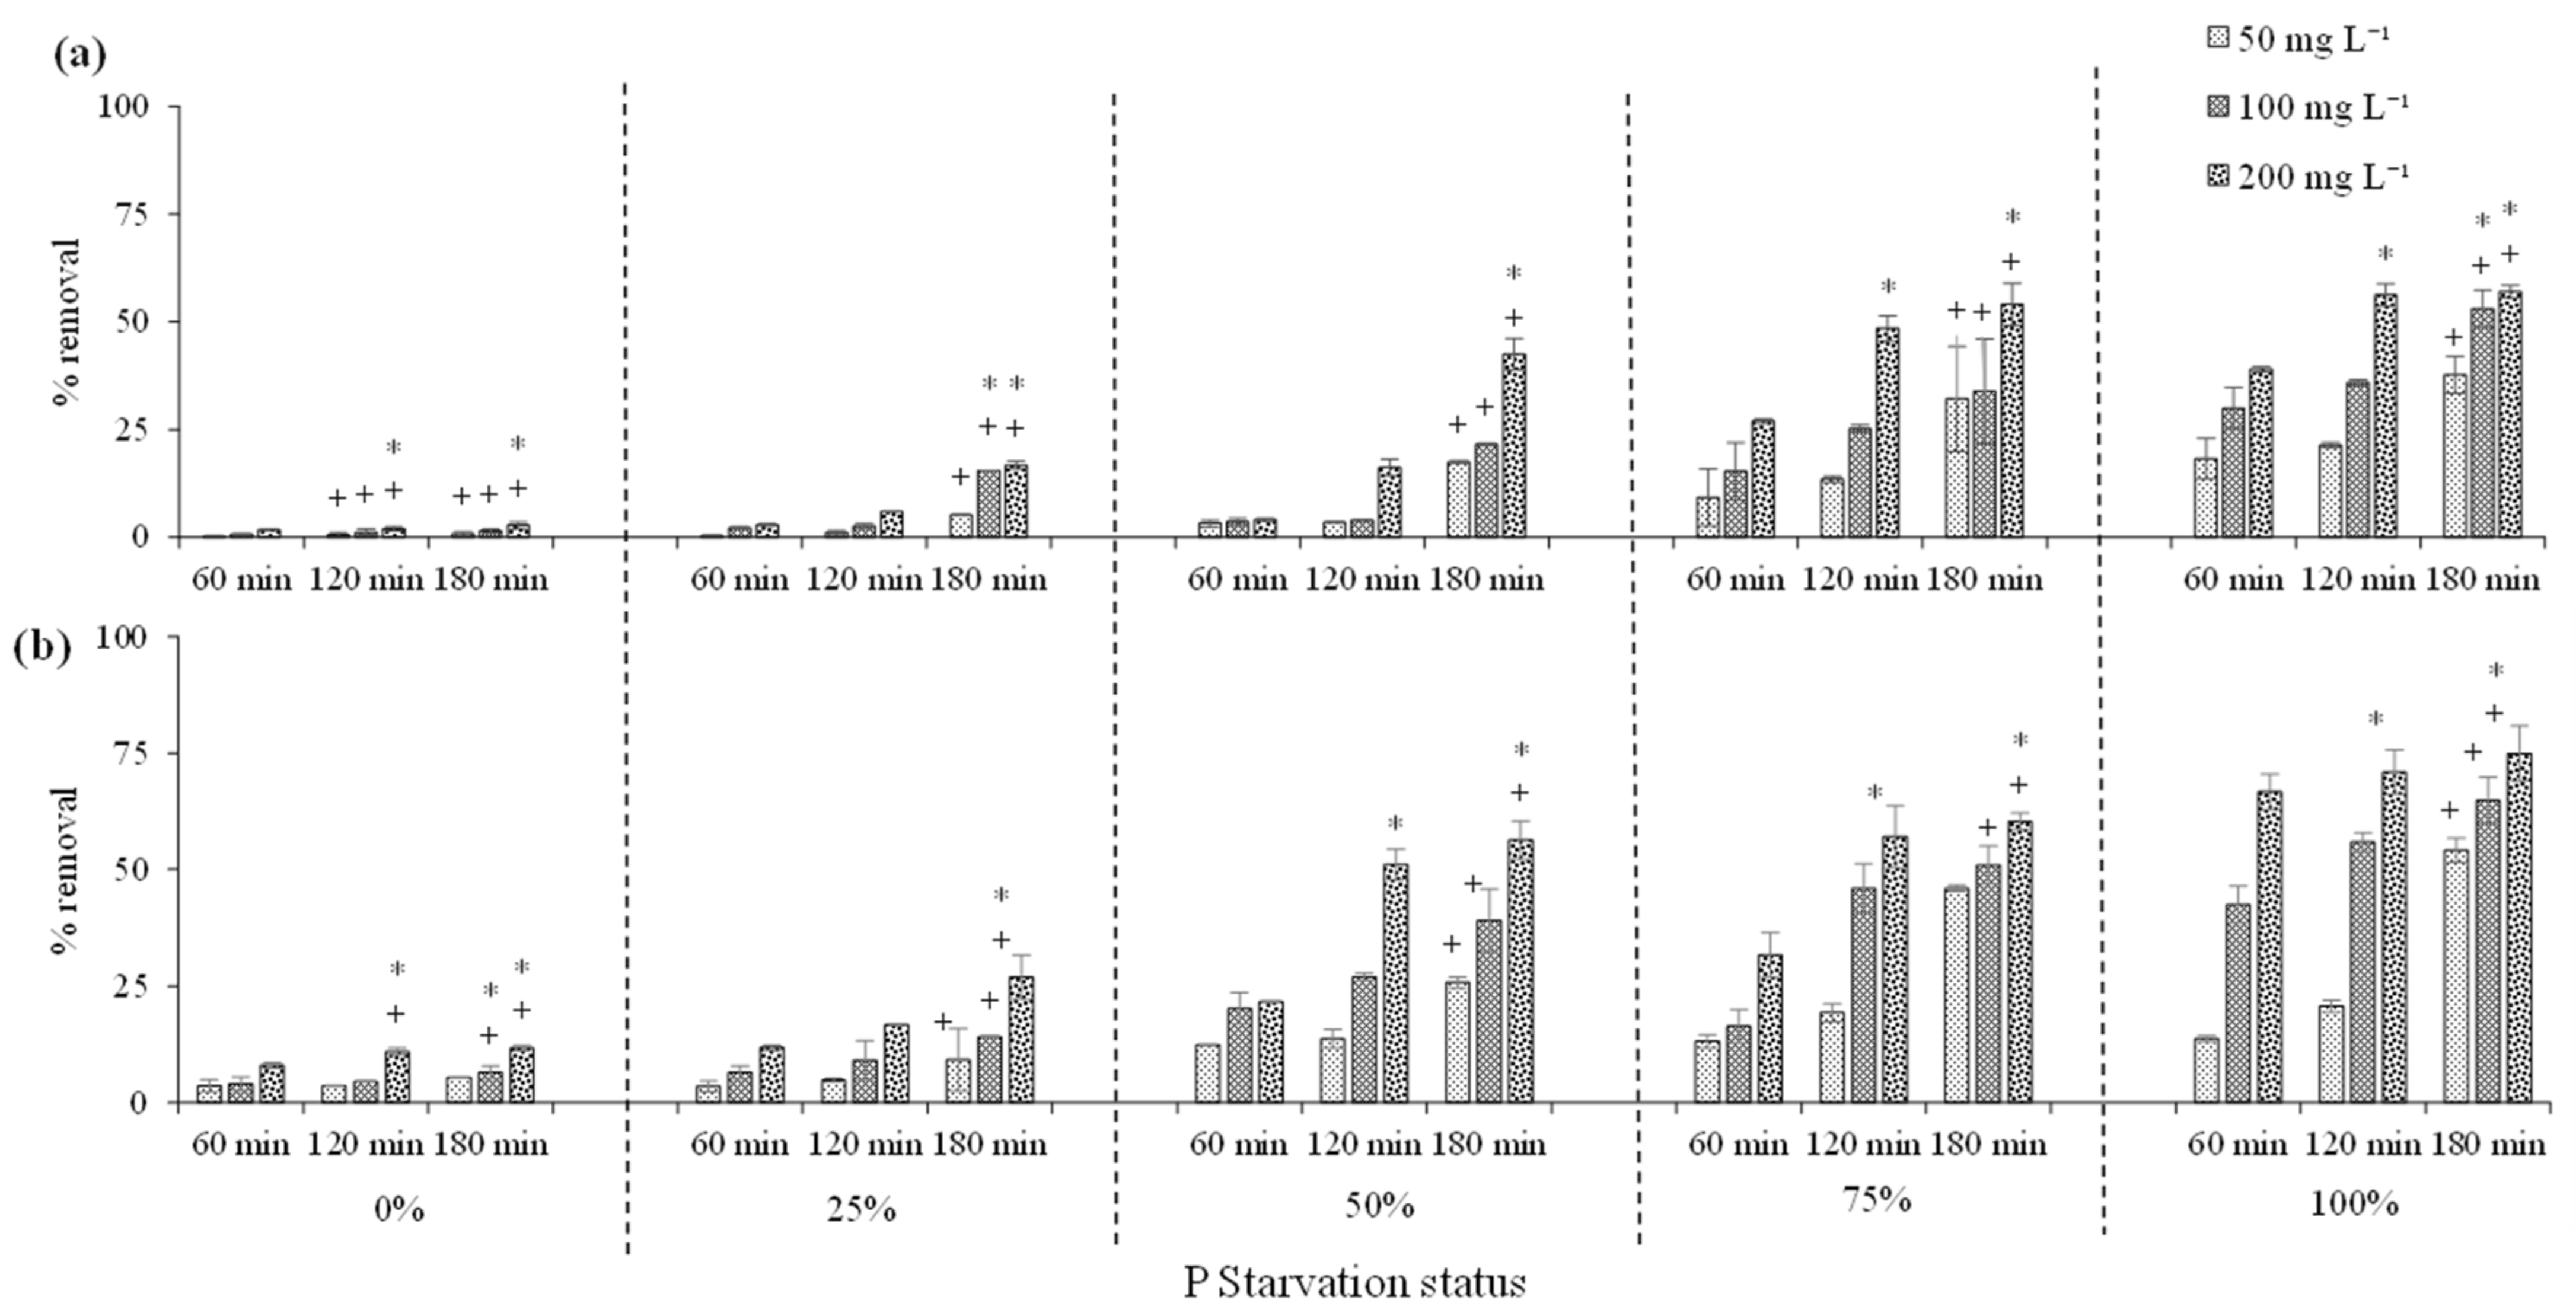
C. vulgaris biomass grown at different P concentrations was further treated with acid and used for phenol removal from the water. Phenol removal increased significantly with acid treatment. The highest phenol removal of 17, 33, 46, 59, and 77% was obtained in 0, 25, 50, 75, and 100% P-starved conditions and acidified biomass (200 mg L−1) (Figure 2a) after 180 min, when phenol content was 100 mg L−1. The removal of phenol content at 200 mg L−1 was 49, 52, 62, 63, and 66% for 0, 25, 50, 75, and 100% P starvation conditions after 180 min, respectively (Figure 2b). By increasing the C. vulgaris biomass from 50 mg L−1 to 200 mg L−1, phenol was increased significantly. The highest removal of phenol was 41.4% when acid-treated C. vulgaris biomass of 50 mg L−1 was used at 100 mg L−1 of phenol concentration, while phenol removal reached 67 and 77% when acid-treated biomass was increased to 100 and 200 mg L−1, respectively (Figure 2a). Phenol removal improved as the adsorption time increased from 60 min to 120 and 180 min. The phenol removal at 60 min was 52%, which increased to 63 and 66% at 120 and 180 min, respectively, at 200 mg L−1 of phenol concentration and 200 mg L−1 of 100% P-starved and acid treated C. vulgaris biomass (Figure 2b). Lower phenol removal was recorded at 200 mg L−1 as compared to at 100 mg L−1 of phenol with C. vulgaris which was P-starved and acid treated. The maximum phenol removal at 100 mg L−1 of phenol concentration was 77% (Figure 2a), while at 200 mg L−1 of phenol concentration, phenol removal was 66% (Figure 2b) after 180 min with the 200 mg L−1 of C. vulgaris that was P-starved and acid treated.

3.3. 2-Chlorophenol Removal by Dried C. vulgaris

3.3.1. Effect of Phosphorus Starvation on 2-Chlorophenol Removal

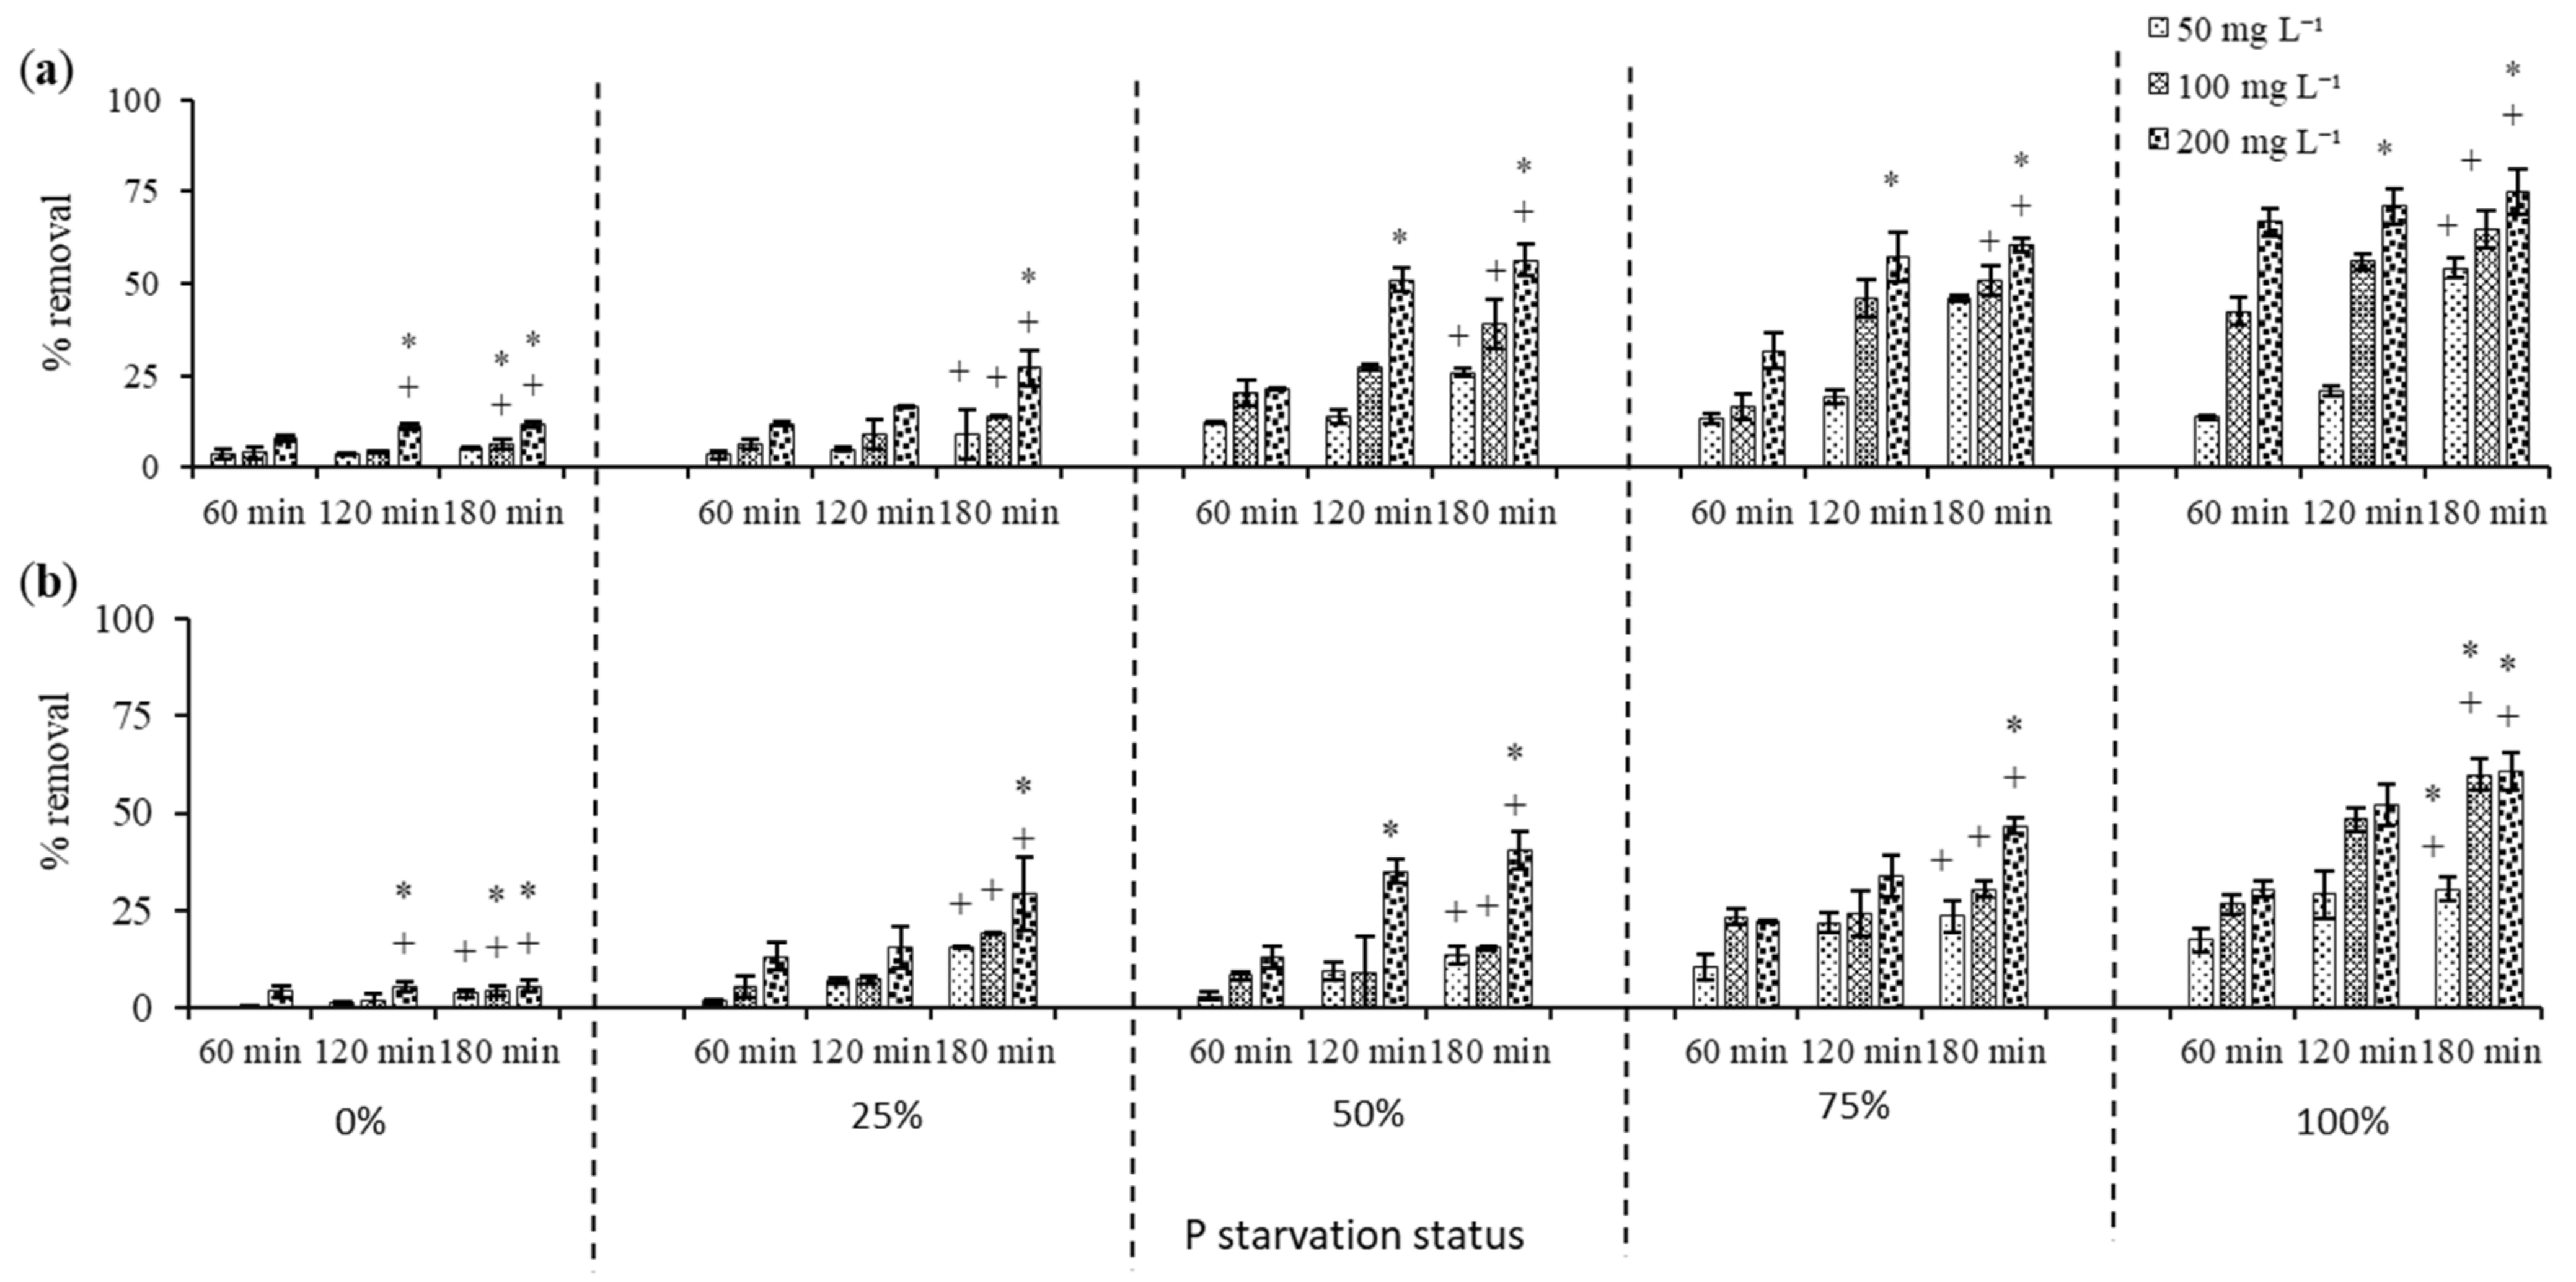
Removal of 2-chlorophenol by C. vulgaris dry matter significantly improved as the P starvation increased (Figure 3a). In case of 70 mg L−1 of 2-chlorophenol in external solution, the highest removal, at 18, 21 and 38%, was found after 60, 120 and 180 min, respectively, at 100% P starvation when the dried C. vulgaris used was 50 mg L−1. Similarly, 30, 36, and 53%, and 39, 56, and 57% 2-chlorophenol removal was found when 100 and 200 mg L−1 of dried C. vulgaris was used as adsorbent, respectively, and after 60, 120, and 180 min, respectively (Figure 3a). 2-chlorophenol adsorption by dried C. vulgaris reduced as the time and P starvation reduced.
In the case of 150 mg L−1 of 2-chlorophenol in external solution, the highest removal values of 8, 20, and 30% were found after 60, 120, and 180 min, respectively, at 100% P starvation when the dried C. vulgaris used was 50 mg L−1. Similarly, 11, 26, and 37%, and 15, 18, and 42% 2-chlorophenol removal was found when 100 and 200 mg L−1 of dried C. vulgaris was used as adsorbent, respectively, and after 60, 120 and 180 min, respectively (Figure 3b). 2-chlorophenol adsorption by dried C. vulgaris increased as the time and P starvation increased.

3.3.2. 2-Chlorophenol Removal by Acid Treated C. vulgaris Biomass

Acid treatment of C. vulgaris dried biomass, in addition to P starvation, further enhanced the removal of 2-chlorophenol from water (Figure 4). At both 70 and 150 mg L−1 of 2-chlorophenol, the acid-treated C. vulgaris increased significantly with time and P starvation. In the case of 70 mg L−1 of 2-chlorophenol in external solution, the highest removal, at 13, 20, and 54%, was found after 60, 120, and 180 min, respectively, at 100% P starvation when the acid treated dried C. vulgaris used was 50 mg L−1. Similarly, 42, 56, and 65%, and 67, 71, and 75% 2-chlorophenol removal was found when 100 and 200 mg L−1 of acid treated dried C. vulgaris was used as adsorbent, respectively, and after 60, 120 and 180 min, respectively (Figure 4a).
In the case of 150 mg L−1 of 2-chlorophenol in external solution, the highest removal values of 17, 29, and 30% were found after 60, 120, and 180 min, respectively, at 100% P starvation when the acid treated dried C. vulgaris used was 50 mg L−1. Similarly, 26, 48, and 60%, and 30, 52, and 61% 2-chlorophenol removal was found when 100 and 200 mg L−1 of acid treated dried C. vulgaris was used as adsorbent, respectively, and after 60, 120 and 180 min, respectively (Figure 4b).

3.4. Interactive Effect of Applied Factors on Contaminant Removal and Data Clustering

The analysis summary of the two-way MANOVA for the phenol removal against the applied treatment/factors is presented in Supplementary Table S3, while for 2-chlorophenol removal, it is presented in Supplementary Table S4. In Supplementary Tables S3 and S4, the factors are presented as biomass, that is, the dead microalgal biomass added to treatment for removal. The concentration represents the concentrations of phenolic contaminants, time represents indicating the duration of treatments carried, the modification represents the biomass modification by acidification, and starvation represents the phosphorus starvation during the growth of algal biomass. Interestingly, the impact of all applied factors on the phenol was statistically significant, except in the case of a combination of time * modification, where the impact was statistically insignificant. Similarly, in most cases, for the 2-chlorophenol removal, the individual and interactive effects were significant. However, the interaction showed a statistically insignificant effect for Biomass × Concentration × Modification, Biomass × Time × Modification, Concentration × Time × Modification, and Biomass × Time × Modification × Starvation. One of the most common understandings drawn from Supplementary Tables S3 and S4 is that starvation was the most decisive factor that significantly impacted phenolics removal. It was also visible in the hierarchical cluster analysis of the data (Figure 5). This indicates that for phenol and 2-chlorophenol, the removal data for the studied variables (C. vulgaris biomass, duration of treatment, concentration of contaminants, chemical modification, phosphorus starvation, and phenolic removal) were analyzed, and two sharp clusters were obtained. This clustering indicates a strong relationship between the variables. Group 1 included biomass, time, and concentration, while group 2 included phenolic removal, biomass starvation, and chemical modification. The agglomeration schedule coefficient for the clustering of group 2 for phenol was 7,836,374.324, and for 2-chlorophenol, it was 8,101,679.888 (Supplementary Table S2).

4. Discussion

This experiment was conducted in order to study the adsorption efficiency of the green microalgae C. vulgaris for phenol and 2-chlorophenol removal by limiting phosphorus, an imperative nutrient, and treating microalgae with sulfuric acid. Algae’s robust and versatile nature enables it to survive in harsh conditions by changing its cellular lipid level. For the removal of phenol and its compounds from contaminated water, the use of algal biomass is a very effective method [26]. High lipid production in algae can be achieved by creating stressed conditions. It has been shown that algae are capable of adsorbing and degrading many pollutants, which are widely used in the removal of organic pollutants such as phenols. This is due to their high utilization rate of energy from sunlight, fast growth, strong adaptability, and diverse culture methodologies [26]. For example, nutrient depletion during the growth period of microalgae changes its lipid content. Starvation of or a reduction in phosphorus can boost lipid content, but at the expense of its growth rate [19,27].
Adsorption, degradation, and accumulation are the three primary processes by which phenolic compounds can be removed from biological materials [28,29]. Phosphorus is a vital element required for the growth of algal cells. It helps to form nucleic acid, phospholipid, and phosphorylated sugar. Moreover, it promotes energy generation in the form of ATP and NADP. The reduction in phosphorus content during microalgal growth disrupts central cell function and leads to growth retardation. In these conditions, cells stop producing new membranes and compounds required for the growth. Therefore, the cell machinery begins producing fatty acids and storing them as triacylglycerides in order to cope with the stress. Hence, it can be said that algal biomass production and biochemical composition are influenced by the nutrient ratio (including nitrogen and phosphorus) in wastewater and the culture medium [30]. The phospholipid degradation slows protein and carbohydrate synthesis, which provides the intermediate required for cell function [31]. A study conducted on Scenedesmus sp. proposed that lipid production increases as phosphorus is removed from media. At maximum, complete removal of phosphorus from nutrient media, the lipid obtained was 41% of the dry weight [32]. In another study on Chlorella sp., nitrogen reduction enhanced lipid content by up to 21.8%, while phosphorus reduction improved lipid content by 13.9% [33]. Rocha [34] investigated cadmium stress on the phosphorus-starved C. vulgaris microalgae. Yalcin [35] found that the reduction in phosphorus from 240 to 16 µmol led to the increase in lipid content from 1.24 to 4.89% in C. vulgaris microalgae. According to this study, the removal of all phosphorus resulted in an 86% decrease in protein content (Table 1). Aside from lipid production, the starvation of phosphorus also enhanced the biosorption capacity of the microalgae. In this study, we investigated the potential of dried C. vulgaris starved with different phosphorous concentrations for the purpose of removing phenol and 2-chlorophenol from water. The removal rate of phenol and 2-chlorophenol increased by decreasing the phosphorus content from the growth media of the microalgae (Figure 1 and Figure 3).
Adsorption is affected by treatment parameters, including initial pH, mass concentration, contact time, and temperature. According to biosorption studies [36], 2-chlorophenol is more absorbed than 4-chlorophenol. Along with starvation of phosphorus, treatment of microalgae with sulfuric acid further enhanced the removal rate of phenol. Through the dissolution of polysaccharide compounds in algal biomass, the acid treatment created more adsorption sites. The treatment may also have protonated some sites present on the cell walls which bound more phenol to the algal biomass [37]. At pH 6.5 and 200 g L−1 2,4-dichlorophenol concentration, the removal efficiency was 100% [38]. The removal rate of phenol and 2-chlorophenol at 100 and 200 mg L−1, and 70 and 150 mg L−1, respectively, increased with time and biomass (Figure 2 and Figure 4). C. vulgaris biomass was able to remove phenol and 2-chlorophenol up to 70% in 180 min, 15–10% more than non-acidified biomass adsorption for phenol and 2-chlorophenol, respectively (Figure 1, Figure 2, Figure 3 and Figure 4). The results of our study are comparable to those of Agrawal et al. [39], where the removal efficiency of phenol was 85% at 350 min. As algal biomass increased, phenol adsorption sites also increased, so the absorption rate increased, as in the case of S. maxima [40]. Hence, phosphorus removal from the growth media of C. vulgaris with acidification is the most effective option for treating wastewater containing phenol and 2-chlorophenol. Microalgal biomass can be expressed empirically using CO0.48H1.83N0.11P0.01 [30]. As a result of this, the N to P ratio is 11:1. It would be very interesting to investigate the effect of varied N and P loading (both together and separately) on biomass production and changes in the biochemical properties of algal biomass.
Microalgae contain many functional groups that promote biosorption [41]. Hydrophobic interaction can be the major driving force in the phenol–algae interaction. The biosorption of phenol through dead microalgal biomass is mainly carried out through donor–acceptor and hydrophobic interactions [42]. Zheng et al. [43] studied the adsorption potential of three microalgal strains (namely, Chlorella sp., Chlamydomonas sp. and Coelastrum sp.) for p-nitrophenols (PNP). A future study could analyze the composition of details related to the mechanism based on identifying functional groups in the dead algal biomass. In the present study, Chlorella sp. exhibited a higher removal rate, which is 250 and 140% greater than other species. This could be due to the presence of functional polar groups present in the biomass of Chlorella sp., as the FTIR analysis by Zheng et al. [43] indicated that the Chlorella sp. contains more polar functional groups than other studied algae. Moreover, in all strains, the oxygen-containing functional group plays a significant role in removing p-nitrophenols. Similarly, Ata et al. [44] utilized the Gracilaria verrucosa for biosorption of phenoxy alkanoic acid herbicide 2,4-D. Acid treatment improved the biosorption capacity of 2,4-D up to 47%. Furthermore, the FTIR analysis indicated that the presence of ionized functional groups such as hydroxyl, carboxyl, and amino are responsible for the biosorption of 2,4-D.
The biosorption of phenol, 2-chlorophenol, and 4-chlorophenol through macroalgae, Sargassum muticum, was observed, and it was found that the microalgae removed 80% phenol, 34% 2-chlorophenol, and 53% 4-chlorophenol. FTIR analysis indicated the presence of NH2+, −NH+, −NH, carbonyl (-C-O), and carboxylic groups (-C=O), which are involved in the biosorption of phenolic compounds, and the hydrophobic and donor–acceptor interaction was a major driving force [45]. Phenolic compounds can be removed more effectively by protonating the surface, since phenol in water becomes phenoxide (C6H50) and is attracted to the positively charged site. In a study, the biomass of macroalgae, Caulerpa scalpelliformis, was treated with acid and used to eliminate phenol from tannery wastes. This treatment altered the surface of the algae and increased its biosorption capacity by up to 80% [46]. In this way, it is not wrong to say that the surface morphology of biomass plays a significant role in the biosorption of metal and other contaminants, and, hence, it would be interesting to analyze the changes in biomass surface due to modification using advanced tools such as scanning electron microscopy, energy dispersive X-ray spectroscopy, and X-ray Powder Diffraction.

5. Conclusions

Our experimental results suggested that removing phosphorus from the growth media of C. vulgaris improved the lipid concentration and enhanced its ability to remove phenol and 2-chlorophenol by up to 69 and 57%, respectively. However, complete phosphorous starvation reduced C. vulgaris biomass and protein content. The acid treatment further improved the adsorption capacity of C. vulgaris dried biomass. This study suggests that biomass of C. vulgaris grown with less phosphorus and acidified may be the best option for phenol and 2-chlorophenol adsorption from contaminated water.

Supplementary Materials

The following supporting information can be downloaded at: https://www.mdpi.com/article/10.3390/pr10112435/s1, Table S1: Experimental treatments and levels along with two-way MANOVA summary for replicates for contaminant removal by Chlorella vulgaris dried biomass; Table S2: Details of agglomeration schedule for cluster analysis for (a) phenol and (b) 2-chlorophenol removal by Chlorella vulgaris dried biomass with applied treatments; Table S3: Statistical analysis (two-way MANOVA) for phenol removal by Chlorella vulgaris dried biomass with applied treatments; Table S4: Statistical analysis (two-way MANOVA) for 2-chlorophenol removal by Chlorella vulgaris dried biomass with applied treatments.

Author Contributions

Formal analysis, A.H.A.K. and S.Y.; funding acquisition, T.A.B.; investigation, S.J.; methodology, C.R.M. and M.I.; project administration, B.A. and M.I.; software, S.Y.; supervision, M.I.; writing—original draft, S.J.; writing—review and editing, W.K., R.B. and T.A.B. All authors have read and agreed to the published version of the manuscript.

Funding

This research has been funded by Scientific Research Deanship at University of Ha’il—Saudi Arabia through project number RG-21 105.

Data Availability Statement

Not applicable.

Conflicts of Interest

The authors declare no conflict of interest.

References

  1. Guo, G.; Duan, R. A new method to determine the scale range of environmental damage caused by water pollution accidents. Water Supply 2022, 22, 3968–3979. [Google Scholar] [CrossRef]
  2. Hussain, F.; Hussain, I.; Khan, A.H.A.; Muhammad, Y.S.; Iqbal, M.; Soja, G.; Reichenauer, T.G.; Yousaf, S. Combined application of biochar, compost, and bacterial consortia with Italian ryegrass enhanced phytoremediation of petroleum hydrocarbon contaminated soil. Environ. Exp. Bot. 2018, 153, 80–88. [Google Scholar] [CrossRef]
  3. Raza, A.; Khan, A.H.A.; Nawaz, I.; Qu, Z.; Yousaf, S.; Ali, M.A.; Sayal, A.U.; Iqbal, M. Evaluation of arsenic-induced stress in Dahlia pinnata Cav.: Morphological and physiological response. Soil Sediment Contam. 2019, 28, 716–728. [Google Scholar] [CrossRef]
  4. Manzoor, M.; Khan, A.H.A.; Ullah, R.; Khan, M.Z.; Ahmad, I. Environmental epidemiology of cancer in South Asian population: Risk assessment against exposure to polycyclic aromatic hydrocarbons and volatile organic compounds. Arab. J. Sci. Eng. 2016, 41, 2031–2043. [Google Scholar] [CrossRef]
  5. Salaudeen, T.; Okoh, O.; Okoh, A. Performance assessment of wastewater treatment plants with special reference to phenol removal. Int. J. Environ. Sci. Technol. 2019, 16, 401–412. [Google Scholar] [CrossRef]
  6. Albuquerque, B.R.; Heleno, S.A.; Oliveira, M.B.P.P.; Barros, L.; Ferreira, I.C.F.R. Phenolic compounds: Current industrial applications, limitations, and future challenges. Food Funct. 2021, 12, 14–29. [Google Scholar] [CrossRef]
  7. Khan, A.H.A.; Ayaz, M.; Arshad, M.; Yousaf, S.; Khan, M.A.; Anees, M.; Sultan, A.; Nawaz, I.; Iqbal, M. Biogeochemical cycle, occurrence and biological treatments of polycyclic aromatic hydrocarbons (PAHs). Iran. J. Sci. Technol. A 2019, 43, 1393–1410. [Google Scholar] [CrossRef]
  8. Hussain, F.; Khan, A.H.A.; Hussain, I.; Farooqi, A.; Muhammad, Y.S.; Iqbal, M.; Arslan, M.; Yousaf, S. Soil conditioners improve rhizodegradation of aged petroleum hydrocarbons and enhance the growth of Lolium multiflorum. Environ. Sci. Pollut. R 2021, 29, 9097–9109. [Google Scholar] [CrossRef]
  9. Qurban, M.; Mirza, C.R.; Khan, A.H.A.; Khalifa, W.; Boukendakdji, M.; Achour, B.; Yousaf, S.; Nawaz, I.; Butt, T.A.; Iqbal, M. Metal accumulation profile of Catharanthus roseus (L.) G.Don and Celosia argentea L. with EDTA co-Application. Processes 2021, 9, 598. [Google Scholar] [CrossRef]
  10. Khan, A.H.A.; Anees, M.; Arshad, M.; Muhammad, Y.S.; Iqbal, M.; Yousaf, S. Effects of illuminance and nutrients on bacterial photo-physiology of hydrocarbon degradation. Sci. Total Environ. 2016, 557, 705–711. [Google Scholar] [CrossRef]
  11. Narayanan, M.; Prabhakaran, M.; Natarajan, D.; Kandasamy, S.; Raja, R.; Carvalho, I.S.; Ashokkumar, V.; Chinnathambi, A.; Alharbi, S.A.; Devarayan, K.; et al. Phycoremediation potential of Chlorella sp. on the polluted Thirumanimutharu river water. Chemosphere 2021, 277, 130246. [Google Scholar] [CrossRef] [PubMed]
  12. El-Gendy, N.S.; Nassar, H.N. Phycoremediation of phenol-polluted petro-industrial effluents and its techno-economic values as a win-win process for a green environment, sustainable energy and bioproducts. J. Appl. Microbiol. 2021, 131, 1621–1638. [Google Scholar] [CrossRef] [PubMed]
  13. Lee, X.J.; Ong, H.C.; Ooi, J.; Yu, K.L.; Tham, T.C.; Chen, W.H.; Ok, Y.S. Engineered macroalgal and microalgal adsorbents: Synthesis routes and adsorptive performance on hazardous water contaminants. J. Hazard. Mater. 2022, 423, 126921. [Google Scholar] [CrossRef] [PubMed]
  14. Spain, O.; Plöhn, M.; Funk, C. The cell wall of green microalgae and its role in heavy metal removal. Physiol. Plant. 2021, 173, 526–535. [Google Scholar] [CrossRef] [PubMed]
  15. Gondi, R.; Kavitha, S.; Kannah, R.Y.; Karthikeyan, O.P.; Kumar, G.; Tyagi, V.K.; Banu, J.R. Algal-based system for removal of emerging pollutants from wastewater: A review. Bioresour. Technol. 2022, 344, 126245. [Google Scholar] [CrossRef]
  16. Habibzadeh, M.; Chaibakhsh, N.; Naeemi, A.S. Optimized treatment of wastewater containing cytotoxic drugs by living and dead biomass of the freshwater microalga, Chlorella vulgaris. Ecol. Eng. 2018, 111, 85–93. [Google Scholar] [CrossRef]
  17. Yaashikaa, P.R.; Kumar, P.S.; Saravanan, A.; Vo, D.V.N. Advances in biosorbents for removal of environmental pollutants: A review on pretreatment, removal mechanism and future outlook. J. Hazard. Mater. 2021, 420, 126596. [Google Scholar] [CrossRef]
  18. Song, X.; Liu, B.-F.; Kong, F.; Ren, N.Q.; Ren, H.-Y. Overview on stress-induced strategies for enhanced microalgae lipid production: Application, mechanisms and challenges. Resour. Conserv. Recycl. 2022, 183, 106355. [Google Scholar] [CrossRef]
  19. Yaakob, M.A.; Mohamed, R.M.S.R.; Al-Gheethi, A.; Ravishankar, G.A.; Ambati, R.R. Influence of nitrogen and phosphorus on microalgal growth, biomass, lipid, and fatty acid production: An overview. Cells 2021, 10, 393. [Google Scholar] [CrossRef]
  20. Ghafari, M.; Rashidi, B.; Haznedaroglu, B.Z. Effects of macro and micronutrients on neutral lipid accumulation in oleaginous microalgae. Biofuels 2016, 9, 147–156. [Google Scholar] [CrossRef]
  21. Obulisamy, P.K.; Verma, P.; Seoane, R.; Santaeufemia, S.; Abalde, J.; Torres, E. Efficient removal of methylene blue using living biomass of the microalga Chlamydomonas moewusii: Kinetics and equilibrium studies. Int. J. Environ. Res. Public Health 2022, 19, 2653. [Google Scholar]
  22. Lavrinovičs, A.; Mežule, L.; Juhna, T. Microalgae starvation for enhanced phosphorus uptake from municipal wastewater. Algal Res. 2020, 52, 102090. [Google Scholar] [CrossRef]
  23. Rajalakshmi, A.M.; Silambarasan, T.; Dhandapani, R. Biosorption of heavy metals from tannery effluents by using green unicellular microalga, Tetradesmus obliquus RDRL01. Appl. Biol. Res. 2022, 24, 28–37. [Google Scholar] [CrossRef]
  24. Mota, M.F.S.; Souza, M.F.; Bon, E.P.S.; Rodrigues, M.A.; Freitas, S.P. Colorimetric protein determination in microalgae (Chlorophyta): Association of milling and SDS treatment for total protein extraction. J. Phycol. 2018, 54, 577–580. [Google Scholar] [CrossRef]
  25. Chen, W.; Liu, Y.; Song, L.; Sommerfeld, M.; Hu, Q. Automated accelerated solvent extraction method for total lipid analysis of microalgae. Algal Res. 2020, 51, 102080. [Google Scholar] [CrossRef]
  26. Kong, W.; Yang, S.; Guo, B.; Wang, H.; Huo, H.; Zhang, A.; Niu, S. Growth behavior, glucose consumption and phenol removal efficiency of Chlorella vulgaris under the synergistic effects of glucose and phenol. Ecotox. Environ. Saf. 2019, 186, 109762. [Google Scholar] [CrossRef]
  27. Liu, X.; Chen, G.; Tao, Y.; Wang, J. Application of effluent from WWTP in cultivation of four microalgae for nutrients removal and lipid production under the supply of CO2. Renew. Energy 2020, 149, 708–715. [Google Scholar] [CrossRef]
  28. Fawzy, M.A.; Alharthi, S. Cellular responses and phenol bioremoval by green alga Scenedesmus abundans: Equilibrium, kinetic and thermodynamic studies. Environ. Technol. Innov. 2021, 22, 101463. [Google Scholar] [CrossRef]
  29. Abdel-Raouf, N.; Sholkamy, E.N.; Bukhari, N.; Al-Enazi, N.M.; Alsamhary, K.I.; Al-Khiat, S.H.A.; Ibraheem, I.B.M. Bioremoval capacity of Co+2 using Phormidium tenue and Chlorella vulgaris as biosorbents. Environ. Res. 2022, 204, 111630. [Google Scholar] [CrossRef]
  30. Vazirzadeh, A.; Jafarifard, K.; Ajdari, A.; Chisti, Y. Removal of nitrate and phosphate from simulated agricultural runoff water by Chlorella vulgaris. Sci. Total Environ. 2022, 802, 149988. [Google Scholar] [CrossRef]
  31. Benavente-Valdés, J.R.; Aguilar, C.; Contreras-Esquivel, J.C.; Méndez-Zavala, A.; Montañez, J. Strategies to enhance the production of photosynthetic pigments and lipids in Chlorophycae species. Biotechnol. Rep. 2016, 10, 117–125. [Google Scholar] [CrossRef] [PubMed]
  32. Yang, F.; Xiang, W.; Li, T.; Long, L. Transcriptome analysis for phosphorus starvation-induced lipid accumulation in Scenedesmus sp. Sci. Rep. 2018, 8, 16420. [Google Scholar] [CrossRef] [PubMed] [Green Version]
  33. Anto, S.; Pugazhendhi, A.; Mathimani, T. Lipid enhancement through nutrient starvation in Chlorella sp. and its fatty acid profiling for appropriate bioenergy feedstock. Biocatal. Agric. Biotechnol. 2019, 20, 101179. [Google Scholar] [CrossRef]
  34. Rocha, G.S.; Lombardi, A.T.; Espíndola, E.L.G. Combination of P-limitation and cadmium in photosynthetic responses of the freshwater microalga Ankistrodesmus densus (Chlorophyceae). Environ. Pollut. 2021, 275, 116673. [Google Scholar] [CrossRef] [PubMed]
  35. Yalcin, D. Growth, lipid content, and fatty acid profile of freshwater cyanobacteria Dolichospermum affine (Lemmermann) Wacklin, Hoffmann, & Komárek by using modified nutrient media. Aquacult. Int. 2020, 28, 1371–1388. [Google Scholar]
  36. Senturk, I.; Buyukgungor, H. Equilibrium and kinetic studies on the biosorption of 2-chlorophenol and 4-chlorophenol by live Aspergillus niger. Ekoloji 2013, 22, 1–12. [Google Scholar] [CrossRef]
  37. Surkatti, R.; Al-Zuhair, S. Effect of cresols treatment by microalgae on the cells’ composition. J. Water Process. Eng. 2018, 26, 250–256. [Google Scholar] [CrossRef]
  38. Li, F.; Zhao, L.; Jinxu, Y.; Shi, W.; Zhou, S.; Yuan, K.; Sheng, G.D. Removal of dichlorophenol by Chlorella pyrenoidosa through self-regulating mechanism in air-tight test environment. Ecotox. Environ. Saf. 2018, 164, 109–117. [Google Scholar] [CrossRef]
  39. Agrawal, P.R.; Sharma, R.; Agrawal, A. Biosorption for eliminating organic contaminants from wastewater. In Biosorption for Wastewater Contaminants; Selvasembian, R., Singh, P., Eds.; John Wiley & Sons Ltd.: New York, NY, USA, 2021; pp. 63–78. [Google Scholar]
  40. Touliabah, H.E.S.; El-Sheekh, M.M.; Ismail, M.M.; El-Kassas, H. A review of microalgae- and cyanobacteria-based biodegradation of organic pollutants. Molecules 2022, 27, 1141. [Google Scholar] [CrossRef]
  41. Khan, A.A.; Gul, J.; Naqvi, S.R.; Ali, I.; Farooq, W.; Liaqat, R.; AlMohamadi, H.; Štěpanec, L.; Juchelková, D. Recent progress in microalgae-derived biochar for the treatment of textile industry wastewater. Chemosphere 2022, 306, 135565. [Google Scholar] [CrossRef]
  42. Rangabhashiyam, S.; Suganya, E.; Selvaraju, N.; Varghese, L.A. Significance of exploiting non-living biomaterials for the biosorption of wastewater pollutants. World J. Microb. Biot. 2014, 30, 1669–1689. [Google Scholar] [CrossRef]
  43. Zheng, H.; Guo, W.; Li, S.; Chen, Y.; Wu, Q.; Feng, X.; Yin, R.; Ho, S.H.; Ren, N.; Chang, J.S. Adsorption of p-nitrophenols (PNP) on microalgal biochar: Analysis of high adsorption capacity and mechanism. Bioresour. Technol. 2017, 244, 1456–1464. [Google Scholar] [CrossRef]
  44. Ata, A.; Nalcaci, O.O.; Ovez, B. Macro algae Gracilaria verrucosa as a biosorbent: A study of sorption mechanisms. Algal Res. 2021, 1, 194–204. [Google Scholar] [CrossRef]
  45. Rubín, E.; Rodríguez, P.; Herrero, R.; Sastre de Vicente, M. Biosorption of phenolic compounds by the brown alga Sargassum muticum. J. Chem. Technol. Biot. 2006, 81, 1093–1099. [Google Scholar] [CrossRef]
  46. Aravindhan, R.; Rao, J.R.; Nair, B.U. Application of a chemically modified green macro alga as a biosorbent for phenol removal. J. Environ. Manag. 2009, 90, 1877–1883. [Google Scholar] [CrossRef]
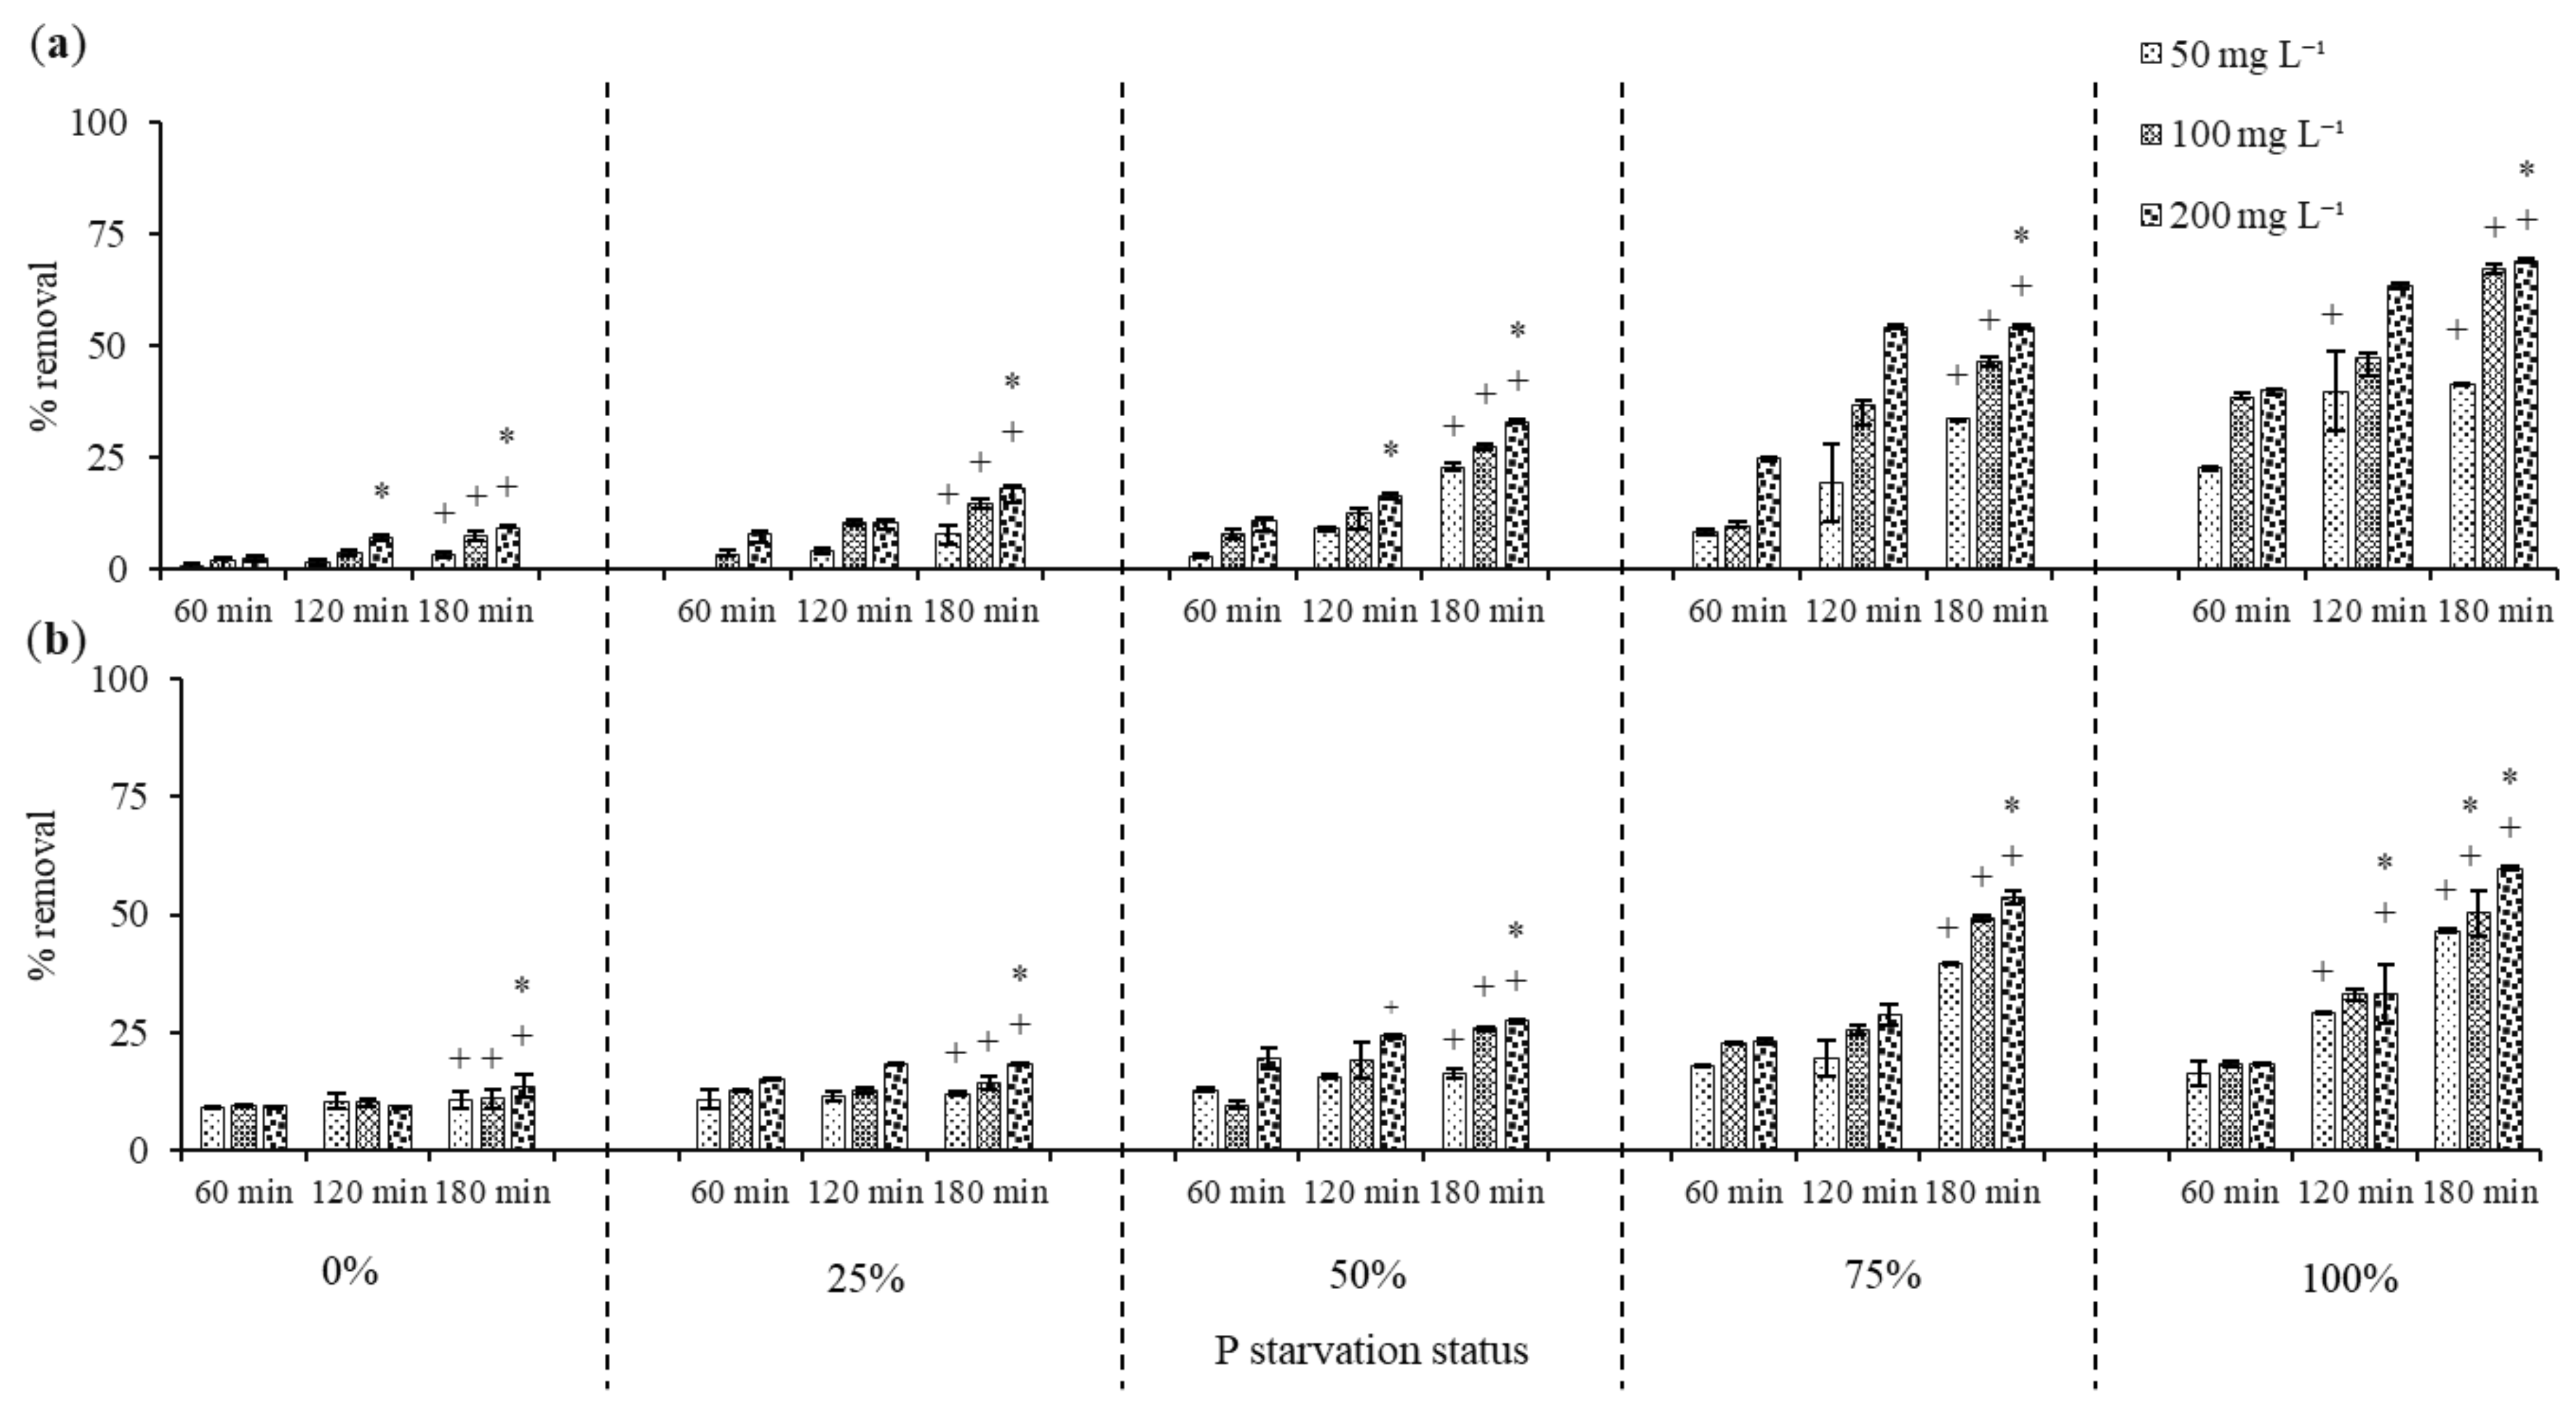
Figure 1. Percent removal of phenol by C. vulgaris dried biomass starved with 0, 25, 50, 75, and 100% phosphorus at (a) 100 mg L−1 and (b) 200 mg L−1 phenol exposure. In all cases, p < 0.05, and n = 3 ± SE. + on bars, within each phosphorus starvation status (0, 25, 50, 75, or 100%), represents the significantly highest phenol removal at the specific time of exposure (60, 120, or 180 min) with the same concentration of biomass (50, 100, or 200 mg L−1), while * on the bar represents significantly highest phenol removal within all observations.
Processes 10 02435 g001
Figure 2. Percent removal of phenol by C. vulgaris dried biomass starved with 0, 25, 50, 75, 100% phosphorus and acid treated further at (a) 100 mg L−1 and (b) 200 mg L−1 phenol exposure. In all cases, p < 0.05 and n = 3 ± SE. + on bars, within each phosphorus starvation status (0, 25, 50, 75, or 100%), represents the highest significant phenol removal at the specific time of exposure (60, 120, or 180 min) with the same concentration of biomass (50, 100, or 200 mg L−1), while * on the bar represents the highest significant phenol removal within all observations.
Processes 10 02435 g002
Figure 3. Percent removal of 2-chlorophenol by C. vulgaris dried biomass starved with 0, 25, 50, 75, 100% phosphorus at (a) 70 mg L−1 and (b) 150 mg L−1 2-chlorophenol exposure. In all cases, p < 0.05, and n = 3 ± SE. + on bars, within each phosphorus starvation status (0, 25, 50, 75, or 100%) represents the highest significant 2-chlorophenol removal at the specific time of exposure (60, 120, or 180 min) with the same concentration of biomass (50, 100, or 200 mg L−1), while * on the bar represents the highest significant 2-chlorophenol removal in all observations.
Processes 10 02435 g003
Figure 4. Percent removal of 2-chlorophenol by C. vulgaris dried biomass starved with 0, 25, 50, 75, and 100% phosphorus and further acid treated at (a) 70 mg L−1 and (b) 150 mg L−1 2-chlorophenol exposure. In all cases, p < 0.05, and n = 3 ± SE. + on bars, within each phosphorus starvation status (0, 25, 50, 75, or 100%), represents the highest significant 2-chlorophenol removal at the specific time of exposure (60, 120, or 180 min) with the same concentration of biomass (50, 100, or 200 mg L−1), while * on the bar represents the highest significant 2-chlorophenol removal in all observations.
Processes 10 02435 g004
Figure 5. Cluster analysis using the between-group linkage clustering method with Squared Euclidean distance interval measured on the applied treatments for (a) phenol and (b) 2-chlorophenol removal by C. vulgaris dried biomass. Biomass = algal dried biomass per liter, Time = duration for treatments, Concentration = concentration of contaminants, Modification = chemical/acid modification of dried biomass, Starvation = Phosphorus starvation by which biomass is produced, and Removal = Phenol/2-chlorophenol removal.
Processes 10 02435 g005
Table 1. Lipid and protein content of C. vulgaris after seven days growth at different phosphorus concentrations.
Phosphorus StarvationLipid Content (mg g−1)Protein Content (% w/w)
0%15 ± 0.0030.123 * ± 0.005
25%23 ± 0.0020.102 ± 0.014
50%67 ± 0.0010.061 ± 0.007
75%78 ± 0.0030.021 ± 0.003
100%117 * ± 0.0050.017 ± 0.003
* Represents significantly highest value, where n = 3 ± SE.
Publisher’s Note: MDPI stays neutral with regard to jurisdictional claims in published maps and institutional affiliations.