Abstract
Since the 21st century, in several public health emergencies that have occurred across the world, the humid enclosed environment of the toilet has become one of the places where bacteria, viruses, and microorganisms breed and spread. Mobile public toilets, as a supplement of urban fixed public toilets, are also widely used in densely populated areas. According to statistics, since the outbreak of COVID-19 in 2019, multiple incidents of people being infected by the COVID-19 virus due to aerosol proliferation in public toilets have been confirmed. It is an urgent issue to resolve the internal environmental pollution of mobile public health and reduce the risk of virus transmission in public spaces under the global epidemic prevention. This paper utilized a typical combined mobile public toilet as the research object and measured and evaluated the indoor thermal environment in real time over a short period of time. The diffusion mode and concentration change law of pollutants in mobile public toilets were predicted and analyzed based on CFD. Regression analysis was also used to clarify the relationship between indoor thermal environment variables and aerosol diffusion paths, and a ventilation optimization scheme was proposed to reduce the risk of virus transmission.
1. Introduction
Urban public toilets (UPTs), as urban infrastructures, are related to the basic physiological needs of people; they play an important role in the construction of modern civilization in cities, and also demonstrate the social and economic development and the government’s attention to people’s livelihood. Around the world, countries are paying more and more attention to the environmental conditions of public toilets. This is happening in response to the World Public Health Summit scheduled every year to discuss the practical hygiene improvement measures. Since the “toilet revolution” proposed by UNICEF, developing countries, such as China, the Philippines, and India, have made extensive efforts on the issue of public health construction. China first set off a vigorous “toilet revolution” in the countryside by continuously improving the quality requirements for toilets and the supporting facilities of public toilets. The Philippine government encouraged the construction of toilets with septic tanks, which India made a requirement for any village office to run. In 2011, Bill Gates also launched his “toilet reconstruction plan” to provide low-cost, hygienic, and sustainable toilet services to approximately 260 million people without sewers around the world. Developed countries, including Singapore, Canada, and Germany, also have extremely high requirements regarding the appearance and internal facilities of UPTs to create a healthy and comfortable toilet environment for people. Based on diversified toilet needs, mobile public toilets have been widely used and popularized in recent years. They are environmentally friendly and energy-saving. Further, in recent times, artificial-intelligence-based mobile public toilets have emerged. The mobile public restroom has the advantages of being movable, combinable, and convenient for transportation. It is almost not restricted by any working environment. It can be used as a good supplement to the traditional fixed public toilets, in the case a sudden increase in the flow of people. Recent research efforts have mainly focused on the design of the internal environment and the disposal methods of excrement within them [1,2]. However, there is little research on the thermal environment and sanitation issues in mobile toilets.
Public toilet facilities possess both hygienic, cultural, and economic values [3]. The main pollutant gases in the toilet are hydrogen sulfide, methyl mercaptan, ammonia, and indole. Ammonia is a colorless gas with a strong pungent odor [4]. Because of its high solubility, ammonia is often adsorbed to the skin, mucous membranes, and conjunctiva of the eyes, resulting in irritation and inflammation. Exposure to a large amount of ammonia in a short period of time in public toilets can cause tears, a sore throat, and a cough, accompanied by dizziness, headache, nausea, and other symptoms. Severe cases may be subject to pulmonary edema, adult respiratory distress syndrome, and respiratory irritation symptoms. Among them, the volatile “ammonia”, with a strong offensive odor, is one of the most important pollutants in public toilets. Its pollution to air quality in small enclosed spaces is affected by the amount of use and seasons. Ao Yongan et al. [5] analyzed the diffusion law of toilet pollutants and found that the concentration of heavy gas is greater when the heavy gas is closer to the pollution source, while the concentration of light gas is the opposite. Compared with fixed public toilets, mobile public toilets are confined and narrow, making it is easier for them to become a highly dangerous place for various pathogens and bacteria. Because of human excretion, our environment will be forced to accept a large influx of pollutants [6]. Many scholars have analyzed public toilets, e.g., in hospitals and schools, and found that the surfaces of frequently contacted objects, such as internal door handles, faucets, floors, and flush buttons, are contaminated by bacteria and pathogens [7,8]. In the process of using public toilets, 31.6% of people are unwilling to flush the toilets, which intensifies the pollution of the toilets. Because of human excretion, our environment will be forced to accept a large influx of pollutants. In the 21st century, there have been three relatively serious public health incidents in the world, namely SARS in 2003, influenza H1N1, and the new coronavirus in 2019. In particular, SARS and new coronaviruses have occurred in narrow confined spaces and crowd gathering events in large spaces. The direct transmission of infectious viruses, such as the new coronavirus, is closely related to the methods and effects of indoor natural ventilation and mechanical ventilation. Effective urban ventilation prevents virus aerosols and other pollutants from accumulating in indoor space and promotes their dissipation.
Poor indoor air quality reduces the comfort experienced in the environment and can also harm our physical health [9]; this long-distance air transmission method is called aerosol transmission, which is one of the main forms of disease transmission [10,11,12,13]. The aerosol is a gaseous suspended dispersion system. From the perspective of fluid mechanics, the aerosol is essentially a multi-phase fluid with a continuous gas state and dispersed solid and liquid phases [14]. Among them, those that carry pathogens or bacteria are called microbial aerosols [15]. Viruses are the smallest micro-organisms with a diameter of 0.02–0.3 μm. Although viruses only survive in host cells, they can still attach to the respiratory secretions and other droplets to form virus aerosols without host cells and spread through the air, leading to infectious diseases, such as chickenpox, tuberculosis, measles, etc. [16]. The cleanliness of water closets not only has a visual effect, but the systematic cleaning of surfaces in any locations significantly reduces the risks of infection and the spread of various diseases [17]. In Hong Kong, following the Amoy Garden incident during the SARS outbreak in 2003, the virus entered the sewage pipe through feces and then entered the bathroom of the household from the floor drain, infecting more than 300 people within just ten days. The outbreak of the new coronavirus in 2019 proved the possibility of viruses and other microorganisms spreading through aerosols again. The aerosol transmission of the new coronavirus is regarded as droplets mixed in the air to form aerosols and cause infection after inhalation. “Stool-oral transmission” is most likely to be transmitted through breathing and aerosols. The sixth edition of the “New Corona-virus Diagnosis and Treatment Plan” was issued by the National Health Commission of China. This plan also proposed that “The new corona-virus can be isolated in feces and urine” and that “attention should be paid to the aerosol and contagious transmission by feces and urine”. In addition, viruses such as SARS and PV-1 have also been proven to survive in the water environment. It takes 10 days for PV-1 to decrease in wastewater. Therefore, the water environment that contains the virus source in the bathroom is more dangerous [18].
In summary, improving the internal environment and sanitation of mobile public toilets is the main goal. Many scholars have conducted experiments on reducing the concentration of indoor pollutants and found that airflow can affect the escape probability of microorganisms and affect the diffusion of pollutants [19]. Li Cheng et al. [20] simulated the toilets in the World Expo and found that the use of mechanical ventilation and airflow organization with up and down distributed exhausts can ensure that the pollutant concentration and thermal comfort in the toilet meet the requirements. Li et al. [21] proved that optimizing the form of ventilation in hospitals can reduce the aerosol transmission of pathogens. Yue Gaowei [22] proposed that the use of same-side return air can effectively reduce the indoor formaldehyde concentration. Ji Shaojie [23] proposed that the H2S concentration gradually decreases when the height of the partition increases, and the toilet that is located in the building with a high wind pressure can effectively improve the air quality in the bathroom. Liu Haoran [24] observed that when the wind pressure is 25 Pa and above, determined as the best wind pressure value, the indoor pollutants will not flow back. Tung et al. [25,26] concluded that the removal efficiency of pollutants was higher with the shorter distance between the toilet and the exhaust vent, and the ceiling exhaust can effectively remove the polluted gas from the toilet by gas tracing. Chung et al [27]. predicted the airflow rate and the characteristics of aerosol particle transmission in the toilet and analyzed that the use of floor air supplies can create a comfortable and appropriate internal environment for the next user. To improve the sanitary environment inside the toilet, Seo et al. proposed an exhaust method that directly sucks odor and bacteria from the inside of the toilet [28].
Although many studies have been carried out on indoor odor intensities, most have only focused on improving indoor ventilation efficiency. In previous reports, many efforts have been dedicated to urban fixed toilets. However, there are few studies on the internal hygiene of mobile public toilets and residential toilets. This paper is based on measuring the indoor thermal environment of mobile public toilets, using CFD to simulate the indoor thermal environment distribution and pollutant diffusion of mobile public toilets, find the main influencing factors of indoor pollutants in mobile public toilets, predict the spread of viruses (such as COVID-19) in mobile public toilets in emergencies to reduce the further transmission of viral aerosols, and provide an important reference for virus transmission risk and environmental quality control in mobile public toilets.
2. Field Test Method for the Thermal Environment
The most common types of mobile public toilets are single mobile toilets and composite mobile toilets. In densely populated urban areas, composite mobile toilets are used as a supplement to urban fixed mobile toilets, which is the same as the single mobile public toilets used in cabin hospitals during the global COVID-19 outbreak.
This study conducted a field test of three UPTs in Zhengzhou in August 2019. Zhengzhou is located in the south of the warm temperate zone and experiences a continental monsoon humid climate. The average daytime temperatures in Zhengzhou are 33.4 °C in August. The permanent resident population is 10.352 million.
2.1. Research Subjects
The main objective of this study was to investigate UPTs in Zhengzhou. Considering the current wide application of mobile public toilets in the city and the risk to public health security caused by using the frequency of mobile public toilets, this paper selected three groups of composite mobile public toilets located in Zhengzhou, China. The three groups of measured objects were all located in the high-density population area. Object A was located near the city’s university town, while B was located in Zhengzhou Railway Station. Zhengzhou Railway Station is a comprehensive transportation hub integrating a high-speed railway, an inter-city railway, EMU trains, general-speed trains, and other passenger transportation services. It sends more than 40,000 passengers a day, and the number of people passing by is close to 150,000 every day. Object C was located in a local industrial park. The three groups of measured objects had the same structure and building materials, but different forms of ventilation, as shown in Table 1.

Table 1.
Details for testing objects.
2.2. Test Principles
According to typical meteorological year (TMY) data, the high-temperature period for actual measurements was acquired from 11 August 2019 to 17 August 2019. Considering the effect of cloudy and sunny days on the indoor environment of the mobile public toilets and the accuracy of the test, the 72 h continuous test data were selected for analysis, with an interval of 5 min. The indoor and outdoor temperature and humidity; the temperature of the inner roof, the inner wall, and the floor; and the exhaust air velocity were measured. The actual measurement process was divided into three parts. The first measurement was temperature and humidity (indoor and outdoor). The second was the temperature of the internal roof, wall, and ground. The third was the air velocity at the exhaust outlet.
The indoor temperature was selected as the same value satisfying more than 80 percent of a person from the following equation performed by Ashrae [29]:
The high-comfort indoor environment elements and control values are defined in ISO 7730 “Ergonomics of the thermal environment—Analytical determination and interpretation of thermal comfort using calculation of the PMV and PPD indices and local thermal comfort criteria”. It is instructed that the indoor temperature should be no lower than 20 °C in winter and no higher than 26 °C in summer, and the indoor relative humidity is maintained between 40% and 60%.
According to “Urban Public Toilet Hygiene Standards” [30], for II UPTs, the indoor temperature should not be lower than 10 °C, the relative humidity should not be higher than 80%, and the odor intensity should not exceed level 2. It is required that the indoor temperature is maintained at 22–28 °C in summer, and the relative humidity at 40–80% in the standard. According to the “Healthy Building Evaluation Standard” (T/ASC 02) [31], “Mold can grow and spread fungal diseases when it is kept at a temperature of 25–30 °C, a humidity above 80% with sufficient oxygen conditions”. It is recommended that the relative humidity is maintained in the range of 30% to 70% to reduce the cutaneous and visual stimulation of damp and dryness, as well as avoid the harm of static electricity, bacterial growth, and respiratory diseases, in order to help create a comfortable and healthy indoor air environment for the human body [32,33,34].
2.3. The Layout of the Test Point
The data collection interval was carried out in a shaded place to avoid direct sunlight. The indoor air temperature and humidity were measured at a height of 1100 mm from the ground (ASHRAE55-2013); the indoor roof, wall, and ground temperatures were measured in the middle area where the value was relatively stable. In addition, it was important to close the gate to reduce the impact on the outdoor environment. The wind speed of the exhaust outlet was selected at the center of the exhaust outlet, allowing the data to be recorded once the instrument was stable. During the test, the mobile public toilets were in normal use to achieve a more realistic evaluation and comparison of the indoor temperature, humidity, and thermal sensation of the mobile public toilets.
2.4. Test Instruments
Table 2 lists the instrument types and related errors for the test.
Table 2.
Measurement equipment.
2.5. Aerosol Transmission Risk Assessment Approach Using Gas Tracers
The risk of aerosol transmission during the COVID-19 pandemic cannot be underestimated. Ge Zi-Yu et al. [35] argued that the routes of transmission are direct contact, as well as droplet and possible aerosol transmissions. Gorbunov [36] found that aerosol particles generated by coughing and sneezing can travel over 30 m. Based on the coupling effect between the CFD modelling of bioaerosol dispersion and the calculation of probability of contact events, Maria Portarapillo et al. [37] proposed a methodology to perform risk analysis of the virus spread. The use of tracer gas to simulate and discuss aerosol propagation risk is one of the main research methods. Rencken Gerhard K et al. [38] used tracer gases to approximate the flow and dispersion of aerosol–air mixtures.
Tracer gases are gases that can be mixed with air; they do not undergo chemical changes and can be detected at low concentrations [39]. Common tracer gases are carbon dioxide, hydrogen, and so on. C.J. Ghazi et al. [40] locally measured air leakage rates using carbon dioxide as a tracer gas. Aditya Togi et al. [41] proposed a new method of estimating the mass of total molecular gas in galaxies directly from pure mid-infrared rotational radiation using hydrogen as a tracer gas. Hydrogen sulfide and ammonia can be used as tracers for aerosols. Zhao J. et al. [42] used hydrogen sulfide as a tracer gas to investigate the effectiveness of forced ventilation strategies for eliminating the toxic and oxygen deficient atmospheres in confined-space manure storages. Kirk Helen et al. [43] considered that ammonia is an excellent tracer. Furthermore, the use of hydrogen sulfide and ammonia can not only simulate the aerosol propagation, but can also fully illustrate the distribution law and level of pollutants in the mobile public health. It is a novel topic worthy of discussion in this study.
3. Results and Discussion
3.1. Field Test Results for the Thermal Environment
3.1.1. Indoor Temperature and Humidity Distribution
To find the degree of indoor temperature and humidity affected by the outdoor environment, the curves of indoor and outdoor temperature and humidity were measured, as shown in Figure 1 and Figure 2. The indoor temperature and humidity in summer were greatly affected by the outdoor temperature and humidity, and the indoor temperature and humidity were higher than the outdoor temperature and humidity, which shows that the material had poor heat storage properties. The indoor and outdoor temperatures showed the same changing trend. The indoor temperature ranged from 28.5 °C to 35.5 °C. The highest indoor temperature was 35.5 °C when the solar radiation was the strongest, while the lowest was 28.5 °C when the solar radiation was the weakest. Moreover, it is shown that the indoor temperature of samples A and B both exceeded the ASHRAE and indoor air quality standards, and thus only the temperature of sample C in the initial period meets the ASHRAE standard.
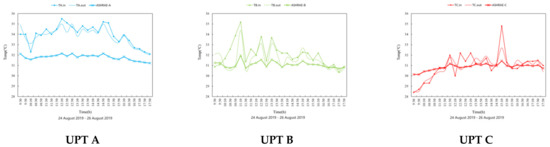
Figure 1.
Air temperature and relative humidity changes in tested UPTs.
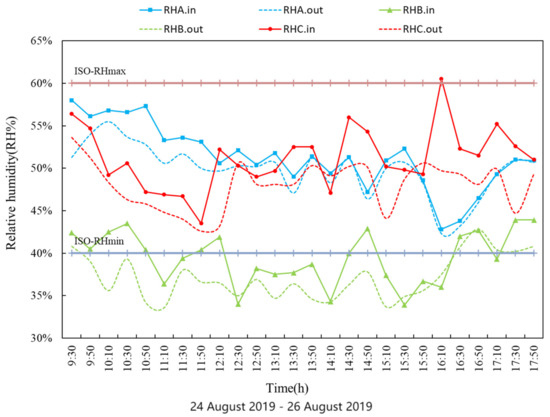
Figure 2.
Combination of relative humidity changes in tested UPTs.
In summer, the maximum indoor humidity of the mobile public toilets could reach 60% in the peak off-duty period with a large flow of people. The changing trend of the indoor and outdoor relative humidity of A was the same because A was in a sparsely crowded area and indoor natural ventilation was adopted; the relative humidity of C suddenly rose at 16:30 with the largest flow of people. Among the three subjects, only UPT B used continuous mechanical ventilation; thus, B had the lowest relative humidity. It can be shown that the indoor humidity meets the highest ISO standard, but C does not meet the lowest ISO standard.
Living conditions of fungi were 22–36 °C and relative humidity was 95–100%. From the measurement data, the temperature in the mobile public toilets was just suitable for fungi growth. Some fungi, such as Cryptococcus neoformans and Aspergillus, etc., could infect the lungs of the human and cause harm to the body.
The pollutant gas molecules inside the toilet were always in constant motion. As the temperature increased, the movement speed of the pollutant molecules accelerated, which increased the concentration of air pollutants where the personnel breathes in the toilet. The increase in humidity was predicted to affect people’s comfort, and the effective control of humidity could alleviate the growth of fungi in the building, but a proper increase in indoor humidity could reduce the survival period of the virus.
It has also been found that too low or too high humidity could increase the survival time of virus-carrying aerosols. The survival and inactivation time of viruses depended more on the humidity. When the relative humidity was close to 80%, the virus was the most active and had the longest survival time. Therefore, if the temperature and humidity inside the public toilets were effectively controlled, people’s comfort could be improved and the growth of pathogens in the public toilets could be reduced.
3.1.2. Indoor Air Temperature Vertical Stratification
The temperature measurement of the inner roof, inner wall, and ground inside the mobile public toilets are shown in Figure 3. The temperature of the three groups of objects had obvious vertical stratifications. The temperature change trend of the inner roof and inner wall surface was the same, while that of the floor temperature was relatively large. The temperature decreased from the top to the bottom in the vertical direction. The inner roof had the highest temperature. This is mainly because the outer roof was exposed to strong solar radiation and was then transferred to the inner roof through heat conduction; the ground temperature was the lowest, but it was strongly affected by the outside environment. The floor temperature of C rose sharply at 11:50 and exceeded the temperature of the inner wall surface after using the toilet.
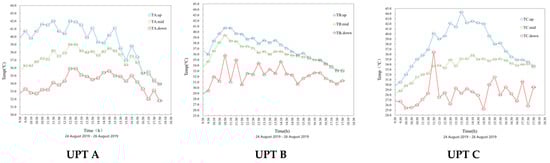
Figure 3.
Indoor air temperature vertical stratification of tested UPTs.
The pollutant gases inside the mobile public toilets were mainly ammonia and hydrogen sulfide. The density of ammonia gas was lower than air and mainly gathered in the upper layer of the public toilets, while the density of hydrogen sulfide was higher and mainly gathered in the lower layer of the public toilets. The movement rate of the ammonia molecules was faster with higher temperature, which was predicted to increase the concentration of ammonia in the breathing height of the personnel in toilets. The internal temperature ranged between 25 and 45 °C in the mobile public toilets. For the coronavirus, 40 °C was more likely to be inactivated than 20 °C under the same humidity. Therefore, viruses were mostly distributed in the lower space in the mobile public toilets. In addition, virus aerosols were also more stable at lower temperatures.
3.1.3. Evaluation and Analysis of Odor Intensity
An evaluation of the indoor odor intensity of mobile public toilets was mainly based on the subjective judgment of the human sense of smell. Eight people involved in scoring were all college students. The number of men and women was equal and they were in good health and had a sensitive sense of smell. The evaluation process was completed synchronously with the measured time node. The odor intensity adopted a six-level intensity representation: level 1 is odorless; level 2 is a weaker odor that can determine the properties of the odor; level 3 is an obvious odor that is easy to smell; level 4 is a strong odor; and level 5 is very strong odor. When the odor intensity exceeded level 3, it was considered that the atmosphere was foul-smelling. Figure 4 shows that the odor intensity of the three groups had the same changing trend. UPT A had the highest odor intensity, and was not in the odor pollution stage only 7.69% of the time. UPT A used natural ventilation and hot indoor conditions, resulting in a difficulty to discharge the odor, while UPTs B and C were not in the odor pollution stage 19.23% and 26.92% of the time, respectively. UPTs B and C both used mechanical ventilation. UPT B was located in the railway station with a large flow of people, while C was located in the suburbs far away from the city with a low flow of people, and the number of users was small.
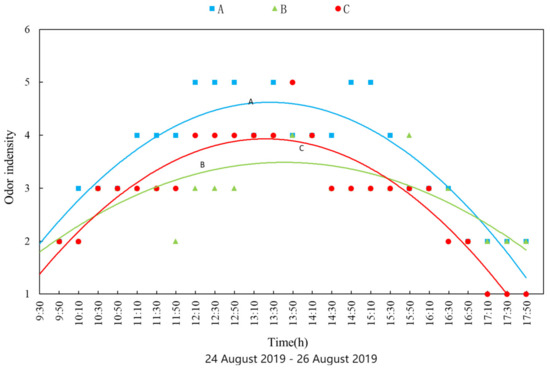
Figure 4.
Subjective evaluation of indoor odor intensity in tested UPTs.
The main pollutants in the toilet were ammonia, hydrogen sulfide, etc. The pollutant that caused bad smells was mainly hydrogen sulfide. When the concentration of hydrogen sulfide reached 0.00041 ppm, people already started to smell the odor. Therefore, when the room was polluted by bad odors, the hydrogen sulfide content in the mobile public toilets was already high. This shows that, in summer, indoor aerosol pollutants are easy to accumulate inside mobile public toilets, causing the rapid deterioration of the internal environment and posing a threat to people’s health.
4. Numerical Simulation
4.1. Simulation Model
A numerical model was built based on the actual mobile public toilets size and room layout. The three-dimensional numerical model used using an Airpak design modeler, as shown in Figure 5. A mobile toilet with x × y × z = 1100 mm × 1100 mm × 2300 mm dimensions was also used, and the mobile toilets were modeled with a down-supply and up-supply ventilation mode. A 1730 mm male standing model, a 200 mm × 100 mm air inlet, a 200 mm × 200 mm air outlet, and a 420 mm × 220 mm pollutant release source were placed in the center of the ground. The main pollutant was released as ammonia and hydrogen sulfide.
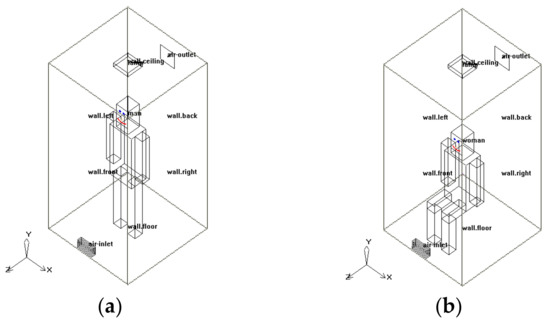
Figure 5.
The three-dimensional numerical model: (a) standing position; (b) sitting position.
4.2. Model Equations
The air in the toilet was assumed to have low velocity, impressible, and turbulent fluid characteristics. Therefore, airflow can be regarded as continuous fluid and can be represented by the followed equation.
Ideal gas law:
Continuity equation:
Energy conservation equation:
After a comprehensive consideration of simulation reliability, a standard zero equation was used to generate the turbulence model.
Zero Equation
This is a model that does not apply differential equations but uses algebraic relations to connect the vortex viscosity coefficient to the time means value [44]. The zero-equation model can accurately determine the indoor air distribution, air temperature, and pollutant concentration [45,46], and the turbulent viscosity can be determined from
where ρ, l, and S are the fluid density, mixed length, and modulus of the average strain rate tensor, respectively. l and S are given by and
where k = 0.0417 is the von Kármán constant; d, dmax, and Sij are a respective distances from the wall, the maximum distance, and average strain rate tensor, given by:
where u is the velocity.
4.3. Boundary Conditions
The isothermal boundary condition was employed in the walls of mobile toilets in this simulation when λ was 0.4. The air temperature outside the wall was based on the experimental data. The measured data were used in the temperature of the floor. The solar radiation intensity (W/m2) on a typical day at 12 a.m. had a strong influence on the wall heating process. The inlet boundary conditions of the domain, including a free inlet, experimental velocity, and air temperature, were used in the outlet boundary with a standard intensity of pressure of 101.325 kPa. In addition, the following assumptions were made in the present simulation:
- (1)
- It could be assumed that the air is uniformly in compressible;
- (2)
- In the steady state, the 3D flow could be fully developed;
- (3)
- The influence of cold air penetration could be ignored on the heat transfer process;
- (4)
- All thermo-physical fluid properties could be considered constant.
4.4. Meshing and Model Validation
Considering the room size, the maximum size of the fine grid in the X, Y, and Z directions was set to 0.2 m. The grid at the exhaust outlet, air inlet, and pollution source was finely processed. After calculation, the parameters of the fine grid were reported as follows: NODES: 25134, HEXAS: 21761, QUADS: 6634, Faces + solids: 43. The meshing of the field was carried out using structural mesh, as shown in Figure 6.
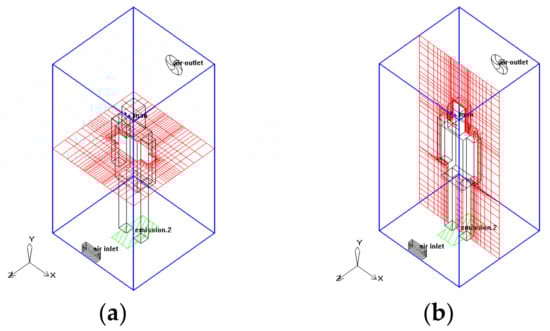
Figure 6.
Structured mesh of computational domain: (a) XZ plane view; (b) XY plane view.
The parameters representing the quality of the mesh were as follows: Face alignment = 0.986928 > 1; Quality = 0.882239 > 1 min (quality (volume)) = 1.10135 × 10⁻⁶ max (quality (volume)) = 0.986928 > 1 when the mesh quality is good [47].
Correlation analysis was performed by combining the measured data of indoor air temperature and humidity with the simulated results. The coefficient of determination R2 = 0.6987 > 0.5 and R2 = 0.891 > 0.5 was obtained by regression analysis (as shown in Figure 7). This indicates that the simulated results have a good correlation with the measured results and that the constructed physical model is reliable.
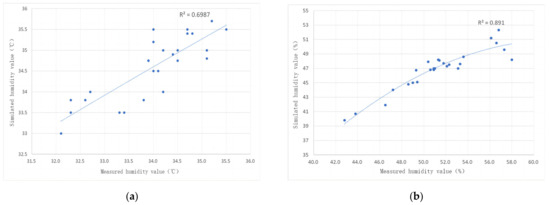
Figure 7.
Correlation analysis between experiment and simulation: (a) air temperature; (b) relative humidity.
4.5. Simulation Results
4.5.1. Pollution Distribution
According to the World Health Organization’s “Air Quality Guidelines”, when the stay interval is within ten minutes, the average sulfide content should not exceed 500 ug/m3. According to the “Urban Public Toilet Hygiene Standards”, for class II public toilets, the indoor ammonia concentration should not exceed 1 mg/m3, and the hydrogen sulfide concentration should not exceed 0.01 mg/m3. According to the “Indoor Air Quality Standard” [48], indoor ammonia should not exceed 0.2 mg/m3.
To explore the distribution of indoor pollutants in mobile public toilets, the distribution of indoor pollutants is shown in Figure 5. NH3 was released from the pollution source. Due to the effect of the air inlet, NH3 diffused along the ground surface at the rear of the mobile toilets and then spread upwards along the back wall, so the ammonia concentration at the bottom of the mobile toilets was lower. The ammonia concentration around the human body was 2.8 ppmv (2.16 mg/m3). Thus, this meets the sanitary standards of three types of UPTs, but the indoor air quality does not meet the standard requirements. The NH3 concentration was higher near the wall.
As shown in Figure 8, after H2S was released from the pollution source, outdoor air entered the room from the air inlet. H2S diffused toward the rear of the mobile toilets and then spread upward along the wall. At the two corners of the rear of the mobile toilets, the H2S concentration was higher. This is probably because the pollutant H2S tended to accumulate in the corners. The H2S concentration around the human body was 0.03 ppmv (0.046 mg/m3). The H2S in the mobile public toilets does not meet the standards, and when the H2S concentration exceeded 0.0041 ppmv, the odor could be smelled. If 0.41 ppmv was reached, a strong odor could be smelled.
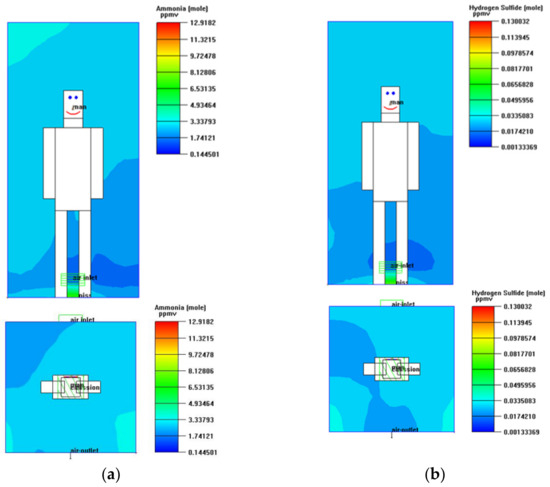
Figure 8.
Concentration distribution of (a) NH3 and (b) H2S in the UPTs.
4.5.2. Effects of Indoor Pollutant Concentration
To study the effect of indoor temperature on the concentration of pollutants, correlation analysis between temperature and the concentration of pollutants was carried out (Figure 9a), and the determination coefficient of ammonia was R2 = 0.6876 > 0.5, showing that the concentration of ammonia has a positive and strong correlation with temperature. As the ambient temperature increased, the ammonia concentration increased, but the determination coefficient of hydrogen sulfide was R2 = 0.027 < 0.09, indicating that there is a scarce correlation between the hydrogen sulfide concentration and temperature.
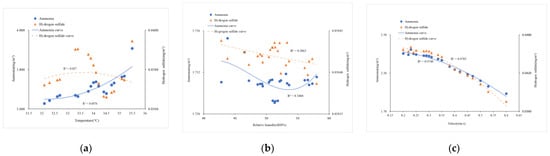
Figure 9.
(a) Regression analysis of pollutant concentration with indoor air temperature; (b) regression analysis of pollutant concentration with relative humidity; (c) regression analysis of pollutant concentration with airflow.
To study the effect of indoor humidity on the concentration of pollutants, correlation analysis between humidity and the concentration of pollutants was carried out (Figure 9b), and the determination coefficient of ammonia gas was R2 = 0.3404 < 0.5, while the determination coefficient of hydrogen sulfide was R2 = 0.2063 < 0.5 Therefore, the concentration of ammonia and hydrogen sulfide has a weak negative correlation with humidity.
To study the effect of the wind speed at the exhaust outlet on the concentration of pollutants, correlation analysis between the wind speed and the concentration of pollutants was carried out (Figure 9c), and the determination coefficient of ammonia was R2 = 0.9783 > 0.8, while the determination coefficient of hydrogen sulfide was R2= 0.9748 > 0.8. Therefore, the concentration of ammonia and hydrogen sulfide has a strong negative correlation with the wind speed. As the wind speed increased, the exhaust air volume from the exhaust vent increased and the indoor pollutant concentration decreased.
4.5.3. Indoor Air Velocity Distribution
It can be seen that the concentration of pollutants has a strong correlation with wind speed. The higher the wind speed is, the lower the concentration of indoor pollutants. The air velocity around the human body was 0.06 m/s, as shown in Figure 10, which does not meet the quality standards [48]. The air velocity on the left side of the human body was high, with low pollutant concentration on the same side of the human body. When fresh air entered the room, the wind speed gradually decreased from the direction of the air outlet, and the wind speed close to the human body reached 0.71 m/s.
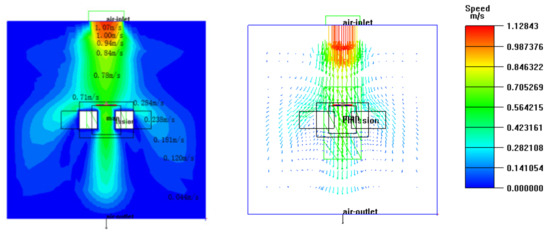
Figure 10.
Cloud chart at Y = 0.15 m.
4.5.4. Indoor Air Age Distribution
The age of air reflected the freshness of indoor air, making it an important indicator for evaluating indoor air quality. The air quality in the lower part of the mobile public toilets is clearly shown in Figure 11. With the increase in pollutants, the air quality in the upper part worsened. The air quality was the worst behind the head of the users where bacteria were most likely to grow. In addition, the air quality at the breathing height of the human body was also poor, which is the main factor leading to the high odor intensity.
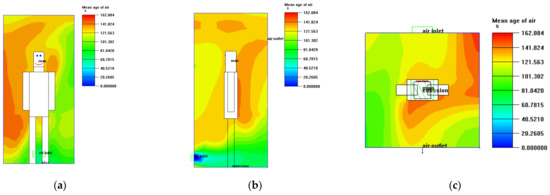
Figure 11.
Air age distribution at (a) Z = 0.55 m, (b) X = 0.55 m, and (c) Y = 1.1 m.
5. Ventilation Methods for Reducing Public Health Safety Risks
5.1. H2S and NH3 Mass Concentrations in Different Ventilation Modes
It was shown that the concentration of pollutants has the strongest correlation with wind speed, so the airflow was reorganized by changing the indoor ventilation form (Figure 12 and Figure 13). In Figure 12, the indoor NH3 concentration decreased when the downward ventilation mode was adopted, and that of the human breathing height was 2 ppmv (1.5 mg/m3), which meets the hygienic standards of the second-class UPTs. Heavy ammonia was discharged outdoors after it was released from the pollution source, and part of it was diluted by indoor fresh air. The indoor concentration of H2S was also reduced, and the concentration of hydrogen sulfide around the human body was 0.015 ppmv (0.023 mg/m3), which still does not meet the sanitary standards of UPTs.
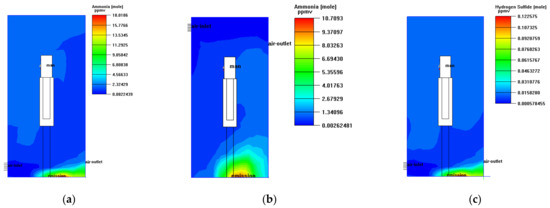
Figure 12.
Concentration distribution of NH3 in different ventilations: down-supply and down-exhaust, up-supply and up-exhaust, up-supply and down-exhaust, respectively. (a–c): Pollution distribution at X = 0.55 m.
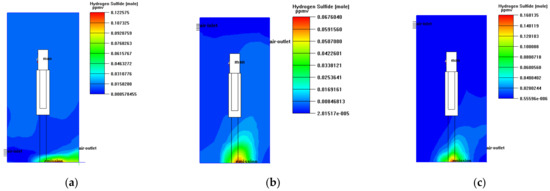
Figure 13.
Concentration distribution of H2S in different ventilations: down-supply and down-exhaust, up-supply and up-exhaust, up-supply and down-exhaust, respectively. (a–c): Pollution distribution at X = 0.55 m.
Figure 12 shows that most of the indoor ammonia gas accumulated in the lower part of the mobile public toilets and the back wall when the up-supply and up-discharge ventilation mode was adopted. The concentration of ammonia gas around the user was about 0.67 ppmv (0.52 mg/m3), which conforms to the hygienic standards for second-class UPTs. The distribution of H2S concentration was similar to NH3, and the concentration in the breathing area of users was about 0.004 ppmv (0.007 mg/m3), which meets the norms for first-class urban toilets.
Figure 13 shows that the ammonia concentration around the indoor user was about 0.0017 ppmv (0.0013 mg/m3) when the up-supply and down-exhaust ventilation mode was adopted. The concentration of H2S at the breathing height of the toilet users was about 8.6 × 10⁻⁶ ppmv (1.3 × 10⁻⁵ mg/m3); thus, this pollutant concentration meets the standards for first-class UPT sanitation. The toilet users in the mobile public toilets could hardly smell the odor. The concentration of pollutants in mobile public toilets was drastically reduced, and the health threat to the human body also decreased. The aerosol concentration at the height of breathing under different ventilation modes is shown in Figure 14.
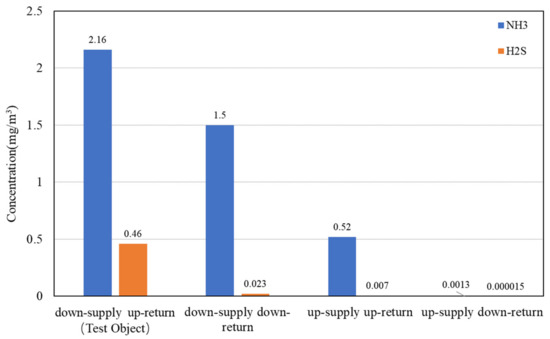
Figure 14.
The aerosol concentration at the height of breathing under different ventilation modes.
5.2. Indoor Air Age in Different Ventilation Modes
Figure 15 shows that when the downward ventilation mode was adopted, although it could expel pollutants quickly, the indoor airflow organization was poor and the fresh air entering the room could hardly reach the breathing height of toilet users.
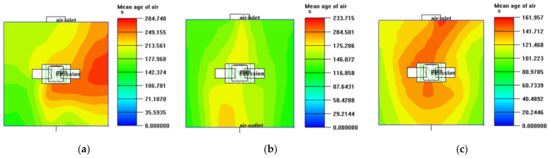
Figure 15.
Age of air in the UPTs at Z = 1.15 m with (a) down-supply and down-exhaust, (b) up-supply and up-exhaust, and (c) up-supply and down-exhaust ventilation modes.
When the up-supply and down-exhaust were adopted, the fresh air entered the room from the top inlet and then the fresh air sank, resulting in better air quality in the toilet. When the up-supply and down-exhaust ventilation mode was used, the air quality was good and the indoor airflow organization was suitable.
6. Conclusions
Unlike the outdoor open environment which is usually cleaned automatically by wind, mobile toilets are continuously closed with the pollution released from its source; thus, contamination may severely accumulate and eventually raise the risk of infection and lower the comfortability. In the present review, the design of humanization was discussed. The innovation of the study was to utilize CFD simulation to analyze the problem of tracer gas to reflect the danger of aerosol transmission, and the pollution distribution of urban mobile public health was studied for the first time. The results can be summarized as follows.
- (1)
- There is no obvious difference in the change rules of thermal environment in the three mobile public toilets. Temperature and humidity have the same large amplitude and short delay, the values of which are acceptable for people based on GB/T 17217-1998. However, odor intensity indicates that the environment in the mobile public toilets is unadopted but suitable for bacteria.
- (2)
- Different characteristics in the thermal environments can affect pollution dispersion. An increase in the temperature increases the intensity of ammonia. The temperature increased by 1 °C and the ammonia concentration increased by 0.036 mg/m3. While the hydrogen sulfide concentration does not have a significant correlation with temperature, and an increase in humidity does not drastically change the pollution concentration in mobile public toilets. This shows that this aerosol pollution dispersion will be stronger when the temperature is varied.
- (3)
- The pollution concentration level increases linearly with air velocity. Exhaust air volume and pollutant concentration show an obvious inverse relationship. With an increase of 0.1 m/s in the wind speed at the exhaust air outlet, the indoor ammonia concentration and hydrogen sulfide concentration were reduced by 0.1 mg/m3 and 0.002 mg/m3, respectively. Thus, it is possible to reduce the aerosol pollution concentration with enough ventilation.
- (4)
- It is best to use up-supply and down-exhaust for pollution discharge in mobile public toilets. Compared to the measured object, ammonia and hydrogen sulfide concentration decreased by 2.2 mg/m3 and 0.046 mg/m3, respectively, indicating that there is a higher potential for improving the indoor environment in mobile public toilets. Therefore, the air distribution mode of mobile toilets is extremely important.
Author Contributions
Conceptualization, R.L., G.L. and Y.X.; methodology, R.L. and G.L.; software, R.L. and G.L.; validation, R.L., G.L. and O.L.B.; formal analysis, G.L., W.L. and O.L.B.; investigation, G.L. and Y.X.; resources, W.L. and J.Z.; data curation, R.L. and G.L.; writing—original draft preparation, G.L.; writing—review and editing, R.L., G.L. and Y.X.; visualization, G.L. and Y.X.; supervision, R.L., J.Z. and G.L.; project administration, R.L. and O.L.B.; funding acquisition, R.L. and J.Z. All authors have read and agreed to the published version of the manuscript.
Funding
This research was supported by a grant from the National Natural Science Foundation of China (grant number: 51808506) and Science and Technology Department of Henan Province (grant number: 212102310573).
Institutional Review Board Statement
Not applicable.
Informed Consent Statement
Informed consent was obtained from all subjects involved in the study.
Data Availability Statement
Not applicable.
Acknowledgments
The authors would like to acknowledge and sincerely thank Yaling He, Yang Bai, and Jingshu Men for their valuable help in the experimental process of this study.
Conflicts of Interest
The authors declare no conflict of interest. The funders had no role in the design of the study; in the collection, analyses, or interpretation of the data; in the writing of the manuscript; or in the decision to publish the results.
Nomenclature
| Parameters | |
| tin | The indoor temperature of the object, °C |
| μt | The turbulent viscosity, N·s/m2 |
| ρ | The fluid density, kg/m3 |
| l | The mixed length of the fluid, m |
| S | The modulus of the average strain rate tensor of the fluid, s−1 |
| k | The von Kármán constant |
| d | The respective distance from the wall, m |
| u | The fluid velocity, m/s |
| P | The fluid pressure, Pa |
| R | The molar gas constant |
| T | The thermodynamic temperature of the fluid, K |
| Abbreviations | |
| UPT | Urban public toilet |
| EMU | Electric multiple unit |
| TMY | Typical meteorological year |
| A, B, C | Object A, object B, and object C |
| HVAC | Heating, ventilation, and air conditioning |
| CFD | Computational fluid dynamics |
| Subscripts | |
| max | Maximum of data |
| min | Minimum of data |
References
- Piao, S. Research on design of movable simple public toilets by the street. In Proceedings of the 2006 International Conference on Industrial Design & The 11th China Industrial Design Annual Meeting, Hangzhou, China, 18–20 November 2006. [Google Scholar]
- Alepu, O.E. Integrated Technology Development of Feces Disinfection, Odor Control and Resource Oriented Treatment for UDDT. Ph.D. Thesis, University of Science and Technology Beijing, Beijing, China, 2019. Available online: https://kns.cnki.net/KCMS/detail/detail.aspx?dbname=CDFDLAST2019&filename=1019146321.nh (accessed on 30 May 2019).
- Fu, B.; Xiao, X.; Li, J. Big Data-Driven Measurement of the Service Capacity of Public Toilet Facilities in China. Appl. Sci. 2022, 12, 4659. [Google Scholar] [CrossRef]
- Mawumenyo, S.B.; Patrick, B.; Sampson, O.K.; Damertey, S.D.; Esi, A.; Appiah, O.P.; Kobina, A. Inhibition of ammonia and hydrogen sulphide as faecal sludge odour control in dry sanitation toilet facilities using plant waste materials. Sci. Rep. 2021, 11, 17803. [Google Scholar]
- Ao, Y.; Wang, L.; Jia, X. Numerical simulation of pollutant diffusion law in bathroom and optimization of the locations and ways of exhaust outlet and makeup air. J. Shenyang Jianzhu Univ. (Nat. Sci.) 2011, 27, 720–724. [Google Scholar]
- Lee, H.K. Designing a Waterless Toilet Prototype for Reusable Energy Using a User-Centered Approach and Interviews. Appl. Sci. 2019, 9, 919. [Google Scholar] [CrossRef]
- Zhang, W.; Liang, J.; Lin, J. Contamination state of Staphylococcus aureus from toilets of primary schools in Guangzhou. Chin. J. Sch. Health 2020, 41, 295–297. [Google Scholar]
- Zhang, L.; Liu, W. Investigation on the pollution status of toilet door handles on passenger trains of Xi’an Railway Administration. Pract. Prev. Med. 2016, 23, 97–98. [Google Scholar]
- Zhao, L.; Zhang, H.; Wang, Q.; Sun, B.; Liu, W.; Qu, K.; Shen, X. Digital Twin Evaluation of Environment and Health of Public Toilet Ventilation Design Based on Building Information Modeling. Buildings 2022, 12, 470. [Google Scholar] [CrossRef]
- Barker, J.; Stevens, D.; Bloomfield, S.F. Spread and prevention of some common viral infections in community facilities and domestic homes. J. Appl. Microbiol. 2001, 91, 7–21. [Google Scholar] [CrossRef]
- Mendell, M.J.; Fisk, W.J.; Kreiss, K.; Levin, H.; Alexander, D.; Cain, W.S.; Girman, J.R.; Hines Cynthia, J.; Jensen Paul, A.; Milton, D.K.; et al. Improving the health of workers in indoor environments: Priority research needs for a national occupational research agenda. Am. J. Public Health 2002, 92, 1430–1440. [Google Scholar] [CrossRef]
- Nicas, M.; Nazaroff, W.W.; Hubbard, A. Toward understanding the risk of secondary airborne infection: Emission of respirable pathogens. J. Occup. Environ. Hyg. 2005, 2, 143–154. [Google Scholar] [CrossRef]
- Tellier, R. Review of aerosol transmission of influenza A virus. Emerg. Infect. Dis. 2006, 12, 1657–1662. [Google Scholar] [CrossRef]
- Wang, X.; Wang, Y.; Liu, Y. Hygienics Dictionary; Huaxia Publishing House: Beijing, China, 2000; p. 554. [Google Scholar]
- Environmental Science Dictionary; China Environmental Press: Beijing, China, 1991; p. 589.
- Tellier, R.; Li, Y.; Cowling, B.J.; Tang, J.W. Recognition of aerosol transmission of infectious agents: A commentary. BMC Infect. Dis. 2019, 19, 101. [Google Scholar] [CrossRef]
- Berik, T.; Zhanerke, B.; Martin, S. Assessing Access to WASH in Urban Schools during COVID-19 in Kazakhstan: Case Study of Central Kazakhstan. Int. J. Environ. Res. Public Health 2022, 19, 6438. [Google Scholar]
- Gundy, P.M.; Gerba, C.P.; Pepper, I.L. Survival of Coronaviruses in Water and Wastewater. Food Environ. Virol. 2008, 1, 294–299. [Google Scholar] [CrossRef]
- Liu, Z.; Wang, L.; Rong, R.; Fu, S.; Cao, G.; Hao, C. Full-scale experimental and numerical study of bioaerosol characteristics against cross-infection in a two-bed hospital ward. Build. Environ. 2020, 186, 107373. [Google Scholar] [CrossRef]
- Li, C.; Wang, R.; Lu, Z.; Zhai, X. Research on ventilation airflow organization and indoor environment for public lavatory. In Proceedings of the 2009 Annual Conference of the Chinese Society of Refrigeration, Tianjing, China, 1 November 2009. [Google Scholar]
- Li, Y. An evaluation of the ventilation performance of new SARS isolation wards in nine Hospitals in Hong Kong. Indoor Built Environ. 2007, 16, 400–410. [Google Scholar] [CrossRef]
- Yue, G.; Lu, M.; Ji, H. Numerical simulation of indoor pollutant diffusion on ventilation optimization. Fluid Mach. 2014, 42, 81–85. [Google Scholar]
- Ji, S.; Mao, J. Pollutant concentration research of toilet in natural ventilation conditions. Contam. Control Air Cond. Technol. 2012, 4, 22–24. [Google Scholar]
- Liu, H.; Wei, X.; Chou, X. Simulation calculation of the distribution law of pollutant diffusion concentration in office based on FLUENT. J. Jilin Jianzhu Univ. 2019, 36, 48–52. [Google Scholar]
- Tung, Y.; Hu, S.; Tsai, T. Influence of bathroom ventilation rates and toilet location on odor removal. Build. Environ. 2009, 44, 1810–1817. [Google Scholar] [CrossRef]
- Tung, Y.; Shih, Y.; Hu, S.; Chang, Y. Experimental performance investigation of ventilation schemes in a private bathroom. Build. Environ. 2010, 45, 243–251. [Google Scholar] [CrossRef]
- Chung, K.-C.; Chiang, C.-M.; Wang, W.-A. Predicting contaminant particle distributions to evaluate the environment of lavatories with floor exhaust ventilation. Build. Environ. 1997, 32, 149–159. [Google Scholar] [CrossRef]
- Xu, M. Improvement of ventilation in residential toilets. Hous. Sci. 1994, 5, 39. [Google Scholar]
- ASHRAE. Thermal environmental conditions for human occupancy. In ASHRAE-55; American Society of Heating, Refrigerating and Air-Conditioning Engineers: Atlanta, GA, USA, 2013. [Google Scholar]
- GB/T 17217—1998; Hygienic Standard for Communal Toilet in City. Standards Press of China: Beijing, China, 1998.
- T/ASC 02-2016; Assessment Standard for Healthy Building. Standards Press of China: Beijing, China, 2016.
- Wang, H.-H.; Lin, K.-J.; Chu, S.-H.; Chen, H.-W.; Chiang, Y.-J.; Lin, P.-H.; Wang, T.-M.; Liu, K.-L. The impact of climate factors on the prevalence of urolithiasis in Northern Taiwan. Biomed. J. 2014, 37, 24–30. [Google Scholar] [CrossRef] [PubMed]
- Sirohi, M.; Katz, B.F.; Moreira, D.; Dinlenc, C. Monthly variations in urolithiasis presentations and their association with meteorologic factors in New York City. J. Endourol. 2014, 28, 599–604. [Google Scholar] [CrossRef] [PubMed]
- Akers, T.G.; Bond, S.; Goldberg, L.J. Effect of temperature and relative humidity on survival of airborne Columbia SK group viruses. Appl. Microbiol. 1966, 14, 361–364. [Google Scholar] [CrossRef]
- Ge, Z.-Y.; Yang, L.-M.; Xia, J.-J.; Fu, X.-H.; Zhang, Y.-Z. Possible aerosol transmission of COVID-19 and special precautions in dentistry. J. Zhejiang Univ. 2020, 21, 361–368. [Google Scholar] [CrossRef]
- Gorbunov, B. Aerosol particles laden with viruses that cause COVID-19 travel over 30m distance. J. Prepr. 2020, 546, v2. [Google Scholar] [CrossRef]
- Portarapillo, M.; di Benedetto, A. Methodology for risk assessment of COVID-19 pandemic propagation. J. Loss Prev. Process Ind. 2021, 72, 104584. [Google Scholar] [CrossRef]
- Rencken, G.K.; Rutherford, E.K.; Ghanta, N.; Kongoletos, J.; Glicksman, L. Patterns of SARS-CoV-2 aerosol spread in typical classrooms. Build. Environ. 2021, 204, 108167. [Google Scholar] [CrossRef]
- Sherman, M.H. Tracer-gas techniques for measuring ventilation in a single zone. Build. Environ. 1990, 25, 365–374. [Google Scholar] [CrossRef]
- Ghazi, C.J.; Marshall, J.S. A CO2 tracer-gas method for local air leakage detection and characterization. Flow Meas. Instrum. 2014, 38, 72–81. [Google Scholar] [CrossRef]
- Togi, A.; Smith, J.D.T. Lighting the dark molecular gas: H2 as a direct tracer. Astrophys. J. 2016, 830, 18. [Google Scholar] [CrossRef]
- Zhao, J. Simulation and Validation of Hydrogen Sulfide Removal from Fan Ventilated Confined-Space Manure Storages. Ph.D. Thesis, The Pennsylvania State University, Stetter Colledge, PA, USA, 2006. Available online: https://elibrary.asabe.org/abstract.asp?aid=23278 (accessed on 3 October 2006).
- Kirk, H.; Friesen, R.K.; Pineda, J.E.; Rosolowsky, E.; Offner, S.S.R.; Matzner, C.D.; Myers, P.C.; di Francesco, J.; Caselli, P.; Alves, F.O.; et al. The Green Bank Ammonia Survey: Dense Cores under Pressure in Orion A. Astrophys. J. 2017, 846, 144. [Google Scholar] [CrossRef]
- Wang, F. Computational Fluid Dynamics-Principle and Application of CFD Software; Tsinghua University Press: Beijing, China, 2004. [Google Scholar]
- Chen, Q.; Xu, W. A zero-equation turbulence model for indoor airflow simulation. Energy Build. 1998, 28, 137–144. [Google Scholar] [CrossRef]
- Zhao, B.; Li, X.; Yan, Q. Simulation of indoor air flow in ventilated room by zero-equation turbulence model. J. Tsinghua Univ. (Sci. Technol.) 2001, 41, 109–113. [Google Scholar]
- Airpak 3.0 User’s Guide; Fluent Inc.: Lebanon, NH, USA, 2007.
- GB/T 18883-2002; Indoor Air Quality Standard. Standards Press of China: Beijing, China, 2002.


Publisher’s Note: MDPI stays neutral with regard to jurisdictional claims in published maps and institutional affiliations. |
© 2022 by the authors. Licensee MDPI, Basel, Switzerland. This article is an open access article distributed under the terms and conditions of the Creative Commons Attribution (CC BY) license (https://creativecommons.org/licenses/by/4.0/).