Abstract
Underground commercial buildings have received increasing attention as an emerging place of consumption. However, previous studies on underground commercial buildings have mainly focused on the impact of a specific environment on comfort or energy consumption. Few studies have been conducted from the perspective of functional use. The purpose of this paper is to investigate, in terms of functional angles, the indoor thermal environment and air quality of an underground commercial building in Zhengzhou, China, and put forward an optimal control strategy of ventilation organization. The results showed that the relative humidity of the underground shopping mall was generally above 60%, and the average temperature of 29.1 °C led to a thermal comfort problem in the catering area in summer. Meanwhile, the concentration of CO2 exceeded the allowed figures during the peak of the customer flow rate, and PM2.5 concentration in the catering area also exceeded the standard, by 43.3% and 33.3%, respectively. Furthermore, to solve the indoor thermal environment and air quality problems found in the field measurements, this study assessed the air distribution by adopting three different air supply schemes for the catering area. Optimization results showed that compared with the ceiling supply, the side supply scheme kept the air temperature 0.4 °C cooler in summer and 0.5 °C warmer in winter. The temperature uniformity increased by 5.4% and 3.7%, and the velocity uniformity increased by 6.5% and 8.8%, respectively. This study can provide theoretical support for thermal environment construction and ventilation organization control of underground commercial buildings.
1. Introduction
The global economy continues to grow steadily, and at a high rate. Modern cities have become the most concentrated areas of human activity, growing at an unprecedented rate and scale in emerging regions of the world, of which China is a representative country []. China’s urban population has increased by 298.5 million in the last forty years [], and as the urban population expands, a large number of urban issues have emerged, such as land constraints [], high energy consumption [], ecosystem imbalance [], urban heat island effect [,], environmental degradation [], and poor air quality [,]. According to British Petroleum (BP) Statistical Review of World Energy, China’s carbon emissions reached 9899.3 million tons in 2020, accounting for 30.7% of the world’s total []. In this context, urban settlement environments are facing multiple challenges, forcing people to pursue the ultimate use of land resources [,]. The comprehensive use of urban underground space is an important measure to solve the three major crises of urban population, resources and environment [].
Efficient and integrated use of the underground can contribute to several sustainable development goals such as saving land resources [], reducing energy consumption [], alleviating traffic congestion [] and improving air quality [], thus, the exploration and utilization of underground space is at a stage of rapid development. Data released by the Strategic Consulting Center of Chinese Academy of Engineering showed that the scale of underground space in China increased by 259 million square meters in 2020 [], of which the commercial use in most developed cities accounted for around 25% []. Underground commercial facilities generally have the highest utilization efficiency among underground facilities []. By providing the public with commerce, social, catering, entertainment and other functions, underground commercial buildings have become an important component of expanding the capacity of commercial facilities and promoting city vitality. In addition, the combination of commercial spaces with other underground spaces including underground metro systems, underground squares and underground passages, can promote its commercial value [].
During the past decade, many scholars have intensively investigated the environment of underground spaces from the perspectives of comfort and energy consumption. Some researchers emphasized the importance of the thermal [], acoustic [] and light environments [] of underground space for human comfort and health, and revealed that the thermal sensation of customers in underground commercial buildings is different from above ground. Chun et al. [] measured the temperatures of underground shopping malls and concluded that compared with department stores, the acceptable temperature range in underground shopping malls was broader. Ganesh analyzed the effect of the inlet diffuser orientation on the indoor thermal comfort of occupants, and found that indoor air temperature affected PMV and PPD more than air movement []. Li et al. [] conducted measurements and questionnaire surveys to investigate the thermal environments of six underground shopping malls in Nanjing, China; their results indicated that customers perceived warmth to be less dramatic than the PMV predicted in underground malls. A study of Tehran metro stations showed that passengers’ noses, eyes and throats became dry and uncomfortable as the relative humidity in the Tehran metro was below 30% [].
Inadequate indoor air quality in public facility buildings has become a central issue and has caused widespread public concern []. Ventilation in an underground mall is even worse, where total volatile organic compounds, PM2.5, formaldehyde, radon gas and other pollutants are more likely to concentrate in an underground space [], putting occupants at a higher risk for poor indoor air quality and health problems [,,]. For example, Gao and Jia [,] investigated the air quality of underground shopping malls and found that the concentrations of pollutants were clearly above the standard. Tao et al. [] concluded the correlations between formaldehyde and TVOC concentrations and indoor air velocity, indoor temperature, and indoor relative humidity, through the field measurement of nine underground malls. The correlations noted were that increasing indoor ventilation rates or reducing the indoor temperature and indoor relative humidity appeared to decrease the indoor concentrations of formaldehyde and TVOC. Some studies proposed an optimal design to improve the natural ventilation [] and light environment [] from the perspective of saving energy. In an evaluation of ventilation performance of indoor and outdoor space, the CFD model is the most relevant method because of cost-effectiveness, informative technique, and proficiency to predict air velocity patterns and ratios in buildings []. In some research, CFD simulations were performed to improve occupant satisfaction [,,] and indoor environment quality [,]. Chen used the CFD model to accurately reflect the changes in kitchen smoke concentration and assess kitchen air pollution, thereby improving the thermal environment [].
Underground commercial buildings have gradually developed from utilization for a single commercial function, to modern underground complexes. The present studies have mainly focused on the impact of a specific environment on comfort or energy consumption, and few studies have been conducted from the perspective of functional use. Personnel flow and merchandise vary in different functional areas. Therefore, it is imperative to investigate the thermal environment and air quality of underground commercial buildings for different functional areas. Underground spaces mainly rely on air-conditioning and ventilation systems to create satisfying thermal environments, therefore, air distribution has a large influence on the indoor thermal environments of underground shopping malls. Analyzing the effects of air-conditioning design parameters on the building environment via simulations is, thus, an effective method for optimizing air-conditioning design schemes []. The problem of using air distribution to create a comfortable thermal environment, especially in underground commercial buildings, is a critical problem that needs to be solved.
This study analyses the thermal performance and air quality of a multifunctional underground commercial building in Zhengzhou, central China, to optimize air distribution. The subject of the study has been in operation for 15 years, and the higher temperatures are associated with older air conditioning equipment. Therefore, based on field measurements, this paper emphasizes the use of CFD simulations to reduce the supplied air temperature to achieve a more comfortable indoor thermal environment, and then discusses the evaluation of different airflow organization methods using average indoor air temperature, air velocity and non-uniform coefficient for the same supplied air temperature operating conditions, in order to obtain an optimal design solution strategy. Finally, this study aims to facilitate the optimization of the thermal environment of multifunctional underground commercial buildings, which will provide theoretical support for the design of airflow organization in underground commercial buildings.
2. Materials and Methods
2.1. Data Source
An underground shopping mall in Zhengzhou, in central China’s Henan Province, was selected as a representative test case. The underground commercial building is located in the prime business district of Zhengzhou, close to the railway station, with high pedestrian flow. The underfround shopping mall was opened on 28 December 2008, located in the Zhengzhou Railway Station’s gold business circle, with a total area of 100,000 m2.
Field observation revealed that there were no natural vents in the mall except in the stairwells, which resulted in poor natural ventilation. The indoor and outdoor air exchange was mainly through HVAC and mechanical exhaust systems. The airflow rate of the air conditioning system was 1.8 m/s, and the air change rate was 3.1 h−1. Experiments were performed on the underground floor, which mainly included three functional areas: catering, clothing, and sundry goods. In the catering area, there were sales windows on both sides, and dining areas in the middle; this area operated mainly to cook, sell and consume fried, roasted, and stir-fried based food. Shops were spread over the middle and both sides of the garment area. Business was booming and customer traffic was at a high flow. The sundry goods area was a large space, but business was slow with many closed shops and few customers. The flow of people in different area was measured during the test periods. In catering area, at the peak time of use, people sat closely together, with an upright posture. The clothing area was a popular place of business, with the peak flow of people reaching up to 180 persons/h; they were mostly walking, and in a state of slight activity. In general, the department store area was relatively deserted and the turnover of people was about 70 persons/h.
2.2. Test Procedure
To investigate the thermal environments of the different functional areas, variables such as indoor and outdoor air temperature, relative humidity, inner wall temperature and indoor wind speed were continuously monitored during summer (3 August 2020–30 August 2020) and winter (15 December 2020–19 December 2020). To evaluate the indoor air quality of the underground mall, PM2.5, CO2, formaldehyde, and TVOC concentrations were monitored in different areas during the tests.
The locations of the monitoring points in the test room were selected according to CECS402: 2015 Urban Underground Space Operation and Management Standard []. A typical store was selected in each region, and the measurement point was located within the store. As the interior area of each store was less than 50 m2, only one point was situated in each store and another point was situated in the corridor, as shown in Figure 1. The height of each sampling point was consistent with the human respiratory zone, i.e., between 1.2 and 1.5 m above the floor level []. Therefore, the indoor air temperature and humidity measurement points were centrally located at heights of 1.5 m.
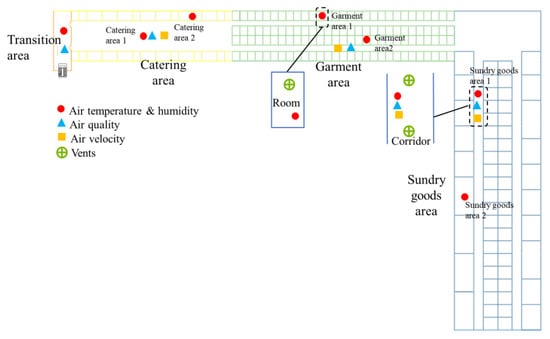
Figure 1.
Arrangement of measuring points in the underground shopping mall.
The CO2, PM2.5, TVOC, and formaldehyde concentrations were selected as environmental pollution indicators to evaluate the air quality in underground shopping malls. Considering the instrument startup and data stability time, pollutant concentrations were collected in different areas once every hour during operation. To further analyze the indoor air, the test results were compared with the requirements stipulated in the current Chinese Standard GB/T18883-2002 Indoor Air Quality Standard []. The measurement instruments and parameters used are summarized in Table 1. All loggers were calibrated in the laboratory prior to testing.

Table 1.
Monitored data and technical specification of measuring instruments.
2.3. Model Description
2.3.1. Physical Model
In considering the catering area of the underground shopping mall as the simulation object, Airpak software was used for simulation. The size of the model room was 30 m (length) × 40 m (width) × 4 m (height). The air supply mode was upper supply and upper exhaust. The size of the diffuser (air inlet) was 0.3 m × 0.3 m, with a supply speed of 1.5 m/s in a vertical downward direction. The physical model of the room is shown in Figure 2.
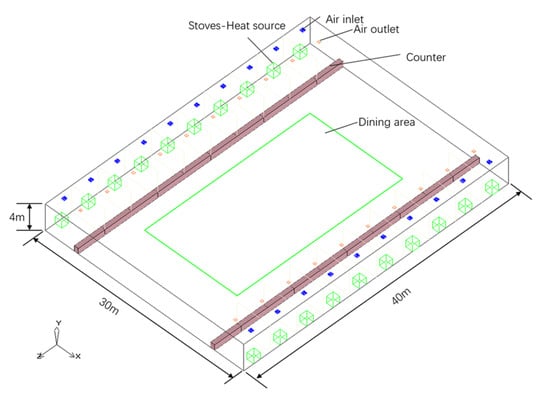
Figure 2.
Physical model of the catering area.
Airpak contains five turbulence models, among which the Indoor Zero equation model is simple and fast, and can be used to quickly and accurately design and analyze indoor airflows in HVAC systems. Therefore, the Indoor Zero equation model was used to simulate the indoor air temperature in the underground shopping mall. The model used a hexahedral unstructured mesh to discretize the computational area. Local grid encryption was then carried out on the surface of the air supply and return ports, and the total number of grids was 1.02 million.
2.3.2. Mathematical Model
Airpak software includes four types of turbulence models: the mixed-length zero equation model, the Indoor Zero equation model, the RNG k-ε turbulence model, and the k-ε two-equation model. The Indoor Zero equation model can be used to quickly and accurately, in the field of HVAC, design and analyze the indoor airflow problem. Therefore, the Indoor Zero equation model was applied to simulate the air distribution of the underground shopping mall.
The governing equations are given below according to the assumptions in reference [].
Momentum equation:
Energy conservation equation:
where is the air density, kg/m3; is the velocity vector, m/s; is the pressure, Pa; is the external volume force, N/m3; g is the gravitational volume force, m/s2; is the thermodynamic temperature, K; is the sensible enthalpy, kJ/kg; is the thermal conductivity, W/(m∙K); and is the volumetric heat source term, W/m3.
2.3.3. Boundary Conditions
The research object is a deeply buried underground building, and its orientation is defined according to the entrance direction. The six sides of the room were designated as ceiling, floor, front wall, back wall, left wall, and right wall. The ceiling, floor, left wall, and right wall are surrounded by soil. For deeply buried underground buildings, the stratum temperature is constant, which can be considered equal to the annual average ground temperature. Therefore, the wall temperature was set as the annual average ground temperature of Zhengzhou, i.e., 16 °C, and the ceiling exchanges heat with the outside with a coefficient of 0.7 W/m2∙°C.
There was no temperature difference between the other walls and adjacent rooms, which were in an adiabatic state. The catering area had a large space with food counters on both sides and a dining area in the middle. The kitchens, with heat sources such as stoves, were connected to the counters. The tables and counters were not the heat source, and would not be exothermic to the indoor area, therefore, did not have a remarkable influence on the indoor thermal environment. Owing to the fact that the internal structure could not be completely modeled, the stove and other heat dissipation equipment were concentrated in a 6 kW heat source in each kitchen. The dining area, personnel, and food load were evenly distributed in a 0.8 m plane heat source with a load of 72.4 W/m2. Lighting loads were also evenly distributed along the ceiling and calculated as 14 W/m2. Considering the influence of human body heat dissipation, human body heat dissipation was set as 92 W/person, taking into account the dining area capacity and actual site statistics, while the number of persons dining was set as 200 people.
3. Results
3.1. Description of the Underground Thermal Environment
Understanding the thermal environment of an underground shopping mall under extreme climatic conditions is the premise for studying the comfort and optimal design of an underground commercial building. According to the monitoring data from different zones, the thermal and humid environmental characteristics of an underground shopping mall were obtained.
3.1.1. Temperature
Owing to the functional differences of various areas, the indoor temperature of different area was monitored, and the influence of outdoor air temperature on indoor temperature under extreme climatic conditions was studied. Variations of indoor and outdoor air temperature are shown in Figure 3. The relationships between indoor and outdoor temperatures are shown in Figure 4. Figure 4a shows the variation of indoor temperature with outdoor temperature. The largest variation in outdoor temperature was 11.2 °C (from 23.9 to 35.1 °C) during summer, with an average value of 27.6 °C. The temperatures of the garment and sundry goods areas were stable, but the temperature of the catering area fluctuated vastly. During the monitoring period, the catering area temperatures ranged between 27.9 and 32.4 °C, with an average value of 29.1 °C. The garment area air temperature ranged between 25.6 and 28.8 °C. The temperature fluctuation of the sundry goods area was lesser still, with a variation of only 1.5 °C (26.2–27.7 °C) and an average value of 26.8 °C.

Figure 3.
Variation of air temperature in summer (a), and winter (b).
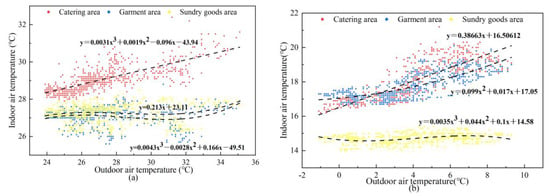
Figure 4.
Correlation analysis between indoor and outdoor air temperatures in summer (a), and winter (b).
Figure 4b shows that the outdoor temperatures during winter ranged between −1.1 and 9.3 °C, with an average value of 4.2 °C. The indoor air temperature of the shopping mall was more stable in winter than in summer. The temperature of the catering area was affected by the outdoor temperature and cooking, varying from 16.2 to 21.2 °C, with an average of 18 °C. Meanwhile, the average air temperature of the garment area was 17.8 °C, ranging between 16.7 and 20.1 °C. The temperature of the sundry goods area was generally low, with small fluctuations of 1.4 °C (14–15.4 °C) and an average temperature of 14.7 °C.
When the outdoor temperature fluctuated vastly under extreme climatic conditions, the fluctuation range of the indoor temperatures was narrow, indicating that the underground shopping mall, as a semi-underground building envelope, had good heat storage capacity. Owing to the semi-closed structure and good heat insulation properties of the underground shopping mall, the soil stored and released heat effectively to limit ambient temperature fluctuations and enhance stability. Moreover, the location of the catering area was close to the transition area, which was greatly affected by external weather changes. However, the sundry goods area was located in the deep interior of the mall, which enabled the most stable temperature and was not significantly affected by outdoor temperature changes.
3.1.2. Relative Humidity
Compared with aboveground spaces, underground spaces are relatively closed off by their low terrain. Furthermore, the envelope structures of underground buildings are directly in contact with rock and soil, leading to envelope moisture transfer. These factors result in high humidity in underground spaces.
It can be seen from Figure 5 that the relative humidity in all areas was rather high during summer. The highest relative humidity in the catering area was 86.5%, due to a large amount of moisture transfer from food. At measurement point 2, the indoor dining activity had a greater impact than the outdoor relative humidity, and the peak value was observed mainly around dining times. However, the humidity trends in the garment and sundry goods areas were more influenced by the business hours of the shopping mall. The highest and lowest humidity in the garment area was 82.1% and 79.8%, respectively. The maximum and minimum humidity in the sundry goods area was 81.8% and 67.4%, respectively, among which high humidity values were observed mainly during non-business hours. During business hours (10:00–19:00), the air-conditioning devices in the shopping mall were turned on and the humidity decreased, then increased again at night.

Figure 5.
Variation of relative humidity in summer (a), and winter (b).
In winter, the relative humidity inside the shopping mall was generally higher than outside the mall. The humidity increased to up to 53.4% during dining times and decreased at night, and the average humidity in the catering area was 39.7%. In contrast, the humidity values in the garment and sundry goods areas decreased during business hours under the influence of air conditioning and increased at night. The fluctuation range of humidity values in the garment area was between 31% and 38.6%. Due to its location away from the entrance–exit and a lower flow of customers, the humidity in the sundry goods area was significantly higher than in the garment area, with the highest humidity being 46.9% and the lowest being 36.7%.
These results indicated that the temperature in summer was close to, or lower than, the dew point temperature of air. Owing to the semi-closed structure, the moisture was trapped, which led to high relative humidity. In winter, the humidity of the underground shopping mall was higher than outside, but still within standard requirements. Therefore, improving the natural ventilation of the underground shopping mall or designing ventilation vents may be helpful to ensure the comfort requirements of customers.
3.2. Underground Air Quality
As a public building and a place of consumption for customers, shopping malls are characterized by various shopping areas and dense streams of people. Nevertheless, air quality issues may be observed as underground commercial buildings are rather confined spaces.
3.2.1. Underground Air Pollution Level in Different Merchandise Sections
Formaldehyde and TVOC emissions are affected by many factors [], for example, temperature and humidity, ventilation conditions, premises decoration materials, etc., and in the case of the subject of this paper, they are also influenced by the type of goods sold in the area. By analyzing the air qualities at different merchandise sections, we sought to determine the impacts of various displayed or manufactured goods on air quality.
The pollutant concentrations in different merchandise sections varied. It can be seen from Figure 6 that the CO2 concentration in the transition and sundry goods areas was lower than the limit values, whereas it was slightly above the limit in the catering area. In this mall, the garment area had the highest CO2 concentration, since this section often has high business activity, with customers staying for longer times. The transition and catering areas were heavily polluted with PM2.5 because the food manufacturing process generates high levels of PM2.5. The kitchen close to the dining area had poor ventilation, thereby leading to excess pollution in the catering area, which also contributed to the pollution in the transition area. Volatile substance concentrations, such as those of formaldehyde and TVOC in underground shopping malls, were all within the safe range, except for the catering area.
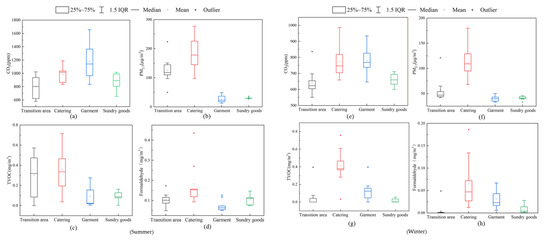
Figure 6.
The indoor CO2 (a,e), PM2.5 (b,f), TVOC (c,g), and formaldehyde (d,h) levels of different merchandise sections.
In winter, the concentration of CO2 in each section of the underground shopping mall met the health requirements. The concentrations of the other pollutants in the garment and sundry goods areas were also within standard limits. The PM2.5 concentration in the catering area was severely in excess, which also increased the PM2.5 concentration in the adjacent transition area to be much higher than the standard limit. The concentrations of TVOC and formaldehyde in the dining area were slightly above the standard values, and there was no excess in the transition area.
3.2.2. Underground Air Pollution Level at Different Time Periods
Occupant activities and occupant density affect indoor air pollutant distributions and fresh air volumes [,]. Trends were observed in customer flow rates throughout business hours: an increasing number of customers entered the catering area during dining times, while a customer ‘rush’ was observed in the garment and sundry goods areas in the afternoon. Figure 7a shows that the CO2 concentration of the mall was lower than the limit value in all areas except the garment area. The CO2 concentration in the garment area rapidly increased during the customer rush in the afternoon. This may be attributed to the fact that a greater number of customers shopped in the clothing area which had insufficient ventilation, thereby leading to the increase in CO2 concentration. In the catering and transition areas, food preparation activities increased the PM2.5 concentrations to exceed the standard. As for TVOC and formaldehyde, their increased concentrations were attributed to fuel gas burning and the production of lampblack. Such pollutants are more volatile under high-temperature conditions. Food production and heat dissipation in the catering area inevitably caused temperature rise and pollutant aggregation, which was difficult to dilute.
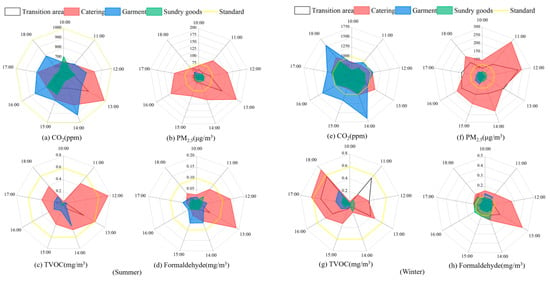
Figure 7.
The indoor CO2 (a,e), PM2.5 (b,f), TVOC (c,g), and formaldehyde (d,h) levels at different times in summer.
As shown in Figure 7, the CO2 concentration in the underground shopping mall in winter typically soared during business hours but did not exceed the standard; however, PM2.5 was the prime pollutant in winter. In the catering area, the PM2.5 concentration exceeded the standard, which also affected the air quality in the transition area. In addition, both TVOC and formaldehyde concentrations were over the standard values at mealtimes.
Underground floors have poorer indoor air quality than aboveground floors because of their enclosed structures and poor natural ventilation []. Pollutants in the air are, therefore, hard to dilute when the shopping mall is crowded or high levels of pollutants are generated during some activities. However, increasing indoor ventilation and decreasing indoor temperature can reduce indoor formaldehyde and TVOC concentrations []. Thus, by optimizing air distribution, high indoor temperature and poor air quality in the catering area may be improved.
3.3. Simulation Optimization of Ventilation and Air Distribution in Catering Area
In air-conditioned buildings, in addition to changing the set air supply temperature and speed, various air supply modes will also form different air distributions. Underground shopping malls generally adopt the air distribution form of upper supply and upper return. According to the measured analysis, under this air distribution form, the air quality of the underground shopping mall was poor, and the thermal environment of different functional areas barely arrived to a satisfactory thermal comfort. As a shopping mall area with special functions, the connecting design of the kitchen and dining area was convenient, but also caused the accumulation of heat and pollutants. In addition, without adequate ventilation, the underground building was prone to high indoor temperature, poor air quality, and unsanitary conditions during the peak period. For the catering area to have a reasonable air distribution, effective cooling and ventilation are key to improving the internal environment, so Airpak software was used simulate a change to the air distribution of the catering area to optimize the thermal environment.
3.3.1. Optimization Simulation of Air Distribution in the Catering Area
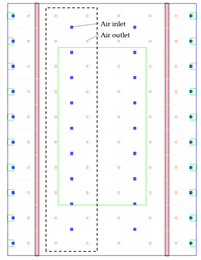
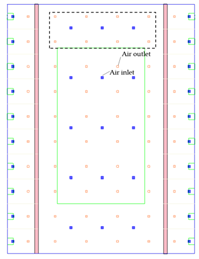
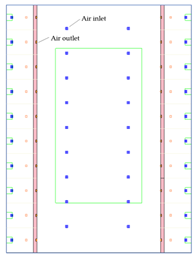
The poor thermal environment in the catering area was attributed to the high internal cooling load and supply air temperature under actual working conditions. Therefore, in the simulation, we reduced the air supply temperature in the catering area from the original supply air temperature (24 °C), to simulate three different air supply scenarios. The airflow rate of the air-conditioning system was 1.8 m/s, and the air exchange rate was 3.6 h−1. Three types of air-conditioning supply schemes were designed for the catering area by varying the locations of the inlet and outlet. The three kinds of supply air paths are described in Table 2, among which Scheme 1 (upper supply upper return) was the one in practical use. The research focused on the occupied region at a height of 1.5 m above the floor in the dining area. The optimal air supply temperature was 21 °C in summer and 20 °C in winter, and the upper supply velocity was 1.5 m/s and side supply velocity was 3.5 m/s. As simulated results, the temperature, wind speed profile of Y = 1.5 m (customer activity area) and temperature profile, and velocity vector diagram of Z = 18 m (cross-section of air supply outlet in the center of the dining area) were chosen for display. The temperature and velocity uniformities of the different schemes were compared to select a more suitable air distribution mode in the catering area.
- (1)
- Scheme 1: Actual condition.

Table 2.
Different scheme conditions.
In the actual condition, the diffuser delivered air vertically downwards, which greatly influenced the lower area of the air outlet. The distributions of temperature and velocity at a height of 1.5 m above the ground in the catering area are presented in Figure 8, Figure 9, Figure 10 and Figure 11.
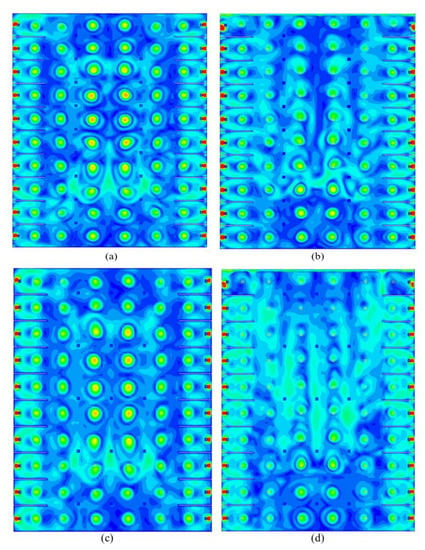
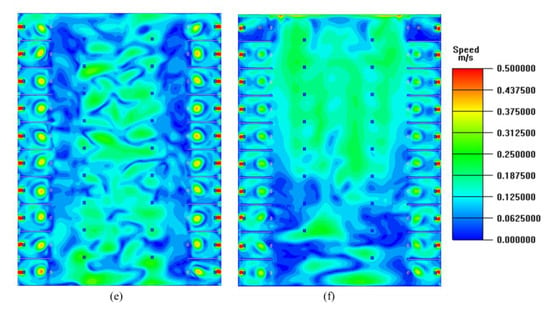
Figure 8.
Velocity distribution at Y = 1.5 m: Scheme 1 in summer (a), Scheme 1 in winter (b), Scheme 2 in summer (c), Scheme 2 in winter (d), Scheme 3 in summer (e), and Scheme 3 in winter (f).
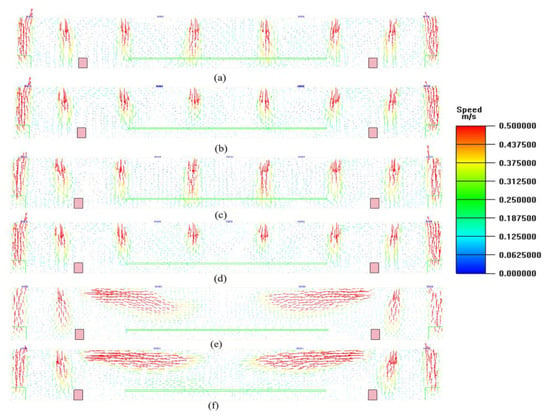
Figure 9.
Vector diagram of velocity distribution at Z = 18 m: Scheme 1 in summer (a), Scheme 1 in winter (b), Scheme 2 in summer (c), Scheme 2 in winter (d), Scheme 3 in summer (e), and Scheme 3 in winter (f).
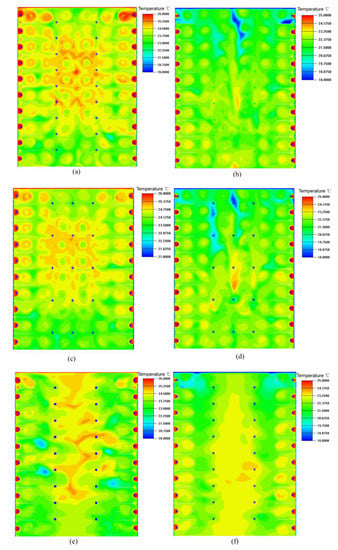
Figure 10.
Temperature distribution at Y = 1.5 m: Scheme 1 in summer (a), and 1 in winter (b); Scheme 2 in summer (c), and in winter (d); Scheme 3 in summer (e), and in winter (f).
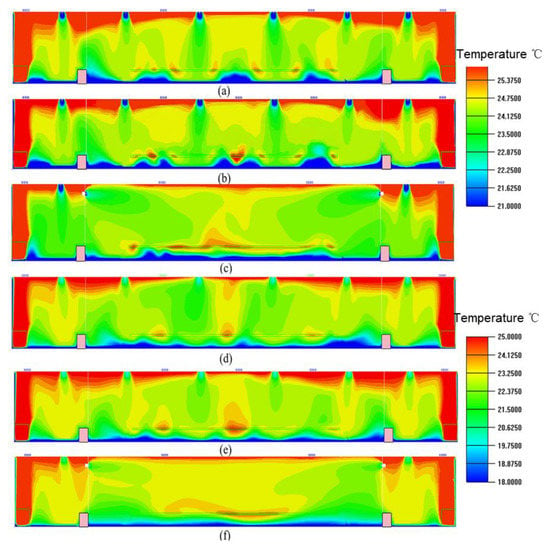
Figure 11.
Temperature distribution at Z = 18 m: Scheme 1 in summer (a), and in winter (d); Scheme 2 in summer (b), and in winter (e); Scheme 3 in summer (c), and in winter (f).
According to Figure 8a,b and Figure 9a,b, the air velocity distributions show that in the catering area, the cold air in summer dropped and then formed a backflow near the dining tables at a height of about 0.6–2 m. In the occupied region, the wind speed was appropriate with an average value of 0.109 m/s. In winter, most airflows moved downward and mixed with cold air to form the backflow. A part of the hot air flowed along the ceiling and moved downward after colliding with the other airflows. The average indoor air velocity was about 0.119 m/s. In the actual condition, the velocity values in the occupied regions were less than 0.3 m/s, excluding the region around the air supply axis, which may cause discomfort to some customers.
Figure 10a,b and Figure 11a,b illustrate the thermal environments in the catering area. The wall of the connecting part of the dining area and the exit was affected by the outside temperature, and the other wall was in the adiabatic state, which is connected with the soil or the adjacent room, except the wall. The heat dissipation from people and food caused high temperatures in the middle. In winter, the indoor temperature distribution was uneven, and the hot air from the air outlets was inhaled by the return air outlets on both sides before it was entirely mixed with the cold air. As seen from the longitudinal temperature distribution of the room in Figure 11a,d, the air temperature was suitable under interactions of the lower ground temperature and supply air. Therefore, there was no obvious stratification in the occupied area. The ground temperature was lower, while the roof was affected by the external environment and lighting heat dissipation, and the temperature was higher.
- (2)
- Scheme 2: Horizontal Exhaust.
The simulation results in Figure 8c,d show that air velocities in the most occupied regions of the dining area were within 0.3 m/s. The mean air velocity was 0.11 m/s in summer and 0.117 m/s in winter. As shown in Figure 9c,d, the distribution vector diagram of the air velocity shows a trend similar to the actual condition, where the cold air sent from the air supply outlet sank, and the backflow was formed between the two adjacent air supply outlets. Compared with the actual condition, the uniformity of velocity distribution improved after changing the location of the return air outlet, and the phenomenon of excessive wind speed under the air outlets was also reduced.
Figure 10c,d shows the temperature distribution at a height of 1.5 m under the horizontal exhaust scheme. The average indoor temperature in the room was 24.5 °C in summer and 22.3 °C in winter. Compared with the actual conditions, the temperature did not change significantly. In winter, owing to the low outside temperature, the temperature near the entrance was lower, about 18.5 °C, while the maximum temperature in the dining area was 24.4 °C. The temperature difference of 5.9 °C would cause discomfort to customers. Figure 11c,e reveals the longitudinal temperature change in the catering area; it illustrates that the temperature in the middle of the activity area was suitable, although there were extreme temperatures near the ground and roof. The longitudinal temperature difference did not exceed 1 °C, which would be comfortable for customers.
- (3)
- Scheme 3: Side supply.
Figure 8e,f and Figure 9e,f depict the velocity distributions under side supply. The air velocity from the air outlet was relatively high, but the velocity at the height of 1.5 m was less than 0.3 m/s, with an average value of 0.118 m/s. In winter, under the side supply scheme, the air velocity gradually decreased with the sinking of hot air. The velocities in most areas of the room ranged between 0.1 and 0.2 m/s, and the mean air velocity was 0.126 m/s. Compared with Scheme 1 and Scheme 2, it was seen that good uniformity of the velocity could be achieved at a height of 1.5 m when adopting the side supply scheme. The average air velocity of side supply was greater than for the other two schemes but lower in the occupied zone, which had better air mobility and no impact on the occupants.
According to Figure 10e,f, the temperature distribution showed that high temperatures were mainly distributed in the dining area during summer, while the temperatures near the air outlet were low due to the sinking of the cold air. The mean temperatures in summer and winter were 24.1 °C and 22.8 °C, respectively. Figure 11e,f shows that compared with the upper supply, the longitudinal temperature distribution under the side supply was more uniform, indicating that the side supply had better effects on indoor temperature regulation.
3.3.2. Model Validation
The measured air temperatures in the catering area were used to evaluate the simulation performance. The actual conditions included the upper supply upper return air-conditioning scheme with a supply temperature of 23 °C. There were two measuring points in the catering area, one located at the center of the dining area and the other located at the counter. The simulated outdoor temperature was 35 °C, the preset indoor temperature was 24 °C, and the heat of the top was 7.7 W/m2. All the kitchen stoves and other cooling equipment were concentrated as one heat source, and the calculated heat dissipation was 6 kW. The personnel and food loads in the dining area were uniformly distributed in the plane heat source at a height of about 0.8 m, with a load of 72.4 W/m2, the lighting load was distributed evenly in the ceiling, and was calculated to be 14 W/m2. The simulated temperature was compared with the measured temperature during the mealtime (11:00–13:00), as shown in Figure 12, with a 4.02% margin of error. The model was considered reasonable with simplification and uncertain factors, including customer flow, in the actual situation.
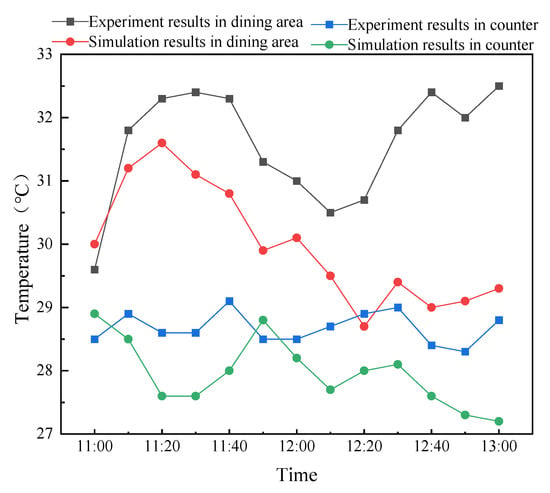
Figure 12.
Simulation vs. measured results for measuring points.
4. Discussion
4.1. Thermal Comfort Analysis of Underground Shopping Mall
Thermal comfort analyses in existing studies mostly focus on aboveground buildings, such as office buildings, shopping malls, and residential buildings, while underground shopping malls are underground projects, and the thermal comfort of the personnel may be different from those aboveground. When evaluating the thermal environment comfort of underground shopping malls, four indicators are considered, namely, temperature, relative humidity, airflow speed, and average radiation temperature of the environment. Different combinations of these indicators can result in different thermal environments in underground shopping malls.
4.1.1. Model Validation
The measured air-state points were plotted on a psychrometric chart, and the comfort zone required by ASHRAE Standard 55-2017 was taken as the evaluation basis. As seen from Figure 13, most of the air-state points of the underground shopping mall were not within the comfort zone requirements, due to the high humidity in summer and low temperature in winter. Owing to poor ventilation in the underground shopping mall, the indoor airflow speed was about 0–0.2 m/s during measurement, but 0 m/s at other times. Therefore, when analyzing the thermal comfort of underground shopping malls, the influences of indoor temperature, relative humidity, and average radiant temperature on thermal comfort were mainly considered.
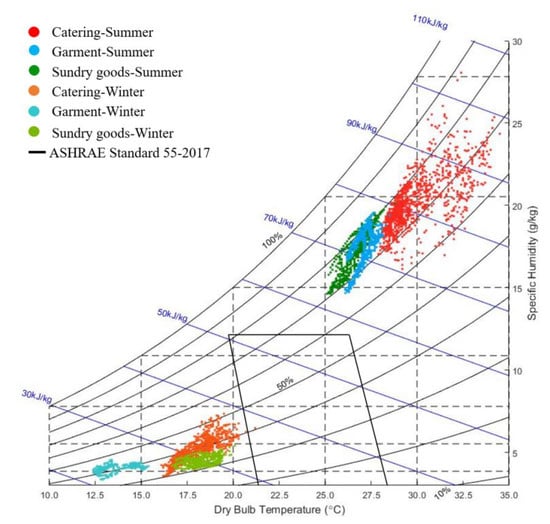
Figure 13.
Distribution of air-state points in a psychrometric chart.
To maintain basic physiological processes, the human body often performs energy balance processes including heat production, heat exchange, and heat storage. The indoor mean radiation temperature of an underground space will be affected by the earth temperature of the project, as shown in Figure 14. For people living in underground buildings, human body heat dissipation is mainly through convection and radiation. According to the analysis of indoor heat balance of the human body, air temperature affects convection heat dissipation, and the mean radiation temperature has a strong influence on the radiation heat dissipation. In addition, the different proportions of convection and radiation in sensible heat dissipation result in changes in the thermal physiological state of the human body. Consequently, the variation of indoor air and wall temperatures in different functional areas affect the heat dissipation of the human body.
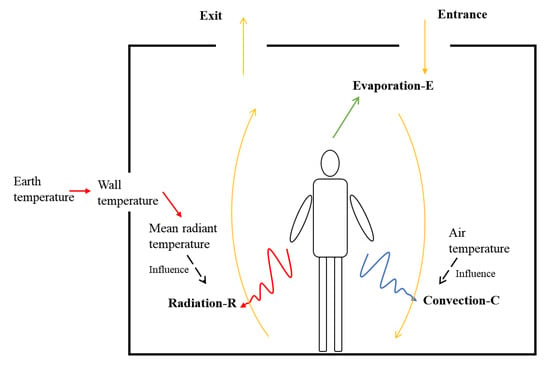
Figure 14.
Influence of the underground space thermal environment on human body heat dissipation.
The difference between indoor air and wall temperatures is called indoor temperature difference (Δt = (indoor air temperature) − (wall temperature)). To better reflect the influence of the indoor temperature difference (Δt) on thermal comfort, the human body convection–radiation heat dissipation ratio (C/R) was introduced. The relation between indoor temperature difference and convection–radiation heat dissipation ratio (C/R) is shown in Figure 15.
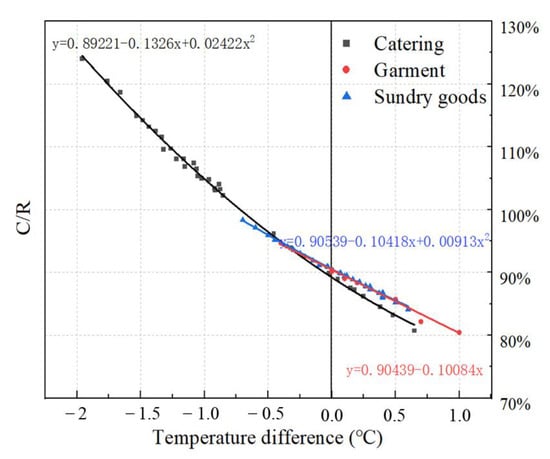
Figure 15.
Convection–radiation heat dissipation ratio in different functional areas.
The ASHRAE Manual [] describes the energy balance process in the human body as follows:
where M is the energy metabolism rate of human body, depending on the amount of activity, W/m2; W is the mechanical work performed by the human body, W/m2; C is the convective heat radiating from the outer surface of the human body to the surrounding environment, W/m2; R is the heat radiating from the outer surface of the human body to the surrounding environment, W/m2; E is the heat emitted from the outer surface of the human body in the form of sweat evaporation or exhalation to the surrounding environment, W/m2; and TL is the difference between the amount of heat produced and dissipated by the human body, similarly, it is the heat load of the human body, W/m2.
M − W − C – R − E = TL
The calculations [] for C and R are as follows:
where is the convective heat transfer coefficient, W/(m2∙K); is the garment surface area factor, ND; is the average temperature of the outer surface of the garment, °C; is the air temperature around the human body, °C; is the radiant heat transfer coefficient, W/(m2∙K); and is the mean radiation temperature of the environment, °C.
It was observed that the indoor temperature difference in the catering area was large due to the high wall temperature during the food preparation process, and the proportion of convection heat dissipation was higher. However, the indoor temperature differences in the garment and sundry goods areas were small, and the proportions of convection and radiation heat dissipations were similar.
4.1.2. Convection–Radiation Heat Dissipation Ratio and Human Thermal Comfort
In different functional areas, the indoor temperature differences in an underground shopping mall vary, causing significant differences in the convection–radiation heat dissipation ratio, thereby affecting the thermal comfort of the human body. Consequently, C/R and humidity were used as variables to represent the thermal comfort of each region, as shown in Figure 16. The heat transfer ratio of indoor convective radiation was deemed as the X axis, the relative humidity was deemed as the Y axis, the PMV value was deemed as the Z axis, and the heat transfer ratio of convective radiation and its relationship with human thermal comfort under the same relative humidity were compared.
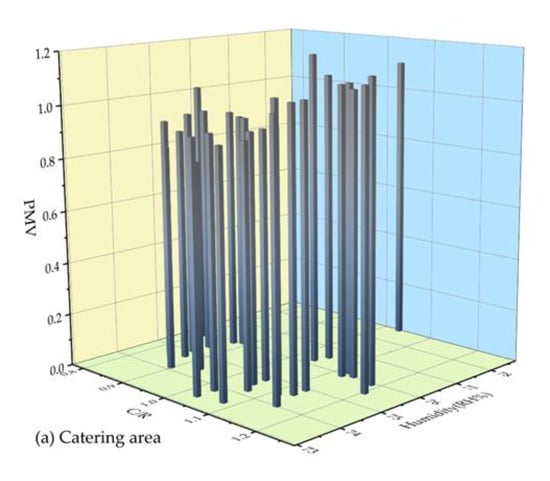
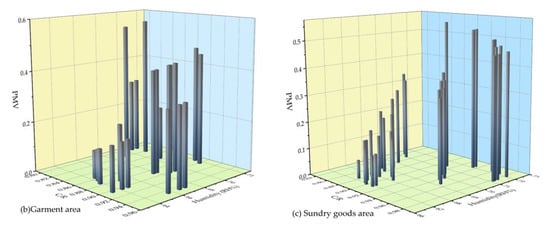
Figure 16.
C/R and thermal comfort in catering area (a), garment area (b) and sundry goods area (c).
The catering area in the underground shopping mall had a higher proportion of convection heat dissipation. In contrast, the proportion of radiation heat dissipation in the clothing and sundry goods areas was higher. During measurements, the relative humidity of the underground commercial building was generally greater than 60%. Figure 16 illustrates that under the condition of a constant C/R ratio, the thermal comfort of the human body decreases with an increase in relative humidity. Owing to the high temperature in the catering area, the PMV value was higher than the standard value, as well as increasing with the increase in C/R for the same relative humidity. However, in the garment and sundry goods areas, the PMV values decreased with the increase in C/R under identical humidity conditions. To further analyze the relationships between convection–radiation ratio and PMV, the catering area state points were divided into C/R > 1 and C/R < 1.
Figure 17 shows that in the catering area, when C/R < 1 and air temperature was greater than the mean radiant temperature, the PMV value decreased with the increase in C/R value, showing a negative correlation. When C/R > 1, that is, the air temperature was less than the mean radiant temperature, the PMV value increased with the increase in the C/R value, showing a positive correlation. Low air velocity in an underground building causes a reduction of convection heat dissipation from the human body. To maintain the basic heat dissipation requirements of the human body, the proportion of radiation heat dissipation must be elevated and the C/R ratio must be smaller. In the garment and sundry goods areas, the radiation heat dissipation was of greater account, since there were fewer heat sources. However, the wall temperature in the catering area was considerably higher than the air temperature, owing to the existence of heat sources such as stoves, and the human convection heat dissipation was higher. This illustrates that in underground commercial buildings, there are differences in the wall and air temperatures in different functional areas, hence, indoor temperatures in underground buildings should be adjusted reasonably to reduce differences between the air and average radiation temperatures, to improve indoor thermal comfort.
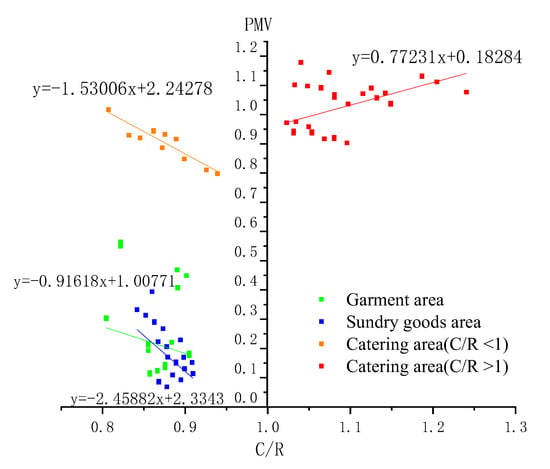
Figure 17.
The relationship between C/R and PMV.
4.2. Comparison of the Three Air Supply Schemes
Underground space has attracted much attention due to its energy saving and heat storage advantages, but its internal thermal performance and air quality cannot meet the comfort requirements of personnel due to its particular location. According to the results during the measurements, due to the large flow of people and various functions, underground commercial buildings are in a high state of temperature and humidity in summer, which makes it hard to meet the requirements of thermal comfort of the human body. The concentration of CO2 and PM2.5 in the catering area exceeded the standard and the air quality was worrying, due to the different functional divisions of each region and the different pollutant emission characteristics. This was consistent with the research conclusion of Shang et al. [] on air quality in four different aboveground shopping malls. Therefore, based on the measured results of thermal characteristics and air quality of multi-functional underground buildings, this study simulated and optimized air distribution in the catering area.
To improve the comfort level of the catering area, the factors that strongly influence air distribution and thermal comfort were compared. Four evaluation parameters, including mean temperature (Tave), mean velocity (Vave), and the non-uniform coefficients of temperature distribution (KT) and velocity distribution (Kv), were considered under the three different air supply schemes in this study. The results were based on a height of 1.5 m above the ground and are presented in Table 3.

Table 3.
Results comparison among the three air supply schemes.
The non-uniform coefficients of temperature distribution (KT) and velocity distribution (KV) were used to evaluate the temperature and wind velocity fields in the working area. Their calculation processes and formulas are as follows.
N sampling points were selected at a height of 1.5 m above the ground. Temperature and wind speed were measured at each point and their arithmetic means were calculated.
The standard error between air temperature and velocity at 1.5 m was root-mean-square error.
The non-uniform coefficients of temperature distribution (KT) and velocity distribution (Kv) were obtained:
where t is the air temperature, °C; and v is the wind velocity, m/s. The smaller the KT and KV values are, the better the uniformity of temperature and wind velocity distribution is, and the better the air distribution is.
Table 3 shows that under extreme climate conditions, the air-conditioning scheme of side supply in the catering area was obviously better than the upper supply upper return, which not only effectively reduced the indoor temperature but also caused the indoor air distribution to be more uniform. The side supply scheme reduced the temperature by about 0.4 °C in summer and increased it by 0.5 °C in winter. Although the average velocity was higher than those of other schemes, it was still less than 0.2 m/s, which cannot produce draught sensations. The temperature in the room was evenly distributed, and the front side of the room did not experience overcooling. Compared with the actual condition, the temperature uniformities in summer and winter were improved by 5.4% and 3.7%, while the velocity uniformities were improved by 6.5% and 8.8%, respectively. As a large space with large heat dissipation, the temperature of the dining area could effectively be improved by the side supply scheme. The upper supply and upper return scheme, such as in the actual condition and horizontal exhaust, would cause excess wind speed, while the side supply scheme can avoid this situation.
4.3. Limitations
This research was carried out only in one typical underground shopping mall in Zhengzhou, China. More studies conducted in different climate areas may give a better understanding of the thermal environment in underground commercial buildings.
The indoor thermal environment of the underground commercial building was actively regulated by the air conditioning system, and the passive regulation method, such as the atrium, was not analyzed. These passive regulation methods can be combined with the air-conditioning system to achieve energy-savings.
5. Conclusions
This research presented an experiment study of an underground multifunctional commercial building, including its thermal environment, indoor air quality, and simulated air distribution. The key conclusions are summarized as follows.
The thermal environments and air qualities of different functional areas of an underground shopping mall in Zhengzhou were measured and evaluated. It was observed that the air temperature and humidity of the underground shopping mall was more stable than observed outdoors. The air temperature distribution in the underground shopping mall was uneven, with a significant effect on the function and location. The summer temperature in the catering area was too high, with an average temperature of 29.1 °C. The temperature in the sundry goods area during winter was generally below 16 °C. The relative humidity in the underground shopping mall was above 60% in each zone in summer, and more comfortable in winter.
The air quality survey inside the underground shopping mall showed that CO2 concentrations in the clothing and catering areas rose sharply during the peak business season in summer, resulting in CO2 concentrations exceeding the standard. The phenomenon of excess pollutant concentration in winter was mainly caused by the high concentration of PM2.5 in the dining area. These results showed that the ventilation in the underground shopping mall needs to be improved.
The convection–radiation heat dissipation ratio (C/R) was introduced to analyze the influence of air temperature and mean radiation temperature on human body heat dissipation and thermal comfort. The results showed that the proportions of convection and radiation heat dissipations in the underground commercial buildings were similar, but the C/R in the catering area was higher due to heat sources such as stoves. There is a certain correlation between the C/R and PMV value, so the indoor temperatures of underground buildings should be adjusted reasonably to reduce differences between air and mean radiation temperatures, to improve indoor thermal comfort.
To solve the problem of high temperature, the air distribution in the catering area was optimized. The simulation results showed that the side supply scheme was more suitable for the catering area. Under this air distribution, the air temperature of catering area can effectively be reduced about 0.4 °C in summer, and be increased 0.5 °C in winter. A higher air velocity also contributes to indoor ventilation. Compared with other air conditioning schemes, the indoor air temperature uniformities of the side supply scheme in summer and winter increased by 5.4% and 3.7%, while the velocity uniformities increased by 6.5% and 8.8%, respectively.
Author Contributions
Conceptualization, methodology, data curation, X.Z.; formal analysis, writing—original draft preparation, C.L.; visualization, investigation, J.Z.; supervision, J.L.; writing—review and editing, Y.C. All authors have read and agreed to the published version of the manuscript.
Funding
This research was supported by grants from the Science and Technology Department of Henan Province (grant number 212102310573, 222102320113), Key R&D and Promotion Project of the Department of Science and Technology of Henan Province, China (grant number 222102320113), and China Construction Seventh Bureau Technology Research Project (grant number CSCEC7b-2015-Z-24).
Data Availability Statement
Not applicable.
Conflicts of Interest
The funders had no role in the design of the study; in the collection, analyses, or interpretation of data; in the writing of the manuscript, or in the decision to publish the results.
References
- Wang, H.; Chen, D.; Duan, H.; Yin, F.; Niu, Y. Characterizing urban building metabolism with a 4D-GIS model: A case study in China. J. Clean. Prod. 2019, 228, 1446–1454. [Google Scholar] [CrossRef]
- P.R.C. Ministry of Housing and Urban-Rural Development. China Urban Construction Statistical Yearbook; China Planning Press: Beijing, China, 2021.
- Deng, X.; Huang, J.; Rozelle, S.; Uchida, E. Growth, population and industrialization, and urban land expansion of China. J. Urban Econ. 2008, 63, 96–115. [Google Scholar] [CrossRef]
- Franco, M.A.J.Q.; Pawar, P.; Wu, X. Green building policies in cities: A comparative assessment and analysis. Energy Build. 2020, 231, 110561. [Google Scholar] [CrossRef]
- Wang, J.; Zhai, T.; Lin, Y.; Kong, X.; He, T. Spatial imbalance and changes in supply and demand of ecosystem services in China. Sci. Total Environ. 2018, 657, 781–791. [Google Scholar] [CrossRef] [PubMed]
- Mat, S.; Shamila, H.; Francesco, F.; Paul, O.; Ding, L.; Deo, P.; Zhai, X.; Wang, R. Urban heat island and overheating characteristics in sydney, australia. an analysis of multiyear measurements. Sustainability 2017, 9, 712. [Google Scholar]
- He, B.J.; Zhao, D.X.; Xiong, K.; Qi, J.; Prasad, D.K. A framework for addressing urban heat challenges and asso-ciated adaptive behavior by the public and the issue of willingness to pay for heat resilient infrastructure in Chongqing, China. Sustain. Cities Soc. 2021, 75, 103361. [Google Scholar] [CrossRef]
- Yla, B.; Fei, L.A.; Cx, A.; Zo, A. Urban development and resource endowments shape natural resource utilization efficiency in Chinese cities. J. Environ. Sci. 2022, 126, 806–816. [Google Scholar]
- Li, C.; Wang, Z.; Li, B.; Peng, Z.-R.; Fu, Q. Investigating the relationship between air pollution variation and urban form. Build. Environ. 2019, 147, 559–568. [Google Scholar] [CrossRef]
- Crippa, M.; Guizzardi, D.; Pisoni, E.; Solazzo, E.; Guion, A.; Muntean, M.; Florczyk, A.; Schiavina, M.; Melchiorri, M.; Hutfilter, A.F. Global anthropogenic emissions in urban areas: Patterns, trends, and challenges. Environ. Res. Lett. 2021, 16, 074033. [Google Scholar] [CrossRef]
- Petroleum, B. BP Statistical Review of World Energy; British Petroleum: London, UK, 2021. [Google Scholar]
- Mele, C. Human settlements and sustainability: A crucial and open issue. E3S Web Conf. 2019, 119, 00012. [Google Scholar] [CrossRef]
- Wang, J.; Sun, K.; Ni, J.; Xie, D. Evaluation and Factor Analysis of the Intensive Use of Urban Land Based on Technical Efficiency Measurement—A Case Study of 38 Districts and Counties in Chongqing, China. Sustainability 2020, 12, 8623. [Google Scholar] [CrossRef]
- Yao, Y. Key Technologies for Environmental Quality Assurance of Urban Underground Space; China Architecture & Building Press: Beijing, China, 2010; p. 392. [Google Scholar]
- Zhao, J.-W.; Peng, F.-L.; Wang, T.-Q.; Zhang, X.-Y.; Jiang, B.-N. Advances in master planning of urban underground space (UUS) in China. Tunn. Undergr. Space Technol. 2016, 55, 290–307. [Google Scholar] [CrossRef]
- Bobylev, N. Mainstreaming sustainable development into a city’s Master plan: A case of Urban Underground Space use. Land Use Policy 2009, 26, 1128–1137. [Google Scholar] [CrossRef]
- Broere, W. Urban underground space: Solving the problems of today’s cities. Tunn. Undergr. Space Technol. 2016, 55, 245–248. [Google Scholar] [CrossRef]
- Peng, F.-L.; Qiao, Y.-K.; Sabri, S.; Atazadeh, B.; Rajabifard, A. A collaborative approach for urban underground space development toward sustainable development goals: Critical dimensions and future directions. Front. Struct. Civ. Eng. 2021, 15, 20–45. [Google Scholar] [CrossRef]
- Strategic Consulting Center of Chinese Academy of Engineering. Blue Book of Urban Underground Space Development in China; Strategic Consulting Center of Chinese Academy of Engineering: Beijing, China, 2021. [Google Scholar]
- Li, X.; Xu, H.; Li, C.; Sun, L.; Wang, R. Study on the demand and driving factors of urban underground space use. Tunn. Undergr. Space Technol. 2016, 55, 52–58. [Google Scholar] [CrossRef]
- Chen, Y.; Chen, Z.; Guo, D.; Zhao, Z.; Lin, T.; Zhang, C. Underground space use of urban built-up areas in the central city of Nanjing: Insight based on a dynamic population distribution. Undergr. Space 2022, 7, 748–766. [Google Scholar] [CrossRef]
- Jian, P.; Flp, A.; Ny, B.; Tf, B. Factors in the development of urban underground space surrounding metro stations: A case study of Osaka, Japan. Tunn. Undergr. 2019, 91, 103009. [Google Scholar]
- Tan, Z.; Roberts, A.C.; Christopoulos, G.I.; Kwok, K.-W.; Car, J.; Li, X.; Soh, C.-K. Working in underground spaces: Architectural parameters, perceptions and thermal comfort measurements. Tunn. Undergr. Space Technol. 2018, 71, 428–439. [Google Scholar] [CrossRef]
- Li, W.J.; Liao, X.X.; Miao, G.Y.; Zhou, X.Z. Analysis on Built Environment in Underground Shopping Malls in Chongqing in P.R. China. Adv. Mater. Res. 2012, 599, 233–236. [Google Scholar] [CrossRef]
- Xie, Y.; Liao, J.; Guo, C.; Zhang, K.; Zhang, J.; Yang, K. Lighting environment analysis of Chengdu underground commercial spaces. IOP Conf. Series Mater. Sci. Eng. 2020, 741. [Google Scholar] [CrossRef]
- Chun, C.; Tamura, A. Thermal environment and human responses in underground shopping malls vs department stores in Japan. Build. Environ. 1998, 33, 151–158. [Google Scholar] [CrossRef]
- Ganesh, G.A.; Sinha, S.L.; Verma, T.N.; Dewangan, S.K. Numerical simulation for energy consumption and thermal comfort in a naturally ventilated indoor environment under different orientations of inlet diffuser. Build. Environ. 2022, 217, 109071. [Google Scholar] [CrossRef]
- Li, Y.; Geng, S.; Chen, F.; Li, C.; Zhang, X.; Dong, X. Evaluation of thermal sensation among customers: Results from field investigations in underground malls during summer in Nanjing, China. Build. Environ. 2018, 136, 28–37. [Google Scholar] [CrossRef]
- Abbaspour, M.; Jafari, M.J.; Mansouri, N.; Moattar, F.; Nouri, N.; Allahyari, M. Thermal comfort evaluation in Tehran metro using Relative Warmth Index. Int. J. Environ. Sci. Technol. 2008, 5, 297–304. [Google Scholar] [CrossRef]
- Kim, J.; Hong, T.; Lee, M.; Jeong, K. Analyzing the real-time indoor environmental quality factors considering the influence of the building occupants’ behaviors and the ventilation. Build. Environ. 2019, 156, 99–109. [Google Scholar] [CrossRef]
- Wen, Y.; Leng, J.; Shen, X.; Han, G.; Sun, L.; Yu, F. Environmental and Health Effects of Ventilation in Subway Stations: A Literature Review. Int. J. Environ. Res. Public Heal. 2020, 17, 1084. [Google Scholar] [CrossRef] [PubMed]
- Tagiyeva, N.; Sheikh, A. Domestic exposure to volatile organic compounds in relation to asthma and allergy in children and adults. Expert Rev. Clin. Immunol. 2014, 10, 1611–1639. [Google Scholar] [CrossRef]
- Luo, F.; Guo, H.; Yu, H.; Li, Y.; Feng, Y.; Wang, Y. PM2.5 organic extract mediates inflammation through the ERβ pathway to contribute to lung carcinogenesis in vitro and vivo. Chemosphere 2020, 263, 127867. [Google Scholar] [CrossRef] [PubMed]
- Darby, S.; Hill, D.; Deo, H.; Auvinen, A.; Barros-Dios, J.M.; Baysson, H.; Bochicchio, F.; Falk, R.; Farchi, S.; Figueiras, A.; et al. Resi-dential radon and lung cancer—Detailed results of a collaborative analysis of individual data on 7148 persons with lung cancer and 14 208 persons without lung cancer from 13 epidemiologic studies in Europe. Scand. J. Work. Environ. Health 2006, 32, 1–84. [Google Scholar] [PubMed]
- Gao, J.M.; Chen, L.; Zhang, Y.; Jin, F.; Li, B.Z. Occurrence and pollution source of TVOC in underground stores in Chongqing. J. Cent. South Univ. (Sci. Technol.) 2012, 43, 4554–4558. [Google Scholar]
- Yang, J.; Wu, X.; Chan, K.T.; Yang, X. Investigation of Indoor Air Quality in the Underground Shopping Mall. In Proceedings of the 2010 4th International Conference on Bioinformatics and Biomedical Engineering, Chengdu, China, 18–20 June 2010; pp. 1–4. [Google Scholar] [CrossRef]
- Tao, H.; Fan, Y.; Li, X.; Zhang, Z.; Hou, W. Investigation of formaldehyde and TVOC in underground malls in Xi’an, China: Concentrations, sources, and affecting factors. Build. Environ. 2015, 85, 85–93. [Google Scholar] [CrossRef]
- Wen, Y.; Leng, J.; Yu, F.; Yu, C.W. Integrated design for underground space environment control of subway stations with atriums using piston ventilation. Indoor Built Environ. 2020, 29, 1300–1315. [Google Scholar] [CrossRef]
- Dong, L.; He, Y.; Qi, Q.; Wang, W. Optimization of daylight in atrium in underground commercial spaces: A case study in Chongqing, China. Energy Build. 2021, 256, 111739. [Google Scholar] [CrossRef]
- Aflaki, A.; Esfandiari, M.; Mohammadi, S. A Review of Numerical Simulation as a Precedence Method for Prediction and Evaluation of Building Ventilation Performance. Sustainability 2021, 13, 12721. [Google Scholar] [CrossRef]
- da Graça, G.C.; Martins, N.R.; Horta, C.S. Thermal and airflow simulation of a naturally ventilated shopping mall. Energy Build. 2012, 50, 177–188. [Google Scholar] [CrossRef]
- Kim, G.; Schaefer, L.; Lim, T.S.; Kim, J.T. Thermal comfort prediction of an underfloor air distribution system in a large indoor environment. Energy Build. 2013, 64, 323–331. [Google Scholar] [CrossRef]
- Liu, C.; Li, A.; Yang, C.; Zhang, W. Simulating air distribution and occupants’ thermal comfort of three ventilation schemes for subway platform. Build. Environ. 2017, 125, 15–25. [Google Scholar] [CrossRef]
- Shen, H.; Zhang, M.; Wang, J. Air purification of urban underground space. Build. Energy Effic. 2015, 43, 27–29. [Google Scholar]
- Guo, H.X.; Deng, M.R.; Li, Y. Effect of sunken plaza on ventilation performance of underground commercial buildings. J. South China Univ. Technol. Nat. Sci. 2014, 42, 114–120. [Google Scholar]
- Chen, Z.; Xin, J.; Liu, P. Air quality and thermal comfort analysis of kitchen environment with CFD simulation and experimental calibration. Build. Environ. 2020, 172, 106691. [Google Scholar] [CrossRef]
- Li, Q.; Yoshino, H.; Mochida, A.; Lei, B.; Meng, Q.; Zhao, L.; Lun, Y. CFD study of the thermal environment in an air-conditioned train station building. Build. Environ. 2009, 44, 1452–1465. [Google Scholar] [CrossRef]
- CN-CECS402-2015; Operation and Management Standard of Urban Underground Space. China Planning Press: Beijing, China, 2015.
- Cheng, L.; Li, B.; Cheng, Q.; Baldwin, A.N.; Shang, Y. Investigations of indoor air quality of large department store buildings in China based on field measurements. Build. Environ. 2017, 118, 128–143. [Google Scholar] [CrossRef]
- GB/T18883-2002; Indoor Air Quality Standard, (In Chinese). Health Department: Beijing, China, 2002.
- Zhang, K.; Zhang, X.; Li, S.; Wang, G. Numerical Study on the Thermal Environment of UFAD System with Solar Chimney for the Data Center. Energy Procedia 2014, 48, 1047–1054. [Google Scholar] [CrossRef]
- Amodio, M.; Dambruoso, P.R.; de Gennaro, G.; de Gennaro, L.; Loiotile, A.D.; Marzocca, A.; Stasi, F.; Trizio, L.; Tutino, M. Indoor air quality (IAQ) assessment in a multistorey shopping mall by high-spatial-resolution monitoring of volatile organic compounds (VOC). Environ. Sci. Pollut. Res. 2014, 21, 13186–13195. [Google Scholar] [CrossRef] [PubMed]
- Brohus, H.; Nielsen, P.V. Dispersal of exhaled air and personal exposure in displacement ventilated rooms. Indoor Air 2010, 12, 147–164. [Google Scholar]
- Cheng, Y.H.; Yan, J.W. Comparisons of particulate matter, co, and co 2 levels in underground and ground-level stations in the taipei mass rapid transit system. Atmos. Environ. 2011, 45, 4882–4891. [Google Scholar] [CrossRef]
- Shang, Y.; Li, B.; Baldwin, A.; Ding, Y.; Yu, W.; Cheng, L. Investigation of indoor air quality in shopping malls during summer in Western China using subjective survey and field measurement. Build. Environ. 2016, 108, 1–11. [Google Scholar] [CrossRef]
- American Society of Heating, Refrigerating and Air Conditioning Engineers, Inc. Ashrae Handbook of Fundamentals; American Society of Heating, Refrigerating and Air Conditioning Engineers, Inc.: Atlanta, GA, USA, 1972. [Google Scholar]
Publisher’s Note: MDPI stays neutral with regard to jurisdictional claims in published maps and institutional affiliations. |
© 2022 by the authors. Licensee MDPI, Basel, Switzerland. This article is an open access article distributed under the terms and conditions of the Creative Commons Attribution (CC BY) license (https://creativecommons.org/licenses/by/4.0/).


