1. Introduction
Requirements for critical infrastructures protection has changed in recent years, as their reliability is important for countries around the world [
1]. Regarding critical infrastructures, energy, information and communication technology belong to the most important sectors [
2]. Today’s electricity and communication infrastructure is transitioning from centralized systems to decentralized systems. Therefore, infrastructures are becoming increasingly sophisticated and infeasible to manage manually. Along with this fact, there is a widespread adoption of intelligent devices for network management, control, and monitoring [
3,
4]. Various technologies have been developed to support efficient and flexible physical infrastructure management, such as computer virtualization, software-defined networks, and network function virtualization [
5]. There are new opportunities to make the infrastructure more efficient, along with a need for much greater connectivity and complexity across the power and data infrastructure, resulting in increased costs [
6,
7]. This entails the consequent emergence of previously unforeseen problems and increased demands for operability [
8,
9]. As an illustrative example, power system dynamics can be affected by communication delays in the network. An outage on the power grid side can affect the operation of communications equipment, which then affects the operation of power grids. Other critical infrastructures challenges, including a list of their potential vulnerabilities, are comprehensively discussed in [
1].
At the same time, the emergence of new threats, whether social, systemic, information, and cybersecurity can be seen. There may also be a reduction in reliability and other negative impacts on infrastructure, mainly due to hidden system links or simply undetectable dependencies. To detect these dependencies and infrastructure weaknesses, a model of the power grid and data network has been developed and is used for simulations and optimization processes of both power and data networks. Other additional objectives of this simulator are also to offer a safe environment for testing various infrastructures, including crisis scenarios, operability testing, infrastructure stability and the possibility of integrating new technologies [
10].
There are many tools for simulating data networks and power grids separately. Considering open-source tools [
11,
12], there is no available solution enabling simulations of a data network including the link to the power grid. For this purpose, software enabling co-simulation within smart grids have already been introduced [
13]. However, these tools do not allow to extend simulations to more infrastructures and have other shortcomings pointed out in this paper. As a solution, this paper describes an innovative simulator that can be extended by several separate layers. In addition to energy and communication infrastructure, the analysis can also be extended to data, transport and other infrastructure. Unlike other solutions offered, the simulator has a virtualization part and an interactive user environment that allows user intervention directly during the simulation and clearly displays the obtained results, giving potential users a possibility of deeper analysis of urban networks. The paper further describes two different approaches that the simulator takes to simulate different opposition scenarios. The use of two different principles is also a great advantage, since existing tools usually use the principles of only one of the mentioned approaches.
The main contributions of this paper are outlined as follows.
In
Section 2, available open-source data network simulators are compared, according to aspects such as active development and the possibility of power grid simulation. Seven available tools in total are compared. Then, power and smart grid simulators are compared. The emphasis is on the possibility of interconnected simulation with data infrastructure and open-source solutions.
In
Section 3, an innovative solution of an interconnection of two infrastructures and the architecture of the developed simulator is described.
Section 4 is dedicated to the virtualization part of the simulator. The development of a user interactive environment is described.
Section 5 contains the discussion of the drawbacks, together with the introduction of some of the simulator’s current shortcomings, and a proposal of future solutions.
2. State-of-the-Art
This chapter is focused on describing the current state-of-the-art of individual data network and power grid simulators. Simulators are compared with respect to simulation capabilities, virtualization and graphical interfaces, and last but not least with an emphasis on cybersecurity. Virtualization generally provides virtualized resources that may not match the real hardware on which the virtualization runs [
14]. Currently, it is possible to virtualize entire computers (virtual machine), or only a part of the hardware, such as the processor, memory, or network. The advantage of virtualization is the high reliability and availability of virtualized services. Virtualized services can be run in duplicate, so that in the event of one service failure, users can be seamlessly redirected to an identical service without any indication of failure [
15]. Virtualization further facilitates the creation of backups and the scalability of the entire system so that it is possible to create disk images at a specific time without interrupting the availability of the virtualized service [
16].
The concept of virtualization creates an additional layer of cyber protection. Virtualization generally separates software and isolates it from the rest of the system [
17,
18]. From a software perspective, the allocated hardware resources are allocated only to the software itself. In the case of an intrusion of an attacker into a virtual environment, ideally, the attacker only gets access to the software through which the entire system was attacked. However, in real cases, the software is not completely isolated, but the virtual units are connected by a virtual network [
17,
18]. In case of bad virtual network settings, the attacker is allowed to access the rest of the system through the virtual network. Active and passive defense strategies of cyber-physical power system against cyber attacks is further described in [
19].
In the following subsections, existing tools are compared according to these criteria. For data network simulators, the task was to verify the possibility of connecting to the power grid, the possibility of implementing the virtualization part, the maximum range of the simulated network and support for external devices. For power grid simulators, the possibility of interconnected simulation with the data network had to be verified. Furthermore, the possibility of creating an anonymized test network, the possibility of network optimization based on economic aspects and the maximum scale of the network were analyzed for the simulators. In both areas, the need for licensing and support for future development was also considered.
2.1. Available Data Networks Simulators Comparison
The first software that could be used for our purpose is Antidote [
20]. The Antidote is a learning platform for network automation. The whole system is built on the Kubernetes tool. The system is designed for teaching computer networks and simulation projects are designed as individual teaching lessons. The use of the system for further development is prevented by the terminated support and the terminated development of the project [
20].
Simulations of data networks using virtual machines and emulated links are featured by Cloonix. The software is developed in the C language and uses standard open-source tools such as: qemu-kvm, openvswitch, dpdk, spice, wireshark and openssh. The main advantage of Cloonix is that it is still under development. However, the software does not have a graphical environment that makes it easier for the user to work with projects. Cloonix only has the graphical output provided by the clonix_gui module. Cloonix software can only be used for simulating data networks without the possibility of power grid analysis linked to the data network [
21].
Containerlab software is used for simulation and virtualization of laboratory networks using containers with services, which are then interconnected. Therefore, it is not allowed to simulate more complex data networks with the possibility of the virtualization of wireless links and backup sources simulations. Although there is a possibility of the virtualization of commercial devices by Cisco, Juniper, Nokia, Dell and Mikrotik, this option requires a paid license. As in the previous project, there is no possibility of simulating a power grid and data network connection [
22].
Common Open Research Emulator (CORE) is a software that supports real-time virtualization of a data network. It enables to connect a virtualized network to a physical network. The advantage of the software is its high scalability. CORE software also includes a graphical user interface for its operation. Although the virtualization part is its biggest advantage over other solutions, the simulation options are very limited [
23].
EVE-NG is a software focused on network security and DevOps. Similarly to other solutions, it uses a virtualization environment. Unfortunately, there are limited possibilities of simulations, especially the network scale (only 63 nodes can be created in the project), in a free version [
24].
Kathará is an open-source software for simulating data networks using virtual computers. The basic idea of the software is to simulate complex data networks. The software is designed for creating a sandbox environment, developing new protocols, or teaching and testing data networks. However, even this software does not allow a simulation of a power grid with a connection to a data network [
25].
Network Simulator 3 (NS-3) is a discrete event network simulator used primarily in research and for educational purposes [
26]. The NS-3 is a free, open-source software distributed under the GNU General Public License version 2 (GPLv2) and it is publicly available. The main programming language for simulation project files is the C++. The simulator also supports the Python programming language. The Python language should only be used for basic simulations, as most simulation libraries are only available for the C++ language. The NS-3 does not enable power and data network co-simulation [
27]. Properties of data network simulators are summarized in
Table 1.
2.2. Available Power Grids Simulators Comparison
The market offers several computing tools with different functions and priorities. Most of the available tools are derived from the Matlab or Delphi platforms, and although the packages themselves are publicly available and free, they depend on commercial solutions.
The widely used Matpower extension is an open source tool, i.e., a package of m-files working on the basis of Matlab. The main purpose of the package is a power flow analysis with the price dependency. It is also possible to add the Matpower Optimal Scheduling Tool (MOST), which can extend the scope to the issue of planning of power distribution systems. An alternative to commercial programs can be a software such as GNU Octave. The Matpower tool is publicly available and free of charge [
28].
Pypower is a similar tool to Matpower, differing in its availability and independence on other commercial environments. Pypower also deals with power flow analysis using the Python language. In addition, Pypower handles the three-phase power flow analysis. This tool is no longer active and under development, but it is still possible to see the codes and procedures available on the GitHub repository [
29].
An open-source tool Python for Power System Analysis (PyPSA) is used for power system optimization and storage utilization. PyPSA deals with power flow analysis, new project investment evaluations and interconnection between AC and DC systems. It is based on the Python environment and includes a wide range of electrical features including compatibility with many libraries [
30].
OpenDSS is a publicly available simulator of distribution systems created by the EPRI institute. The tool deals with the distribution networks analyses. It includes a power flow analysis, short circuits and time series calculation. OpenDSS is used as a static simulation environment for power flows analysis of large-scale distribution networks. Utilizing the language Delphi has the disadvantage of not supporting the Linux systems [
31].
Power Systems Analysis Toolbox (PSAT) is classified as one of the other packages using Matlab. It is used to simulate the power systems. The program is compatible with GNU Octave software and has features including power flow, stability and transient phenomena analysis. It also includes wind turbine models, a complete graphical interface and interfacing with GAMS and UWPFLOW. PSAT functions include voltage stability analysis. Other benefit is a rich library of network elements that can be user-modified [
32].
The PandaPower program is a tool for power systems analysis (static and quasi-stationary processes), optimization, power flow analysis (also for three-phase systems), estimation of fault states, topology and short circuit solutions according to IEC 60909. The basic computational interface is based, similarly to Matpower, on the Newton-Rhapson method. The newly used program PandaPower was created with the idea of closing the gap between commercial and open-source programs [
33].
2.3. Available Smart Grids Simulators Comparison
Table 1 and
Table 2 show that neither of the simulators compared enables a co-simulation of the power and data network. For this reason, this subsection is dedicated to simulators of smart grids. For smart grids simulators, it is essential to look at the power grid and the communication infrastructure in parallel. There are several tools available that deal with, for example, optimising power generation and consumption within smart grids [
34] or smart buildings [
35].
Table 3 compares several tools that are focused on the coupled simulation of communication and power infrastructures. Some of these tools were created by merging existing open-source software. Other co-simulators on the current market, that are not mentioned in this Table, are listed and compared in [
13].
2.4. Summary
Table 1 introduces available verified open-source software solutions for data network simulations. However, none of these tools is able to simulate various networks interconnection, as interconnections with power grids or other networks from critical infrastructure [
20,
21,
22,
23,
24,
25,
26]. Regarding the tools for power grid simulations, none of the above mentioned open-source software tools available allows a simulation of interconnected data and power infrastructure. Individual programs were also compared according to the possibilities of the virtualization interface. Although some of the data simulators offer the possibility of virtualization, they are either commercial solutions or do not have the essential simulation tools. The comparison of existing smart grid co-simulators shows the absence of the solution provided by the simulator described in this paper. Although the compared simulators offer a combined simulation of power grid and communication infrastructure, there is no possibility to extend the simulation with a potential third layer. Moreover, none of the compared tools offers an interactive graphical interface.
Table 3 shows that the simulations provided by existing tools are synchronized in either discrete event or continuous time. The new solution described in this paper offers the possibility of both options—a hybrid-synchronization simulator. This findings were the motivation for the design of the new simulator. In the next section, the proposal of an interconnected infrastructures simulator counteracting the shortcomings of existing solutions is presented.
3. Simulator Concept and Functionality
The developed simulator involves the real urban infrastructure in an interactive environment including a map display. The platform itself consists of two parts. The first one is the simulation part and the second one is the virtualization part. The simulator enables to simulate either failures on specific devices and lines, and failures caused by external intervention (gas explosion, line damage during construction work).
Due to the map base and interactive environment, it is possible to define coordinates and subsequent radius of the affected parts. The model then simulates an outage of the lines in the specified area. The simulator involves two separate systems—power grid and data network elements. The model of the power grid can contain unlimited number of separated layers based on their character or type of supply points (traffic lights, gas stations).
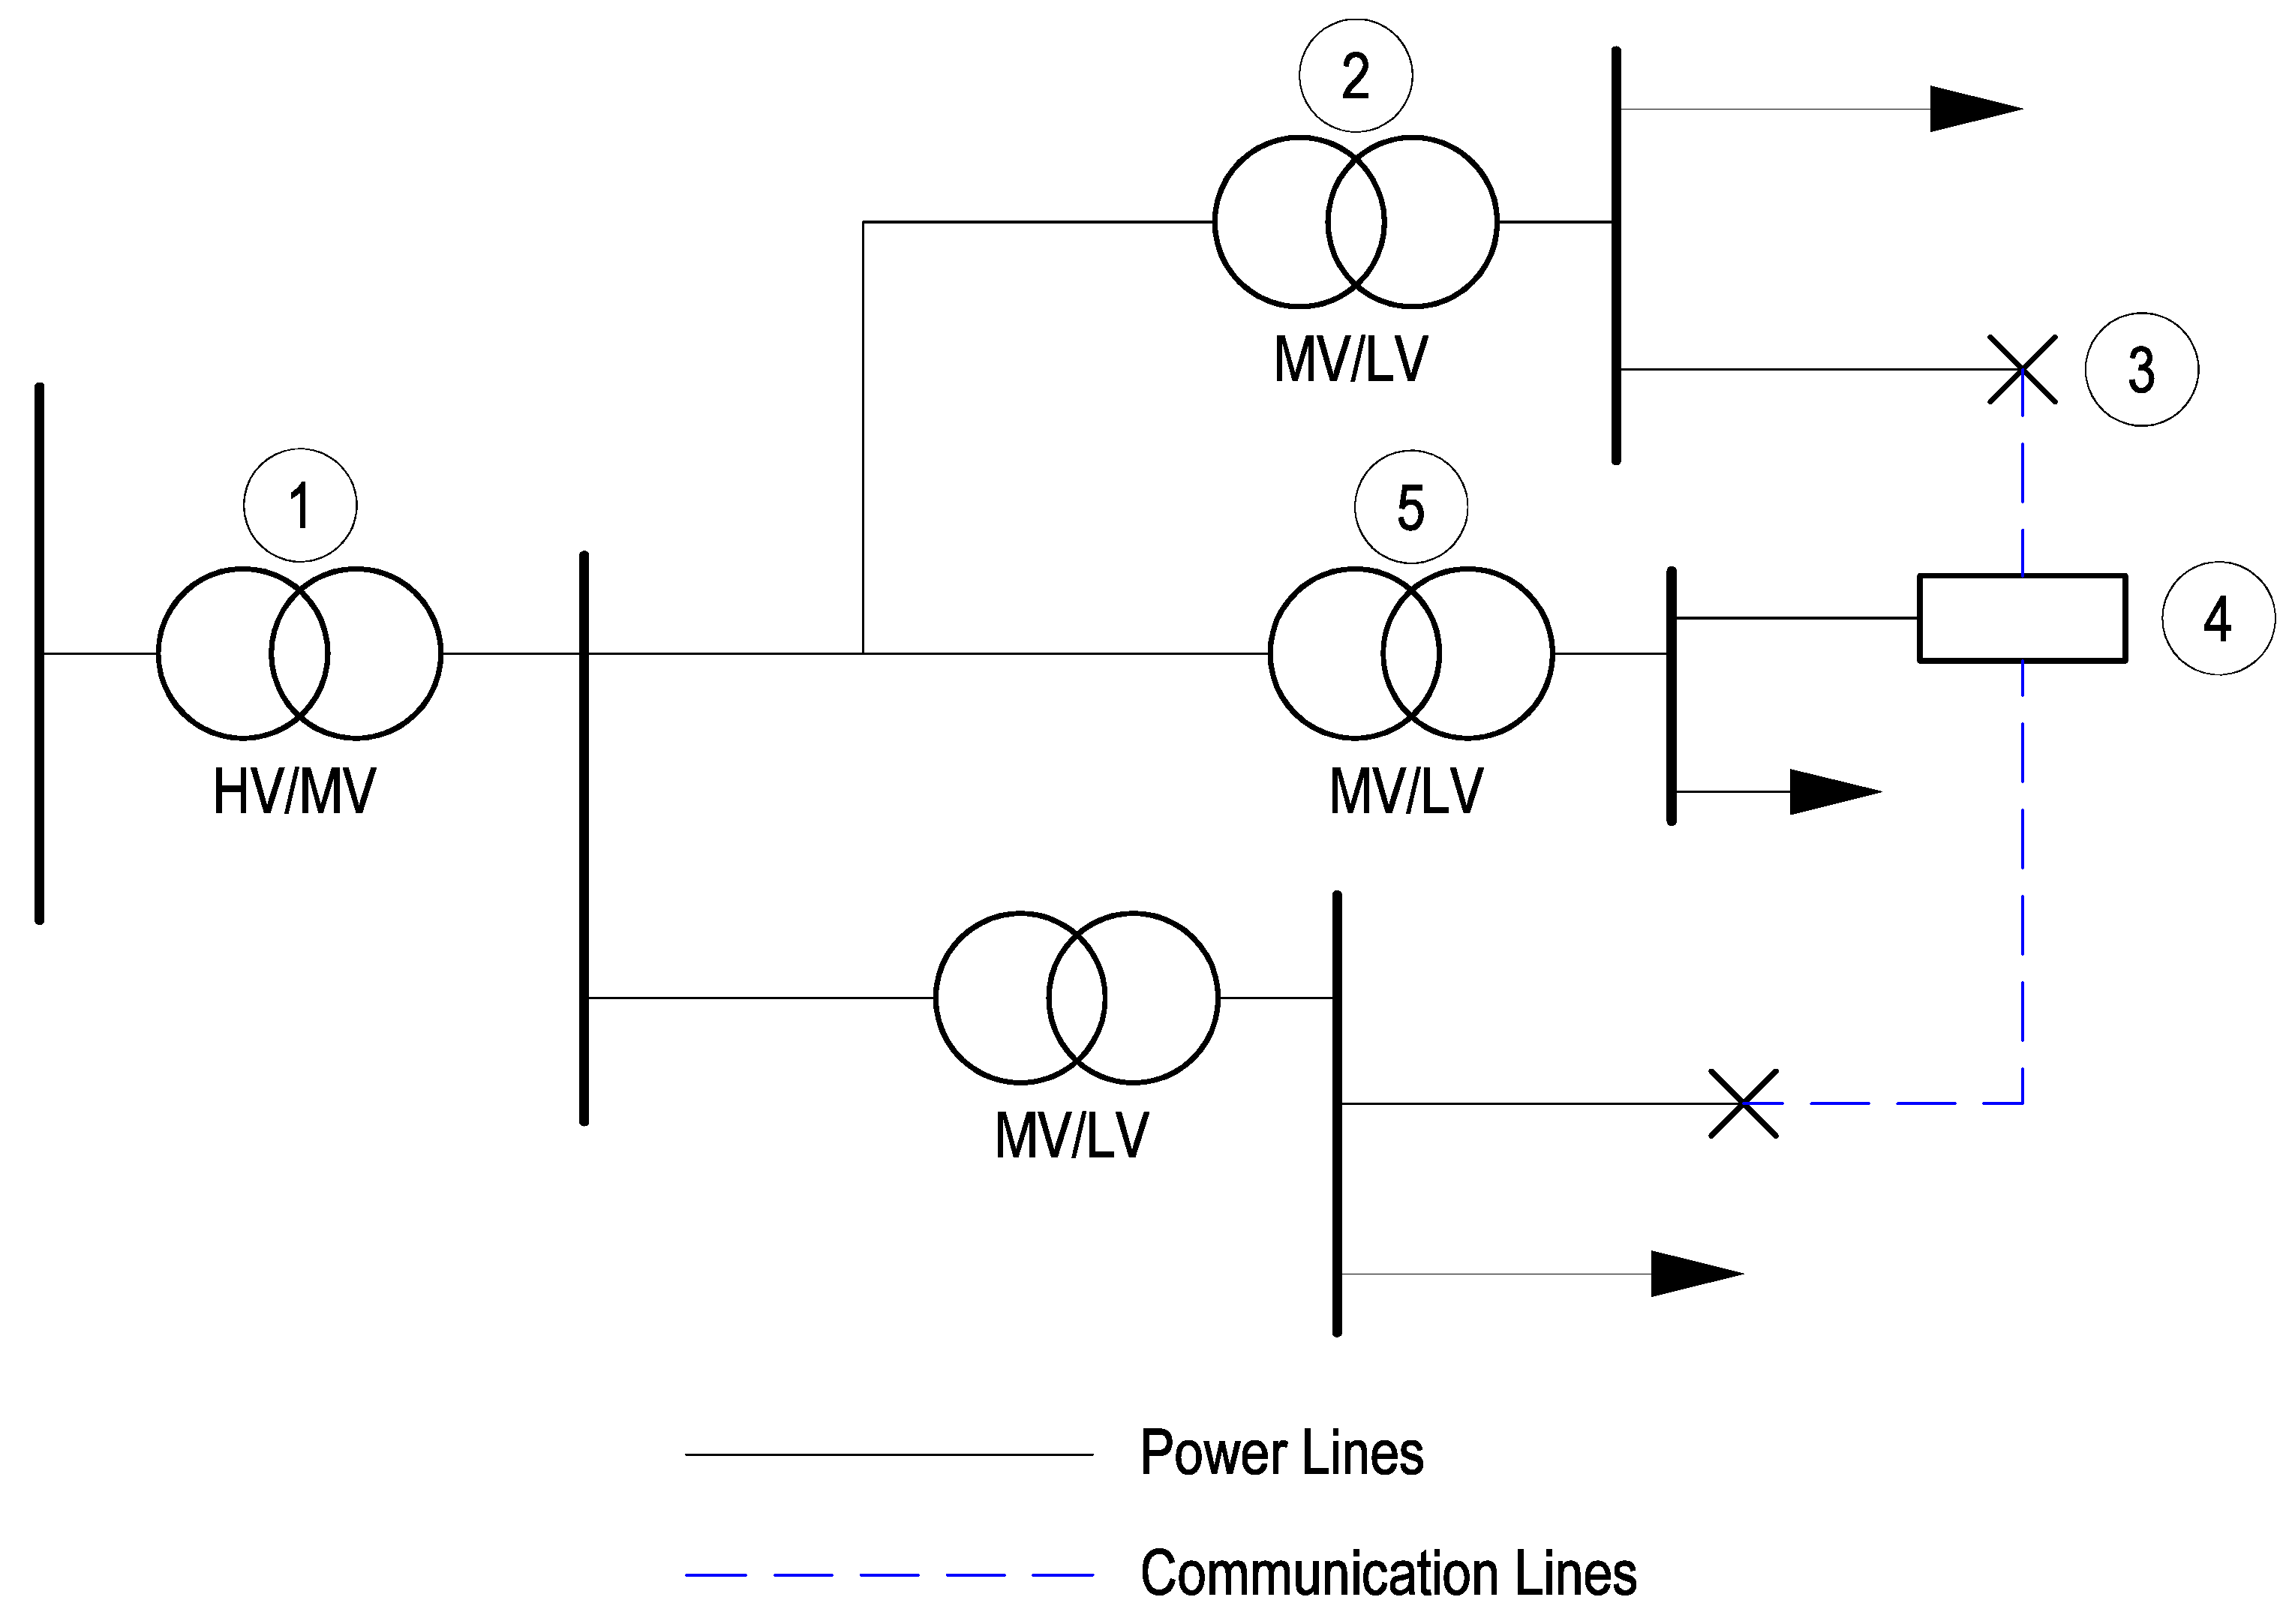
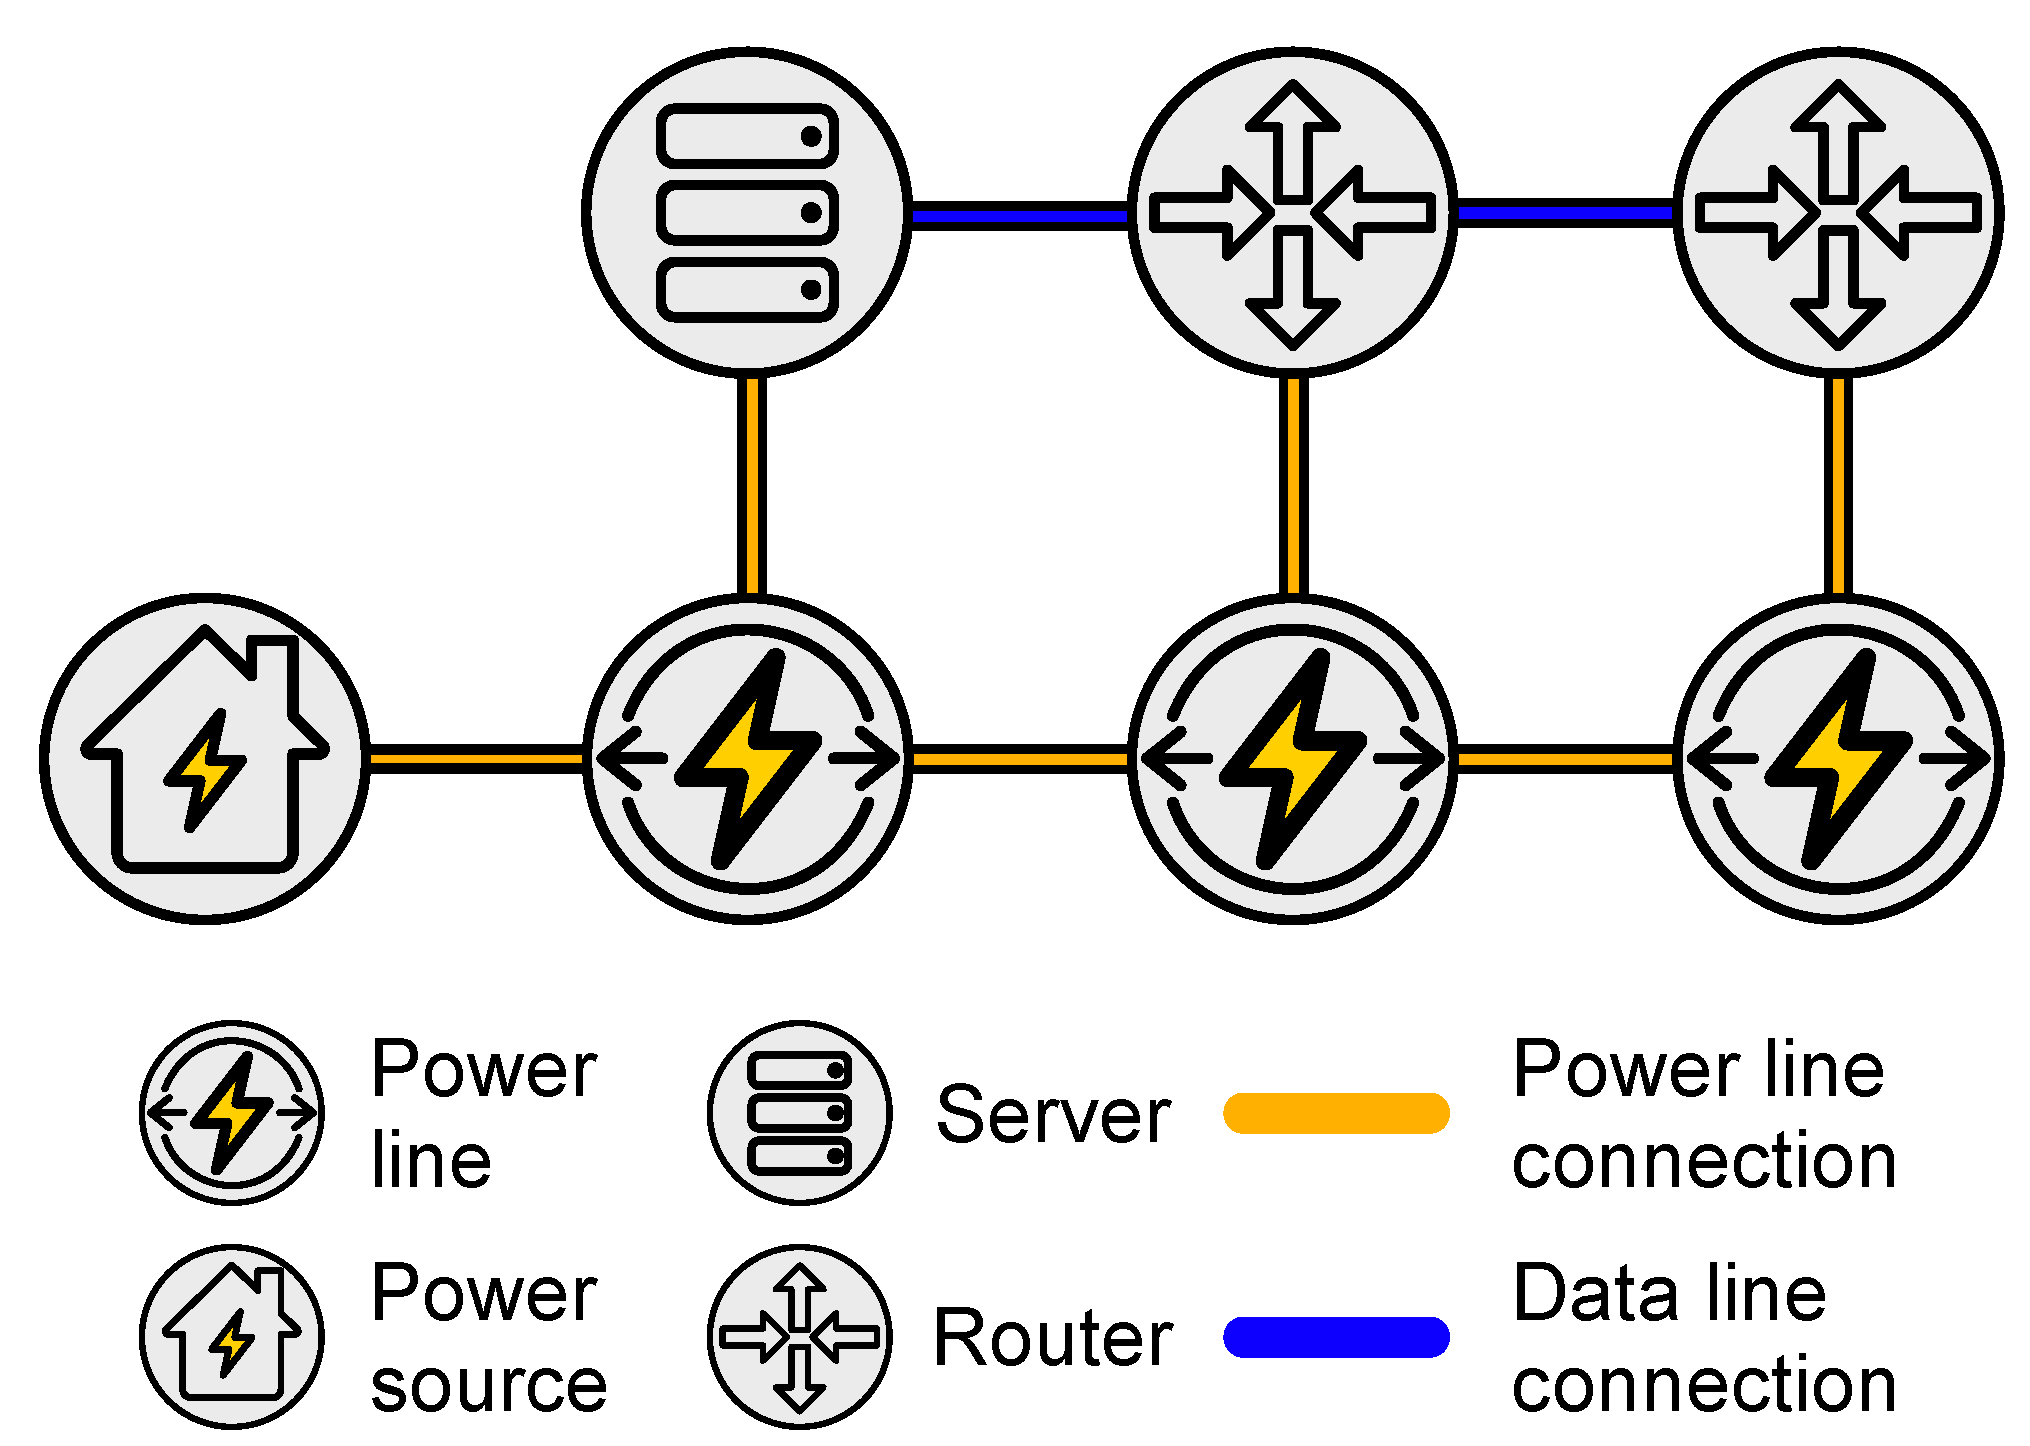
The principle of the whole simulator can be well explained by the following example. In
Figure 1, an overview diagram of the connected power grid and data network can be seen. The real basic data on the topology of the power distribution network was obtained and the first layer was loaded in the simulator. This layer includes specific urban traffic lights infrastructure which consists of the following elements. Individual power lines supplying the traffic signs, from the high voltage (HV) to medium voltage (MV) substation (1), MV power lines, MV to low voltage (LV) transformer (2), and LV power lines supplying the point of delivery (3). In this bus, the traffic lights are connected to the power grid. This point of delivery serves as an interface between the two infrastructures in the model. Communication between the traffic lights is provided from a central location (4), which is supplied from the different power line and transformer (5).
In such a complex network, it is almost impossible to simulate impacts of a fault or nonstandard operation of a distribution network to traffic lights function. It is important to identify exactly the individual links between both infrastructures. The same principle might be used for other layers (e.g., servers) as well and the simulator can be extended by an unlimited number of such layers.
In this case, an outage on the power side may affect the operation of the communication side, but not directly vice versa. However, in real infrastructures, there are also cases in which an outage on the communication side can affect the operation of the power grid, which might lead to so-called domino effects. For this reason, both systems are processed equally in the simulator and both parts use a separate simulation program. In the following subsections, a different approach to each part of infrastructure is described and a novel solution of two separate infrastructures interconnection is presented.
3.1. Data Network
Based on the research carried out on current software solutions in
Section 2, the data network simulation is performed using the open-source tool NS-3 and its standard libraries in the simulator. All available functionalities can be used in the data network simulation. To describe the whole network a JSON file is used. The entire JSON file is processed and the network topology is stored in the computer memory. In the next step, simulation project for the NS-3 program is created in C++. Currently, the data network is simulated in the form of client-server. As the content of the data stream is not yet defined within the simulation, general TCP data is used. The first option of NS-3 output of the simulation is a NetAnim animation program file, which uses an Extensible Markup Language (XML) structure [
44]. The file contains most of the simulated information. For example, it concerns individual interconnection of data network elements, activity of data communication and information about individual data network nodes.
The second option for processing simulated results is the PyViz tool. The PyViz tool enables to get real-time results from the NS-3. Unfortunately, the program is incompatible with many libraries, especially when simulating Long Term Evolution (LTE) devices. Also, in the current version, it is not yet possible to use PyViz for external devices simulations using EmuNetDevice, TapNetDevice or real-time scheduler (RealTimeSimulator). Another problem is that PyViz does not support user interaction with simulated networks [
45].
This is the part of the simulator where the Docker is used. Docker is an open-source project of OS-level virtualization using containers [
46,
47]. This solution ensures security of the entire platform and is composed of several sub-components. The first one is the Docker Engine, which is the core of the entire Docker platform. The Docker Engine is responsible for the entire container life cycle. The Docker Engine uses a client-server architecture. The RESTfull Application Programming Interface (API) or Docker Command Line Interface (CLI) are used for communication. The second part is the Docker Client. In terms of the need for a control through a graphical interface, it is possible to use a graphical client that communicates with the Docker Engine through the API. The advantage of the Docker client is the communication with multiple Docker Engines. The third part of the platform consists of Docker Registries. Virtualized containers are formed by images, whereby each image contains the virtualized system data and the application itself. With Docker Registries, it is possible to manage images in one place. Within the Docker platform it is possible to use multiple Docker Registries. Public register images are called Docker Hub.
To solve the problem of cybersecurity, the simulator attempts to answer the question of what are the weak points of the simulated network and how the simulated data network behaves in the event of a physical attack on its part or an attack that renders part of the network inoperable.
3.2. Power Grid
For the initial simulations of a power grid, the Matpower extension environment was selected on the basis of research made in
Section 2, previous experience with simulations of the distribution networks and the compatibility with reference network models (explained below). The Matlab environment was chosen as a platform for data preparation and simulation control. The tasks of the power grid simulations in Matlab are to complete the input files (either received or automatically generated), verify them, validate the functionality of the loaded network (power flow analysis) and transport the validated data in the required format for the NS-3 program. The operations in the Matlab environment can be divided into two main parts—the first is the assembly and preparation of data for import into NS-3. The second one is the simulation of the power grid and the design of the optimization solution. In the case of the power grid, optimization methods are focused on planning the development of distribution systems—i.e., finding the most suitable grid improvements in order to reduce the overall costs with regard to supplying chosen data infrastructure elements.
The necessary data on the power grid can be supplied in the form of an export from a geographic information system (GIS) directly from individual distributors, or manually loaded for smaller scale systems. As already mentioned, the simulation results are currently obtained on a specific real urban network. Due to the sensitivity of this data and its easy misuse, it is not possible to publish the specific results of the simulations performed so far. This problem was partially solved by using an anonymised reference network to publish the results and present the tool to the wider public. For this purpose, the distribution reference network models obtained from Joint Research Centre (JRC) have been used. The output file can be exported in Matlab data format or in JSON format. In total, there is a complete data set containing about 3 large scale network models (urban, semi-urban, and rural) and 10 common network topologies used in distribution grids [
48].
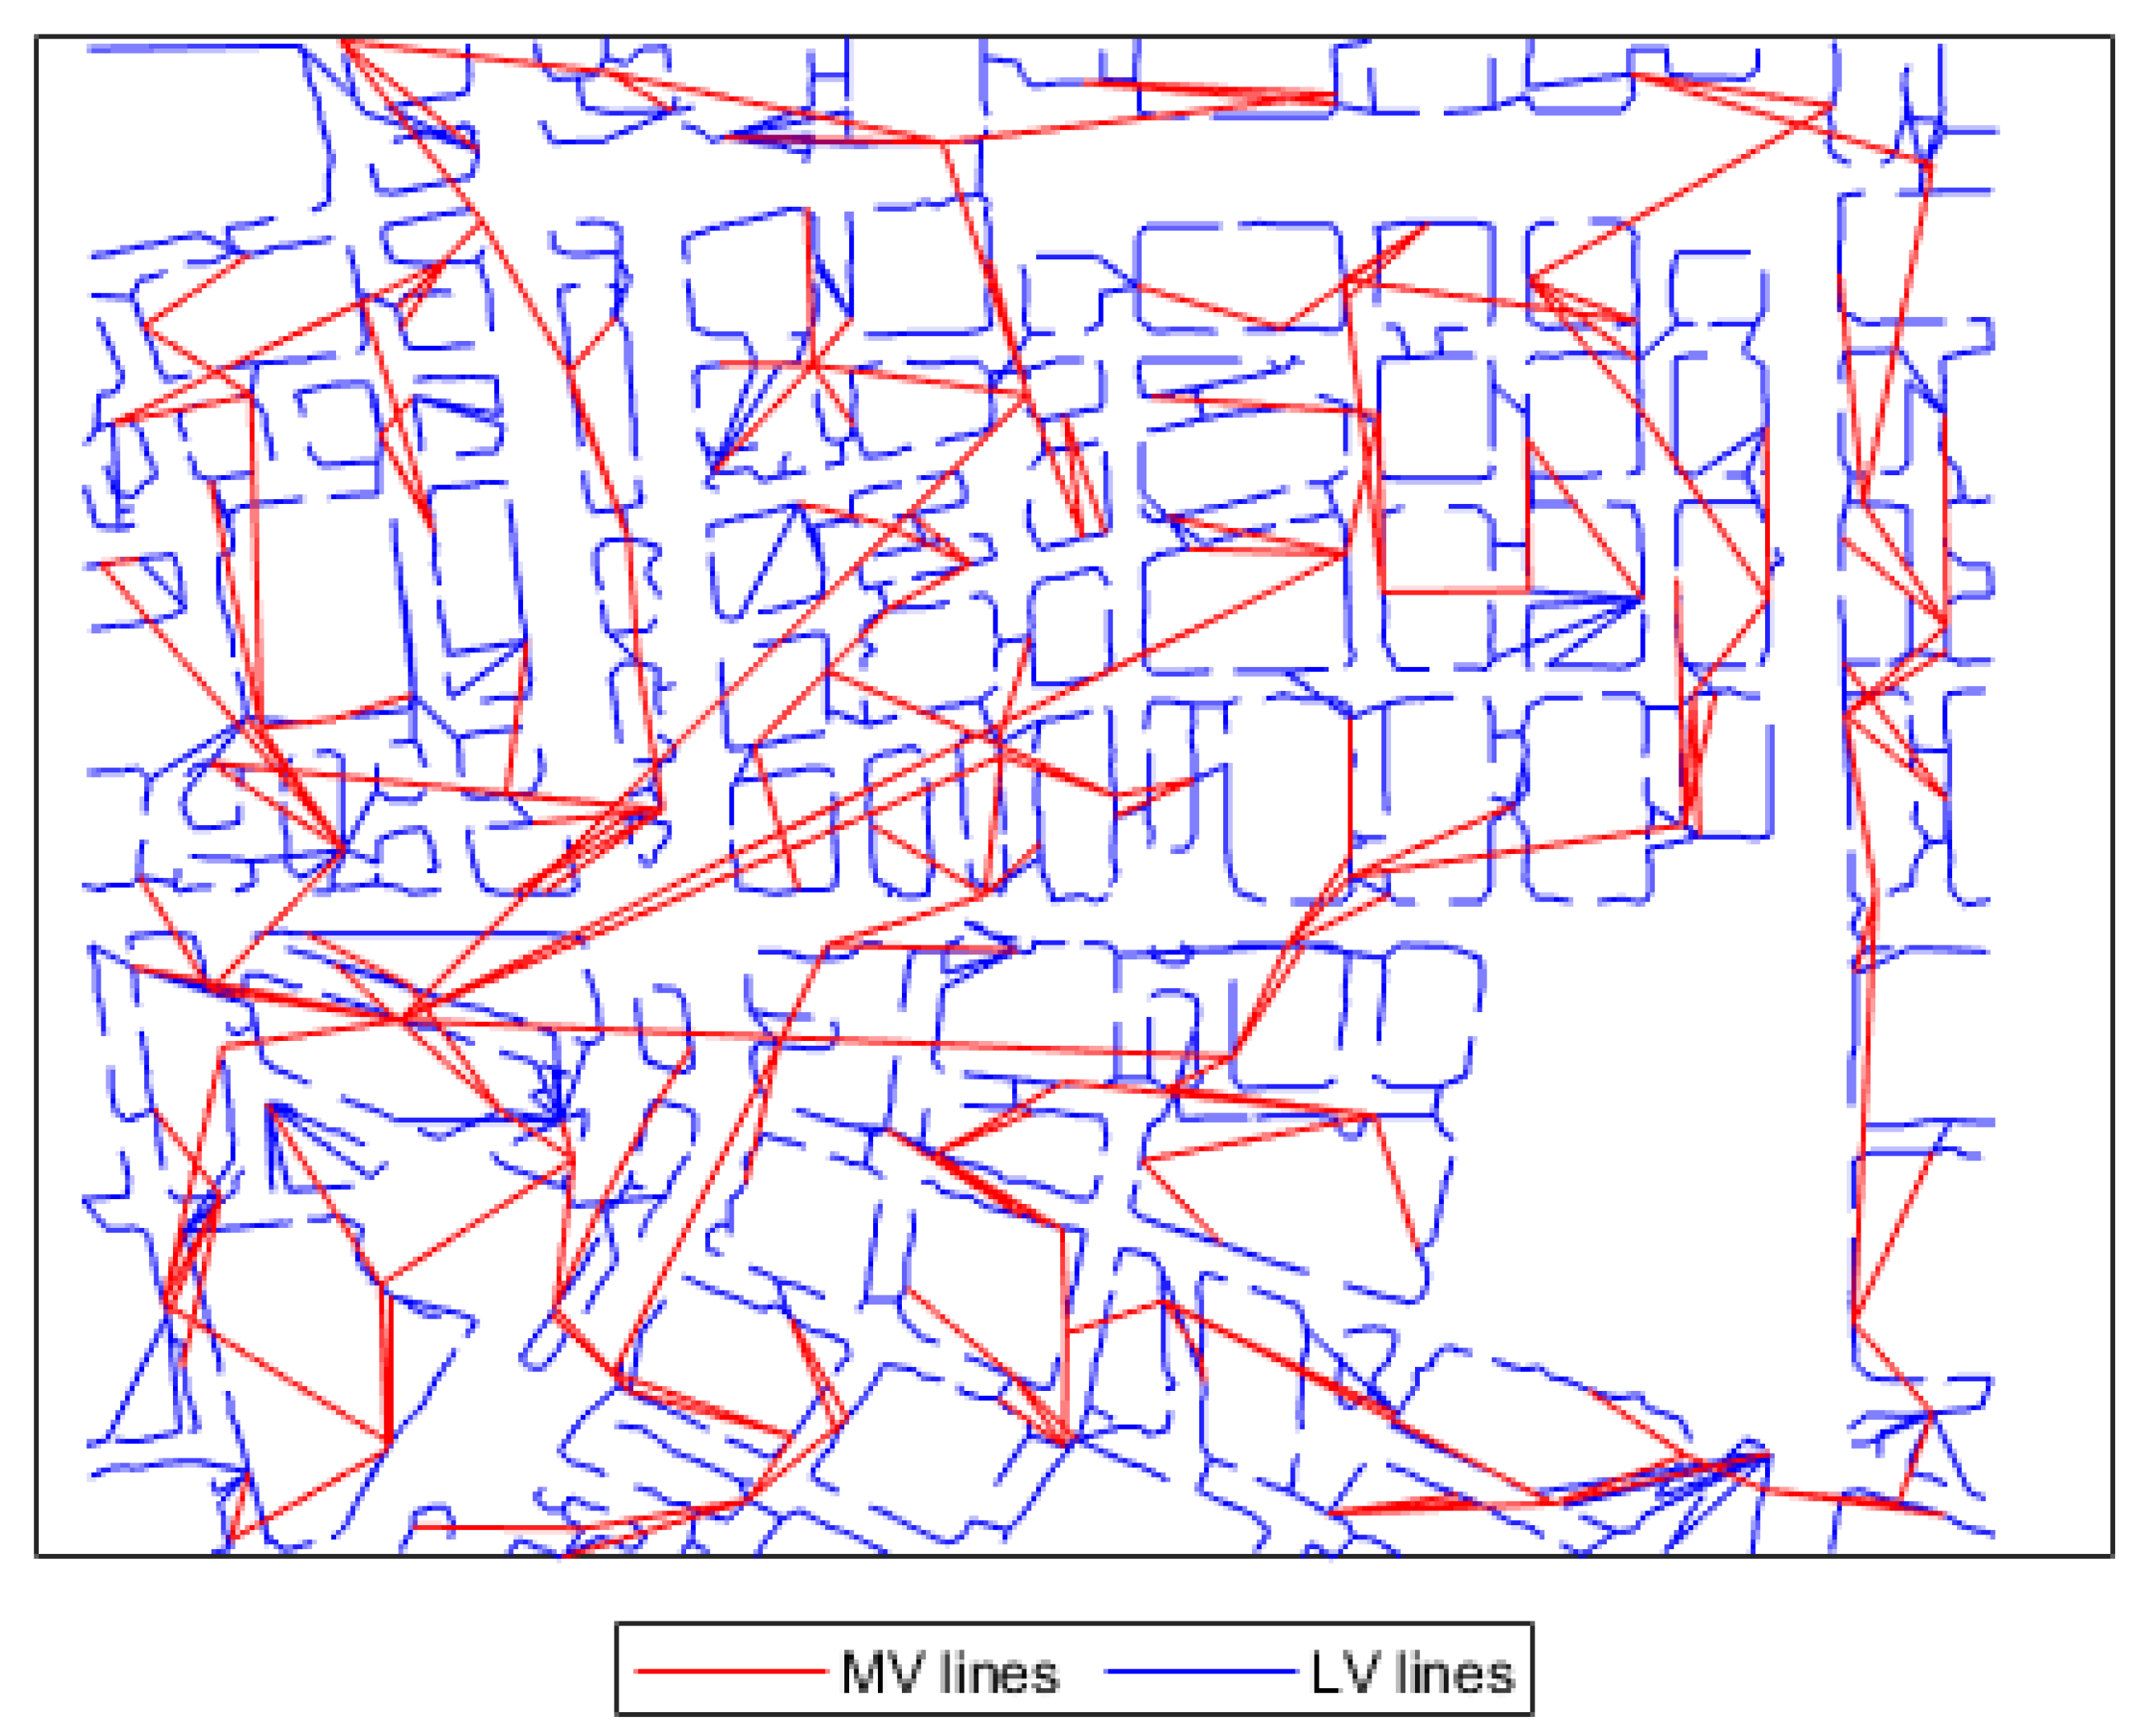
The urban network was selected for initial testing. A script in Matlab was created to graphically display the selected network. The graphical output of the selected network is shown in
Figure 2. It contains data on a total of 3239 nodes, 3116 lines at MV and LV levels and 127 transformers. The LV lines are shown here in blue and the MV lines in red. Even without the underlying map, we can see that, unlike LV lines, MV lines do not respect the “real” coordinates. This fact is caused by the network generating algorithm used and has no effect on the functionality of the network. In the next phase of the simulator development, a feature will be added to allow the coordination of MV lines with respect to urban areas. The data on the generator parameters at the balance node and loads at the points of delivery can easily be inserted into the simulation. There is also a possibility of creating an automatically generated random network using the JRC DiNeMo tool, which is also currently under development [
48]. The main advantage of such a network would be the possibility to present and publish the results of the simulations and taking into account the sensitivity of the data used and obtained.
The above mentioned distribution network models do not contain any link to the communication network, which had to be added separately to the model for the initial simulations. For this purpose, the communication network was completed on the basis of experience with real traffic sign infrastructure.
3.3. Software Interconnection
As already mentioned, both networks are simulated separately in the simulator. Therefore, it is necessary to ensure communication between the two various environments. Two scenarios are currently being considered. The first scenario assumes a specific time length of the simulation. In this scenario, a discrete simulation is considered. This type of simulation is suitable for systems whose state is subject to change due to discrete events [
8]. The principle of the cooperation between two simulators might be described as follows:
The data are loaded and verified in the Matlab environment. To verify the power grid, the power flow analysis will be used using the Matpower tool.
The parameters of the simulated event (e.g., fault) are entered for the verified grid topology data.
Once the simulation in Matlab ends, the data on topology and the course of the fault are send to the NS-3 software.
Simulation of the data network is made using the NS-3 and the data is processed back to the Matlab software.
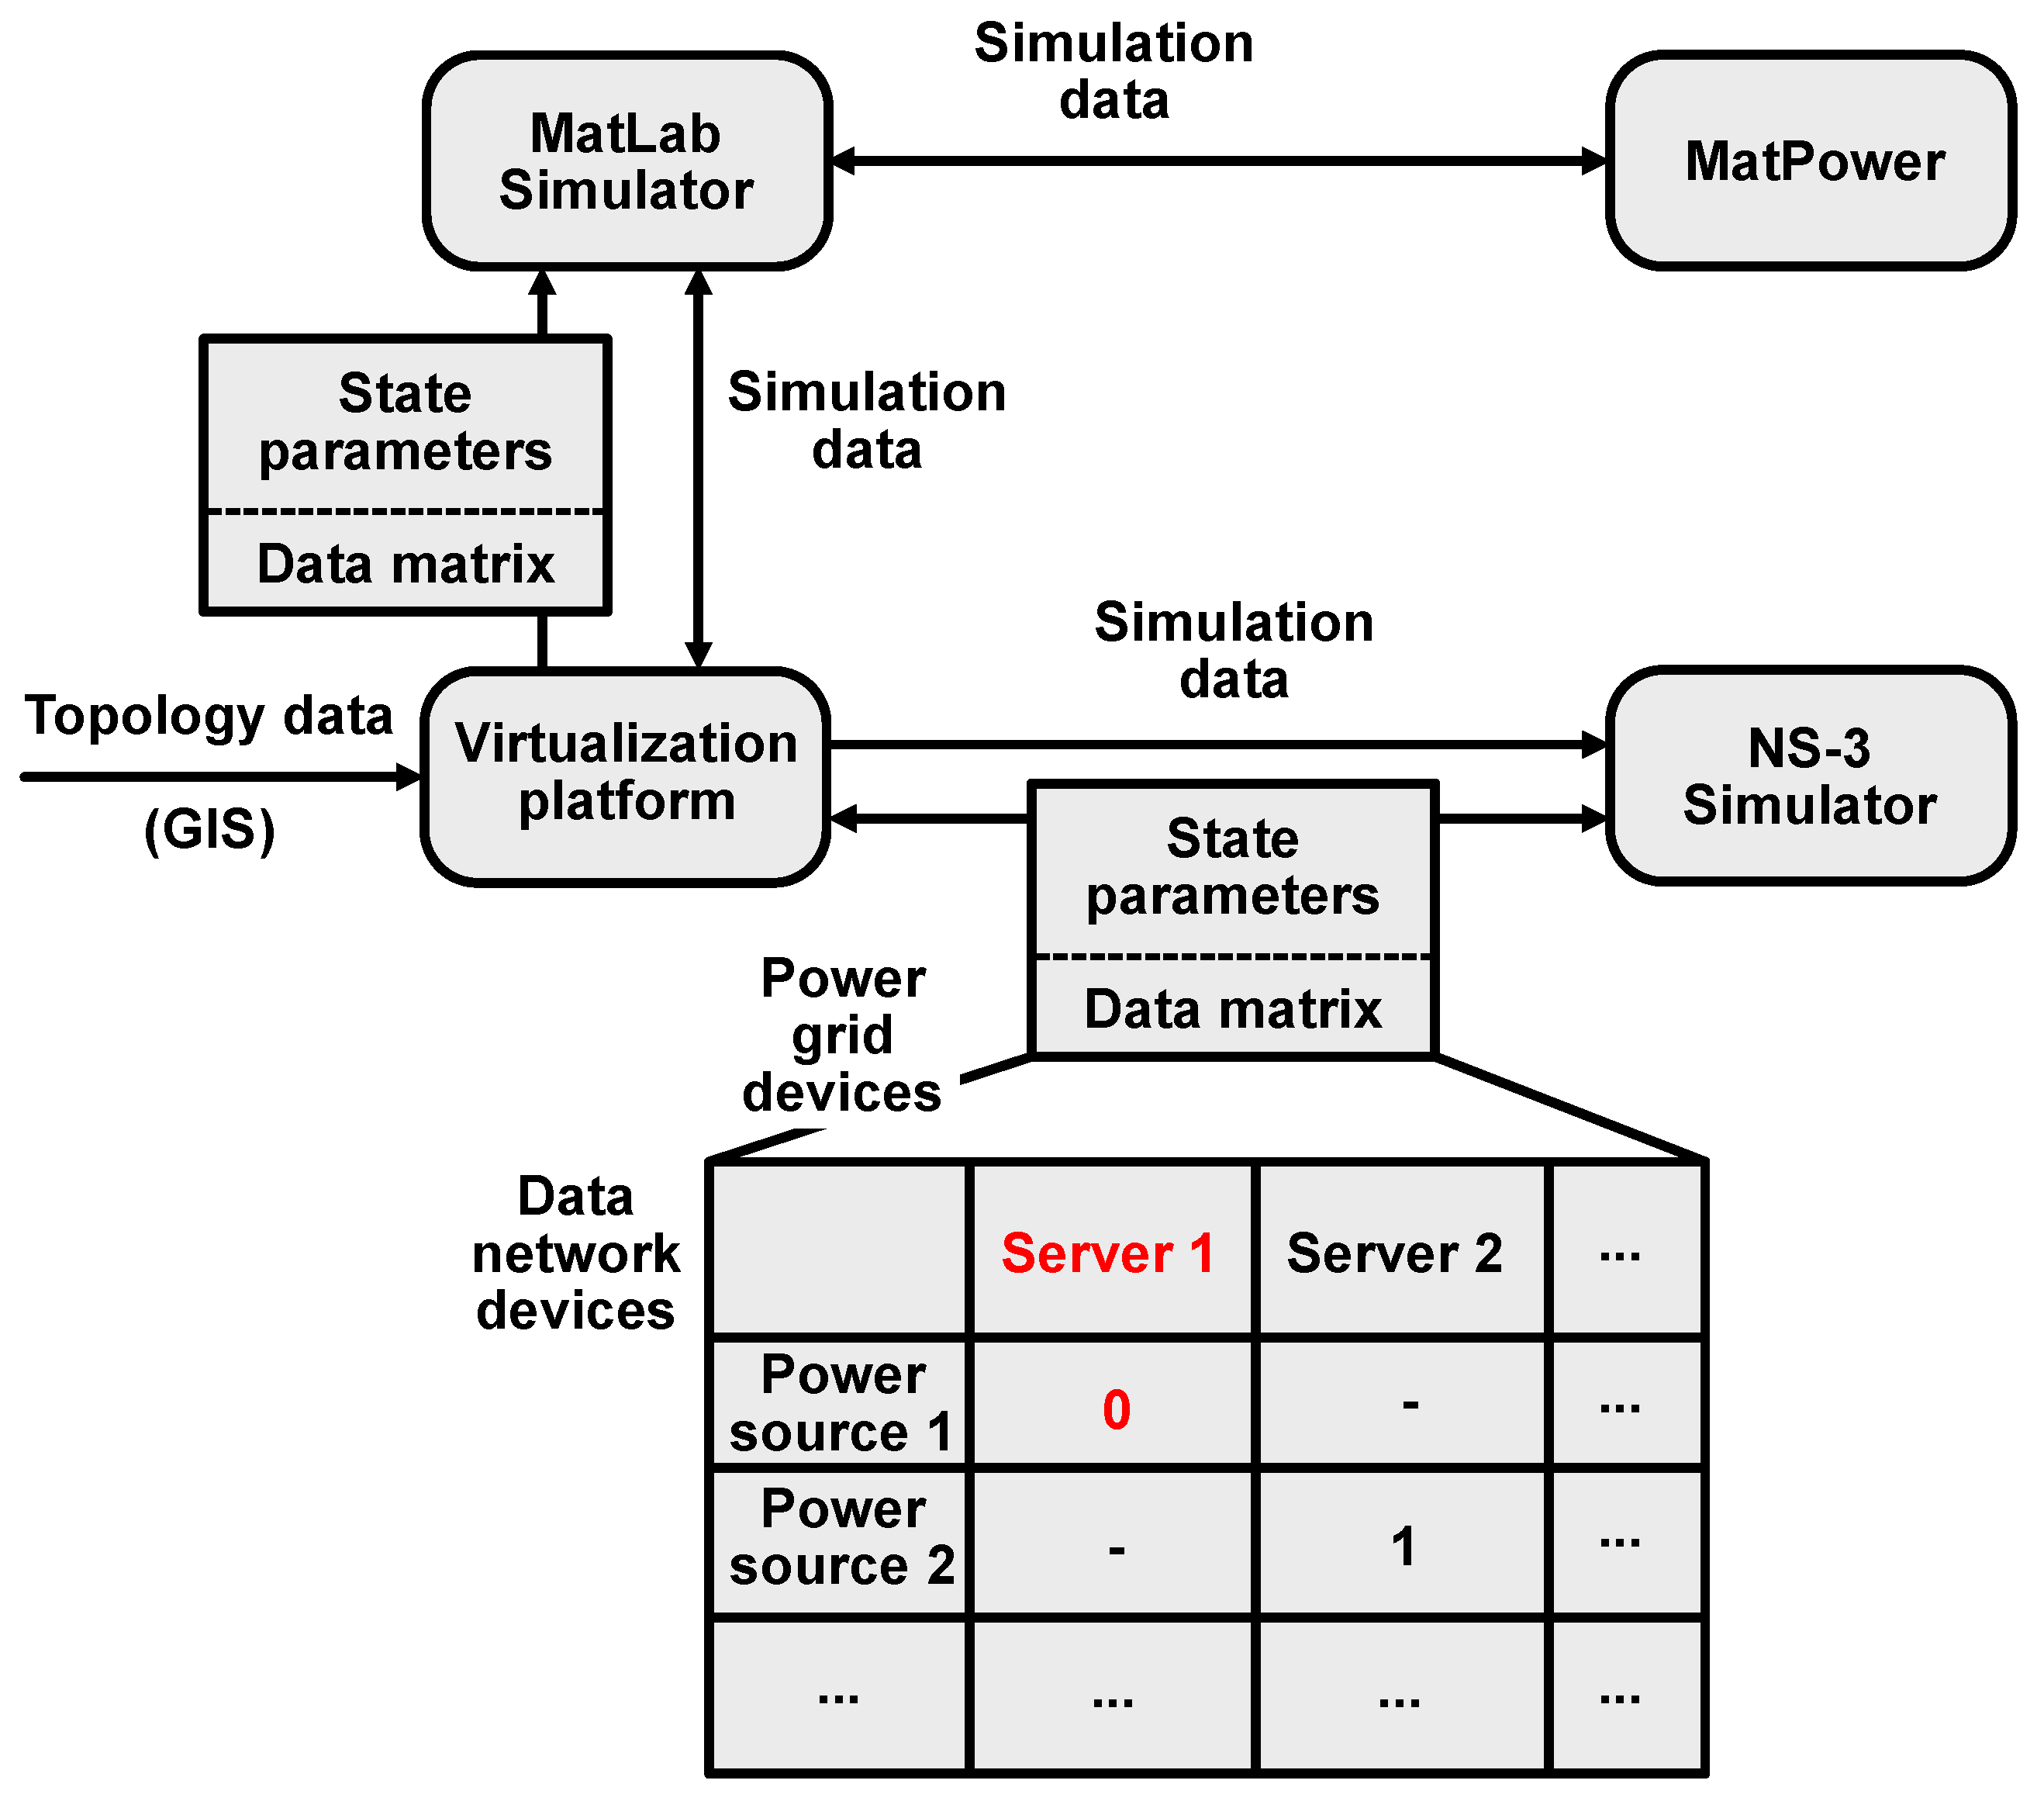
The diagram in
Figure 3 represents the inner logic of the virtualized simulator. The main element is the “virtualized platform” where data with information about simulated networks are inputted. Simulations are performed in the virtualized environment of the NS-3 and Matlab programs. Both programs (NS-3 and Matlab) are run by a “virtualized platform” and the topology and properties of the simulated network are passed before running, along with information about failures in the simulated network. Each time a simulation is completed, the results are passed back to the “virtualized platform”. The results transmitted may contain information about failures represented as matrix with interconnections of data nodes and power grid nodes represented as 0 for faulty state and 1 for functional state. Matrix data is be used for next simulation of the second network. The principle used corresponds to the so-called digital twin technology described in [
50].
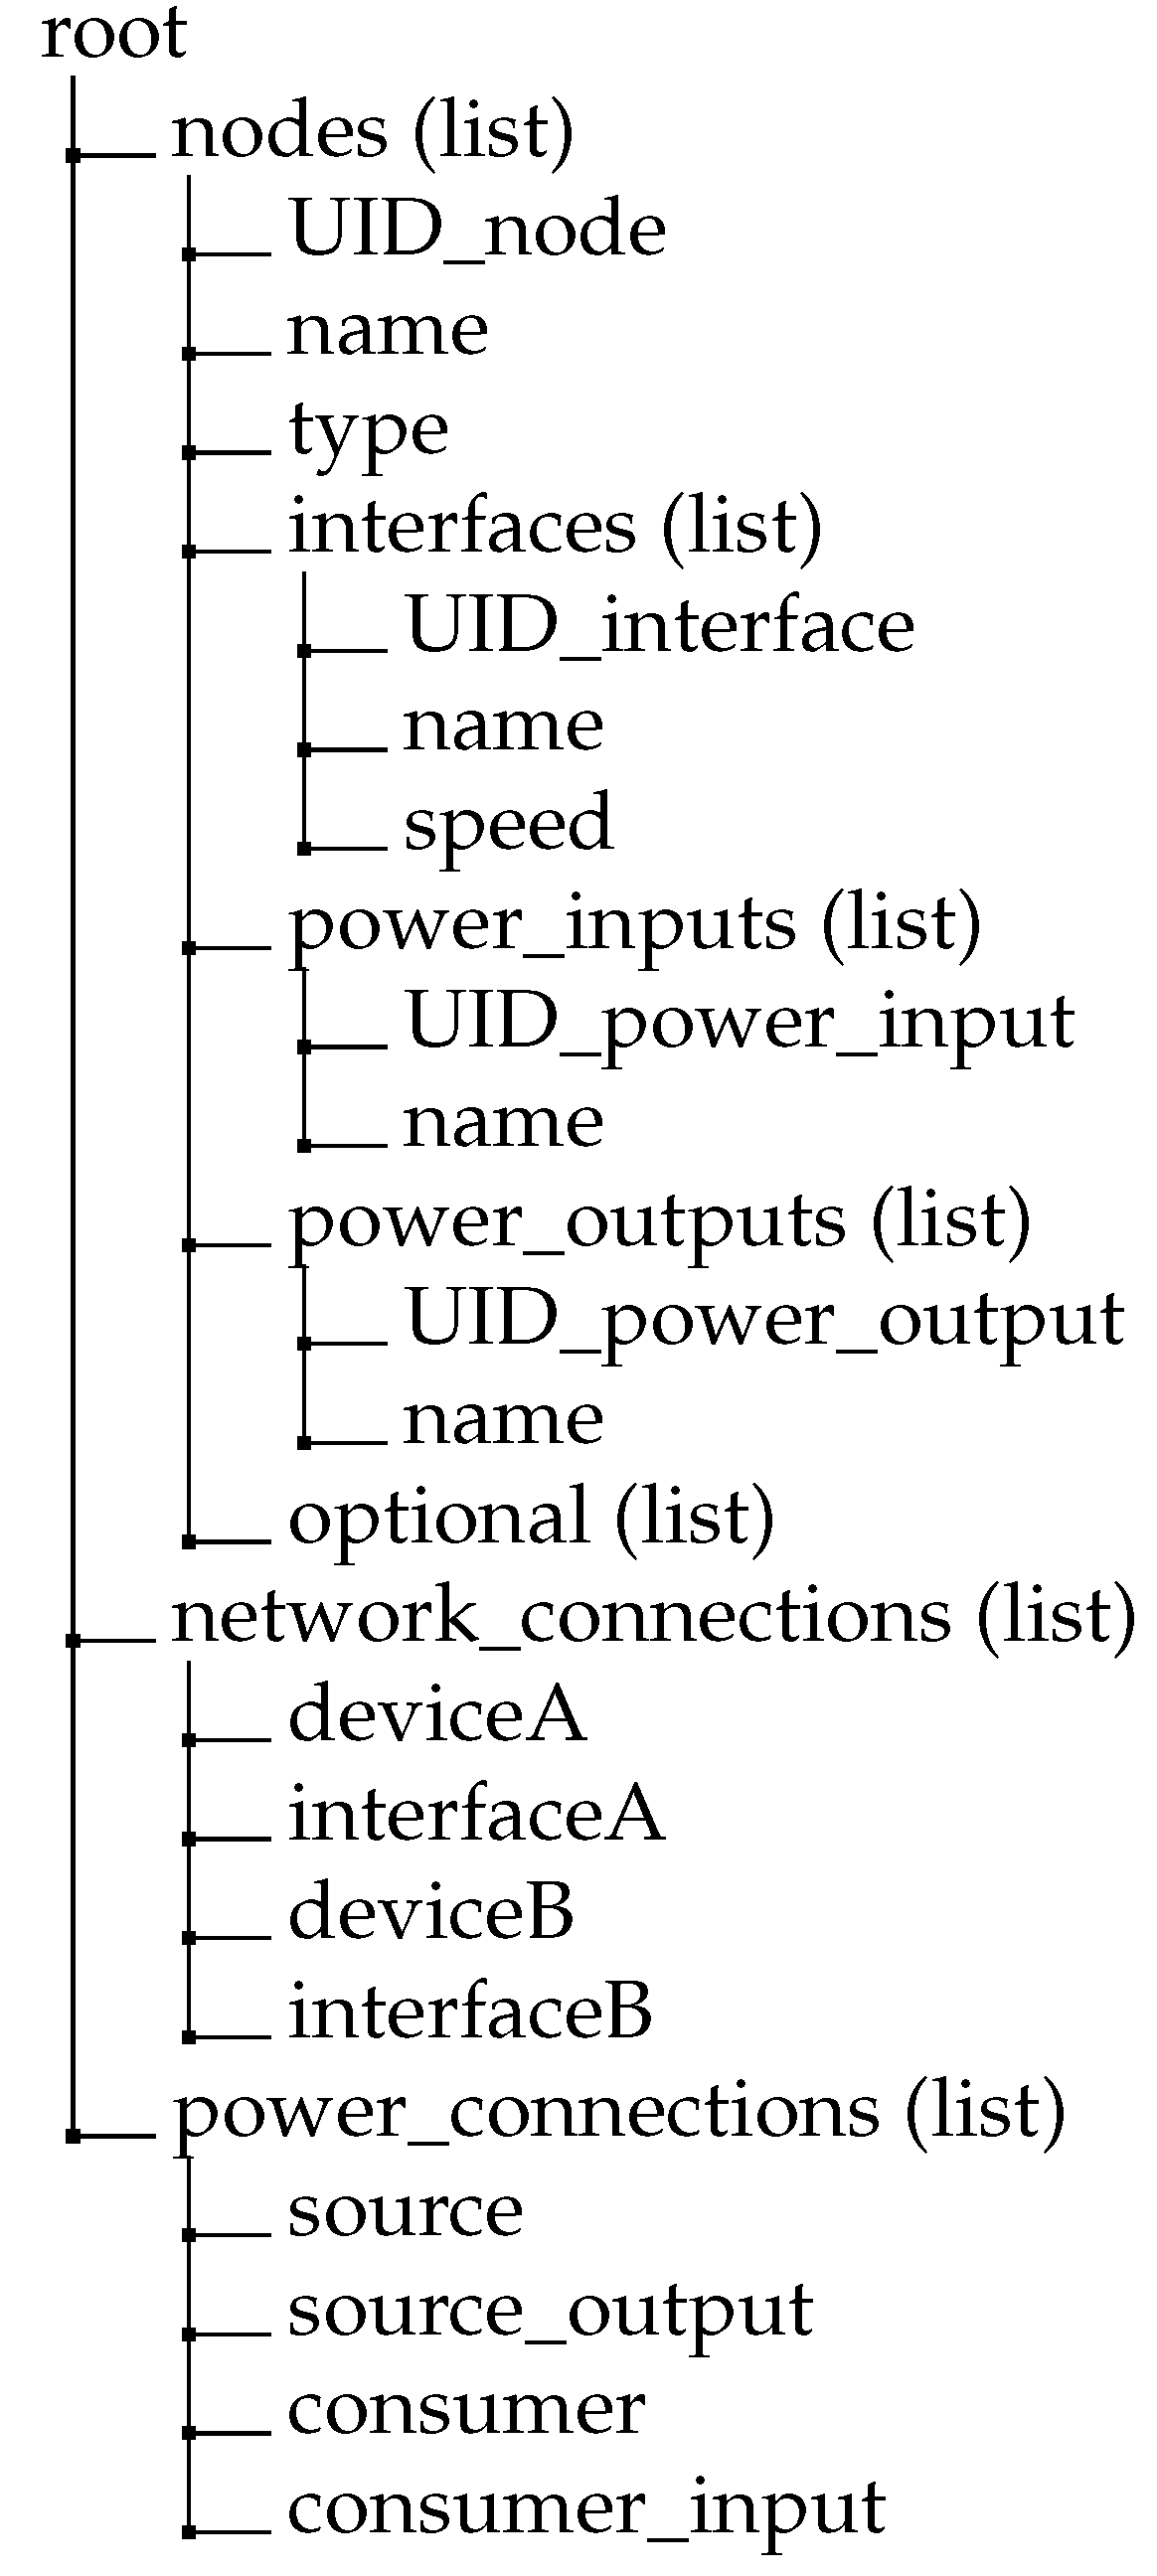
The data format and the method of data exchange had to be unified.
Figure 4 shows the structure of the unified JSON file. The basic structure of the file is divided into two sections containing information about simulated nodes and nodes connections. The first section includes information on simulated elements. The elements in the first section are further divided into categories for data network elements and power grid elements. The category containing information on interconnections is divided in the same way. Both networks are connected using the information about the interconnection of power grid elements with the data network elements.
The JSON file contains three types of records. The first type is the element. The element can be a data network element or a power grid element. In
Figure 4, the element is listed in the list named “nodes”. The “node” element contains a unique identifier (ID), name and type. The type determines the element’s properties in the simulation. The type also determines the element’s affiliation to either data or energy network. The element can contain three lists. The first list contains the available data interfaces. The second list contains the power inputs. The third list contains the power outputs. For data network elements, it is mandatory to specify at least one data interface and at least one power input interface. For power grid elements, the indication of the relevant inputs or outputs is conditional on the properties of the simulated element (as an example, a power supply may contain only power outputs). The last list with the name “optional” is intended for any additional data. The data listed in the “optional” list does not affect the simulation itself. It is possible to work with them outside the simulation (for example, to display them as additional information about the element).
The list called “network_connections” is used to determine data connections for data network simulations. Each object in the list contains the IDs of element A and element B, which are interconnected. Each element can contain multiple data interfaces. Therefore, the names of specific network interfaces are given. As with the list with data links, the list with the name “power_connections” is made of objects that contain the unique IDs of the power supply and the appliance (consumer). The “source_output” variable contains the name of a specific power output interface from the source element, and the “consumer_input” variable indicates the name of a specific power input interface on the appliance.
3.4. Operation of the Developed Simulator
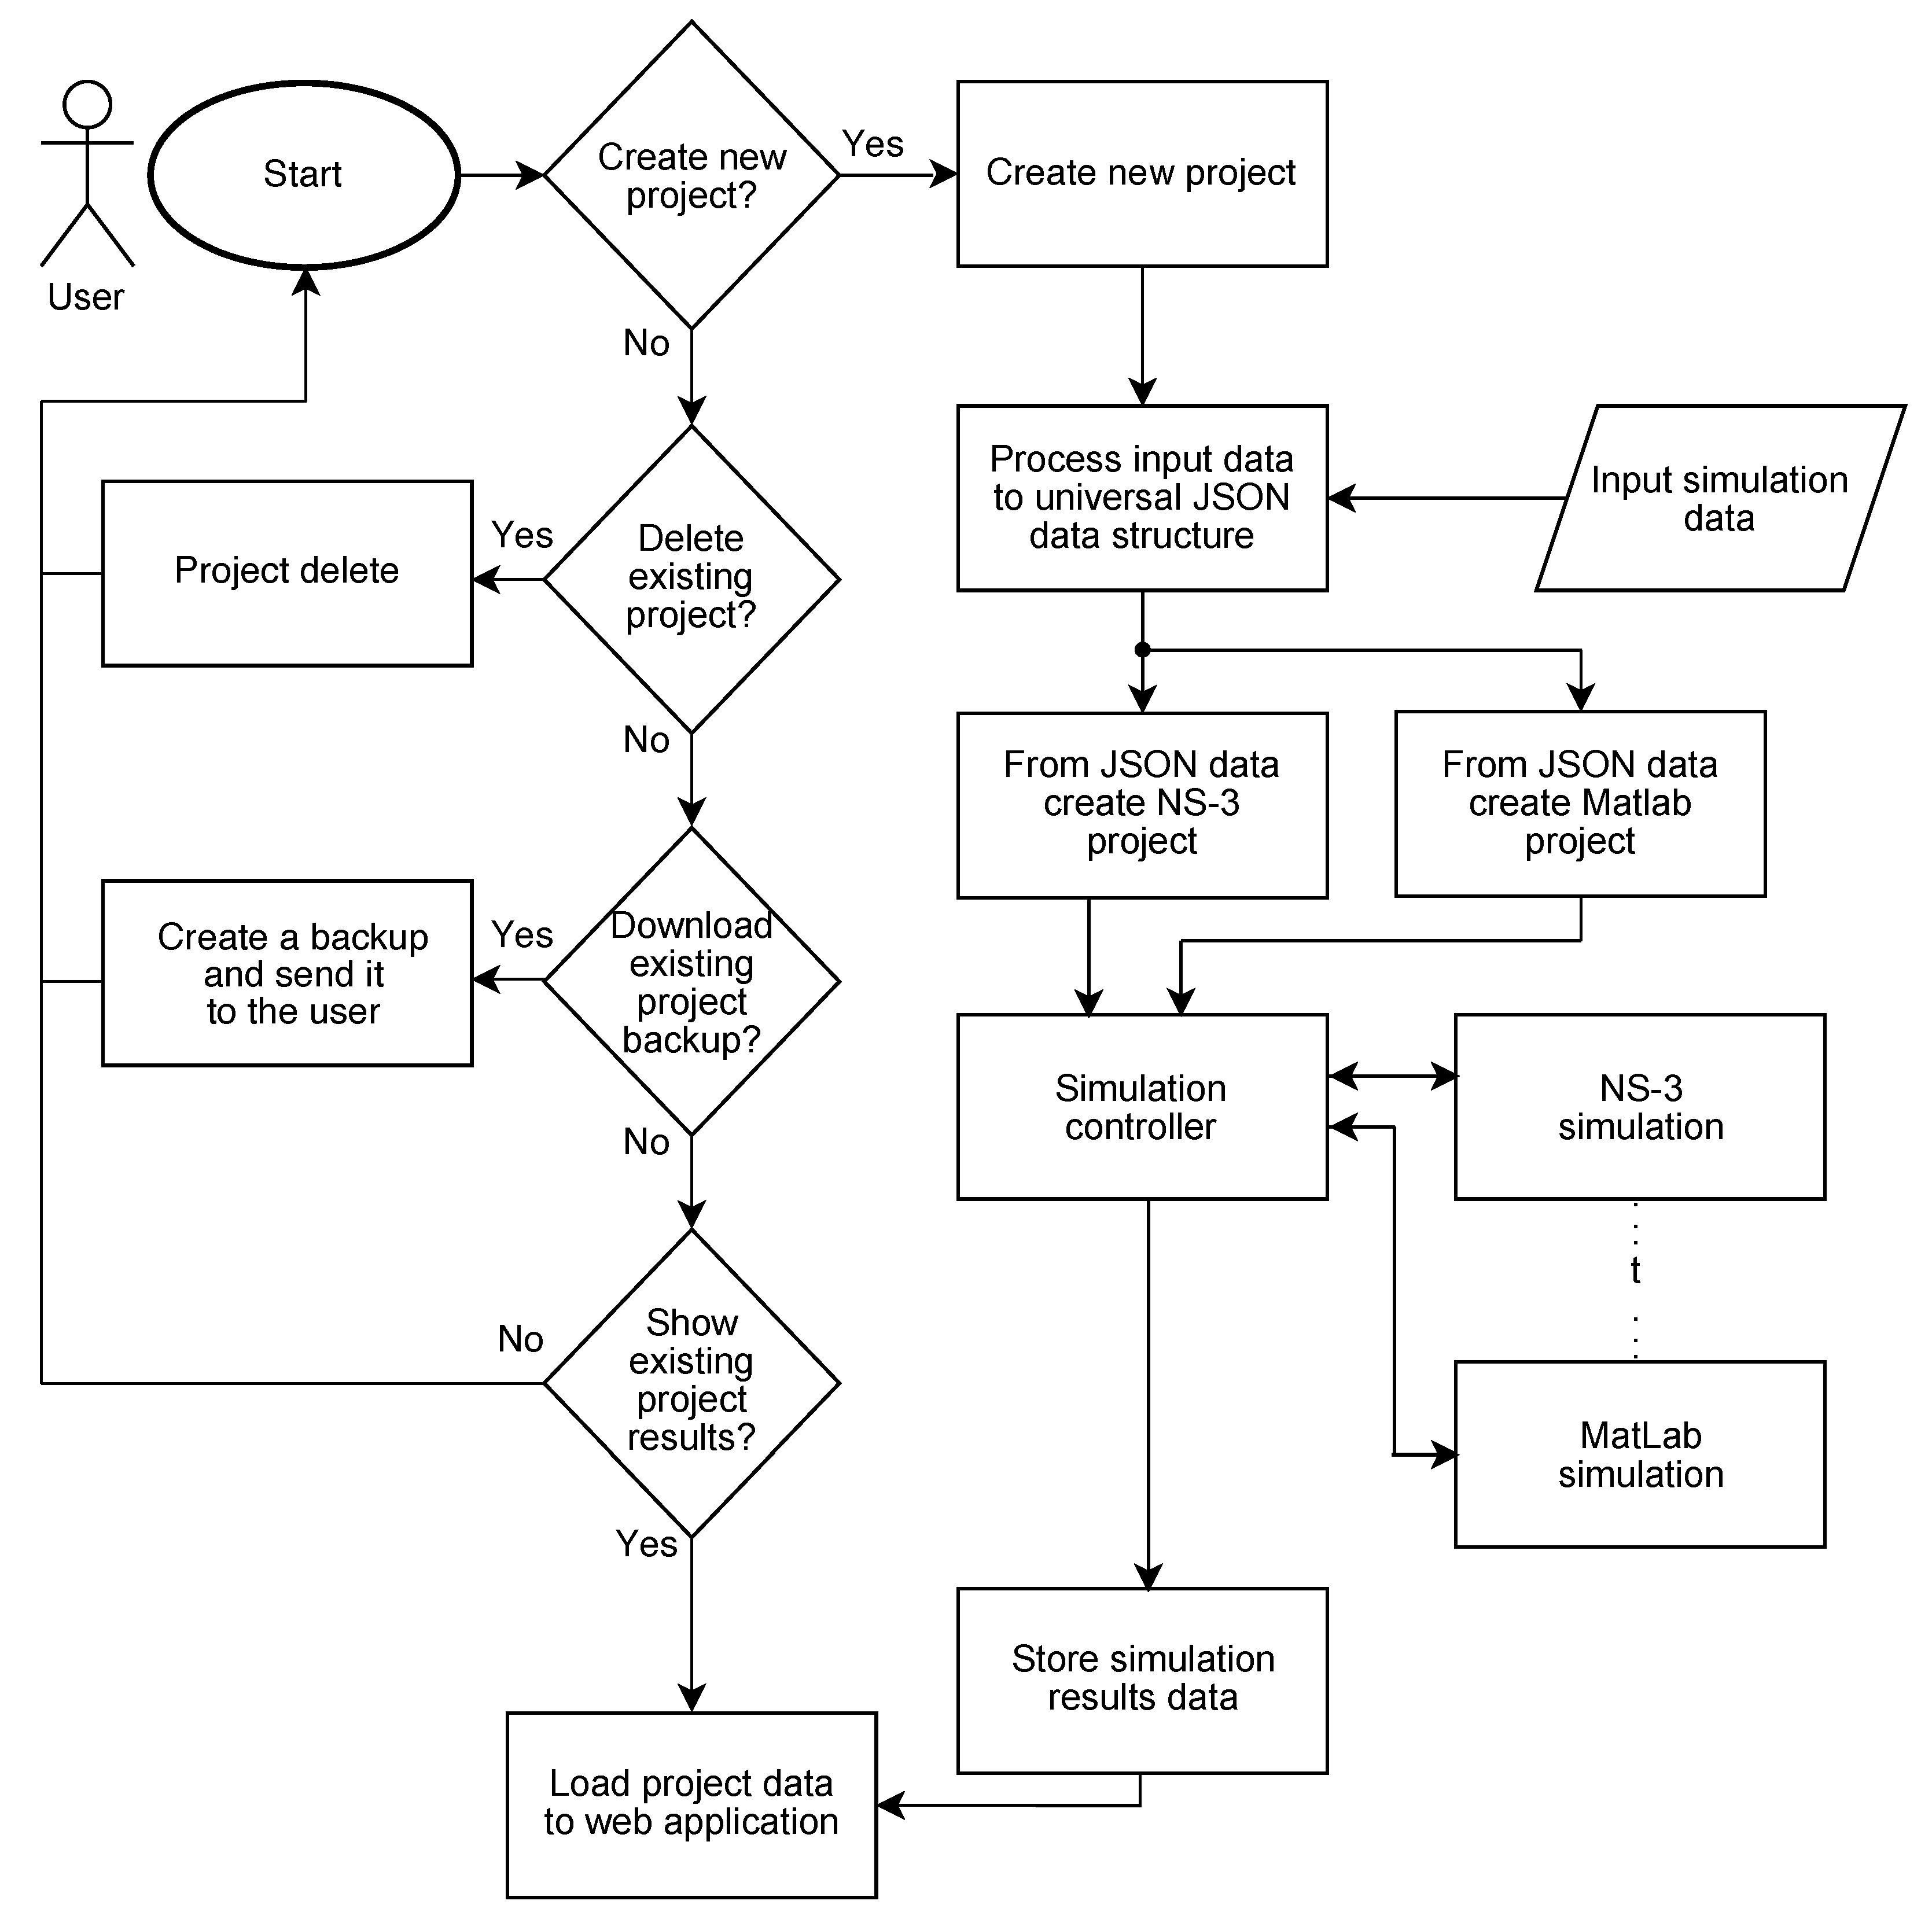
The diagram in
Figure 5 represents the user’s interaction process with the simulator. The simulator is controlled via the graphical interface. The user’s interaction begins by deciding whether to create a new project or to display the results of an existing project. If the user decides to create a new project, a new project is created using the wizard and the user imports the data containing information about the simulated network. The imported data are processed into a unified JSON style. The JSON data are used to create a project for the NS-3 simulator and for simulation in the Matlab environment. Once the projects are created, the simulator proceeds to the simulation itself. The simulation is defined by a fixed time span, which is divided into individual windows. Each window represents the simulation step, when both the data and power grid layers are simulated. The simulation window represents one simulation of the data network and one simulation of the power grid. If the timeline contains multiple time windows, the simulations are switched between the windows, and the final data are passed between the simulations. Once the entire timeline is over, the results are stored and displayed to the user.
If the user chooses to work with already existing projects, there are three options offered. In the first option, the user can delete the existing project. This deletes all data related to the project on the server side. This operation is irreversible. The second option offers the user to download the existing project in ZIP format. The last option is to view the results of the simulation.
3.5. Simulation Types
Currently, two different types of simulations are considered within the developed simulator. These two scenarios differ in the timing of the entire simulation and the data exchange between the energy and data parts of the simulator. The first scenario is called “time course of the fault” and the second is the “probability of a power outage determination”. The approaches used for each scenario and examples of use are described in the following subsections.
3.5.1. Time Course of the Fault
In this first scenario, the fault progression is viewed in discrete time. For the loaded network, the location of the fault and the time at which the fault occurs must be specified. The output of the simulation is then a time distribution of the fault progression, showing at which point the fault occurred, which lines were affected by the fault, and the individual fault duration at each device [
4]. The output data is in discrete digital signal format (1/0). This signal is always given for each specific node in the system, according to the extent of the simulated network. It is the duration of the fault that is a key factor for one of the possible optimization processes, namely in economic terms. Following the fault record processed in this way, the NS-3 simulator simulates the effects of the outage in the network area. In the time from the occurrence of the fault to its resolution, the data flow in the data network and the load of individual lines are analyzed. Then, the optimization solutions can be suggested.
The simulator enables to schedule failures during the simulation. Each simulation is currently scheduled for a specific time length. First, it is necessary to schedule the failure directly by editing the C++ project for NS-3. The failures are created by deactivating all interfaces on the element that will show signs of a failure. An example of deactivation of the data interface is shown in Listing 1.
| Listing 1. Example of network interface state control. |
![Processes 10 02504 i001]() |
The Schedule class is used for fault planning in the simulation. With the Schedule class, scheduled faults at different times can be simulated. In addition, it is possible to simulate an unstable data link using a regular state change. An example of failure planning in the time of 10 s is shown in Listing 2.
| Listing 2. Demonstration of fault induction [51]. |
![Processes 10 02504 i002]() |
3.5.2. Probability of a Power Outage Determination
The second way of processing the fault data for the data network simulator considered so far is to evaluate the probability of failure for each of the power grid elements. For each of the devices on the power line to the point of delivery, the probability of a fault occurring and the average time required to clear it must be determined. This could be determined based on available statistical data from any power grid distributor. For example, overhead power lines would have a higher probability of failure and related power outages than cable lines and so on. Once the data is compiled this way, a probability distribution will be processed by the NS-3 software. Based on this data, the simulator should select the most problematic parts of the networks. The output of the simulation should be the proposed optimization leading to the elimination of infrastructure weaknesses—both power grid and data network.
4. Virtualization Part
As it was already mentioned, the developed simulator can be used by various users, both from the energy or communication sectors. In communication networks, the simulator enables analysis of outages and changes in data flows depending on planned as well as non-planned events in distribution networks. From the distribution system operator’s (DSO) point of view, the simulator enables simulation of communication equipment failures and analysis of the impact on the operation of the distribution system. It also allows to take into account the costs of the distribution system operation associated with the failure of the communication equipment and to optimise the network in terms of cost reduction by eliminating these failures.
Therefore, it was crucial to enable simple operation of the software using a clear interactive environment. For this purpose a separate part of the software, where the virtualization is made, was created. As a part of the Docker virtualization, an image was created with the NS-3 simulation program in the latest version 3.35. The image is set up for the virtualization platform to receive the prepared simulation project and return the data with the simulation results after the simulation is finished. All the tools that make up the virtualization part of the entire platform are controlled by a program created in the Python language. Currently, the project uses the Python version 3.8 for compatibility with all libraries used in the project and for compatibility with the rest of the platform.
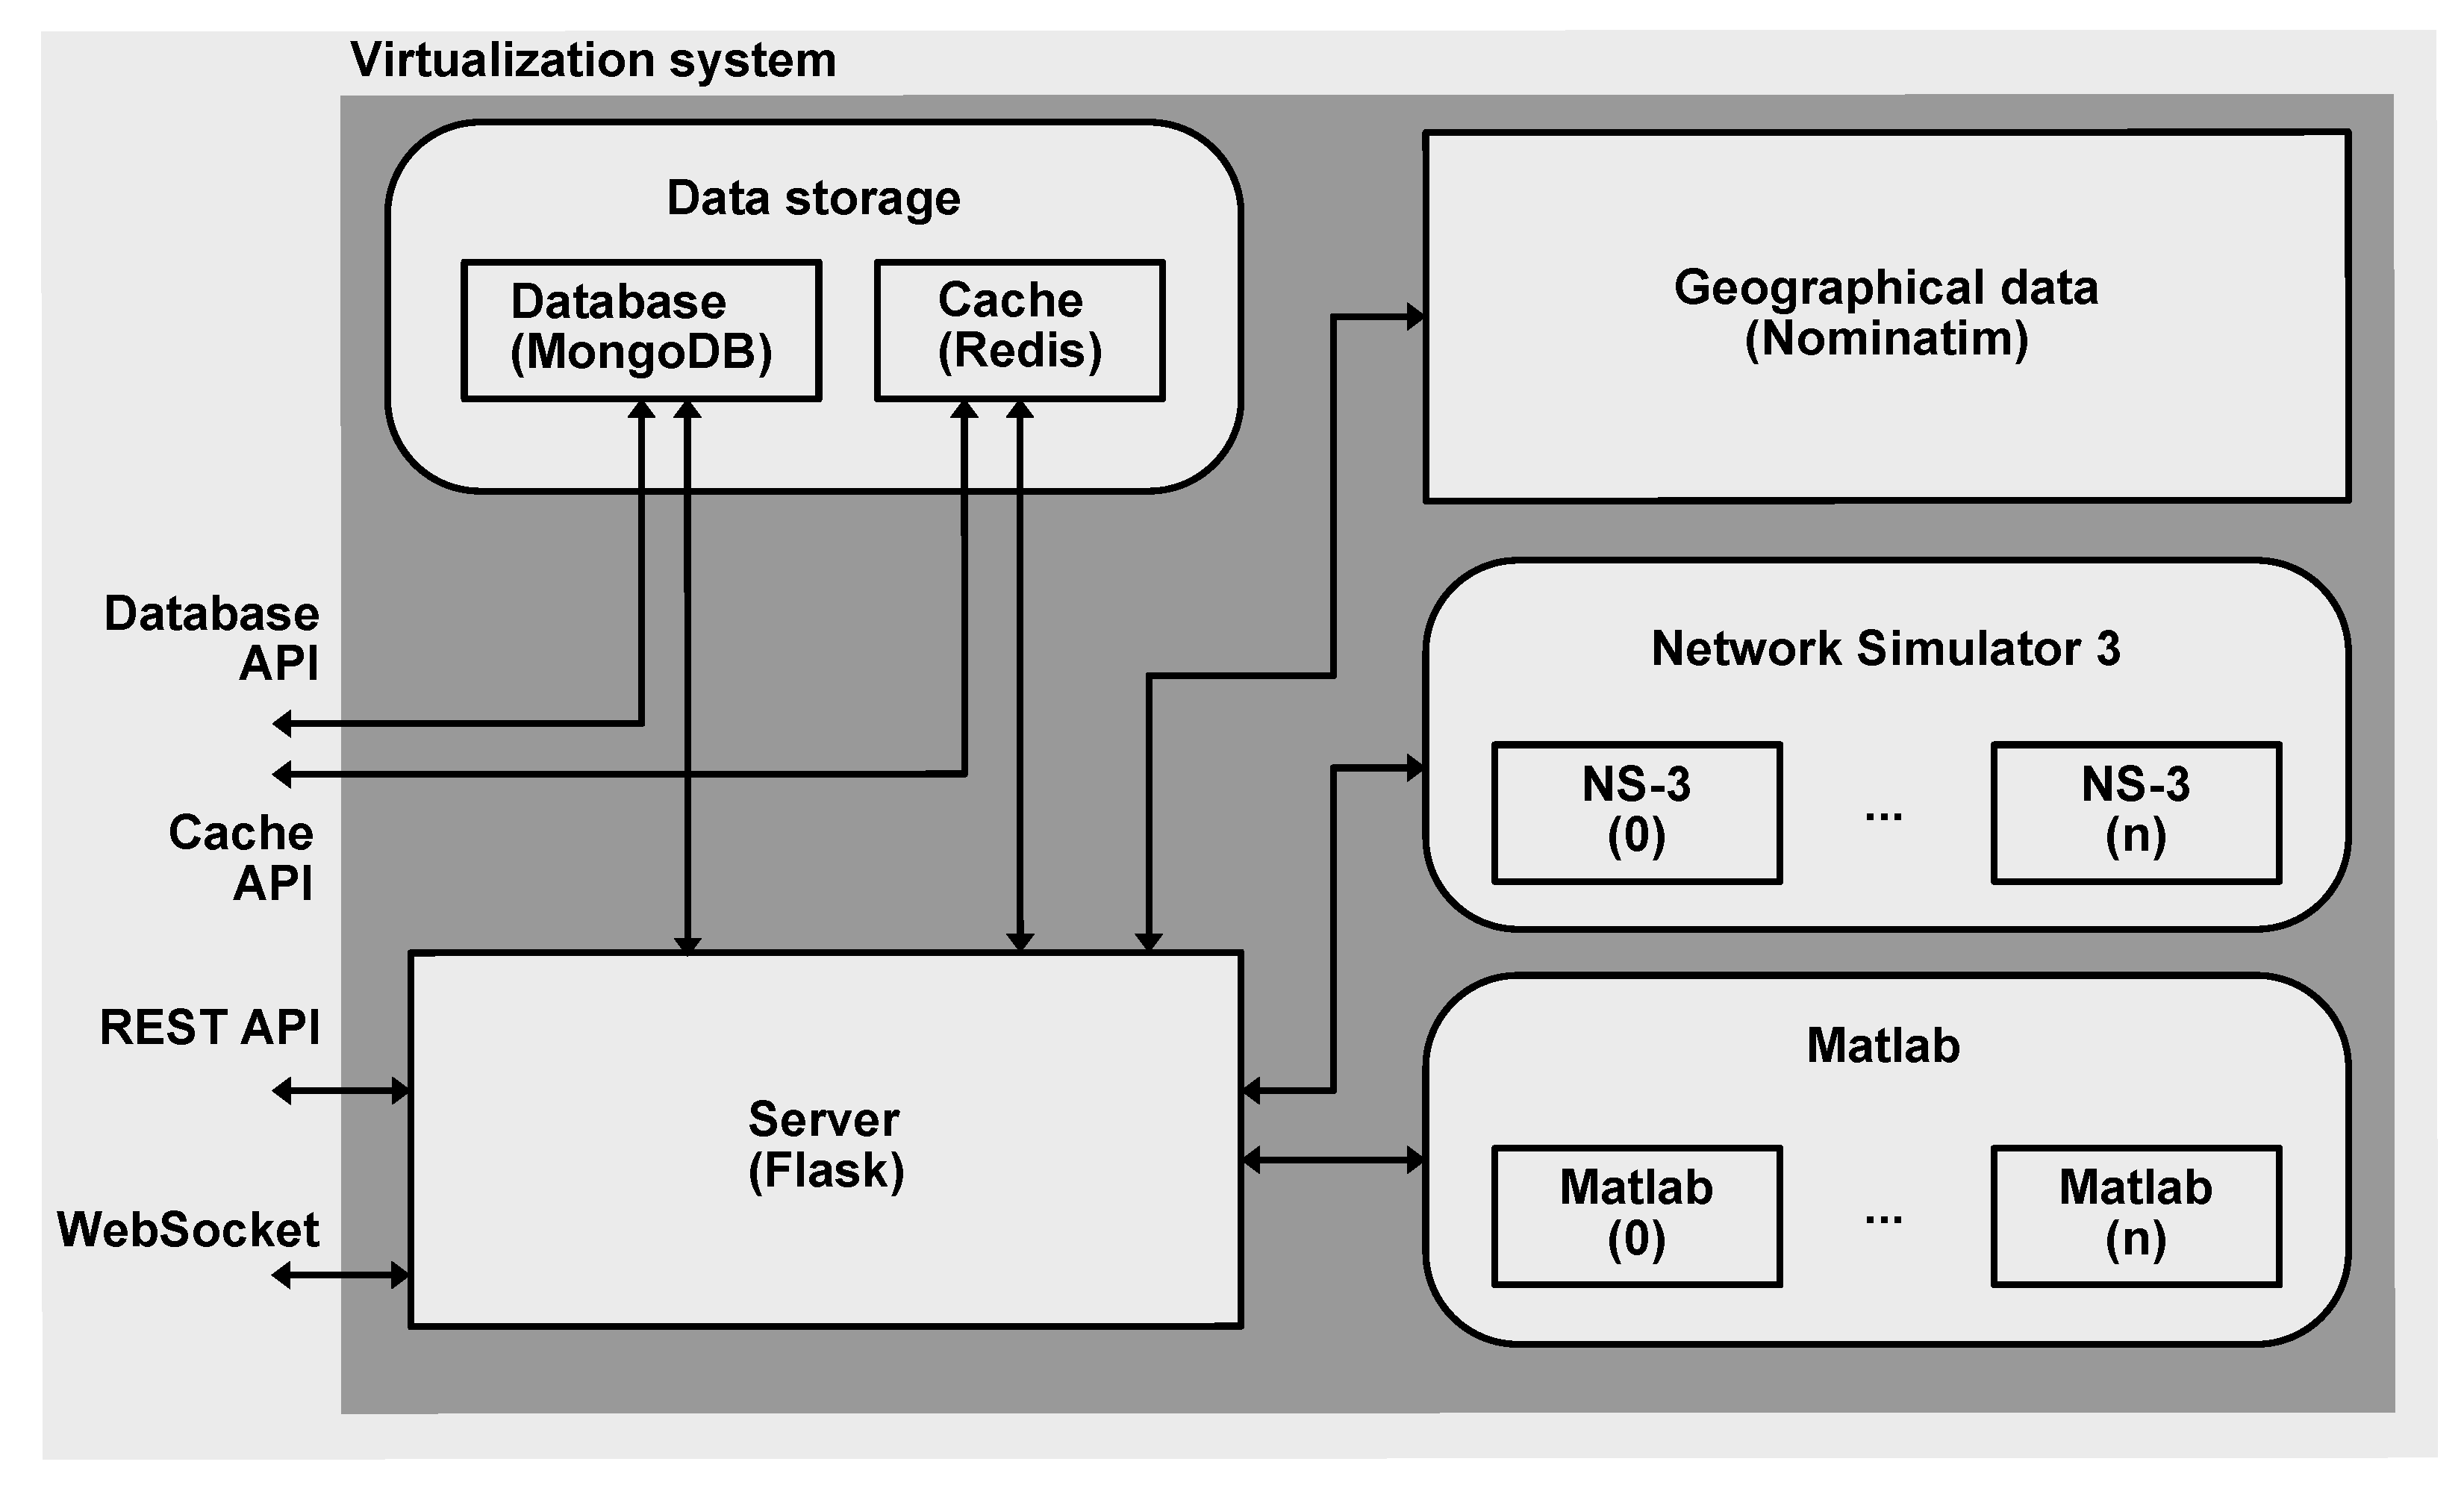
Figure 6 represents inner connection of all services in the “virtualization system”. The main part is a server written in Python using the Flask framework. The server communicates via the Hyper Text Transport Protocol (HTTP) Representational State Transfer (REST) API and WebSocket. The Structured Query Language (SQL) database MongoDB is used to store user and temporary data and the Redis cache is used to speed up data processing. Both the server and the user environment can access the database and the cache. As described in
Figure 3, the server controls both the data network simulation (NS-3) and the power grid simulation (Matlab). The diagram also shows the Nominatim service, which is used to retrieve geolocation data that is used in the simulation.
In contrast to the application part, where the power grid and data network were simulated using different software, the virtualization part uses the NS-3 program to display both infrastructures. The whole architecture is shown in
Figure 6. Keeping the application simple, it is not possible to support multiple data file formats. Therefore, the unified JSON file has been designed and could be used across the entire platform. The virtualization part is controlled via CLI. The appliacation must be given the path to a unfied JSON file to launch the platform successfully. The complete application launch options are listed in Listing 3. The settings of the application is identical to the inputs shown in the architecture diagram in
Figure 6.
As shown in
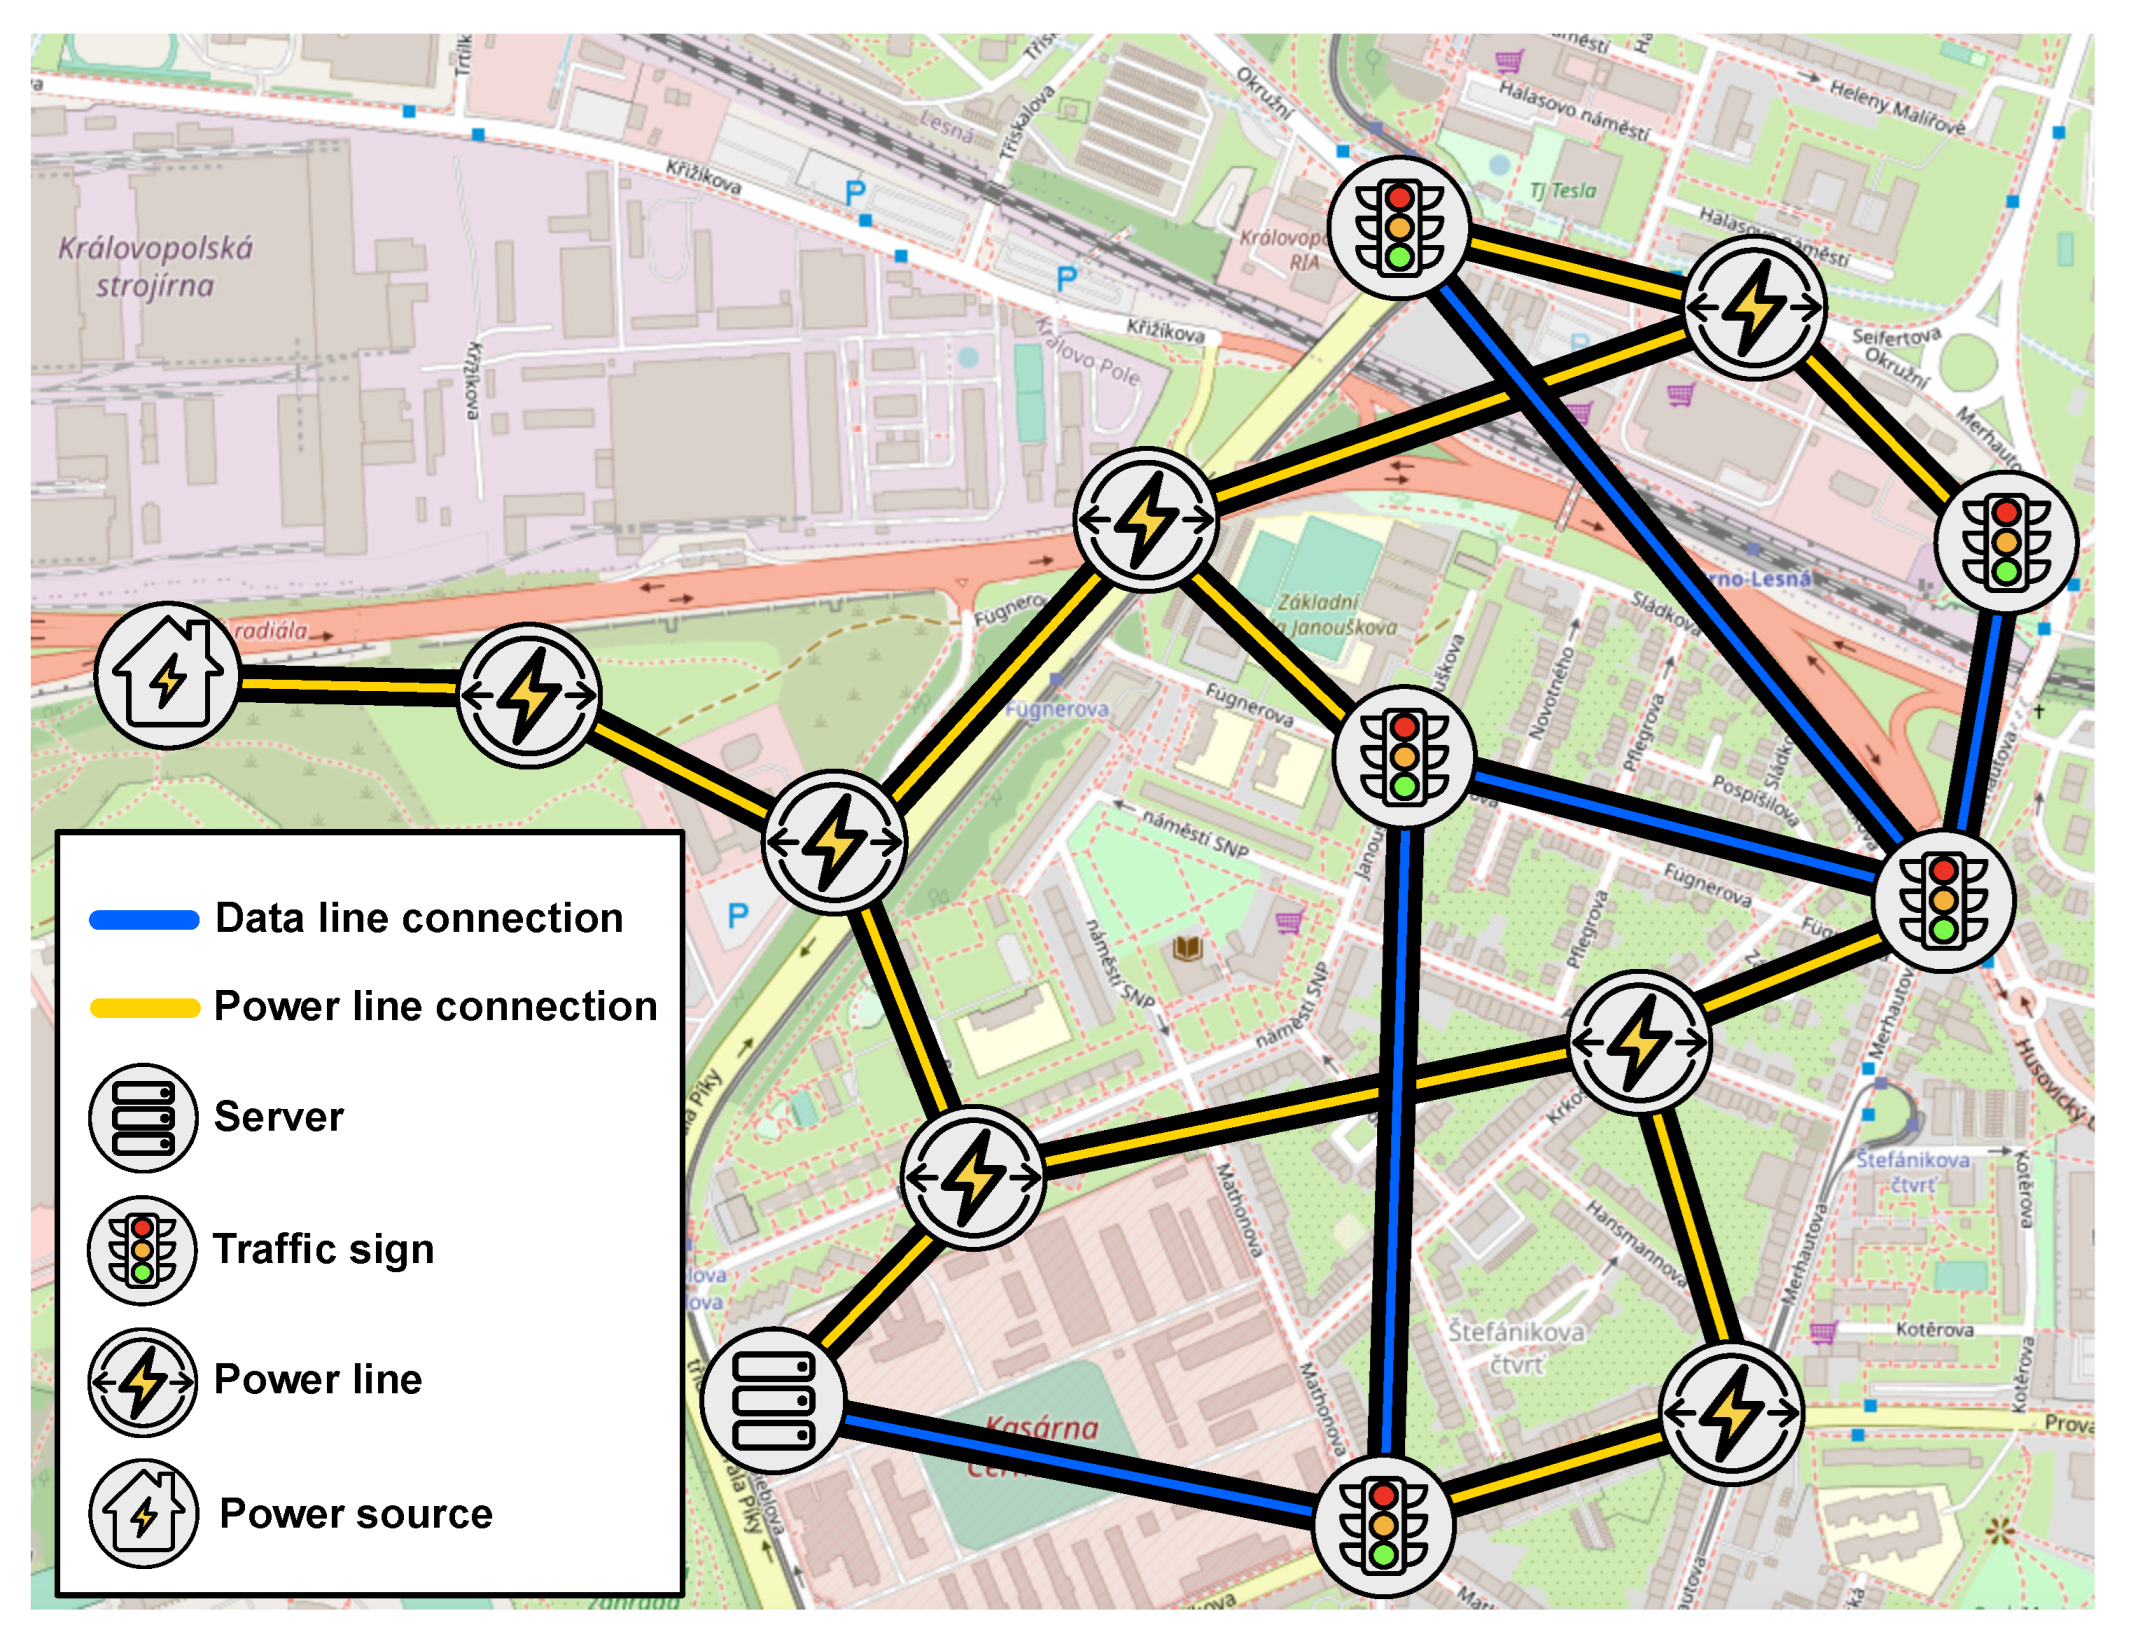
Figure 6, the program accepts three inputs in total. The first input defines the use of a specific Docker image. For the user, it is possible to choose a custom Docker image or for example to choose an updated version. As it was mentioned above, the second input defines the path to a unified JSON file with the topology of both networks. The third input defines the path to the folder where the output file of the simulation program is stored. Then, the path to the folder is passed to Docker, which connects it to a Docker container with NS-3 running. A graphical display of both networks interconnection can be seen in the
Figure 7. The orange lines represent the power line connection. The blue lines represent the data links. In case of failure of one of the power grid elements, the connected devices of the data network might fail too.
| Listing 3. Example of using switches to start the application. |
![Processes 10 02504 i003]() |
Virtualization of Different Simulation Scenarios
In
Section 3.5, there are two types of fault simulations presented. For every of those simulation types, the virtualization part differs slightly. The first method is used in a scenario where the point of failure is determined by the user. The whole simulation is including the display performed without any interaction with the user. First, the power grid is simulated using the Matlab environment. Then, the simulation data are passed to the NS-3 C++ project files. The NS-3 program performs a simulation of the data network, when specific elements of the data network are functionally dependent on the power grid elements. In this scenario the simulation is performed and the results are displayed to the user directly upon termination. The results can not be modified.
In the second simulation scenario described in
Section 3.5, initial user intervention is neither required nor enabled. Simulation of the power grid and data network is made automatically after starting the program. The virtualization part then displays an interactive environment in which it is possible to browse individual infrastructure locations, change the status of switches and display the results continuously. This output can also include a heat map that clearly shows the weakest points of both connected infrastructures.
5. Discussion
Today’s market offers a variety of solutions featuring simulators for power or communication grid analysis. There are also solutions that attempt to perform smart grid analysis. In smart grids, the two infrastructures mentioned above have a major role to perform together and it is therefore important to consider them as such in simulations.
The motivation for the development of a new tool for the analysis of interconnected infrastructures was the interest of DSOs and municipalities in such a simulator, which would provide, in comparison to the existing available solutions, not only the control and analysis of the electricity system, but also data infrastructure and others (water, gas distribution). The simulator should also have an interactive graphical user interface and place emphasis on cybersecurity.
For this purpose, a search for available software solutions was carried out in
Section 2. First, a comparison of existing data grid simulators
Table 1 and then a comparison of power grid simulators
Table 2 was made. A separate subsection was dedicated to simulation tools for smart grids. The comparison already took into account the previously described parameters that the developed simulator should have. From the search of the current state of the art, it is clear that none of the available tools meet the defined requirements and the solution described in this paper is unique and needed. The selected partial open-source software, the methodology used and the principle of operation of the developed simulator are described in detail in
Section 3.
The software is designed to process unified data in the form of a JavaScript Object Notation (JSON) file that contains the network virtualized twin itself. The program in the current version accepts a unified JSON file containing simulated network elements and their links. The unified file also contains additional information that can be used for simulation purposes. The main reason for using virtualization was scalability, simple administration and quick deployment.
In
Figure 8, a graphical interface illustrating power lines and data network connections of the anonymous testing network can be seen. Although the communication part of the infrastructure was added manually, the simulator has the ability to automatically load data based on the topology data described in
Section 3. The developed interactive user interface can be used to display the results of a given simulation and also allows the user to intervene in the simulation. The innovative character of the proposed solution can be briefly described in the following paragraphs:
Ability to analyze interconnected infrastructures with an almost unlimited number of included networks of different types
The simulator has a graphical part that not only displays the final outputs of the simulations, but also allows the user to actively intervene in the simulation process by changing networks parameters during the simulation
Emphasis on cybersecurity—the simulator has been developed based on measures that ensure a secure environment and protection against misuse of the data it handles. At the same time, the simulator itself enables cybersecurity analysis at the level of city infrastructure and large building complexes
Possibility to generate own anonymized urban infrastructure in order to publish simulation results with respect to the sensitivity of real data (currently under development)
Economic analysis and proposal of optimization methods (currently under development)
The last two items in the above list mention parts of the simulator that are currently under further development. The functionality of the point 4 has already been discussed in
Section 3. The economic analysis is discussed in the following subsection. There are many other considered outputs from the developed simulator. As an example, we can mention a heat map—critical points of the power grid and data network marked in a geographic background, which was already mentioned above.
Economic Analysis
One of the possible outputs of the developed simulator is the design of optimization processes leading to the suppression of weak points of the distribution system concerning the power supply of telecommunication equipment—an economic analysis. The optimization environment is currently under development. Based on the simulation results obtained from the NS-3 program, it is possible to detect weak points in the power grid depending on the probability of failure of individual data network elements. Customer interruption costs (CIC) and cost benefit analysis (CBA) will be used to assess the return of potential investment. The design of this part of the simulator is described in more detail in [
49].
After the simulation has been run on a specific network model, the simulator will identify those points in the system where the threat of failure exceeds the preset percentage threshold. The challenge will then be to find a way to evaluate the return of the investment. This factor is crucial for recommending such an investment in infrastructure upgrades. When calculating the return of the investment, it is first necessary to determine the cost (lost profit) of an outage at the point of consumption of the power grid. To quantify these costs, we use the CIC.
The research proves that CICs are much higher for the commercial customer group, on average the cost of one-hour unexpected interruption is seven to ten times higher for commercial customers than for residential customers [
52,
53]. For some customer sites feeding telecommunication networks, the CICs can be expected to be many times higher, depending on their importance. For this reason, uninterruptible power supplies (UPS) are used for important elements of the data infrastructure. For each data point of delivery in the power grid, a separate table will be compiled showing the type of data devices connected, calculated CIC of the point, the data on the backup power supply and, depending on the simulation performed, the probability of a power outage (POP). An example of such a table can be seen in
Table 4. All these data will serve as input data for the CBA that has been chosen to evaluate the economic return of potential investments, either in the power grid (e.g., line modernisation) or in the data network (e.g., new UPS).
Author Contributions
Conceptualization, R.F., M.V. and J.B.; methodology, R.F.; software, J.B.; validation, R.F., J.B. and M.V.; formal analysis, R.F. and D.T.; investigation, R.F.; resources, D.T.; data curation, R.F. and D.T.; writing—original draft preparation, M.V. and J.B.; writing—review and editing, R.F.; visualization, J.B. and M.V.; supervision, R.F.; project administration, P.T. and J.M.; funding acquisition, P.T. and J.M. All authors have read and agreed to the published version of the manuscript.
Funding
This research was funded by the Technology Agency of the Czech Republic grant number TK02030013.
Institutional Review Board Statement
Not applicable.
Informed Consent Statement
Not applicable.
Data Availability Statement
Not applicable.
Acknowledgments
This research work has been carried out in the Centre for Research and Utilization of Renewable Energy (CVVOZE). Authors gratefully acknowledge financial support from the Technology Agency of the Czech Republic.
Conflicts of Interest
The authors declare no conflict of interest.
Abbreviations
The following abbreviations are used in this manuscript:
| NS-3 | Network Simulator 3 |
| CORE | Common Open Research Emulator |
| GPLv2 | General Public License version 2 |
| MOST | Matpower Optimal Scheduling Tool |
| PyPSA | Python for Power System Analysis |
| PSAT | Power Systems Analysis Toolbox |
| HV | High Voltage |
| MV | Medium Voltage |
| LV | Low Voltage |
| XML | Extensible Markup Language |
| LTE | Long Term Evolution |
| API | Application Programming Interface |
| CLI | Command Line Interface |
| GIS | Geographic Information System |
| JRC | Joint Research Centre |
| ID | Unique Identifier |
| DSO | Distribution System Operator |
| JSON | JavaScript Object Notation |
| CIC | Customer Interruption Costs |
| CBA | Cost-Benefit Analysis |
| UPS | Uninterruptible Power supply |
| POP | Probability of Power Outage |
| CVVOZE | Centre for Research and Utilization of Renewable Energy |
| REST | Representational State Transfer |
| HTTP | Hyper Text Transport Protocol |
| SQL | Structured Query Language |
References
- Alcaraz, C.; Zeadally, S. Critical infrastructure protection: Requirements and challenges for the 21st century. Int. J. Crit. Infrastruct. Prot. 2015, 8, 53–66. [Google Scholar] [CrossRef]
- Yusta, J.M.; Correa, G.J.; Lacal-Arántegui, R. Methodologies and applications for critical infrastructure protection: State-of-the-art. Energy Policy 2011, 39, 6100–6119. [Google Scholar] [CrossRef]
- Colak, I.; Bayindir, R.; Sagiroglu, S. The Effects of the Smart Grid System on the National Grids. In Proceedings of the 2020 8th International Conference on Smart Grid (icSmartGrid), Paris, France, 17–19 June 2020; pp. 122–126. [Google Scholar] [CrossRef]
- Nutaro, J.; Kuruganti, P.T.; Miller, L.; Mullen, S.; Shankar, M. Integrated hybrid-simulation of electric power and communications systems. In Proceedings of the 2007 IEEE Power Engineering Society General Meeting, Tampa, FL, USA, 24–28 June 2007; pp. 1–8. [Google Scholar] [CrossRef]
- Karanjai, R.; Kasichainula, K.; Diallo, N.; Kaleem, M.; Xu, L.; Chen, L.; Shi, W. Decentralized Application Infrastructures as Smart Contract Codes. In Proceedings of the 2022 IEEE International Conference on Blockchain and Cryptocurrency (ICBC), Shanghai, China, 2–5 May 2022; pp. 1–9. [Google Scholar]
- Hégr, T.; Boháč, L.; Kocur, Z.; Vozňák, M.; Chlumskỳ, P. Methodology of the direct measurement of the switching latency. Prz. Elektrotech. 2013, 89, 59–63. [Google Scholar]
- Hegr, T.; Voznak, M.; Kozak, M.; Bohac, L. Measurement of switching latency in high data rate ethernet networks. Elektron. Elektrotech. 2015, 21, 73–78. [Google Scholar] [CrossRef]
- Lin, H.; Veda, S.; Shukla, S.; Thorp, J.; Mili, L. Power system and communication network co-simulation for smart grid applications. In Proceedings of the ISGT 2011, Anaheim, CA, USA, 17–19 January 2011; pp. 1–6. [Google Scholar] [CrossRef]
- Kajati, E.; Papcun, P.; Liu, C.; Zhong, R.Y.; Koziorek, J.; Zolotova, I. Cloud based cyber-physical systems: Network evaluation study. Adv. Eng. Inform. 2019, 42, 100988. [Google Scholar] [CrossRef]
- Benedikt, J.; Vrtal, M.; Fujdiak, R.; Topolánek, D.; Blažek, P.; Mišurec, J.; Toman, P. Virtualization platform for urban infrastructure. In Proceedings of the 2022 22nd International Scientific Conference on Electric Power Engineering (EPE), Kouty nad Desnou, Czech Republic, 8–10 June 2022; pp. 1–5. [Google Scholar]
- Voznak, M.; Slachta, J.; Rezac, F.; Rozhon, J. Exploratory Analysis of Virtualization Tools in Delay-Sensitive Environment. Commun.-Sci. Lett. Univ. Zilina 2013, 15, 150–154. [Google Scholar] [CrossRef]
- Vozňák, M.; Šlachta, J.; Rozhon, J. Performance analysis of virtualized real-time applications. Int. J. Math. Model. Methods Appl. Sci. 2012, 6, 305–313. [Google Scholar]
- Mihal, P.; Schvarcbacher, M.; Rossi, B.; Pitner, T. Smart grids co-simulations: Survey & research directions. Sustain. Comput. Inform. Syst. 2022, 35, 100726. [Google Scholar]
- Mansouri, Y.; Babar, M.A. A review of edge computing: Features and resource virtualization. J. Parallel Distrib. Comput. 2021, 150, 155–183. [Google Scholar] [CrossRef]
- Jaff, A. Software Defined Networking Automation Using OpenDaylight and Network Virtualization for security and scalability: A network enterprise case. ITM Web Conf. 2022, 42, 150. [Google Scholar] [CrossRef]
- He, F.; Sato, T.; Chatterjee, B.C.; Kurimoto, T.; Shigeo, U.; Oki, E. Robust Optimization Model for Primary and Backup Resource Allocation in Cloud Providers. IEEE Trans. Cloud Comput. 2021. [Google Scholar] [CrossRef]
- Alwakeel, A.M.; Alnaim, A.K.; Fernandez, E.B. A Survey of Network Function Virtualization Security. In Proceedings of the SoutheastCon 2018, St. Petersburg, FL, USA, 19–22 April 2018; pp. 1–8. [Google Scholar] [CrossRef]
- Compastié, M.; Badonnel, R.; Festor, O.; He, R. From virtualization security issues to cloud protection opportunities: An in-depth analysis of system virtualization models. Comput. Secur. 2020, 97, 101905. [Google Scholar] [CrossRef]
- Qu, Z.; Shi, H.; Wang, Y.; Yin, G.; Abu-Siada, A. Active and Passive Defense Strategies of Cyber-Physical Power System against Cyber Attacks Considering Node Vulnerability. Processes 2022, 10, 1351. [Google Scholar] [CrossRef]
- NRE Labs. 2018. Available online: https://docs.nrelabs.io/antidote/antidote-architecture (accessed on 3 August 2022).
- Veselý, P.; Karovič, V.; Karovičml, V. Tools for Modeling Exemplary Network Infrastructures. Procedia Comput. Sci. 2016, 98, 174–181. [Google Scholar] [CrossRef] [Green Version]
- Scazzariello, M.; Ariemma, L.; Battista, G.D.; Patrignani, M. Megalos: A scalable architecture for the virtualization of large network scenarios. Future Internet 2021, 13, 227. [Google Scholar] [CrossRef]
- Ahrenholz, J.; Danilov, C.; Henderson, T.; Kim, J. CORE: A real-time network emulator. In Proceedings of the MILCOM 2008—2008 IEEE Military Communications Conference, San Diego, CA, USA, 16–19 November 2008; pp. 1–7. [Google Scholar]
- EVE-NG Documentation. 2021. Available online: https://www.eve-ng.net/index.php/documentation/ (accessed on 22 March 2022).
- Bonofiglio, G.; Iovinella, V.; Lospoto, G.; Di Battista, G. Kathará: A container-based framework for implementing network function virtualization and software defined networks. In Proceedings of the NOMS 2018—2018 IEEE/IFIP Network Operations and Management Symposium, Taipei, Taiwan, 23–27 April 2018; pp. 1–9. [Google Scholar] [CrossRef]
- Riley, G.F.; Henderson, T.R. The ns-3 network simulator. In Modeling and Tools for Network Simulation; Springer: Berlin/Heidelberg, Germany, 2010; pp. 15–34. [Google Scholar]
- Python 2.7.18. The Last Release of Python 2. 2020. Available online: https://pythoninsider.blogspot.com/2020/04/python-2718-last-release-of-python-2.html (accessed on 22 February 2022).
- Zimmerman, R.D.; Murillo-Sánchez, C.E. Matpower 6.0 User’s Manual; Power Systems Engineering Research Center, Arizona State University: Tempe, AZ, USA, 2016; Volume 9. [Google Scholar]
- Lincoln, R. PYPOWER: Port of MATPOWER in Python. Available online: https://github.com/rwl/PYPOWER (accessed on 12 August 2022).
- Hörsch, J.; Hofmann, F.; Schlachtberger, D.; Brown, T. PyPSA-Eur: An open optimisation model of the European transmission system. Energy Strategy Rev. 2018, 22, 207–215. [Google Scholar] [CrossRef] [Green Version]
- Montenegro, D.; Dugan, R. OpenDSS and OpenDSS-PM open source libraries for NI LabVIEW. In Proceedings of the 2017 IEEE Workshop on Power Electronics and Power Quality Applications (PEPQA), Bogota, Colombia, 31 May–2 June 2017; pp. 1–5. [Google Scholar]
- Milano, F.; Vanfretti, L.; Morataya, J.C. An open source power system virtual laboratory: The PSAT case and experience. IEEE Trans. Educ. 2008, 51, 17–23. [Google Scholar] [CrossRef] [Green Version]
- Thurner, L.; Scheidler, A.; Schäfer, F.; Menke, J.H.; Dollichon, J.; Meier, F.; Meinecke, S.; Braun, M. pandapower—An open-source python tool for convenient modeling, analysis, and optimization of electric power systems. IEEE Trans. Power Syst. 2018, 33, 6510–6521. [Google Scholar] [CrossRef]
- Albogamy, F.R.; Ashfaq, Y.; Hafeez, G.; Murawwat, S.; Khan, S.; Ali, F.; Aslam Khan, F.; Rehman, K. Optimal Demand-Side Management Using Flat Pricing Scheme in Smart Grid. Processes 2022, 10, 1214. [Google Scholar] [CrossRef]
- Foroozandeh, Z.; Ramos, S.; Soares, J.; Vale, Z. Energy management in smart building by a multi-objective optimization model and pascoletti-serafini scalarization approach. Processes 2021, 9, 257. [Google Scholar] [CrossRef]
- Chassin, D.P.; Schneider, K.; Gerkensmeyer, C. GridLAB-D: An open-source power systems modeling and simulation environment. In Proceedings of the 2008 IEEE/PES Transmission and Distribution Conference and Exposition, Chicago, IL, USA, 21–24 April 2008; pp. 1–5. [Google Scholar]
- Palmintier, B.; Krishnamurthy, D.; Top, P.; Smith, S.; Daily, J.; Fuller, J. Design of the HELICS high-performance transmission-distribution-communication-market co-simulation framework. In Proceedings of the 2017 Workshop on Modeling and Simulation of Cyber-Physical Energy Systems (MSCPES), Pittsburgh, PA, USA, 21 April 2017; pp. 1–6. [Google Scholar]
- Nouidui, T.S.; Coignard, J.; Gehbauer, C.; Wetter, M.; Joo, J.Y.; Vrettos, E. CyDER–an FMI-based co-simulation platform for distributed energy resources. J. Build. Perform. Simul. 2019, 12, 566–579. [Google Scholar] [CrossRef] [Green Version]
- Li, W.; Monti, A.; Luo, M.; Dougal, R.A. VPNET: A co-simulation framework for analyzing communication channel effects on power systems. In Proceedings of the 2011 IEEE Electric Ship Technologies Symposium, Alexandria, VA, USA, 10–13 April 2011; pp. 143–149. [Google Scholar]
- Gómez, J.É.; Cabrera, J.J.H.; Tavella, J.P.; Vialle, S.; Kremers, E.; Frayssinet, L. Daccosim NG: Co-simulation made simpler and faster. In Proceedings of the 13th International Modelica Conference 2019, Regensburg, Germany, 4–6 March 2019. [Google Scholar]
- Georg, H.; Müller, S.C.; Dorsch, N.; Rehtanz, C.; Wietfeld, C. INSPIRE: Integrated co-simulation of power and ICT systems for real-time evaluation. In Proceedings of the 2013 IEEE International Conference on Smart Grid Communications (SmartGridComm), Vancouver, BC, Canada, 21–24 October 2013; pp. 576–581. [Google Scholar]
- Camus, B.; Paris, T.; Vaubourg, J.; Presse, Y.; Bourjot, C.; Ciarletta, L.; Chevrier, V. MECSYCO: A Multi-agent DEVS Wrapping Platform for the Co-simulation of Complex Systems. Ph.D. Thesis, LORIA UMR 7503, Université de Lorraine, CNRS, Vandoeuvre-lès-Nancy, Inria, France, 2016. [Google Scholar]
- Ciraci, S.; Daily, J.; Fuller, J.; Fisher, A.; Marinovici, L.; Agarwal, K. FNCS: A framework for power system and communication networks co-simulation. In Proceedings of the Symposium on Theory of Modeling &Simulation-DEVS Integrative, Tampa, FL, USA, 13–16 April 2014; pp. 1–8. [Google Scholar]
- Mosaif, A.; Rakrak, S. Visual node module. Int. J. Commun. Syst. 2020, 33, e4451. [Google Scholar] [CrossRef]
- NS-3 PyViz. 2015. Available online: https://www.nsnam.org/wiki/PyViz (accessed on 22 February 2022).
- Anderson, C. Docker [Software engineering]. IEEE Softw. 2015, 32, 102–c3. [Google Scholar] [CrossRef]
- Boettiger, C. An introduction to Docker for reproducible research. Oper. Syst. Rev. (ACM) 2015, 49, 71–79. [Google Scholar] [CrossRef] [Green Version]
- Mateo, C.; Gomez, T.; Prettico, G.; Fulli, G. European representative electricity distribution networks. Int. J. Electr. Power Energy Syst. 2018, 99, 273–280. [Google Scholar] [CrossRef]
- Vrtal, M.; Benedikt, J.; Topolanek, D.; Fujdiak, R.; Blazek, P.; Toman, P.; Mišurec, J. Power grid and data network simulator. In Proceedings of the 2022 22nd International Scientific Conference on Electric Power Engineering (EPE), Kouty nad Desnou, Czech Republic, 8–10 June 2022; pp. 1–4. [Google Scholar]
- Da Silva Mendonça, R.; de Oliveira Lins, S.; de Bessa, I.V.; de Carvalho Ayres, F.A., Jr.; de Medeiros, R.L.P.; de Lucena, V.F., Jr. Digital Twin Applications: A Survey of Recent Advances and Challenges. Processes 2022, 10, 744. [Google Scholar] [CrossRef]
- Events and Simulator. 2022. Available online: https://www.nsnam.org/docs/manual/html/events.html (accessed on 13 March 2022).
- Siirto, O. Distribution Automation and Self-Healing Urban Medium Voltage Networks. Ph.D. Thesis, School of Electrical Engineering, Aalto University, Espoo, Finland, 2016. [Google Scholar]
- Siirto, O.; Hyvärinen, M.; Loukkalahti, M.; Hämäläinen, A.; Lehtonen, M. Improving reliability in an urban network. Electr. Power Syst. Res. 2015, 120, 47–55. [Google Scholar] [CrossRef]
| Publisher’s Note: MDPI stays neutral with regard to jurisdictional claims in published maps and institutional affiliations. |
© 2022 by the authors. Licensee MDPI, Basel, Switzerland. This article is an open access article distributed under the terms and conditions of the Creative Commons Attribution (CC BY) license (https://creativecommons.org/licenses/by/4.0/).


