Article

Neural Network Model for Permeability Prediction from Reservoir Well Logs

by
Reda Abdel Azim
1,* and
Abdulrahman Aljehani
2
1
Petroleum Engineering Department, American University of Kurdistan, Sumel 42003, Iraq
2
Faculty of Earth Sciencs, King Abdulaziz University, Jeddah 21589, Saudi Arabia
*
Author to whom correspondence should be addressed.
Processes 2022, 10(12), 2587; https://doi.org/10.3390/pr10122587
Submission received: 10 November 2022 / Revised: 1 December 2022 / Accepted: 2 December 2022 / Published: 4 December 2022
(This article belongs to the Special Issue Oil and Gas Well Engineering Measurement and Control)

Abstract

:
The estimation of the formation permeability is considered a vital process in assessing reservoir deliverability. The prediction of such a rock property with the use of the minimum number of inputs is mandatory. In general, porosity and permeability are independent rock petrophysical properties. Despite these observations, theoretical relationships have been proposed, such as that by the Kozeny–Carmen theory. This theory, however, treats a highly complex porous medium in a very simple manner. Hence, this study proposes a comprehensive ANN model based on the back propagation learning algorithm using the FORTRAN language to predict the formation permeability from available well logs. The proposed ANN model uses a weight visualization curve technique to optimize the number of hidden neurons and layers. Approximately 500 core data points were collected to generate the model. These data, including gamma ray, sonic travel time, and bulk density, were collected from numerous wells drilled in the Western Desert and Gulf areas of Egypt. The results show that in order to predict the permeability accurately, the data set must be divided into 60% for training, 20% for testing, and 20% for validation with 25 neurons. The results yielded a correlation coefficient (R2) of 98% for the training and 96.5% for the testing, with an average absolute percent relative error (AAPRE) of 2.4%. To validate the ANN model, two published correlations (i.e., the dual water and Timur’s models) for calculating permeability were used to achieve the target. In addition, the results show that the ANN model had the lowest mean square error (MSE) of 0.035 and AAPRE of 0.024, while the dual water model yielded the highest MSE of 0.84 and APPRE of 0.645 compared to the core data. These results indicate that the proposed ANN model is robust and has strong capability of predicting the rock permeability using the minimum number of wireline log data.

1. Introduction

The reservoir characterization process plays an important role in assessing the economic success of reservoir development. Reservoir characterization is a complex process since most reservoirs are heterogeneous due to the depositional environment and nature of rock. Porosity and permeability are key parameters to assess volume and flow behavior in reservoirs. Despite their importance, permeability (in particular) is difficult to estimate from well logs because of its dynamic nature, which led researchers to propose several methods to estimate permeability. Chehrazi et al. (2012) [1] proposed a comprehensive study for permeability prediction using theoretical and soft computing models. In the theoretical model, porosity and initial water saturation are used as inputs. The main drawback of the presented model is the difficulty in obtaining the permeability from laboratory-measured core data.
Well log interpretations are widely used to estimate porosity and permeability values at various depths due to its minimum cost compared to the coring process. In addition, well log data provide a solution to the lack of continuity information from core samples [2,3].
Lucia et al. (2013) [4] showed that petrophysical heterogeneity is commonly found in carbonate reservoirs, and it is demonstrated by the wide variation in porosity–permeability cross plots of core analysis data. Research has shown that basic rock fabrics control petrophysical heterogeneity; within rock-fabric facies, porosity and permeability have little spatial correlation and are widely variable at the scale of inches and feet. Petrophysical rock typing (PRT) and permeability prediction are of great significance for various disciplines of the oil and gas industry. One of the most important usages of rock typing is predicting unknown reservoir properties, specifically permeability in un-cored intervals. Coring from several wells is often unavoidable and an essential task to obtain basic data on the field. However, coring in all wells of large-scale fields or from all zones of interest in a single well poses a substantial financial burden. Permeability can also be calculated using empirical relationship between core-measured porosity and permeability [5,6].
Hasanusi et al. (2012) [7] presented an effective technique for carbonate reservoir characterization using hybrid seismic rock physics, statistics, and an artificial neural network. This methodology integrates various data sets to produce the coherence correlation among input data and their target. The data set consisted of core (i.e., lithology, lithofacies, fracture intensity, fracture width, and porosity), well log (gamma ray, density, water saturation, porosities, sensitivities, etc.), multi-attribute seismic (either pre-stack or post-stack) of different vintages of 2D seismic lines, and seismic rock physics. The whole array of input data was trained together using natural workflow which is also combined with statistic and artificial neural network.
The available numerical equations for permeability estimation are unreliable and strongly dependent on core analyses, which are costly and time consuming. In addition, wire-line-collected information has critical issues, including missing data during the logging process due to excessive temperature, pressure, and operator errors that limit the operation [8,9]. Therefore, the need to seek alternative ways to predict porosity and permeability is highly recommended. This study presents a novel technique that integrates core and well log various data to generate a suitable artificial neural network model that can overcome the abovementioned concerns. The artificial neural network (ANN) technique is one of the latest techniques available to the petroleum industry for porosity and permeability prediction [10,11,12,13]. The presented literature review shows that numerous models have been developed to estimate rock permeability. These models suffer from numerous shortcomings, including a poor ability to precisely predict the permeability in Egyptian oil fields. Therefore, the purpose of this study is to present a new model by using an ANN with the back propagation algorithm using FORTRAN language to propose a new correlation for accurately estimating rock permeability of different oil fields located in Egypt and, consequently, predicting precisely other reservoir properties in the case of missing core and wireline data.
In order to fulfill this purpose, more than 500 core and well logs points were collected from Egyptian oil fields. The data are used to develop the ANN model in the direction of predicting the formation permeability. The proposed novel correlation incorporates parameters including gamma ray, porosity, and travel sonic time. In addition, a new convergence structure is presented to accelerate the performance of the proposed ANN model. Furthermore, in this study, the weight visualization curves (WV-curves) technique was used in optimizing the network architecture.

2. ANN Application for Porosity–Permeability Prediction

Malki et al. (1996) [14] used a self-organizing algorithm to classify well logs for lithology prediction to predict porosity and grain density. Smith et al. (1999) [15] proposed a neural network algorithm for porosity, permeability, and grain density predictions. The authors used gamma ray, neutron porosity, and sonic travel time as inputs. The predicted petrophysical properties were compared to the collected core data, and the errors were evaluated based on certain tolerance. Osborne (1992) [16] used a back propagation neural net to predict permeability by using porosity and reservoir flow units as input data. The input data was divided using approximately 10% for training and 10% for testing process. The model robustness is not valid as the model is developed from the same training data. Osborne concluded that the predicted permeability from neural net model provided superior values to those from regression model. Zhou and Wu (1993) [17] presented a comprehensive study for porosity prediction from well logs using regression and neural nets techniques. The study concluded that the neural nets produced the best results. Jian et al. (1995) [18] presented a case study for porosity–permeability prediction by comparing genetic and nongenetic approaches. Other studies used various machine learning techniques to predict porosity and permeability values at different depths [19,20,21,22,23,24].
Khayer et al. (2022) [25] proposed an efficient method for image segmentation using logistic function method for seismic attributes estimation. The ANN model was used in identifying a complex relationship between rock properties and wireline information. Rezaee et al. (2012), Wang et al. (2013), and Anifowose et al. (2013) [26,27,28] proposed an ANN model based on the back propagation algorithm for porosity prediction using genetic and nongenetic approaches. The models used several inputs in designing a suitable ANN model for their predictions.
It is worth noting that a multiple regression technique (MLR) was performed by Wendt et al. [29] to predict permeability from well logs. Wendt et al. (1986) [29] concluded that using the MLR technique as a predictive model resulted in a poor data distribution and a narrower than the original data set. Rogers et al. (1995) [30] mentioned the same conclusion regarding permeability prediction from the regression technique compared to neural networks. In addition, Rogers et al. (1995) [30] showed that neural networks do not direct the prediction to the mean and the extreme values outside the range of the training data. In addition, the main advantage of neural network techniques over multiple linear regression (MLR) is that they reproduce a minor nonlinearity embedded in the common log to porosity and permeability transforms.
Another algorithm used in the prediction of various well logs is the convolutional neural network (CNN) [31]. The main disadvantage of a CNN is the large number of training data needed for the CNN to be effective. In addition, CNNs tend to be a much slower than ANN models. Overfitting, exploding gradient, and class imbalance are the major challenges while training the model using CNN technique. Zhang et al. (2018) [32] proposed a cascaded long short-term memory (C-LSTM) based on the LSTM technique. The study by Zhang et al. (2018) [32] concluded that, although LSTM-based models can generate well logs, the technique has a poor prediction accuracy, as the LSTM technique does not perform well on small training data sets. Chen et al. (2019) [33] proposed an ensemble neural network (ENN) to address this issue, which offers advantages in small data problems, but it is not suitable for handling sequential data.
The main drawback of the backpropagation algorithm used in this study is the convergence or the local minima problem and a slow performance [34,35]. Nevertheless, this study proposed a new convergence technique to speed up the performance of the network by adding an acceleration factor (see Section 3.1).

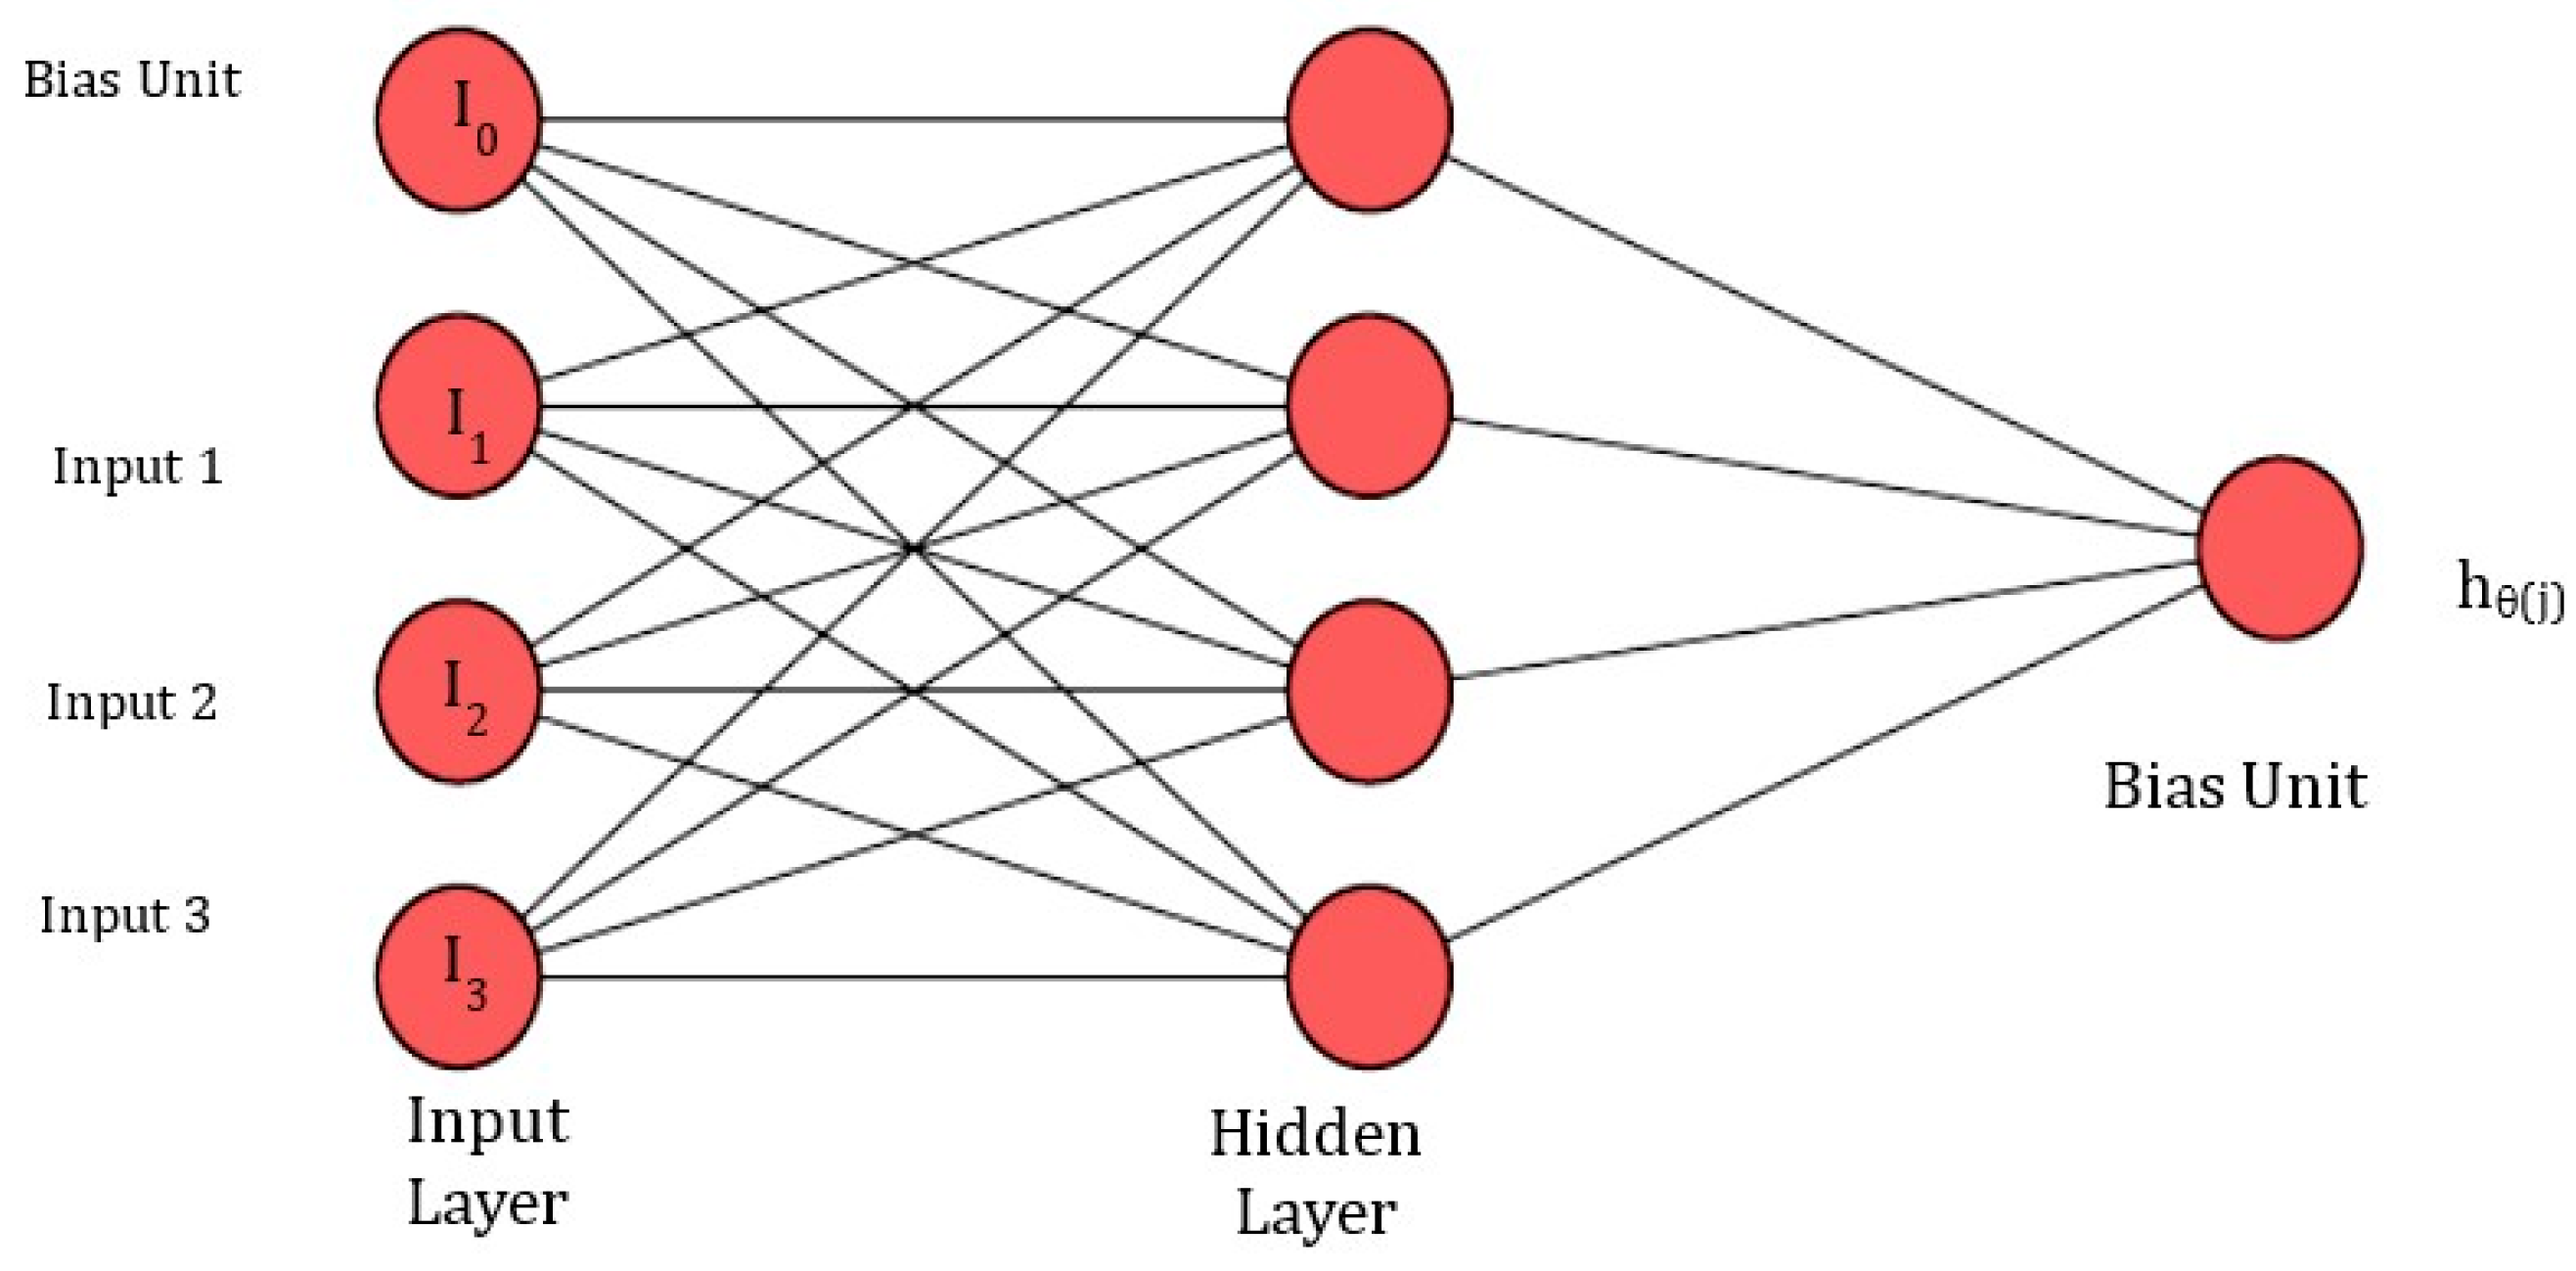
3. Artificial Neural Network

One machine learning algorithm is the artificial neural network (ANN), which mimics the human central nervous system [36]. An ANN consists of organized layers containing single units and artificial neurons that are connected through weight functions [37,38]. There are different types of neural networks, and they can be differentiated depending on the neurons transfer functions, learning rules, and connected formula.
A complex computational framework is performed in ANNs to predict the output responses. Furthermore, an ANN uses massive parallel connections between a nonlinear parameterized and bounded function, which are referred to as neurons [39,40]. The neurons are designed in a way that defines the network architecture using multilayer perception (MLP), where neurons are assembled in continuous layers. Using MLP, neurons in each layer share the same inputs without intersecting with each other.
Although the number of hidden layers and neurons in each layer is arbitrary [41], an increasing number of neurons can cause overfitting. On the contrary, decreasing number of neurons may result in a poor network performance. Perhaps the main advantage of using an ANN over other methods is that it can process a larger number of data sets [42]. Figure 1 shows a typical ANN structure consisting of an input layer, hidden layer, bias unit, and output layer.
The output function, ℎ(𝑥), in Figure 1 is calculated as:
h θ ( x ) =   a 1 3 = g ( θ 10 ( 2 ) a 0 ( 2 ) + θ 11 ( 2 ) a 1 ( 2 ) + θ 12 ( 2 ) a 2 ( 2 ) + θ 13 ( 2 ) a 3 ( 2 ) )
where (g) is the sigmoid function and can be calculated as:
g ( z ) = 1 ( 1 + e z )  
The activation function for each neuron is vectorized in a matrix of Z as:
{ Z 1 ( 2 ) = θ 10 ( 1 ) I 0 + θ 11 ( 1 ) I 1 + θ 12 ( 1 ) I 2 + θ 13 ( 1 ) I 3   Z 2 ( 2 ) = θ 20 ( 1 ) I 0 + θ 21 ( 1 ) I 1 + θ 22 ( 1 ) I 2 + θ 23 ( 1 ) I 3 Z 3 ( 2 ) = θ 30 ( 1 ) I 0 + θ 31 ( 1 ) I 1 + θ 32 ( 1 ) I 2 + θ 33 ( 1 ) I 3 }
The size of the neural network (number of hidden layers and number of neurons) determines the degree of complexity in the ANN. However, Soroush et al. (2015) [43] argue that an ANN should be designed with a sufficient level of complexity to avoid data being over fitted.
The neuron network is trained using an algorithm to minimize the error between the network output values and the target values. This was achieved by an iterative process to find the optimum values of the weights and biases. There are many algorithms presented in literature to train the network, and the most well-known training algorithm is the Levenberg–Marquardt (LM).

3.1. Back Propagation Algorithm

This study used a back propagation algorithm (BP) for the developed ANN model and the gradient of the error function. The term back propagation is used to describe the multilayer perception of the ANN architecture [44]. The error function of a specific input pattern set can be defined as:
M S E = 1 n 1 1 n 2 ( x p y p ) n 1 . n 2
where MSE is the mean square error, n1 and n2 are number of training outputs and neurons, respectively; xp and yp are the target and estimated outputs, respectively.
The backpropagation algorithm has numerous limitations, including a slow convergence, inability to handle multiple objectives, and a high probability of being trapped in the local minima during a training process [45]. Therefore, this study presents a new convergence technique to speed up the network by adding an acceleration factor, as follows:
w ( t + 1 ) = w ( t ) + β [ Δ w ( t ) ] + α [ w ( t 1 ) ]
where α is the energy constant; w is the weight; t is the increment by 1 for each epoch; and β is the learning constant. This constant is used to effectively increase step size to reduce abrupt gradient changes. The learning and momentum constants are set in a range of 0 to 1.

4. Methodology

4.1. Collected Data Analysis

Approximately 500 core data points were used and collected from various fields in Egypt to design and develop the ANN model. The data contained three inputs, including sonic travel time (DT), gamma ray (GR), and bulk density (RHOB). The input parameters are used in the training process, while the output is permeability. The data set is normalized in a range of 0 to 1, and the statistical analysis for the collected data is presented in Table 1.

4.2. Analyzing the Collected Data

Distribution of the Inputs

The data set was divided into 60% for training and 20% for testing. The BP algorithm was used to minimize the resulting error between the actual and target outputs with the log sigmoid function. The BP learning algorithm provides an exceptional result with an R2 of 0.9806 and MSE of 0.024 compared to other algorithms, including a gradient descent (GD) and a stochastic gradient descent (SGD), which produced an MSE of 0.25 and 0.39, respectively. Stochastic gradient descent (SGD) introduces the momentum for the weight update technique. Figure 2 presents a comprehensive flow chart for the ANN model used in this study. The ANN model parameters including several hidden layers; the neurons and training/testing ratio were optimized to increase the robustness of the developed model. It can be seen from Figure 2 that during the network training process, the overall error was reduced during the training process using the updated connection weight. This weight updating process was performed two ways: epoch updating and stochastic updating. In the epoch updating, all weight changes were added for the input patterns before completing the updating process. The main advantage of the epoch updating process is ensuring the stability and reliability of the learning algorithm. In addition, no problems were encountered during the network convergence. Table 2 summarizes the optimized parameters used in this study.
Further, an analysis process was performed to assess the dependency of the outputs (i.e., permeability and porosity) to the inputs of sonic time (DT), bulk density (RHOB), and gamma ray (GR) using a correlation coefficient (CC). Figure 3 shows that the permeability and porosity values were intensely dependent on the DT, GR, and RHOB with CC of 0.262, −0.385, and −0.319 for porosity and CC of 0.806, −0.316, and −0.133 for permeability, respectively. An average correlation coefficient (avr-CC) was calculated using the absolute values of CC for DT, GR, and RHOB. Figure 3 also shows that permeability had a higher avr-CC with the input parameter of 0.4.

4.3. Optimizing the ANN Model Parameters

One of the main challenges during the learning of a neural net is to find the optimum network parameters, including the choice of input variables, initial weights, and the number of hidden layers. Choosing the number of inputs is a straightforward process, while optimizing the number of hidden layers requires the use of nonlinear inputs to avoid using more than one hidden layer in some cases. The size of the hidden layer and the training epochs require the training of the network to obtain the maximum performance of the unseen data. Therefore, in this study, the weight visualization curve technique was used to select the number of the input and hidden neurons. The weight values were used to calculate the average contribution of a neuron in a layer to a neuron in the next layer [46].
P i j = | W i j | | W i j | · 100 %
where Pij is the average contribution of neuron i in a layer to neuron j in the next layer; W is the weight between connections.
The weight visualization curves (WV-curves) technique was used to select a proper input patterns for the training process to save computational time. The use of the weight visualization curves technique has not been discussed before; therefore, in this study, the performance of the WV technique was modified to optimize the network architecture parameters, including the selection of the number of input and hidden neurons. In this study, the WV-technique uses the nonlinear inputs to choose the optimum parakeets based on the learning behavior of different network configurations.
Using the equation below to measure the average contribution of an input variable to the hidden layer as:
A = j = 1 n 2 | W i j | k = 0 n 1 j = 1 n 2 | W i j |
where A is the average contribution of the input variable i; n1 and n2 are the number of neurons in the input layer and the hidden layer, respectively.
In Figure 4, the WV-curves show that the weights of RHOB and RHOB2 (RHOB × RHOB) and DT and DT2 (DT × DT) to the hidden neurons had almost the same behavior. This conclusion led to using one curve; RHOB and RHOB2 (similarly DT and DT2) can be omitted. Next, it was noted that there are five hidden neurons also contributed closely to the same amount to all the output neurons. Therefore, 5 neurons could be removed from the hidden layer, and a 3-25-1 configuration (i.e., RHOB, DT, and GR) was handled in the network architecture.
The data set from the various wells located in Egypt was collected. The data set consist of 500 patterns of core and well logs. The cross plot of the sonic travel time (DT) and bulk density (RHOB) is displayed in Figure 5. It can be seen from this figure (Figure 5) that there was an inverse relationship between the two variables. The data including inputs of sonic time (DT), bulk density (RHOB), and gamma ray (GR), while the output is permeability.
In this study, numerous trials were performed to optimize the network parameters. The first trial used only two independent inputs, RHOB and DT. The results show that 5000 epochs with four hidden layers resulted in an R2 of 92%. In the second trial, three inputs namely DT, RHOB, and GR were used, and the results show that 1500 epochs with 25 hidden neurons were used to obtain the highest network performance with an R2 of 98% and better convergence during the training. Figure 6 shows how the network was optimized using various trials. Each trial was repeated 10 times using different initial random weights.
Therefore, trial number 2 was used as the final configuration, as it exhibited the least number of epochs and the highest R2 value. Table 3 shows the average contribution of each input to the network. The results show that sonic time (DT), bulk density (RHOB), and gamma ray (GR) were equally important to the network since all variables contributed the same amount.

5. Results and Discussion

Using the optimized parameters, including 25 neurons and one hidden layer in the training and testing process, the data set was divided as 60% for training, 20% testing, and 20% for validation. Figure 7a shows the relationship between gamma ray (GR) and neutron porosity, while Figure 7b shows the Poro-Perm relationship for the collected data. Figure 8a,b show a cross plot of the predicted permeability versus the core permeability for the training and testing processes. The average absolute percent relative error (AAPRE) for the training was 98%, while the testing AAPRE was 96.5%. These results show the reliability of the proposed ANN model. In addition, Figure 9 shows a comparison between core permeability and permeability values extracted from the ANN model based on the inputs. It can be seen from Figure 8a,b that a good matching was achieved with a minimum square error (MSE) of 0.024.
Using the results of the training and testing processes, a mathematical correlation was created to show the relationship between the permeability and the sonic time (DT), bulk density (RHOB), and gamma ray (GR) to be used in the forecasting of the permeability in the Western Desert and Gulf wells. The weights and biases for the generated equation are provided in Table 4.
The novel correlation generated using the ANN for the permeability estimation is given by:
k n = [ i = 1 N w 2 i tan ( s i g ) ( j = 1 J w l i , j x j + b i j ) ] + b 2
k n = [ i = 1 N w 2 i ( 1 1 + e x p ( ( G R . w 1 j , 1 + D T . w 1 j , 2 + R H O B . w 1 j , 3 ) + b 1 ) ) ] + b 2
where kn is the normalized permeability; (w2, i) is the vector weight between the hidden layer and output layer; (w1, j) is the vector weight connect the input and the hidden layer; j is the neuron number; b1 is the biases vector for the input layer; and b2 is for the output layer, (sig) is the sigmoid function, gamma ray (GR), sonic travel time (DT), and bulk density (RHOB).
The extracted k equation can be attained by de-normalizing kn as follows:
k = k n + 0.125
In conclusion, it can be seen from the results that the ANN can predict permeability values at different locations using the proposed ANN model and extracted correlation. The presented correlation in this study proposes a solution for companies in Egypt to precisely predict the permeability values without using ANN software and that can lead to saving extensive computational time.

Validation of the ANN Model

In order to validate the developed ANN model, a new data set was used to perform the task. These data were unseen during the training process. The generated correlation was used to predict core permeability using the measured sonic time, gamma ray, and bulk density, and the collected data that used during the validation were for wells located in the Western Desert of Egypt. Numerous published correlations were used in the validation to estimate core permeability as well.
These correlations are most widely used for permeability prediction in the Egyptian oil fields. The correlations were the dual water model [47] and Timur’s model [48];
The dual water model is:
k = ( 100 × ϕ e ( 1 S w i ) / S w i ) 2
where ϕ e is the effective porosity; Swi is the initial water saturation. The initial water saturation values at each depth were collected from wireline log data. While the Timur’s equation is given as:
k = ( a × ϕ e b ) × S w i 2
Coefficients a and b were determined statistically and had a range of 2–5. The main drawback in Timur’s equation is the wide range of coefficients a and b that are used for the permeability estimation. Furthermore, water saturation values must be available.
Figure 10 shows the cross plot for the predicted and actual core permeability using the ANN model developed in this study. It can be seen from Figure 10 that the R2 was 0.94 with an MSE of 0.0325 and an AAPRE of 0.024 (see Table 3). Figure 10b shows that the results of the predicted permeability using the dual water model could not predict core permeability and yielded an MSE of 0.84 with an AAPRE of 0.645 and an R2 of 0.165. In addition, Timur’s equation provided a poor result for core permeability values for the same data set, with the highest MSE of 0.95 and AAPRE of 1.35 and the lowest R2 of 0.045 (see Figure 10c). Table 5 summarizes the statistical analysis of the validation process.
Table 5 shows that the estimated permeability values by the ANN model had the lowest MSE of 0.035 and AAPRE of 0.024, while the dual water model yielded the highest MSE of 0.84 and APPRE of 0.645 compared to the core data. These results indicate that the proposed ANN model is robust and has strong capability of predicting rock permeability using a minimum number of wireline log data. The reason behind poor permeability values when using the Timur and dual water models was the need for initial water saturation values (Swi). Due to the limitations of these models, ANN techniques have become a more adaptable alternative in this problem domain. Therefore, the presented ANN model and correlations can be used for better forecasting and without the need of Swi values.
Figure 11 shows a comparison between the actual core permeability and that from the Timur’s and dual water models. This clarifies that the published correlations do not have the ability to predict core permeability for different formation lithologies and various hydraulic flow units.

6. Conclusions

(1)
This study presented a novel correlation for accurately estimating the formation permeability with different lithologies and flow units located in the western part of Egypt using a comprehensive ANN model. The ANN model could forecast the core permeability with a high accuracy of 98%.
(2)
The use of weight visualization curves (WV) technique is discussed in the literature; however, this study improved the performance of the WV technique to optimize the network architecture parameters, including the selection of the number of input and hidden neurons.
(3)
The ANN model used the weight visualization curve technique to optimize the network parameters in conjunction with the backpropagation algorithm and a learning rate of 0.08.
(4)
A comparison study was performed using well-known correlations. The study showed that these correlations had a deficiency in estimating core permeability for various lithologies, and to obtain better forecasting, the data must be divided into flow units.
(5)
The proposed ANN and novel correlation may facilitate the issue of permeability prediction that requires using ANN software, and the correlation would be evaluated further using large number of oil fields with various lithologies.
(6)
It is highly recommended that future research tests the proposed ANN model and correlation on different wells in the Gulf area of Egypt to show its robustness. In addition, the authors are working on developing another SVR code using FORTRAN language in the comparison process for obtaining more accurate weights and biases of the derived correlations.
(7)
In addition, this study anticipated a solution for companies in Egypt to predict the permeability precisely without using ANN software.

Author Contributions

R.A.A.; Conceptualization, Software, Data creation, writing original draft and A.A.; Methodology, Data creation, Writing—review & editing. All authors have read and agreed to the published version of the manuscript.

Funding

This research work was funded by Institutional Fund Projects under grant no. (IFPIP: 415-145-1443).

Acknowledgments

This research work was funded by Institutional Fund Projects under grant no. (IFPIP: 415-145-1443). The authors gratefully acknowledge technical and financial support provided by the Ministry of Education and King Abdulaziz University, DSR, Jeddah, Saudi Arabia.

Conflicts of Interest

The authors declare no conflict of interest.

References

  1. Chehrazi, A.; Rezaee, R. A systematic method for permeability prediction, a Petro-Facies approach. J. Pet. Sci. Eng. 2012, 82, 1–16. [Google Scholar] [CrossRef]
  2. Helle, H.B.; Bhatt, A. Fluid saturation from well logs using committee neural networks. Pet. Geosci. 2002, 8, 109–118. [Google Scholar] [CrossRef]
  3. Lim, J.S.; Kim, J. Reservoir porosity and permeability estimation from well logs using fuzzy logic and neural networks. In Proceedings of the SPE Asia Pacific Oil and Gas Conference and Exhibition, Perth, Australia, 18 October 2004. [Google Scholar] [CrossRef]
  4. Lu, H.; Tang, H.; Wang, M.; Li, X.; Zhang, L.; Wang, Q.; Zhao, Y.; Zhao, F.; Liao, J. Pore structure characteristics and permeability prediction model in a cretaceous carbonate reservoir, North Persian Gulf Basin. Geofluids 2021, 2021, 8876679. [Google Scholar] [CrossRef]
  5. Lis-Śledziona, A. Petrophysical rock typing and permeability prediction in tight sandstone reservoir. Acta Geophys. 2019, 67, 1895–1911. [Google Scholar] [CrossRef] [Green Version]
  6. Fadhil, D.T.; Yonus, W.A.; Theyab, M.A. Reservoir characteristics of the Miocene age formation at the Allas Dome, Hamrin Anticline, Northern Iraq. MMD J. 2020, 14, 17–23. [Google Scholar] [CrossRef]
  7. Hasanusi, D.; Wijeya, R.; Shahab, W.; Endar, B.; Nurhandoko, B. Fracture and Carbonate Reservoir Characterization Using Sequential Hybrid Seismic Rock Physics and Artificial Neural-Network: A Case Study of Tiaka Field. In Proceedings of the International Conference & Exhibition, Melbourne, Australia, 14 September 2015. [Google Scholar]
  8. Ayoub, M.A.; Raja, A.I.; Almarhoun, M. Evaluation of below bubble point viscosity correlations & construction of a new neural network model. In Proceedings of the Asia Pacific Oil and Gas Conference and Exhibition, Jakarta, Indonesia, 30 October 2007. [Google Scholar] [CrossRef]
  9. Lopes, R.L.; Jorge, A.M. Assessment of predictive learning methods for the completion of gaps in well log data. J. Pet. Sci. Eng. 2018, 162, 873–886. [Google Scholar] [CrossRef] [Green Version]
  10. Wills, E. AI vs. MACHINE LEARNING: The Devil Is in the Details. Mach. Des. 2019, 91, 56–60. [Google Scholar]
  11. Jakhar, D.; Kaur, I. Artificial intelligence, machine learning and deep learning: Definitions and differences. Clin. Exp. Dermatol. 2020, 45, 131–132. [Google Scholar] [CrossRef]
  12. Azim, R.A. Prediction of multiphase flow rate for artificially flowing wells using rigorous artificial neural network technique. Flow Meas. Instrum. 2021, 76, 101835. [Google Scholar] [CrossRef]
  13. Abdel Azim, R. Application of artificial neural network in optimizing the drilling rate of penetration of western desert Egyptian wells. SN Appl. Sci. 2020, 2, 1177. [Google Scholar] [CrossRef]
  14. Malki, H.A.; Baldwin, J.L.; Kwari, M.A. Estimating permeability by use of neural networks in thinly bedded shaly gas sands. SPE Comput. Appl. 1996, 8, 58–62. [Google Scholar] [CrossRef]
  15. Smith, K.A. Neural networks for combinatorial optimization: A review of more than a decade of research. Inf. J. Comput. 1999, 11, 15–34. [Google Scholar] [CrossRef]
  16. Osborne, D.A. Permeability estimation using a neural network: A case study from the Roberts unit, Wasson field, Yoakum County, Texas. AAPG Bull. Am. Assoc. Pet. Geol. United States 1992, 76, 4. [Google Scholar]
  17. Zhou, C.D.; Wu, X.L.; Cheng, J.A. Determining reservoir properties in reservoir studies using a fuzzy neural network. In Proceedings of the SPE Annual Technical Conference and Exhibition, Houston, TX, USA, 3–6 October 1993. [Google Scholar] [CrossRef]
  18. Jian, F.X.; Taggart, I.J. A critical comparison of neural networks and discriminant analysis in lithofacies, porosity and permeability predictions. J. Pet. Geol. 1995, 18, 191–206. [Google Scholar]
  19. Huang, Z.; Shimeld, J.; Williamson, M.; Katsube, J. Permeability prediction with artificial neural network modeling in the Venture gas field, offshore eastern Canada. Geophysics 1996, 61, 422–436. [Google Scholar] [CrossRef]
  20. Huang, Z.; Williamson, M.A. Determination of porosity and permeability in reservoir intervals by artificial neural network modelling, offshore Eastern Canada. Pet. Geosci. 1997, 3, 245–258. [Google Scholar] [CrossRef]
  21. Helle, H.B.; Bhatt, A.; Ursin, B. Porosity and permeability prediction from wireline logs using artificial neural networks: A North Sea case study. Geophys. Prospect. 2001, 49, 431–444. [Google Scholar] [CrossRef]
  22. Rwechungura, R.; Dadashpour, M.; Kleppe, J. Application of particle swarm optimization for parameter estimation integrating production and time lapse seismic data. In Proceedings of the SPE Offshore Europe Oil and Gas Conference and Exhibition, Aberdeen, UK, 6–8 September 2011. [Google Scholar] [CrossRef]
  23. Saputro, O.D.; Maulana, Z.L.; Latief, F.D.E. Porosity log prediction using artificial neural network. J. Phys. Conf. Ser. 2016, 739, 012092. [Google Scholar] [CrossRef] [Green Version]
  24. Ahmadi, M.A.; Chen, Z. Comparison of machine learning methods for estimating permeability and porosity of oil reservoirs via petro-physical logs. Petroleum 2019, 5, pp.271–284. [Google Scholar] [CrossRef]
  25. Khayer, K.; Roshandel Kahoo, A.; Soleimani Monfared, M.; Tokhmechi, B.; Kavousi, K. Target-Oriented Fusion of Attributes in Data Level for Salt Dome Geobody Delineation in Seismic Data. Nat. Resour. Res. 2022, 31, 2461–2481. [Google Scholar] [CrossRef]
  26. Rezaee, R.; Saeedi, A.; Clennell, B. Tight gas sands permeability estimation from mercury injection capillary pressure and nuclear magnetic resonance data. J. Pet. Sci. Eng. 2012, 88, 92–99. [Google Scholar] [CrossRef] [Green Version]
  27. Wang, Y.; Zhang, K.; Wu, N. Numerical investigation of the storage efficiency factor for CO2 geological sequestration in saline formations. Energy Procedia 2013, 37, 5267–5274. [Google Scholar] [CrossRef] [Green Version]
  28. Anifowose, F.; Labadin, J.; Abdulraheem, A. A least-square-driven functional networks type-2 fuzzy logic hybrid model for efficient petroleum reservoir properties prediction. Neural Comput. Appl. 2013, 23, 179–190. [Google Scholar] [CrossRef]
  29. Wendt, W.A.; Sakurai, S.T.; Nelson, P.H. Permeability prediction from well logs using multiple regression. In Reservoir Characterization; Academic Press: Cambridge, MA, USA, 1986; pp. 181–221. [Google Scholar]
  30. Rogers, S.J.; Fang, J.H.; Karr, C.L.; Stanley, D.A. Determination of lithology from well logs using a neural network. AAPG Bull. 1992, 76, 731–739. [Google Scholar]
  31. Zhong, Z.; Carr, T.R.; Wu, X.; Wang, G. Application of a convolutional neural network in permeability prediction: A case study in the Jackson burg -Springtown oil field, West Virginia, USA. Geophysics 2019, 84, B363–B373. [Google Scholar] [CrossRef]
  32. Zhang, D.; Yuntian, C.H.E.N.; Jin, M.E.N.G. Synthetic well logs generation via Recurrent Neural Networks. Pet. Explor. Dev. 2018, 45, 629–639. [Google Scholar] [CrossRef]
  33. Chen, Y.; Chang, H.; Meng, J.; Zhang, D. Ensemble Neural Networks (ENN): A gradient-free stochastic method. Neural Netw. 2019, 110, 170–185. [Google Scholar] [CrossRef]
  34. Gori, M.; Tesi, A. On the problem of local minima in backpropagation. IEEE Trans. Pattern Anal. Mach. Intell. 1992, 14, 76–86. [Google Scholar] [CrossRef] [Green Version]
  35. Abdel Azim, R.; Hamada, G. Novel Correlation for Calculating Water Saturation in Shaly Sandstone Reservoirs Using Artificial Intelligence: Case Study from Egyptian Oil Fields. ACS Omega 2022, 7, 29666–29674. [Google Scholar] [CrossRef]
  36. Bell, J. Machine Learning: Hands-on for Developers and Technical Professionals; John Wiley & Sons: Hoboken, NJ, USA, 2020. [Google Scholar]
  37. Agatonovic-Kustrin, S.; Beresford, R. Basic concepts of artificial neural network (ANN) modeling and its application in pharmaceutical research. J. Pharm. Biomed. Anal. 2000, 22, 717–727. [Google Scholar] [CrossRef]
  38. Giri Nandagopal, M.S.; Selvaraju, N. Prediction of liquid–liquid flow patterns in a Y-Junction circular microchannel using advanced neural network techniques. Ind. Eng. Chem. Res. 2016, 55, 11346–11362. [Google Scholar] [CrossRef]
  39. Mesbah, M.; Soroush, E.; Kakroudi, M.R. Predicting physical properties (viscosity, density, and refractive index) of ternary systems containing 1-octyl-3-methyl-imidazolium bis (trifluoromethylsulfonyl) imide, esters and alcohols at 298.15 K and atmospheric pressure, using rigorous classification techniques. J. Mol. Liq. 2017, 225, 778–787. [Google Scholar]
  40. Ghaffari, A.; Abdollahi, H.; Khoshayand, M.R.; Bozchalooi, I.S.; Dadgar, A.; Rafiee-Tehrani, M. Performance comparison of neural network training algorithms in modeling of bimodal drug delivery. Int. J. Pharm. 2006, 327, 126–138. [Google Scholar] [CrossRef] [PubMed]
  41. Vakili, M.; Yahyaei, M.; Kalhor, K. Thermal conductivity modeling of graphene nanoplatelets/deionized water nanofluid by MLP neural network and theoretical modeling using experimental results. Int. Commun. Heat Mass Transf. 2016, 74, 11–17. [Google Scholar]
  42. Hippert, H.S.; Pedreira, C.E.; Souza, R.C. Neural networks for short-term load forecasting: A review and evaluation. IEEE Trans. Power Syst. 2001, 16, 44–55. [Google Scholar] [CrossRef]
  43. Soroush, E.; Mesbah, M.; Shokrollahi, A.; Rozyn, J.; Lee, M.; Kashiwao, T.; Bahadori, A. Evolving a robust modeling tool for prediction of natural gas hydrate formation conditions. J. Unconv. Oil Gas Resour. 2015, 12, 45–55. [Google Scholar] [CrossRef]
  44. Bishop, C.M. Neural networks and their applications. Rev. Sci. Instrum. 1994, 65, 1803–1832. [Google Scholar] [CrossRef] [Green Version]
  45. Santos, F.M.; Silva, J.T.; Giardini, A.C.; Rocha, P.A.; Achermann, A.P.; Alves, A.S.; Britto, L.R.; Chacur, M. Neural mobilization reverses behavioral and cellular changes that characterize neuropathic pain in rats. Mol. Pain 2012, 8, 1744–8069. [Google Scholar] [CrossRef]
  46. Wong, P.M.; Taggart, I.J.; Gedeon, T.D. Use of neural network methods to predict porosity and permeability of a petroleum reservoir. AI Appl. 1995, 9, 27–37. [Google Scholar]
  47. Ahmed, U.; Crary, S.F.; Coates, G.R. Permeability estimation: The various sources and their interrelationships. J. Pet. Technol. 1991, 43, 578–587. [Google Scholar] [CrossRef]
  48. Timur, A. An investigation of permeability, porosity, and residual water saturation relationships. In Proceedings of the SPWLA 9th Annual Logging Symposium, New Orleans, LA, USA, 23–26 June 1968. [Google Scholar]
Figure 1. Schematic showing the ANN structure used in this study for one hidden layer.
Processes 10 02587 g001
Figure 2. Flow chart showing the ANN model process.
Processes 10 02587 g002
Figure 3. Correlation coefficient for inputs and outputs.
Processes 10 02587 g003
Figure 4. WV-curves for the 1-25-1 configuration.
Processes 10 02587 g004
Figure 5. Relationship between the bulk density and sonic travel time of the collected data.
Processes 10 02587 g005
Figure 6. Relationship between the different optimization trials.
Processes 10 02587 g006
Figure 7. (a) Relationship between GR and NPHI; (b) Poro-Perm cross plot of the collected data.
Processes 10 02587 g007
Figure 8. The predicted permeability from the ANN versus core permeability: (a) training; (b) testing.
Processes 10 02587 g008
Figure 9. ANN permeability and core permeability.
Processes 10 02587 g009
Figure 10. Scatter cross plot showing a comparison of the predicted permeability using the developed ANN model and core permeability: (a) ANN model; (b) Dual water model; (c) Timur’s equation.
Processes 10 02587 g010aProcesses 10 02587 g010b
Figure 11. Core permeability vs. the predicted permeability for the numerous correlations used in this study.
Processes 10 02587 g011
Table 1. Statistical analysis of input and output data.
ParameterSonic Travel Time (DT) (µs/ft)GRBulk Density (g/cc)Permeability (md)Porosity (v/v)
Minimum43.30218.1882.6180.12510
Maximum63.64166.1512.93324.4910.143
Standard deviation75.10102223.63151.5488116.5820.633
Skewness1.2170740.376381−0.0871.42211.620
Mean48.566536.40852.8011.94000.0168
Table 2. ANN optimized parameters (OPs).
ParameterTestedOP
Neurons numbers5–3025
Hidden layers1–31
Algorithm functiontansig/logsiglogsig
Learning rate0.001–0.80.08
Table 3. Contribution percentage of each input variables including bias.
ParameterContribution (%)
Density31.2
Sonic time29.2
GR30.4
Bias9.2
Table 4. Weights and biases for the generated correlation from Equation (9).
Hidden NeuronWeights (w1)Weights (w2)Hidden Layer Bias (b1)Output Layer Bias (b2)
GRDTRHOB
1−0.2625−0.2925−0.080.0425−0.126.08
200000
300000
40.0150.080.095−0.0975−0.6225
5−0.09750.05250.0350.025−0.01
6−0.10750.04−0.1225−0.08750.005
7−0.110.025−0.015−0.0725−0.005
80.110.0225−0.0325−0.110.0025
90.0750.0475−0.055−0.06750.0075
10−0.0350.0725−0.06250.0675−0.0075
110.085−0.0450.0750.05750.01
12−0.325−0.6850.050.115−0.0125
130.07750.020.060.02−0.0075
14−0.1075−0.08750.0550.020.0025
150.12250.03−0.065−0.08−0.0125
16−0.05−0.10.1175−0.020.005
170.0525−0.005−0.1125−0.12−0.0075
180.085−0.0875−0.080.0950.0075
19−0.05750.06750.04250.11250.0125
200.010.0725−0.0150.0575−0.005
210.21250.620.020.1150.005
22−0.05250.08−0.11250.05−0.0025
23−0.0250.1150.0125−0.10250.0075
24−0.08750.1225−0.0075−0.095−0.0125
250.035−0.07750.04250.11250
Table 5. Statistics analysis for well-known correlations and the ANN model.
CorrelationAAPREMSECorrelation Coefficient (R2)
Dual water model0.6450.840.165
Timur0.821.350.045
This study’s ANN0.0240.0350.94
Publisher’s Note: MDPI stays neutral with regard to jurisdictional claims in published maps and institutional affiliations.

