Abstract
Thermal processing of white radish using retort sterilization at different temperatures was investigated according to the dimension of the package. Four different samples with the same weight and volume were placed in packages with different dimensions. The degree of sterilization (i.e., F0-value) at the cold point targeted at 6 min was determined based on experimental data and heat transfer simulation. The sterilization time was considerably increased with a decrease in surface area to unit volume ratio (φ) at each temperature. The sterilization time for the sample with the highest φ (155.56) was approximately five times faster than the sample with the lowest φ (72.22) at all heating temperatures. Numerical simulation conducted with a proper heat transfer coefficient (h) showed mostly good agreement with the experimental data (RMSE < 2 °C). Changes in color and total phenolic content were higher for samples heated at higher temperatures. Hardness values of white radish samples measured for center and edge parts separately were more uniform for samples with a high φ. Results in this study suggest that optimizing heating conditions of root vegetables must consider their package dimensions to satisfy quality attributes after sterilization. Numerical simulation can be utilized as a useful tool to design the sterilization process.
1. Introduction
Radish is one of the most consumed vegetables in Asia [1]. It has dietary fibers and antioxidants such as vitamins, flavonoid pigments, and aromatic amines [2,3,4,5]. White radish is largely consumed as a soup in Asia. This soup is popular in food services and restaurants’ menus. For commercial purposes, white radish is processed through pickling, drying, and fermentation. However, chemical structures and nutritional values of raw radish are changed after processing [6]. Recently, retort-processed ready-to-eat (RTE) or ready-to-cook (RTC) food has been in demand in processed food and food service industries due to its convenience. Although there are large demands for RTE or RTC white radish products with a long shelf life, commercial production is challenging because thermal processing causes a wide range of quality changes, such as color and texture changes. Especially, when a large package is required (for example, for food services or B2B products), the quality may change and the degree of sterilization may need to be optimized due to the long thermal processing time required for large size products. Ham and Yoon [7] reported that the thermal processing time to reach the target F0-value for pouched white radish broth is increased when the volume is increased from 500 to 5000 mL. When the thermal process time is increased, the browning index of white radish broth is significantly increased. Therefore, the retort process should be optimized before applying it to produce a long shelf-life white radish or white radish broth because of thermal degradation of product qualities, such as texture, color, and overall acceptability.
Retort processing is one of the most widely used thermal processes for commercial production of packaged food products with a long shelf life at room temperature [6]. In general, a high temperature (>121.1 °C) and a pressure higher than the atmospheric pressure (1.3–1.5 atm) are used as reference processing conditions for the retort process [8]. Most retort products are processed in pouches or tin cans with a vacuum or a minimum level of headspace. The heat transfer rate plays a major role in determining the degree of sterilization (i.e., F0-value) of the product. The cold point in the product must be determined before estimating the total thermal process time that is required to satisfy a certain degree of sterilization. Recently, there has been a demand for different sizes and shapes of retorted products. It is practically impossible to measure all temperature profiles at every point according to various sizes and shapes under high-temperature conditions [9]. Especially, it is very difficult to predict temperature profiles of products under two-dimensional or three-dimensional heat transfer. Heat transfer occurring in retort pouches could be predicted with a relatively simple conduction heat transfer model because the pouch is tightly packed with a vacuum. However, with three-dimensional heat transfer in various sizes or shapes, it is difficult to evaluate the microbial safety based on the degree of sterilization at the cold point [10]. Therefore, heat transfer rate changes depending on the package dimensions, suggesting that package dimensions are an important factor in retort processing.
Numerical simulation (NS) is a useful tool that provides a temperature gradient under various geometry and thermal processing conditions [9]. NS is especially useful for analyzing the heat transfer phenomenon in a three-dimensional heat transfer, which is hard to predict with an analytical solution. The governing partial differential equations (PDE) for heat transfer by conduction can be numerically solved with either a finite volume method or a finite difference method [11]. Solutions for PDE have been successfully used for predicting cold points of food products with complicated three-dimensional shapes [11,12,13]. The total thermal processing time measured based on the cold point estimated based on NS can be used to evaluate the degree of sterilization of the product [14,15].
Heat-sensitive qualities, such as texture and color, must be considered before applying a retort process. A high temperature and a long time in the retort process can significantly change heat-sensitive qualities. Chemical reactions occurring during thermal processing often lower nutritional values. However, chemical reactions can also generate new favorable components, such as polyphenolic components and flavonoid compounds, during thermal treatment [16]. For instance, the amount of physiologically active substances in several fruits and vegetables can be increased by certain levels of heat treatment [17]. Antioxidant activities of defatted soybean and garlic extract are increased by thermal treatments [18]. Antioxidant activities of ginseng, pear, and tomato are also increased after heat treatments because of increases of polyphenols and flavonoids [17,19,20,21]. Changes in active components in white radish extract products during thermal processing and those in white radish after long periods (30 days) of thermal treatments to produce white radish-based products have been studied [22,23]. However, effects of thermal processing temperature and time on quality attributes, such as color, texture, and antioxidant levels, in RTE and RTC white radish are currently unknown. Especially, effects of sterilization conditions on white radish with different package dimensions have not been reported yet.
Thus, the objective of this study was to investigate effects of thermal processing conditions on the quality of retorted white radish products with various package dimensions. To achieve this goal, this study estimated cold points of white radish products with various package dimensions using NS and evaluated effects of heating temperature and time on color, texture, and antioxidant activity of white radish.
2. Materials and Methods
2.1. Subsection
A bundle of fresh white radish (Raphanus sativus L.) was obtained from a local farm and used for the experiment within one month after harvest. The white radish was sliced into a rectangular shape (30 × 30 × 15 mm) after washing and cleaning. The size of the slice was determined based on the average size of white radish slices used in commercial white radish soup products. Sliced radish samples were packed in a retort pouch (NY15/LLDPE70) with a vacuum. Various dimensions of rectangular parallelepiped packages were prepared to investigate the effects of dimensions on heat transfer rates by conduction during thermal processing. By stacking radish slices, the following four different rectangular parallelepiped packages were prepared: A = 0.120 × 0.360 × 0.015 m, B = 0.060 × 0.360 × 0.030 m, C = 0.120 × 0.180 × 0.030 m, and D = 0.120 × 0.090 × 0.060 m. Images are shown in Figure 1I. The weight (5.87 × 10⁻¹ ± 0.01 kg) and the volume (6.48 × 10⁻⁴ m3) of each package were constantly maintained. The ratio of the surface area to unit volume was calculated with the following equation:
where φ is the ratio of the surface area to volume, A is the total area of the sample (m2), V is the volume of the sample (m3), and x is the unit calibration factor = 100 (m).
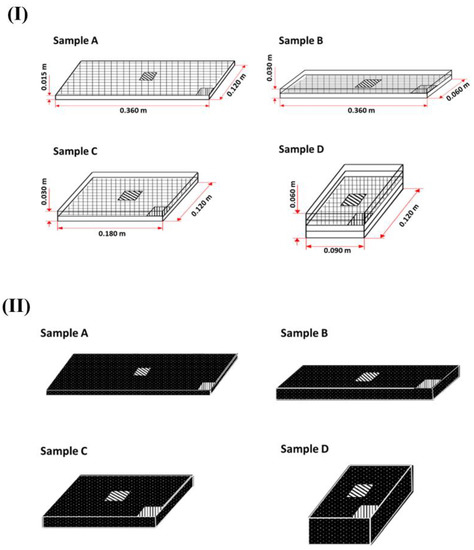
Figure 1.
Schematic drawings of white radish samples A (1 stack), B (2 stacks), C (2 stacks), and D (4 stacks) indicating segments of the white radish used for color and textural analysis: (I) Color analyzing (▦), and (II) texture analyzing (▥: edge sample, ▧: center sample).
Samples were sterilized by retort (SR-240, TOMY, Osaka, Japan) as pressurized steam with an operating pressure range of 0–275 kPa. Packaged samples were placed in the retort chamber. The thermal processing temperature during the retort process varied at 121.1 (±0.2), 130 (±0.4), and 140 (±0.6) °C. F0-value of 6 min at 121.1 °C was defined as the target degree of sterilization for all thermal processes. A wireless temperature sensor (Tracksense pro, Ellab, Trollesmindealle, Hillerød, Denmark) was used to monitor temperature changes at the geometrical center of each package. To calculate the F-value for each temperature and dimension, the temperature profile at the geometrical center was measured. The thermal processing time at each temperature and dimension was varied to achieve the target F0-value.
2.2. Numerical Simulation
Transient heat conduction in the parallelepiped samples was simulated by solving the unsteady state Fourier’s equation as shown below with an assumption of constant thermal diffusivity (α) [24]:
where T is the initial temperature of the radish sample (K), t is the time (s), and α is the thermal diffusivity (m2/s).
Thermal diffusivity of white radish was determined as:
where k is the heat conductivity (W/m·K), ρ is the density (kg/m3), and CP is the specific heat (kJ/kg·K).
Surface conditions of the sample were:
The sample had a uniform initial temperature. Thus, initial conditions were:
Symmetry boundary conditions on the axes were:
where Ts is the temperature of the surface of the package (K), T∞ is the temperature of the retort steam (K), h is the convection heat transfer coefficient (W/m2·K), and x, y, and z are distances (m) of the x-, y-, and z-axis, respectively.
Ansys Fluent (version 17.0, Ansys Inc., Canonsburg, PA, USA) was used to solve the Fourier equation with appropriate boundary conditions to simulate conduction heat transfer. As shown in the boundary conditions (Equations (3)–(5)), the heat transfer by convection occurring between the heating medium (steam) of the retort and the surface of the package was considered in the boundary conditions [25]. Heat transfer rate from convection flow was assumed to be the same as that on the surface of the sample [26].
2.3. Calculation of Heat Transfer Coefficient
Heat transfer coefficient (h) for forced convection in the retort might be between 5700 and 28,000 (W/m2∙K), derived from the forced convection current in the interior of a retort machine [27]. Since the range of h is too wide to be applied to the simulation, we estimated the h with the two-step method used in the study by Hong et al. [9]: (1) average h value was estimated using dimensionless numbers, and (2) the h value with the lowest root mean square error (RMSE) value estimated between the simulation value and the experimental value was then chosen for the simulation. All flow properties were approximated at the film temperature defined as follows:
where TF was the film temperature (K), TS was the temperature at the surface of the package (K), and TR was the temperature of the heating medium (K).
The volume of the radish sample (6.480 × 10⁻⁴ m3) is very small compared to the volume of the retort chamber (4.449 × 10⁻² m3). Thus, the geometry under forced convection can be simplified to a horizontal plate [27]. Dimensionless numbers for estimating the h value were: Reynold number (NRe), Prandtl number (NPr), and Nusselt number (NNu). Values of h were estimated from the following dimensionless numbers and empirical equations:
for the laminar region,
for the turbulent region,
where μ is the viscosity (Pa·s), v is the velocity (m/s), and L is the average length of the longest side of the sample (m). Physical properties of the steam for calculating dimensionless numbers are summarized in Table 1. The average flow rate of the steam was assumed to be v = 0.0122 m3/s. The thin layer of a pouch with a low thermal resistance was ignored in the simulation because the vacuum-packed white radish was sterilized by high-temperature steam [28]. Physical properties of the radish and retort pouch for NS are presented in Table 2.

Table 1.
Properties of steam.
Table 2.
Properties of white radish.
2.4. Calculation of F-Value
The F0-value indicating the degree of sterilization was calculated using the following equation, where a reference temperature of 121.1 °C and a z-value of 10 °C were applied based on sterilization conditions for thermoresistant anaerobe Clostridium botulinum (C. botulinum) spores [29]:
where t0 is the time to initiate heating (min), tf is the finish time of heating (min), Tt is the temperature at time t (K), and Tref is the reference temperature (K).
According to Simpson et al. [30], the inactivation of C. botulinum spores can be calculated by a ratio between the final and initial bacteria ratio because the bacteria destruction during sterilization follows first-order kinetics:
where is the inactivation percentage of C. botulinum and D is the D-value (min).
For C. botulinum, the decimal reduction time (D-value), 0.21 min, was considered for thermal destruction at the reference temperature [31].
2.5. Color Measurement
Changes in color of each white radish associated with the thermal process were evaluated by measuring L* (lightness), a* (redness), and b* (yellowness) using a colorimeter (CR-300, Minolta, Osaka, Japan). A standard white plate with the following values was used: L* = 93.60, a* = 0.31, and b* = 0.32. Locations chosen to measure the color are presented in Figure 1II. Since these positions are adjacent to the center and the edge of each sample, these selected positions might be suitable for representing the pattern of color changes associated with heat treatment. Color measurements were performed in triplicate and the average value was used for analysis.
2.6. Extraction of Samples
White radish samples were freeze-dried for 48 h using a freeze-dryer. Samples were ground into a fine powder and kept at −70 °C prior to analysis. Powdered samples (50 mg) were extracted with 2 mL of 90% methanol containing 0.25% acetic acid for 30 min. The sample solution was then centrifuged at 3000 rpm for 10 min at 4 °C. The extraction was repeated three times. The supernatant was filtered through a 0.45 μm syringe filter (Whatman Inc., Maidstone, UK). The extract was appropriately diluted before it was used for total phenolic content analysis.
2.7. Total Phenolic Content (TPC)
TPC of white radish after thermal processing was determined using the Folin–Ciocalteu method. A 0.5 mL solution of the radish extract, 0.5 mL of Folin–Ciocalteu reagent, and 2 mL of 20% Na2CO3 solution were transferred to a glass test tube and mixed thoroughly using a vortex mixer. After 15 min of incubation at room temperature, 10 mL of distilled water was added and the absorbance was measured at 725 nm using a spectrophotometer. The TPC was presented as a gallic acid equivalent (GAE) per 100 g of dry matter (d.m.). All reagents were purchased from Sigma-Aldrich (St. Louis, MO, USA).
2.8. Texture Measurement
Texture was measured with a compression test using a texture analyzer (CT3, Brookfield, Middleboro, MA, USA). Samples were cut into 0.030 × 0.030 × 0.015 m pieces. Locations of samples were taken to measure the texture, i.e., the center and the edge of each package, as described in Figure 1II. Measurement conditions of the compression test were as follows: 0.007 m of plastic blade, test speed of 0.001 m/s, trigger force of 0.05 kg, and deformation rate of 30%. All measurements were performed in triplicate with different samples.
2.9. Statistical Analysis
Nodal temperature was estimated by simulating a model at 10 s intervals. Simulated data were compared to experimental data (temperature and F-value) and root mean squared error (RMSE) was calculated using the following equation:
where Te is the temperature of the sample at the cold point measured by experiment (K), Tsim is the simulated temperature of sample at the cold point (K), Fe is the F-value calculated based on the experimental temperature (min), Fsim is the F-value calculated based on the simulated temperature (min), and n is the number of data points.
Statistical significance of difference was evaluated by one-way analysis of variance (ANOVA) using MS-Excel 2016 (Microsoft, Redmond, WA, USA) at a confidence level of 95%.
3. Results and Discussion
3.1. Heat Penetration during the Retort Process and Calculation of Sterilization Time
Heat penetration into radish slices in the pouch during the retort process was measured. Results were compared with simulation results as shown in Figure 2I–III. Thermal processing was conducted at 121.1, 130, and 140 °C for samples with different dimensions. The geometrical center was assumed to be the cold point for each package because all radish slices in the package were vacuum-packed tightly in order that no convection resistance occurred between radish slices [9]. The heating rate of sample A was the highest among samples. It might be due to a larger surface area of sample A. Although the same weights of samples were thermally treated and the same degree of sterilization (F0-value = 6 min) was maintained, the heating rate significantly varied across different surface areas of samples. It was found that the greater the minimum distance between the cold point and the surface at the same heating temperature, the longer the time it took to reach the target degree of sterilization. Hong et al. [9] reported that increasing the package size can result in slower temperature rises. However, with the volume the same for heat treatment, the shorter the distance to the cold point and the surface area, thus the volume permeated heat more quickly.
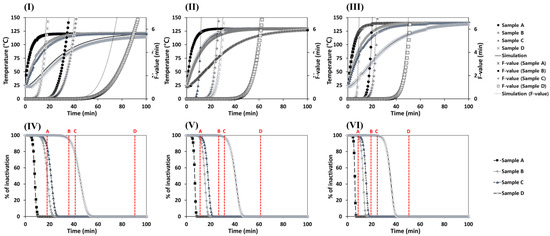
Figure 2.
Changes in temperature at the cold point under different heating conditions and F-value calculated according to temperature change at the cold point. Heating condition and F-value of (I) 121.1 °C, (II) 130 °C, and (III) 140 °C are shown. Inactivation of C. botulinum calculated using Equation (14) during sterilization at (IV) 121.1 °C, (V) 130 °C, and (VI) 140 °C is also shown. Dashed lines with letters A, B, C, and D are the sterilization times when F0-value = 6 min for samples A, B, C, and D, respectively.
The time taken to reach the target sterility (F0-value = 6 min) according to package shape is presented in Table 3. Sample A was the fastest in sterilization to reach the target sterility at 121.1 °C, whereas sample D was the slowest. At 121.1, 130, or 140 °C, the processing times were 17.95, 12.05, or 9.62 min for sample A and 90.63, 61.62, or 51.20 min for sample D, respectively. Thus, the sterilization time was approximately five times longer for sample D than for sample A. The higher the φ, the faster the heat transfer rate with the same weight and volume of a material. In particular, a faster heat transfer rate of sample A was found due to a higher φ and the closer the cold point was to the steam. The time taken to reach target sterility considerably decreased by increasing the heating temperature. The reason was because a faster rate of heat transfer was associated with a higher temperature difference between the sample and steam temperature. The higher the external heat, the faster the heating rate. These results were similar to those of ohmic heating, which provides sufficient heat [32], and those of direct steam injection heating, which has a large sample surface area [33]. Bonis and Ruocco [34] reported that the heat flow should be accelerated by maximizing the heat input from the heat source and by broadening the contact area of the target material. For the inactivation of C. botulinum, which is calculated by Equation (14) (Figure 2IV–VI with the sterilization time when F0-value = 6 min), all sterilization times at varied temperatures for samples met the required inactivation. The sterilization temperatures for white radish in this study are suitable to inactivate C. botulinum spores, which must exceed 100 °C.
Table 3.
Sterilization time of retort treatment for white radish with different heating temperatures and geometries to reach F0-value of 6 min (φ: the ratio of surface area to unit volume calculated by Equation (1)).
3.2. Numerical Simulation
Before conducting heat transfer simulation, h values were estimated using dimensionless numbers and RMSEs were calculated to compare simulation results with experimental values. The NRe at each temperature was estimated to be above 4000 by Equation (7) in order that the fluid around the sample had a turbulent flow. Since the h value obtained from the analytically calculated dimensionless number might not be most suitable for simulation, simulations were performed with varied h values from 169.4 to 224.8. The average RMSE containing all experimental conditions, such as dimension and temperature, was then calculated with Equations (15) and (16) (Figure 3). For each temperature from 121.1 to 140 °C, h value of 217.8 W/m2·K, which was the most appropriate number to the actual value, was used to perform the NS related to the heat transfer model for further analysis. Estimated RMSEs of temperature and F-value profiles for each sample obtained from the experiment and simulation are shown in Table 4 (also shown in Figure 2). Experimental and simulation values were in good agreement (<2 °C) except for sample D at 120 °C, which had a long thermal treatment time possibly due to a large structure change during heating.
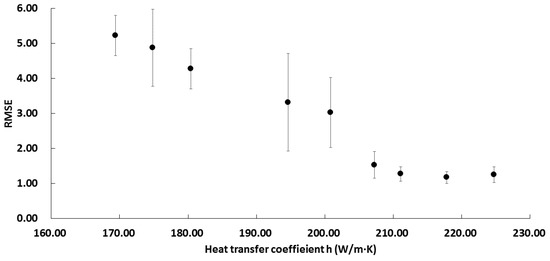
Figure 3.
Changes in average RMSE values depending on h value.
Table 4.
Estimation of RMSE values of temperature and F-value profiles obtained from simulation and experimental data (φ: the ratio of surface area to unit volume calculated by Equation (1)).
Temperature distributions of white radish samples at different sample dimensions were simulated using NS (Figure 4). The rate of heat penetration was higher for the sample having a higher φ. The fastest heat penetration was observed for sample A, which had the highest φ. Hong et al. [9] studied the difference in heat transfer rate according to packaging dimension and suggested that the surface area which influences the rate of the heat flow might affect the heat transfer rate.
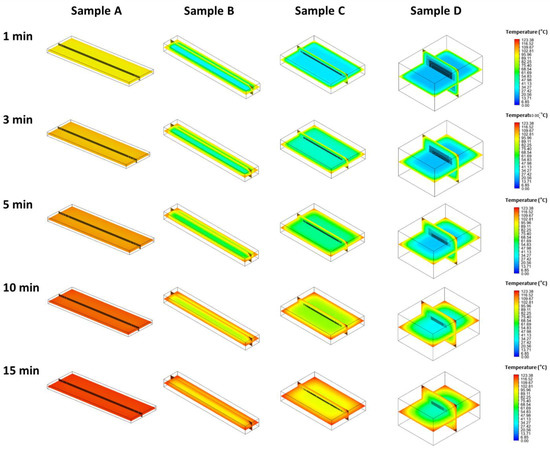
Figure 4.
Estimation of temperature profiles of white radish samples with different dimensions (samples A–D) during heating using numerical simulation. Representative images of simulation results at 121.1 °C are shown.
3.3. Color Change after Sterilization
Color change of retorted white radish sample was measured when the F0-value was 6 min according to heating temperature. Values of L*, a*, and b* are presented in Table 5. All color values tended to show higher differences at longer sterilization times and higher temperatures. The L* value indicating the brightness of samples C and D with the same shape decreased when the heating temperature was increased. The a* value indicating the redness of a sample increased with increasing heating temperature. The most significant change was observed for the b* value. At 121.1, 130, and 140 °C, compared to the control (b* = 1.22 ± 0.07), all samples showed higher b* values. In general, the enzymatic browning reaction by PPO (polyphenol oxidase) is inactivated by heat treatment at 70 °C [22]. El’ode et al. [35] reported that the browning reaction at 100–180 °C is due to caramelization of sugar. The Maillard reaction and caramelization reaction of glucose and fructose in radish constituents can lead to browning when the heating temperature is higher than 110 °C [36]. It has been reported that the browning reaction has a meaningful correlation with antioxidative activity [37]. More pronounced color changes and non-uniformity between the center and the edge are due to the time and temperature dependency of a browning reaction. Browning of white radish is inevitable for the sterilized white radish. However, the uniformity of color between the center and the edge was improved by sterilizing white radish with larger surface area geometry (samples A and B). Although the sterilization time could be reduced by increasing the temperature for samples C and D, the non-uniformity and color change were severe. The time and temperature of sterilization of white radish should be optimized to achieve uniform color, which may be an important quality attribute related to the appearance of the product.
Table 5.
Changes in color of white radish after retort sterilization at the same sterility with different geometries (φ: the ratio of surface area to unit volume calculated by Equation (1)).
3.4. Change of TPC after Sterilization
TPC according to heating temperature with the same targeted sterility are presented in Figure 5. TPC was significantly increased when the heating temperature was increased (p < 0.05). Especially, TPC in sample A heated at 140 °C was increased approximately 7.85 times compared with that of the control (20.33 ± 1.35 mg/100 g). In general, heat treatment should last for more than 10 h to increase the TPC. However, under high temperatures, the increase of TPC can be accelerated. The reason for a high TPC in sample A was attributed to chemical changes in radish slices inside the package that occurred quickly due to even penetration under a high temperature. Dewanto et al. [17] found that in some fruits and vegetables, phenolic acid could leach out due to destruction of cellular components in food according to heat treatment conditions. TPC can be increased up to seven times at the maximum. This phenomenon occurs due to heat degradation of vitamin C and change of phenol compound [36].
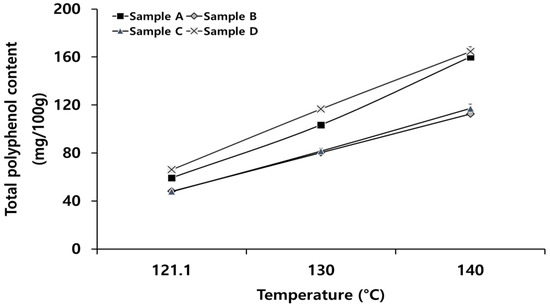
Figure 5.
Changes in average total polyphenol content at different heating conditions.
3.5. Hardness Change after Sterilization
Measured hardness values according to heating temperature are presented in Table 6. A large change in hardness at 130 or 140 °C was found compared to that at 121.1 °C, a commercially used temperature. Hong et al. [9] reported that there are changes in texture when a vegetable, such as a carrot, is thermally sterilized. There is a difference in hardness between the center and the edge of each sample. Changing rates were significantly different among samples. Roeck et al. [38] reported that the heat conduction rate might be changed by the stack formed in the process of packaging carrots. Even in the same package, due to heat conduction in three directions from corners that meet, there might be a difference in structural change of food because of a difference in heat input. However, in the case of sample A heated at 140 °C, the time needed to reach the targeted sterility and the input time of excessive heat decreased due to the large exterior surface area exposed to heat, resulting in minimized difference in texture between the center and the edge. In the case of sample D, the difference in texture between the center and the edge was large as the treatment time was lengthened with the same targeted sterility (F0-value = 6 min). For samples heated at 140 °C, the difference in hardness between the center and the edge was less than that for samples heated at 121.1 °C (p < 0.05). In addition, higher hardness after cooking is required for white radish to maintain product quality during handling and further utilization of the product in which the sterilized white radish is subjected to additional thermal treatment for cooking. The excessively soft texture causes aversive feelings in consumers [39]; thus, optimizing geometry and processing temperature is important.
Table 6.
Changes in hardness of white radish with different geometries after retort sterilization at the same targeted sterility (φ: the ratio of surface area to unit volume calculated by Equation (1)).
4. Conclusions
This study investigated the effects of heating conditions (121.1, 130, and 140 °C) on the degree of sterilization, color, texture, and antioxidative activity of white radish placed in packages with a variety of geometries via retort heating to develop HMR products. NS was successfully applied to simulate temperature profiles. NS can be used to determine optimal sterilization. Among white radish samples with the same weight, sample D with the smallest φ required a maximum of 5.32 times longer heat treatment than sample A under the same heating temperature of 140 °C. Color and texture changes of white radish samples were more significant at higher heating temperatures and longer heating times. However, the texture uniformity between the center and the edge of the white radish highly depends on φ. Samples with higher φ showed less differences. To obtain uniform quality attributes, heat transfer according to surface area must be considered. Total phenolic content of white radish was increased with increasing heating temperature. It was verified that useful components in radish samples increased at a heating temperature of 140 °C. Quality attributes of vegetable products are sensitive to heating temperature and time. Thus, temperature profiles of products during thermal treatment are essential. NS is a useful approach to design the size and shape of RTE and RTC vegetable products.
Author Contributions
Conceptualization, H.J., Y.J.L. and W.B.Y.; methodology, Y.J.L. and W.B.Y.; software, Y.J.L.; validation, Y.J.L.; investigation, H.J., Y.J.L. and W.B.Y.; writing—original draft preparation, Y.J.L. and W.B.Y.; writing—review and editing, H.J. and W.B.Y.; supervision, W.B.Y. All authors have read and agreed to the published version of the manuscript.
Funding
Following are results of a study on the “Leaders in INdustry-university Cooperation 3.0” Project (202210760001), supported by the Ministry of Education and National Research Foundation of Korea. This research was supported by the Basic Science Research Program through the National Research Foundation of Korea (NRF) funded by the Ministry of Education (grant number NRF-2018R1D1A3B06042501 and grant number NRF-2020-D-G035-010104).
Data Availability Statement
The data presented in this study are available on request from the corresponding author.
Conflicts of Interest
The authors declare no conflict of interest.
References
- Lee, J.H.; Kim, H.J. Vacuum drying kinetics of Asian white radish (Raphanus sativus L.) slices. LWT-Food Sci. Technol. 2009, 42, 180–186. [Google Scholar] [CrossRef]
- Goyeneche, R.; Roura, S.; Ponce, A.; Vega-Gálvez, A.; Quispe-Fuentes, I.; Uribe, E.; Di Scala, K. Chemical characterization and antioxidant capacity of red radish (Raphanus sativus L.) leaves and roots. J. Funct. Foods 2015, 16, 256–264. [Google Scholar] [CrossRef]
- Ryu, B.H. Antioxidative effects of flavonoids toward modification of human low density lipoprotein. Korean J. Food Nutr. 1999, 12, 320–327. [Google Scholar]
- Son, J.Y.; Son, H.S.; Cho, W.D. Antioxidant effect of onion skin extract. Korean J. Soc. Food Sci. 1998, 14, 16–20. [Google Scholar]
- Kang, J.A. Effect of garlic and onion on plasma and liver cholesterol and triacylglycerol and platelet aggregation in rats fed basal or cholesterol supplemented diets. J. Nutr. Health 1997, 30, 132–138. [Google Scholar]
- Ates, M.B.; Skipnes, D.; Rode, T.M.; Lekang, O. Comparison of spore inactivation with novel agitating retort, static retort and combined high pressure-temperature treatments. Food Control 2016, 60, 484–492. [Google Scholar] [CrossRef]
- Ham, T.H.; Yoon, W.B. Application of direct steam injection system to minimize browning of white radish (Raphanus sativus) broth during sterilization. Int. J. Agric. Biol. Eng. 2017, 10, 210–220. [Google Scholar] [CrossRef][Green Version]
- Barbosa-Cánovas, G.V.; Medina-Meza, I.; Candoğan, K.; Bermúdez-Aguirre, D. Advanced retorting, microwave assisted thermal sterilization (MATS), and pressure assisted thermal sterilization (PATS) to process meat products. Meat Sci. 2014, 98, 420–434. [Google Scholar] [CrossRef]
- Hong, Y.; Uhm, J.; Yoon, W.B. Using numerical analysis to develop and evaluate the method of high temperature Sous-Vide to soften carrot texture in different-sized packages. J. Food Sci. 2014, 79, E546–E561. [Google Scholar] [CrossRef]
- Lemus-Mondaca, R.A.; Zambra, C.E.; Vega-Gálvez, A.; Moraga, N.O. Coupled 3D heat and mass transfer model for numerical analysis of drying process in papaya slices. J. Food Eng. 2013, 116, 109–117. [Google Scholar] [CrossRef]
- Siripon, K.; Tansakul, A.; Mittal, G.S. Heat transfer modeling of chicken cooking in hot water. Food Res. Int. 2007, 40, 923–930. [Google Scholar] [CrossRef]
- Chhanwal, N.; Indrani, D.; Raghavarao, K.S.M.S.; Anandharamakrishnan, C. Computational fluid dynamics modeling of bread baking process. Food Res. Int. 2011, 44, 978–983. [Google Scholar] [CrossRef]
- Jahanbakhshian, N.; Hamdami, N. Numerical simulation of heat and mass transfer during heating and cooling parts of canned-green-olive pasteurization. J. Food Process Eng. 2021, 44, e13909. [Google Scholar] [CrossRef]
- Cordioli, M.; Rinaldi, M.; Copelli, G.; Casoli, P.; Barbanti, D. Computational fluid dynamics (CFD) modelling and experimental validation of thermal processing of canned fruit salad in glass jar. J. Food Eng. 2015, 150, 62–69. [Google Scholar] [CrossRef]
- Park, H.W.; Yoo, J.S.; Jung, H.; Yoon, W.B. Developing a sterilization processing and a grading system to produce a uniform quality of sterilized whole corn (Zea mays L. var. ceratina). J. Food Eng. 2019, 249, 55–65. [Google Scholar] [CrossRef]
- Juániz, I.; Ludwig, I.A.; Huarte, E.; Pereira-Caro, G.; Moreno-Rojas, J.M.; Cid, C.; De Peña, M. Influence of heat treatment on antioxidant capacity and (poly)phenolic compounds of selected vegetables. Food Chem. 2016, 197, 466–473. [Google Scholar] [CrossRef]
- Dewanto, V.; Wu, X.; Adom, K.K.; Liu, R.H. Thermal processing enhances the nutritional value of tomatoes by increasing total antioxidant activity. J. Agric. Food Chem. 2002, 50, 3010–3014. [Google Scholar] [CrossRef]
- Rim, A.; Jung, E.; Kim, S.; Lee, S. Effect of far-infrared irradiation and heat treatment on the antioxidant activity of extracts from defatted soybean meal. Appl. Biol. Chem. 2005, 48, 400–403. [Google Scholar]
- Lee, S.; Kim, M.; Yon, J.; Baek, I.; Park, C.G.; Lee, B.J.; Yun, Y.W.; Nam, S. Black ginseng inhibits ethanol-induced teratogenesis in cultured mouse embryos through its effects on antioxidant activity. Toxicol. Vitr. 2009, 23, 47–52. [Google Scholar] [CrossRef]
- Kang, K.S.; Kim, H.Y.; Pyo, J.S.; Yokozawa, T. Increase in the free radical scavenging activity of ginseng by heat-processing. Biol. Pharm. Bull. 2006, 29, 750–754. [Google Scholar] [CrossRef]
- Cruz-Cansino, N.d.S.; Ramírez-Moreno, E.; León-Rivera, J.E.; Delgado-Olivares, L.; Alanís-García, E.; Ariza-Ortega, J.A.; Manríquez-Torres, J.d.J.; Jaramillo-Bustos, D.P. Shelf life, physicochemical, microbiological and antioxidant properties of purple cactus pear (Opuntia ficus indica) juice after thermoultrasound treatment. Ultrason. Sonochem. 2015, 27, 277–286. [Google Scholar] [CrossRef] [PubMed]
- Goyeneche, R.; Di Scala, K.; Roura, S. Biochemical characterization and thermal inactivation of polyphenol oxidase from radish (Raphanus sativus var sativus). LWT-Food Sci. Technol. 2013, 54, 57–62. [Google Scholar] [CrossRef]
- Yang, M.; Hou, C.; Lin, M.; Chang, C.; Patel, A.K.; Dong, C.; Chen, Y.; Wu, J.; Hsieh, C. Efficient thermal treatment of radish (Raphanus sativus) for enhancing its bioactive compounds. J. Food Sci. Technol. 2022, 1–9. [Google Scholar] [CrossRef]
- Ishiwatari, N.; Fukuoka, M.; Sakai, N. Effect of protein denaturation degree on texture and water state of cooked meat. J. Food Eng. 2013, 117, 361–369. [Google Scholar] [CrossRef]
- Lee, M.G.; Yoon, W.B. Developing an effective method to determine the deviation of F value upon the location of a still can during convection heating using CFD and subzones. J. Food Process Eng. 2014, 37, 493–505. [Google Scholar] [CrossRef]
- Wang, L.; Sun, D. Evaluation of performance of slow air, air blast and water immersion cooling methods in the cooked meat industry by the finite element method. J. Food Eng. 2002, 51, 329–340. [Google Scholar] [CrossRef]
- Geankoplis, C.J. Transport Processes and Separation Process Principles: (Includes Unit Operations), 4th ed.; Prentice-Hall International: Upper Saddle River, NJ, USA, 2014. [Google Scholar]
- Kızıltaş, S.; Erdoğdu, F.; Palazoğlu, T.K. Simulation of heat transfer for solid–liquid food mixtures in cans and model validation under pasteurization conditions. J. Food Eng. 2010, 97, 449–456. [Google Scholar] [CrossRef]
- Smout, C.; Van Loey, A.; Hendrickx, M. Non-uniformity of lethality in retort processes based on heat distribution and heat penetration data. J. Food Eng. 2000, 45, 103–110. [Google Scholar] [CrossRef]
- Simpson, R. Mathematical Estimations of Impact of Thermal Processing on Microbial Inactivation and Quality Retention. In Reference Module in Food Science; Elsevier: Amsterdam, The Netherlands, 2016. [Google Scholar] [CrossRef]
- Rosnes, J.T.; Fernandez, P.S.; Periago, P.M.; Shara, T. Microorganisms of relevance in thermally processed foods. In Progress on Quantitative Approaches of Thermal Food Processing; Nova Science Publishers: New York, NY, USA, 2012. [Google Scholar]
- Wongsa-Ngasri, P.; Sastry, S.K. Tomato peeling by ohmic heating with lye-salt combinations: Effects of operational parameters on peeling time and skin diffusivity. J. Food Eng. 2016, 186, 10–16. [Google Scholar] [CrossRef]
- Karayannakidis, P.D.; Apostolidis, E.; Lee, C.M. Comparison of direct steam injection and steam-jacketed heating in squid protein hydrolysis for energy consumption and hydrolysis performance. LWT-Food Sci. Technol. 2014, 57, 134–140. [Google Scholar] [CrossRef]
- De Bonis, M.V.; Ruocco, G. Heat and mass transfer modeling during continuous flow processing of fluid food by direct steam injection. Int. Commun. Heat Mass Transfer 2010, 37, 239–244. [Google Scholar] [CrossRef]
- El’odé, K.E.; Dornseifer, T.P.; Keith, E.S.; Powers, J.J. Effects of pH and temperature on the carbonyls and aromas produced in heated amino acid-sugar mixtures. J. Food Sci. 1966, 31, 351–358. [Google Scholar] [CrossRef]
- Bae, R.; Lee, Y.; Lee, S. Changes in nutrient levels of aqueous extracts from radish (Raphanus sativus L.) root during liquefaction by heat and non-heat processing. Hort. Sci. Technol. 2012, 30, 409–416. [Google Scholar] [CrossRef]
- Lee, S.; Hwang, I.; Lee, Y.; Joung, E.; Jeong, H.; Lee, H. Physicochemical characteristics and antioxidant activity of heated radish (Raphanus sativus L.) extracts. J. Korean Soc. Food Sci. Nutr. 2009, 38, 490–495. [Google Scholar] [CrossRef]
- De Roeck, A.; Mols, J.; Duvetter, T.; Van Loey, A.; Hendrickx, M. Carrot texture degradation kinetics and pectin changes during thermal versus high-pressure/high-temperature processing: A comparative study. Food Chem. 2010, 120, 1104–1112. [Google Scholar] [CrossRef]
- Pellegrino, R.; Luckett, C.R. Aversive textures and their role in food rejection. J. Texture Stud. 2020, 51, 733–741. [Google Scholar] [CrossRef] [PubMed]


Publisher’s Note: MDPI stays neutral with regard to jurisdictional claims in published maps and institutional affiliations. |
© 2022 by the authors. Licensee MDPI, Basel, Switzerland. This article is an open access article distributed under the terms and conditions of the Creative Commons Attribution (CC BY) license (https://creativecommons.org/licenses/by/4.0/).