Article

Impact of Stakeholders on Lean Six Sigma Project Costs and Outcomes during Implementation in an Air-Conditioner Manufacturing Industry

1
Department of Mechanical Engineering, University of Engineering and Technology, Lahore H9H5+5C7, Pakistan
2
Faculty of Science and Technology, Jan Dlugosz University, PL 42-200 Czestochowa, Poland
*
Authors to whom correspondence should be addressed.
Processes 2022, 10(12), 2591; https://doi.org/10.3390/pr10122591
Submission received: 20 October 2022 / Revised: 6 November 2022 / Accepted: 23 November 2022 / Published: 5 December 2022
(This article belongs to the Section Process Control and Monitoring)

Abstract

:
Modern manufacturing operations always aim toward sustainable production through sustainable operations. Lean Six Sigma manufacturing is one of the leading models to increase operational efficiency and productivity and reduce product manufacturing costs. The lean Six Sigma problem-solving methodology DMAIC has been one of the several techniques organizations use to improve their productivity and the quality of their product and services. This paper aims to apply Lean Six Sigma and DMAIC to enhance production capacity and reduce per-unit cost. Furthermore, this research work has been carried out to analyze the impact of stakeholders on Lean Six Sigma projects. The research follows the DMAIC methodology to investigate and analyze the root cause of the problems and give possible solutions for eliminating or reducing the issues. Particularly, fishbone and 5-Whys techniques were used to determine whether the two key processes, AC Outdoor unit testing with the help of reusable power cords and the un-efficient use of expanding machine, had an impact on low productivity and high per-unit cost. The analysis indicated the importance of stakeholders in lean Six Sigma projects. It has been found that key stakeholders can affect the result of lean Six Sigma projects, e.g., in the power cord modification project, a total of USD 7738 has been lost, while in expanding machine modification project total of USD 1339 has been lost due to ignorance of key stakeholders in both projects. This paper provides practical guidance to lean Six Sigma project team leaders to develop and define the key stakeholders at the beginning of the project and clearly identify the stakeholders’ responsibilities. Furthermore, the project leader must analyze and identify internal and external stakeholders b/c stakeholders may be internal or external. This paper provides theoretical guidance to lean Six Sigma project team leaders since ignoring stakeholders could give a misleading picture in terms of project cost, savings, and duration of the project. The project leader must consider key stakeholders’ costs and future strategies before starting the project. Although some project managers and experts have conducted analyses of stakeholders’ impact on projects, lean Six Sigma literature lacks solid examples of stakeholders’ impact on LSS project results. This study tries to address this research gap by analyzing the impact of key stakeholders on LSS projects.

1. Introduction

Improving organizational productivity is a global challenge; all organizations need to be highly productive to meet customer demand and stay competitive with similar organizations [1]. The Toyota production system initiated lean manufacturing to improve productivity in a production plant. Lean manufacturing aims to produce the product and service at the lowest possible cost and as soon as a customer needs it [2,3]. The lean manufacturing methodology minimizes waste and increases value-added activities while eliminating non-value-added activities. The definition of different terminologies of lean manufacturing, such as lean production, waste, value-added activities, and non-value-added activities, are mentioned in Appendix A, Table A1. Lean manufacturing has several advantages, such as reducing cycle time, lead time, and labor while meeting customer demands and bettering the competitors. Some of the salient benefits of lean manufacturing are presented in Table 1. Several organizations have employed lean manufacturing to enhance productivity. For example, Guo Jiang implemented lean manufacturing in an air conditioning industry in China and improved the line of balance (LOB) from 72.6% to 87.8%, saving RMB 797,051 per month [4]. In addition, Singh and Garg applied lean manufacturing in the manufacturing industry, and the result shows that a 12.62% decrease in process inventory also reduced the workforce by 30% and increased individual productivity by 42.86% [5].
Some essential tools for implementing lean manufacturing are value stream mapping, takt time, single-minute exchange of dies (SMED), 5S, and Kaizen. The lean tools are described in Table A2.
Apart from lean manufacturing, Six Sigma is another technique widely used for waste elimination, process, and product quality improvement, along with achieving customer satisfaction [12]. Six Sigma was first invented at Motorola in 1980 [13,14] and has been adopted by many companies, such as Bank of America, to reduce late transaction problems, encoding errors, and omissions from customers [15]. Caterpillar Inc., Glen Barton, improved profitability [16], and General Electronic saved around USD 400 to 500 million through Six Sigma [17]. According to [18], “Six Sigma is a business tool that enable companies to improve their bottom line by arranging and monitoring business strategy in such way to minimize waste, resources and increase customer satisfaction”. Six Sigma has many advantages, such as reducing defects, reducing product costs by improving processes, and improving the cultural values of the organization while meeting customer demands and bettering the competitors. Some of the salient advantages of Six Sigma are presented in Table 2.
Different tools are used for Six Sigma implementations, such as cause-and-effect analysis (Fishbone), 5-Why, Pareto, and Kanban. Six Sigma tools’ descriptions are mentioned in Table A3.
Although lean manufacturing and Six Sigma improve an organization’s productivity, combining both strategies, referred to as lean Six Sigma (LSS), has shown great promise and benefit for organizations worldwide [26,27]. Lean reduces waste and unimportant steps during production and only focuses on the steps that add value to a product. On the other hand, Six Sigma eliminates defects and verity in the process and ultimately reduces product cost without affecting product quality [27,28]. Several organizations have implemented the lean Six Sigma approach, such as Motorola, General Electric, and Honeywell [29,30]. Lean Six Sigma has many advantages, which are mentioned in Table 3.
There are two widely acknowledged methodologies to implement lean Six Sigma in the combined form [30,35]:
i.
Define, Measure, Analyze, Improve, and Control (DMAIC);
ii.
Define, Measure, Analyze, Design, and Verify (DMADV).
The DMAIC methodology is employed to reduce variation in existing processes, while the DMADV methodology is used to design something new [36]. DMAIC cycle is a popular and important tool of lean Six Sigma and refers to five interconnected phases that can help organizations improve their process [37]. The description, output, tools, and techniques of DMAIC methodology are mentioned in Table A4.
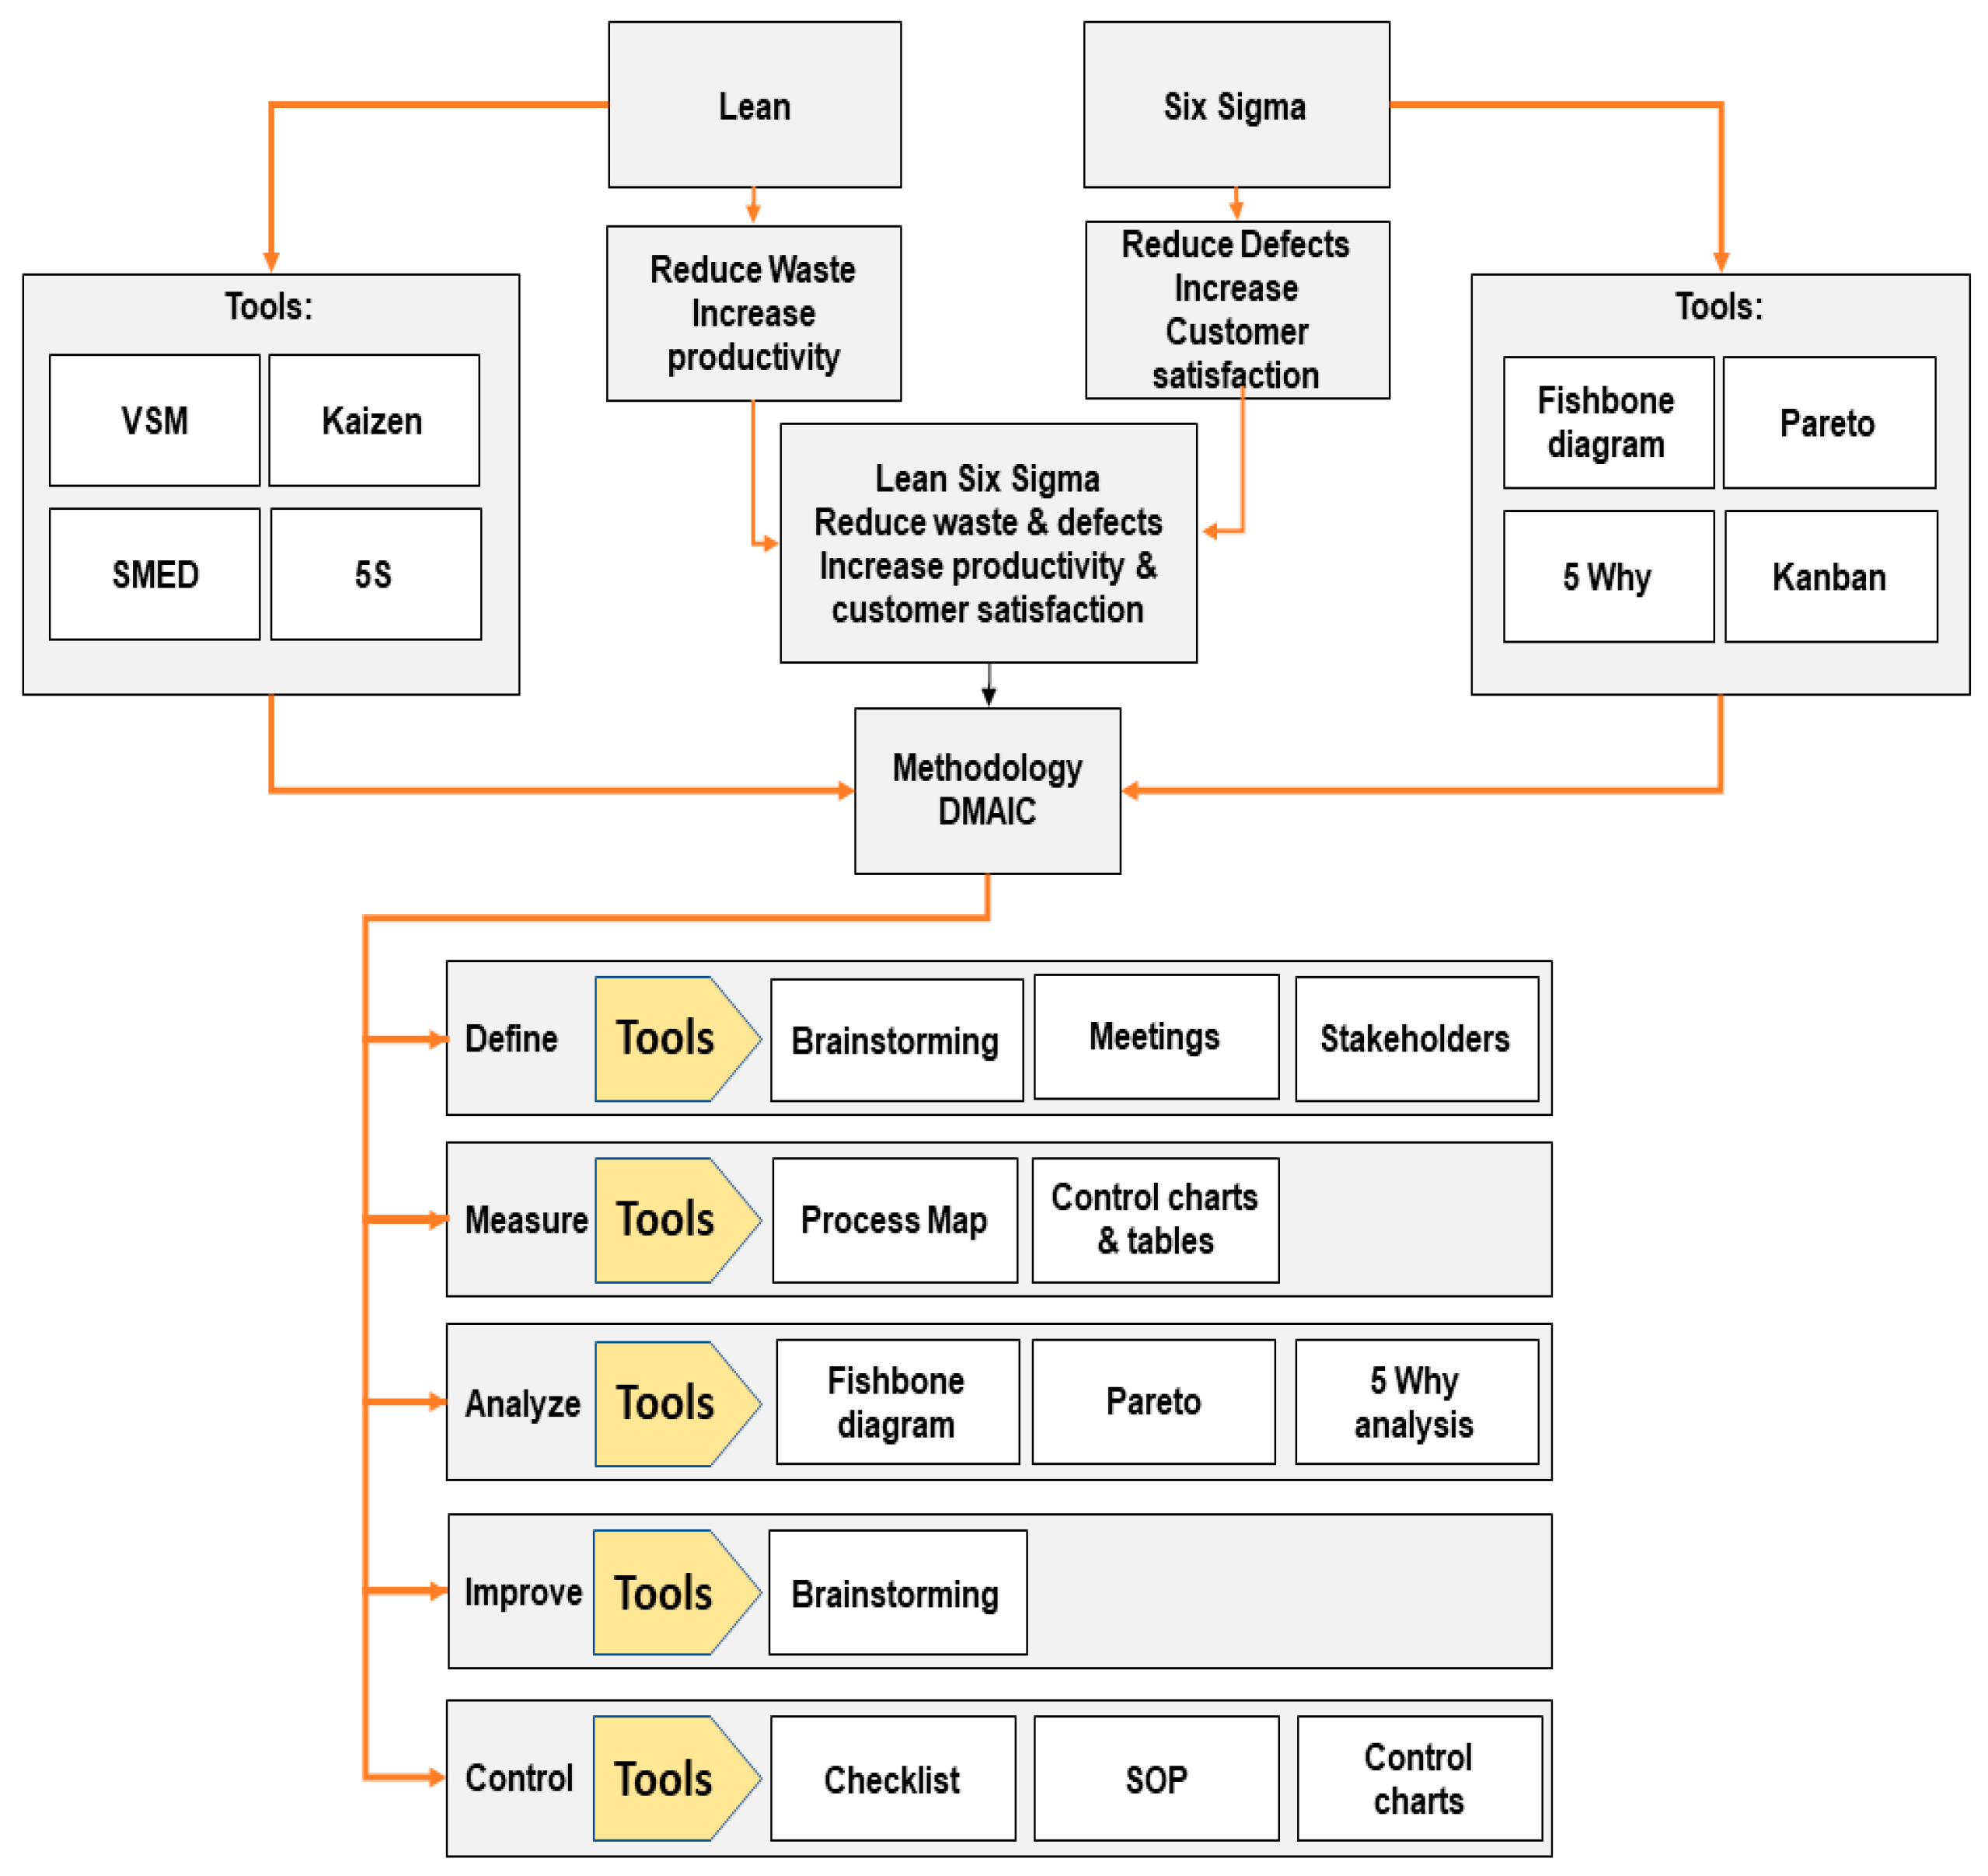
The flow chart of lean Six Sigma is given in Figure 1. Figure 1 shows that lean and Six Sigma are used for different purposes. Lean is used to reduce waste and increase productivity, while Six Sigma allows for reducing defects and variation in the product. Both techniques have other tools that can be applied in the combined form under the DMAIC model. Furthermore, DMAIC has five phases, each with a separate tool and method.
In project management, stakeholders are defined as individuals or organizations, such as sponsors, customers, and the people directly involved in the project, whose participation may positively or negatively affect the completion of the project [38]. A combined economic, financial, and distributive investment is used to find the groups who lose or benefit as a result of the project, and they are called stakeholders [39,40]. The precise identification of stakeholders and their roles in a project is a key factor for the successful implementation of the projects; for example, many projects fail because the project manager or team cannot manage various stakeholders properly [41,42]. Furthermore, by clearly identifying stakeholders’ impact on the project, we can make a more realistic and accurate assessment of the long-term sustainability of the investment [39,40]. Stakeholders can affect the project or its outcomes directly or indirectly, depending on how directly or indirectly they are involved in the project [38]. The active approach to the key stakeholders depends upon the project’s risk assessment [43]. Clear, good, and punctual communication with key stakeholders reduces uncertainty and keeps it at an acceptable level [38].
Including stakeholders in the analysis process takes more time in the beginning but increases the project’s acceptance level [44]. Most researchers observe that incompetent or improper stakeholder selection may lead the lean Six Sigma project to failure [45,46,47,48]. For the successful implementation of the lean Six Sigma project, it is necessary to involve stakeholders at different project stages [49]. Lean Six Sigma researchers acknowledged that it would be difficult to achieve the project’s desired results without a comprehensive agreement with stakeholders during the project [50,51]. Generally, the project failure does not mean that project management is lacking or incompetent but may suggest improper relations and communication between the project stakeholders [52].
The results become more valuable if stakeholder and their role are analyzed and defined in the early stage of DMAIC [45]. Stakeholders should be involved in the decision-making process of the project as per their defined role [45]. For the project’s success, the project team must adequately communicate with project stakeholders on time [53,54].
Cost increasing from the estimated cost is a big problem in most projects, and the involvement of multiple stakeholders having different stakes and authorities makes successful cost management almost impossible in any type of project. Early counseling of key stakeholders in the cost estimation or calculation of any project reduces the risk of cost overrun [55]. Cost calculation is fundamental for any project because it provides a clear understanding of resource management and cost scheduling [56].
To summarize this review, the literature on LSS acknowledges that stakeholders are critical and essential for the successful implementation of LSS projects. There is a need to analyze the importance of stakeholders in LSS projects. Therefore, this study elaborates on the significance of stakeholders using the DMAIC framework in two case studies of LSS projects. The outcome of this research work is to improve productivity and reduce per unit cost with the help of LSS projects and the impact of stakeholders on LSS projects.

2. Methodology

In this paper, an air-conditioning (AC) industry is selected to investigate the effect of stakeholders on the overall implementation of LSS. Two case studies are chosen in this work. The first case study involves outdoor unit testing using air-conditioning with a power cord, while the second case study is related to condenser manufacturing. DMAIC methodology is employed in the current work to investigate the importance of the effect of stakeholders.

2.1. Definitions

Outdoor units of AC are tested through electric testing panels during their manufacturing process to verify their performance against prespecified quality standards. Reusable power cords are employed for the units’ electrical connection with testing panels.
In outdoor unit testing using a power cord, several problems are encountered, such as:
  • High rejection of thimble and terminal-block material;
  • Safety problem (units sparking and possibility of unit kits failure);
  • Several workers on a single process;
  • High process apparatus maintenance;
  • Overprocessing.
In condenser manufacturing, the following several problems are occurring:
  • Running expanding machine continuously 24/7;
  • High energy consumption;
  • Several workers on a single machine in three shifts.
The LSS is implemented in this research to enhance productivity using DMAIC for both case studies. The current process flow and process cycle time, along with the number of employees of a few workstations for case study 1, are given below in Figure 2.
A total of 45 s is required for the following:
  • Power cord connection with units (with the help of fitting three screws);
  • Power cord connection with the testing panel;
  • Disconnecting the power cord from the unit (re-opening of screws).
For case study 2, condenser manufacturing involves expanding machines and welding lines. The current situation analysis is shown in Figure 3. It is shown in Figure 3 that an expanding machine has a design capacity of 800 units (condenser) per shift of 7.5 h, whereas the welding line capacity is 2400 units per shift. Therefore, expanding machine is kept operational 24/7 to meet the demand of the welding line of just one shift.
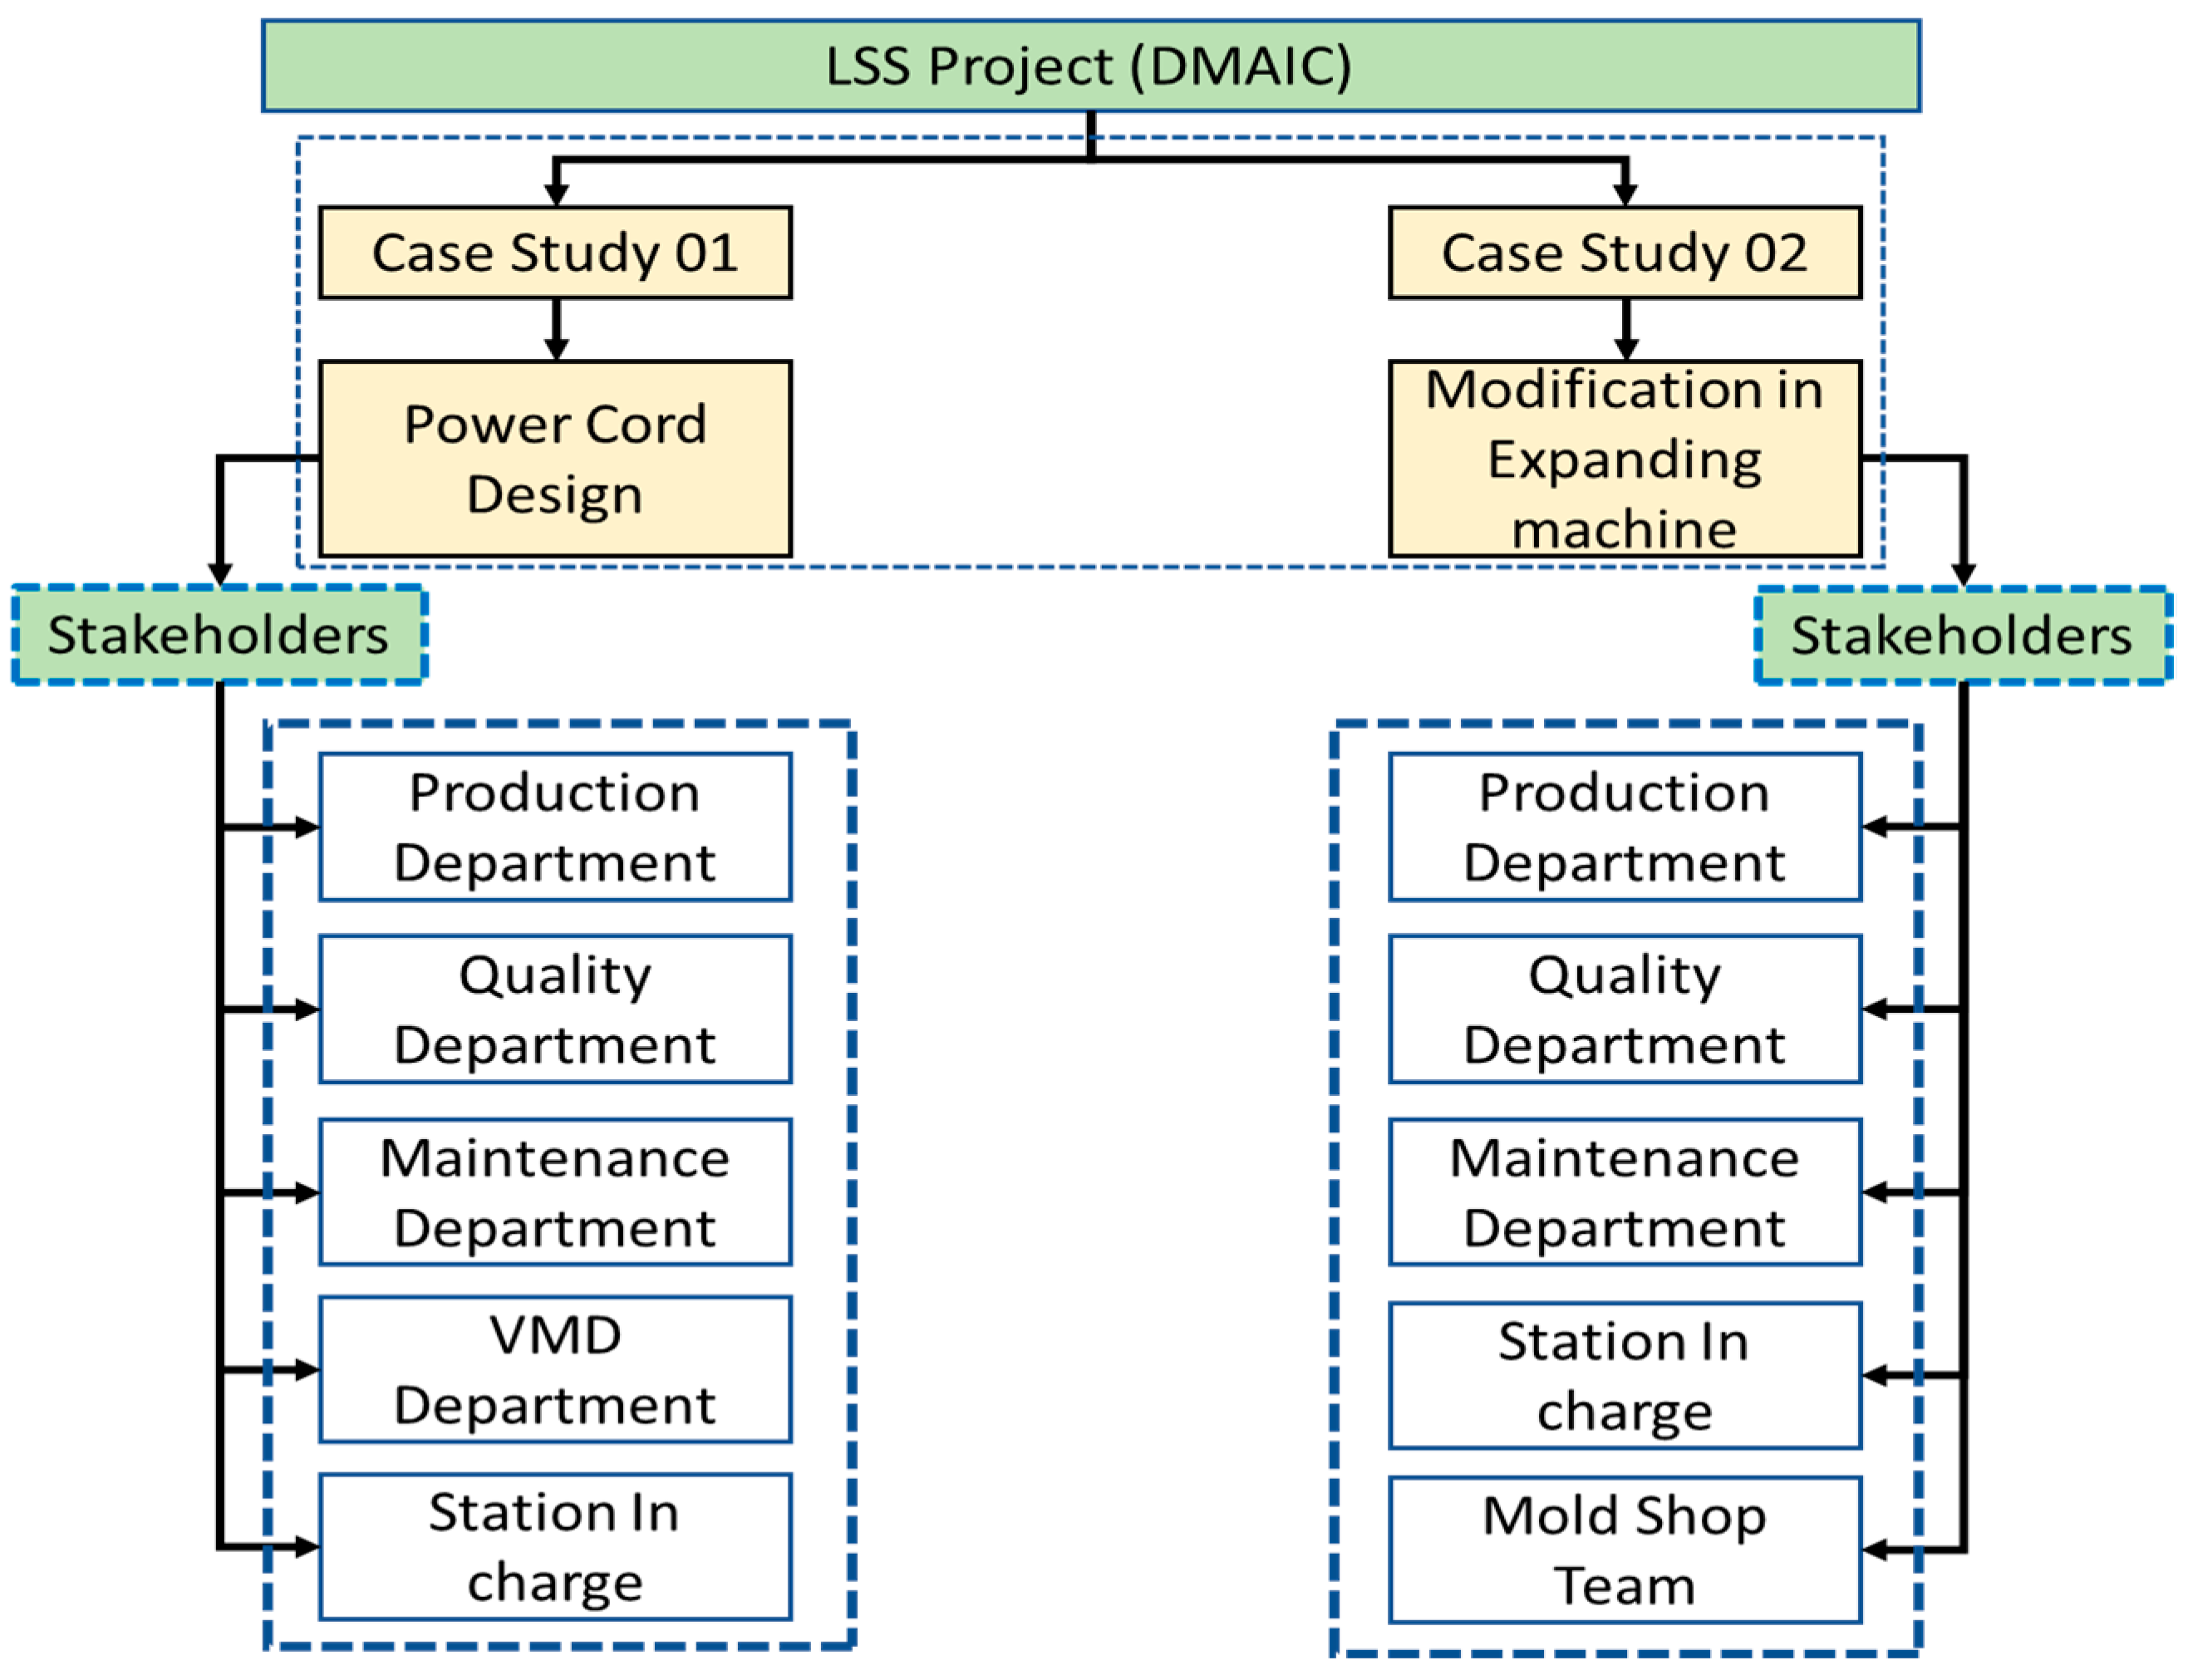
Stakeholders

Key stakeholders defined by the project team for both case studies are given below in Figure 4.
The project team identified some critical stakeholders in the define phase of the project in both case studies, as mentioned in Figure 4, but the project team did not consider some other key stakeholders; for instance, the R &D department was not taken on board while implementing LSS in case study 1. Similarly, the project team did not consider a key stakeholder like the machine supplier that was not taken on board while implementing LSS in case study 2.

2.2. Measure

Data were collected in both case studies after defining the problems. Two project team members were assigned to collect the data from both case studies. In case study 1, the following data are collected during power cord usage in peak production season (from February 2020 until August 2020):
  • Thimble rejection;
  • Terminal block damages;
  • Safety sparking issues.
The result of the measure phase data is presented in Table 4 in Section 3.1.
In case study 2, data were collected in the same period as in case study 1 with the following parameter:
  • Capacity;
  • Unit per hour;
  • Power consumption per unit.
The result of measured data in case study 2 is presented in Table 5 in Section 3.1.
The critical parameters required to analyze and measure the improvement are discussed in Equations (1)–(8).
The capacity is calculated using Equation (1) [57]
c p = t a t t
where cp, ta, and tt represent capacity, available time, and takt time, respectively.
Takt time is calculated using Equation (2) [58]
t t = t a c d  
where cd represents customer demand.
Unit per hour (UPH) is defined as the “production of units in one hour” which is calculated using Equation (3)
U P H = P t H t
where UPH, Pt, and Ht represent unit per hour, total production, and total available hours, respectively.
Unit per person/hour (UPMH), which is defined as “Production quantity produced by one man in one hour”, is calculated using Equation (4) [59]
U P M H = P t M h
where UPMH and Mh represent units per man per hour and total man hours, respectively.
Man hours are calculated using Equation (5) [59]
M h = E n × H w
where En and Hw represent No. of employees and total working hours.
Labor cost is calculated by using Equation (6)
L c = S e P t
where Lc and Se represent labor cost and total labor salaries.
Kilowatts per unit are calculated using Equation (7)
k c = P P t
where kc and P represented total kilowatts consumed and total power, respectively.
Return on investment is calculated using Equation (8)
R i = I t N t
where Ri, It, and Nt represent the return on investment, total investment, and net profit, respectively. DPMO is calculated using Equation (9)
D P M O = [ D U X O ] × 1,000,000
where DPMO is defects per million opportunities, D represents defects, U is units (lot size), and O is defect opportunities [60]. Sigma level (σ) is a representation of the process capability in terms of opportunities and defects [60].

2.3. Analysis

To analyze the root causes of the problem in both case studies, fishbone [61,62] and 5-Why [63] analysis tools of lean Six Sigma are used. In fishbone and 5-Why analysis, the problem is analyzed from a different perspective to obtain the actual reasons and move toward solutions.
The fishbone diagram for a power cord connection with an outdoor unit and testing panels is based on man, the machine method, and material. In contrast, for expanding machines, fishbone is based on man, machine, material, and concept [64]. The results for both fishbone diagrams are shown in Figure 5 and Figure 6, respectively, in Section 3.2. For further investigation of the power cord process, a 5-Why analysis is also conducted, and the result is presented in Figure 7 in Section 3.2.

2.4. Improvement

After pointing out the root causes of the problem in both case studies, eliminate, combine, rearrange, and simplify (ECRS) method is applied to resolve it. ECRS is basically used to simplify the process by eliminating unnecessary steps or works, combining similar processes, and rearranging processes [65]. The project team arranges meetings and brainstorming sessions to identify possible solutions in both cases. During brainstorming sessions following suggestions were discussed for case study 1:
  • To improve the design of the thimble only;
  • To improve terminal block only;
  • To improve the connection procedure of the power cord with the unit;
  • To change the whole design of the power cord.
For case study 2, various scenarios were discussed, such as:
  • Add another new machine to match the welding line capacity;
  • Outsource condenser manufacturing to meet the demand for welding line capacity;
  • Making modifications in the current machine to meet welding line capacity.
In case study 2, the project team also measured the dimensions of the machine and condenser for further understanding, and the result is presented in Table 6 in Section 3.3.

2.5. Control

The purpose of the control phase is to sustain the achievements from processes that have been improved [66]. In this research work, the new processes of both cases have been controlled with the help of the following activities:
  • Training of operators regarding new processes;
  • Display standard procedure on workstations;
  • Lock production capacity based on improved processes.

3. Results and Discussions

3.1. Measure

A total of 4855 problems were reported, of which thimble rejection is at the top, followed by sparking issues and terminal block damages, as shown in Table 4.
Table 4. Summary of problems in the power cord process (Before LLS improvement).
ProblemsUnitNo of Problem
(Feb to Aug)
Percentage % of
Problems
Thimble rejectionNo.210043%
Terminal block damageNo.80317%
Sparking issueNo.195240%
No. of defectsNo.6
No. of unitsNo.135
No. of opportunitiesNo.3
DPMO--14,815
Sigma level (Initial)σ3.7 (taken from [67])
Table 5. Summary of expanding machine data (Before LLS improvement).
ParametersUnitData (Feb to Aug)
CapacityNo.800
Unit Per Hour (UPH)No.100
kW loss per unitkW0.17
No. of unitsNo.1
No. of opportunitiesNo.1
DPMO-170,000
Sigma level (Initial)σ2.4 (Taken from Table [67])
Per unit energy consumptionUSD0.021
Running HoursHrs.24/7
The energy cost per unit (condenser) is USD 0.021, while the machine runs 24/7 to meet welding line demand. Currently, only one condenser is expanding at a time on expanding machine based on machine design capacity.

3.2. Analysis

Major causes related to the problems with the power cord process at the main outdoor assembly line are mentioned in Figure 5.
Figure 5. Fishbone diagram for power cord process.
Processes 10 02591 g005
After considering all the possibilities in both fishbone and 5-Why analysis, it was found that improper or wrong design of the power cord had an impact, causing the problem discussed in case study 1.
Figure 6. Fishbone diagram for expanding machine (Condenser manufacturing).
Processes 10 02591 g006
Figure 7. The 5-Why analysis for power cord process.
Processes 10 02591 g007
In the fishbone analysis mentioned in Figure 7, the problem was analyzed from different angles to obtain the possible causes and a possible solution. There are several possible causes shown in the figure, but based on brainstorming and experience of the project and manufacturing team, it was concluded that the main cause is improper utilization of the machine by expanding only one condenser at a time.

3.3. Improve

After a detailed discussion, the project team decided to change the design of the power cord in such a way as to eliminate the usage of thimble and screws and resolve all related issues because all other suggestions are indirectly connected with the design of the power cord. The decision was based on experience and eliminated the elements or parts that created the problem. The project team then made possible a new drawing/layout of the power cord with the help of the design engineer of the project team. The layout is given below in Figure 8.
In the new power cord design, magnets are used to connect the power cord with a terminal block of AC instead of screws and thimbles.
In case study 2, the project team again arranged meetings and brainstorming sessions to finalize the solution to the problem. The project team also discussed possible solutions mentioned in Section 3.4 with industry management because some suggestions involved high investment. After a detailed discussion and study of the overall situation, the project team decided to make some modifications and rearrange the process for improvement. Before initiating modifications in the machine, the project team calculated the dimension of the machine and condenser, as given in Table 6.
Table 6. Machine and condenser width.
EquipmentUnitWidth
Machinemm1500
Condensermm708
The width of the machine is almost double the width of the condenser, as shown in the table. Based on this calculation, the project team knows that two condensers can be expanded on the machine simultaneously. To expand two condensers on the machine at a time, the project team made the following modifications to the machine, shown in Table 7.

3.4. Control

Now, to control and sustain the new power cord during the process, the project team arranged online training sessions for the operator. The project team initially provided 20 power cords and guided the maintenance person to maintain new power cords regularly. The project team also displayed the procedure for the new power cord on the workstation to control mistakes.
For controlling and sustaining the new process of expanding two condensers on the machine, the project team arranged training sessions for the operator on the workstation. The project team provided all the required expanding rods, sockets, and supporting clamps. The project team also displayed the standard procedure on the workstation.

3.5. Effect of Implementation of LSS (DMAIC)

In the improvement phase, corrective action has been taken in both cases, leading to the improvement of the process. By improving the design of the power cord following parameter has been enhanced, as shown in Table 8. The return on investment (ROI) on a power cord design project is 0.61 years, as shown in Table 8.
Capacity, UPH, and UPMH increased by 14%, while labor cost per unit was reduced by 4%. The labor cost of USD 0.019 has been saved per unit, which means that after the production of 188,802 units, the project investment is returned to the company. In addition, thimble rejection and terminal block damage have been eliminated 100% as there are no thimble and screws used in the new power cord, as shown in Figure 9.
By rearranging the process and making modifications in the machine following parameter has been improved, as shown in Table 9. The machine can now expand two condensers simultaneously, as shown in Figure 10. To fulfill welding line demand, the machine is now run 12/7 instead of 24/7, resulting in savings in employees and energy consumption of one complete shift.
In this case, capacity, UPH, and UPMH increased by 100% while labor and electricity costs were reduced by 33% and 43%, respectively; a total saving of USD 3446. The ROI of the project is 0.13 years. USD 0.022 has been saved per unit, which means that after the production of 40,033 units, project investment is recovered by the company.
The total saving in both case studies is given below in Table 10.

3.6. Stakeholder Effect on the Overall Implementation of LSS

The new power cord is successfully used without facing any problems, and the process becomes very simple and easy. Still, during the following year’s development from the R&D side, the size of the terminal block of the outdoor AC unit was changed, so the new power cords could not be used. In this way, these power cords become useless and a loss for the company; the company then scraps all the power cords and starts the development of new power cords as per requirement for the following year. In this case study, the key stakeholder was the R&D team which was ignored by the project team during the project. The project team then again developed a new drawing of the power cord with the help of the design engineer. Both design drawings of the power cords are shown below in Figure 11.
There is only a dimension difference in each drawing, and everything else is the same. The project team again invested USD 4167 in the new power cord development after the change to the terminal block design prompted by the R&D team, which is a total loss for the company caused by ignoring key stakeholders (R&D in this case) at the beginning of the project.
Similarly, the expansion of a small 1-ton air-conditioner condenser model is performed successfully without facing any problems; the machine capacity becomes doubled and thus reduces labor costs by simultaneously increasing production. Still, when the manufacturing team expanded the two condensers of the big model (2 tons) at the same time, the expanding machine rods became badly damaged. The condensers also become damaged as they need to expand carefully with the required pressure. In this case study, the key stakeholder was the machine supplier, which the project team ignored during the project.
To expand two condensers in the big models (2 tons), the project team again made some more modifications to the machine with the help of the machine supplier. The supplier suggested installing springs in machine dies to properly manage pressure during the expansion process, which was then implemented by the project team, as shown in Figure 12. The total cost of installing the springs and new expanding rods in expanding machine was USD 446, a total loss for the company resulting from ignoring stakeholders at the beginning of the project.
By ignoring key stakeholders in both case studies, the organization faced a loss of USD 9077. The precise amounts lost are given in Table 11.

Net Loss

Net loss caused by ignoring some key stakeholders in both case studies is given below in Table 12. A total of USD 2709 has been lost in both case studies.

4. Conclusions

This paper investigated the impact of stakeholders on the implementation of lean Six Sigma project cost and outcomes. Two case studies—power cord design and expanding machine modification—have been selected for improving productivity, reducing per-unit cost, and investigating the impact of stakeholders on the project. The study involves the implementation of lean Six Sigma principles and the DMAIC problem-solving technique. After the analysis carried out in the analysis phase of DMAIC, it has been found that improper power cord design and inefficient use of expanding machines had a major impact on productivity and per-unit cost.
The application of the DMIAC tool made it possible to improve productivity, reduce per-unit cost, and analyze the impact of stakeholders on the project in five essential phases. During these phases, problems were defined in detail in both case studies, important and necessary data were gathered in both case studies, and the causes of the problems were analyzed with the help of fishbone and 5-Why techniques. After a detailed analysis of the root causes, different improvement measures were proposed and subsequently implemented in the processes. Therefore, both projects significantly improve productivity and reduce per-unit cost.
The following results have been achieved in the first case study project:
  • Capacity improved from 1080 to 1227 (14%);
  • UPH improved from 135 to 153 (14%);
  • UPMH improved from 0.94 to 1.07 (14%);
  • Cost savings of USD 0.019 per unit and a total savings of USD (2923) (4%);
  • Improved Sigma level from 3.7 to 4.7
For the second case study project, the results are given below:
  • Capacity improved from 800 to 1600 (100%);
  • UPH improved from 100 to 200 (100%);
  • UPMH improved from 36 to 71 (100%);
  • Cost saving of USD 0.022 per unit and a total saving of USD (3446) (37%);
  • Improved Sigma level from 2.4 to 6 (kW loss after improvement).
Although the implementation of LSS in both projects resulted in an increase in productivity and reduced per-unit cost, inadequate selection of all stakeholders has impacted the overall outcome of the aforementioned projects. This research has shown that inadequate selection of stakeholders can affect the LSS project. By ignoring the key stakeholder, such as the research and development department in case study 1 (power cord design) and the supplier in case study 2 (expanding machine modification), the project not only failed, but the project cost also increased. For both selected case studies, the total loss was USD 9077. If savings resulting from the implementation of LSS in both projects is included, then the net loss was USD 2709.
The present research has also shown that both internal and external stakeholders must be considered before the implementation of LSS. In the first case study (power cord design), the ignored stakeholder was the R&D department, an internal stakeholder, and in the second case study (expanding machine modification), the ignored stakeholder was the supplier, an external stakeholder.

Suggestions

  • The project team must identify key stakeholders, both internal and external, before starting the LSS projects;
  • The project team must define stakeholders and their responsibilities in the definition phase of DMAIC.
This research could encourage empirical researchers to build links and relations between stakeholder literature and LSS project management literature. Furthermore, this work can help researchers to expand their search to stakeholders in LSS projects. Finally, further research in this area can help to build a theory relating to stakeholder management in LSS projects. This research work is limited to stakeholder importance in LSS projects only.

Author Contributions

Conceptualization, J.S., A.A.K., A.K., A.H., S.M.A., H.U.A. and G.M.U.; methodology, J.S., A.A.K., A.K., A.H., S.M.A., H.U.A. and G.M.U.; software, J.S., A.A.K., A.K., A.H., S.M.A., H.U.A. and G.M.U.; validation, J.S., A.A.K., A.K., A.H., S.M.A., H.U.A., G.M.U. and J.K.; formal analysis, J.S., A.A.K., A.K., A.H., S.M.A., H.U.A. and G.M.U.; investigation, J.S., A.A.K., A.K., A.H., S.M.A., H.U.A. and G.M.U.; resources, J.S., A.A.K., A.K., A.H., S.M.A., H.U.A. and G.M.U.; data curation, J.S., A.A.K., A.K., A.H., S.M.A., H.U.A. and G.M.U.; writing—original draft preparation, J.S., A.A.K., A.K., A.H., S.M.A., H.U.A. and G.M.U.; writing—review and editing, M.S. and J.K.; visualization, J.S., A.A.K., A.K., A.H., S.M.A., H.U.A. and G.M.U.; supervision, J.S., A.A.K., A.K., A.H., S.M.A., H.U.A., G.M.U., M.S. and J.K.; project administration, G.M.U. and J.K.; funding acquisition, M.S. and J.K. All authors have read and agreed to the published version of the manuscript.

Funding

This research received no external funding.

Conflicts of Interest

The authors declare no conflict of interest.

Appendix A

Table A1. Lean manufacturing.
TerminologyDefinitionRef.
Lean ProductionLean production is a method to minimize production wastes by increasing value-added activities and eliminating non-value-added activities with the help of lean principles[20,68]
WasteWaste is anything more than the minimum amount of material, equipment, or time required for production[69]
Value added activitiesValue added is an activity that increases the customer’s benefit from a product or service.
Non-value-added activitiesNon-Value-added action is an activity that does not increase the value of what is delivered to the customer.
Table A2. Tools used for lean manufacturing.
Lean ToolDefinitionRef.
Value stream Mapping (VSM)Value stream mapping is used to analyze the current state of production, design future production states based on the current state map, and clearly identify waste in the production process from current and future production states.[70]
Takt TimeTakt time is the time required to produce a part or a component to meet customer demand. Takt time depends upon demand; if demand increases, takt time decreases, and vice versa.[71,72]
Single-minute exchange of die (SMED)Single-minute exchange of time is an essential tool in lean manufacturing that reduces change over time to a single minute. It consists of phases 1, the current situation, phase 2, the separation of internal and external activities, and phase 3, shifting from internal to external activities.[73]
5S5S is the foundation of lean manufacturing used to improve manufacturing procedures. 5S is a Japanese word that means Sort, Set in Order, Shine, Standardize, and Sustain.[73]
KaizenKaizen is a Japanese word that means continuous improvement and is used to eliminate waste continuously and improve efficiency.[74]
Table A3. Tools used for Six Sigma.
Six Sigma ToolsDescriptionRef.
Cause and effect analysis (fishbone)The fishbone diagram, also called Ishikawa or cause and effect diagram, is used to analyze the problem from different aspects to identify the root causes that create or contribute to the problem. [61,62]
5-WhyThe 5-Why analysis is used to identify root cause analysis; in this analysis, someone asks why an activity is performed and continues asking why after each answer or response[63]
ParetoPareto is a bar chart in which the length of the bar represents the frequency, cost, or money and arranges the bars from longest to shortest from left to right side while the line represents the percentage of problems[75]
KanbanKanban is a tool to improve the visual management of workflow in production systems.[76,77]
Table A4. DMAIC Detail [23].
PhaseDescriptionOutputTools and Technique
Define
  • Problem identification,
  • Current situation definition
  • Definition of objectives
  • Identification of stakeholders
  • Project timeline
  • Project team
  • Project goals
  • Brainstorming
  • Meetings
Measure
  • Data collection of the current problem
  • Target settings
  • Initial assessment
  • No of problems
  • Process map
  • Charts, tables
Analyze
  • Collected data analysis
  • Root cause analysis
  • Relation between variables
  • Basic reasons for the problem
  • Fishbone diagram
  • Pareto analysis
  • 5-Why analysis
Improve
  • Identification of solutions
  • Implementation of solutions
  • Corrective action
  • Problem elimination
  • Brainstorming
Control
  • Sustainability of improvement
  • Project closure communication
  • Standardization
  • Monitoring plan
  • Checklist
  • SOP
  • Control charts

References

  1. Pritchard, R.D. Organizational productivity. In Handbook of Industrial and Organizational Psychology; Consulting Psychologists Press: Palo Alto, CA, USA, 1992; Volume 3, pp. 443–471. [Google Scholar]
  2. Bhamu, J.; Sangwan, K.S. Lean manufacturing: Literature review and research issues. Int. J. Oper. Prod. Manag. 2014, 34, 876–940. [Google Scholar] [CrossRef]
  3. Palange, A.; Dhatrak, P. Lean manufacturing a vital tool to enhance productivity in manufacturing. Mater. Today Proc. 2021, 46, 729–736. [Google Scholar] [CrossRef]
  4. Guo, W.; Jiang, P.; Xu, L.; Peng, G. Integration of value stream mapping with DMAIC for concurrent Lean-Kaizen: A case study on an air-conditioner assembly line. Adv. Mech. Eng. 2019, 11, 1687814019827115. [Google Scholar] [CrossRef] [Green Version]
  5. Singh, B.; Garg, S.K.; Sharma, S.K.; Grewal, C. Lean implementation and its benefits to production industry. Int. J. Lean Six Sigma 2010, 1, 157–168. [Google Scholar] [CrossRef]
  6. Kovach, J.; Stringfellow, P.; Turner, J.; Cho, B.R. The house of competitiveness: The marriage of agile manufacturing, design for Six Sigma, and lean manufacturing with quality considerations. J. Ind. Technol. 2005, 21, 1–10. [Google Scholar]
  7. Kumar, N.; Hasan, S.S.; Srivastava, K.; Akhtar, R.; Yadav, R.K.; Choubey, V.K. Lean manufacturing techniques and its implementation: A review. Mater. Today Proc. 2022, 64, 1188–1192. [Google Scholar] [CrossRef]
  8. Vijayakumar, S.R.; Suresh, P. Lean based cycle time reduction in manufacturing companies using black widow based deep belief neural network. Comput. Ind. Eng. 2022, 173, 108735. [Google Scholar] [CrossRef]
  9. Nasution, A.A.; Siregar, I.; Nasution, T.H.; Syahputri, K.; Tarigan, I.R. Lean Manufacturing applications in the manufacturing industry. In MATEC Web of Conferences; EDP Sciences: Les Ulis, France, 2018. [Google Scholar]
  10. Chiarini, A. Sustainable manufacturing-greening processes using specific Lean Production tools: An empirical observation from European motorcycle component manufacturers. J. Clean. Prod. 2014, 85, 226–233. [Google Scholar] [CrossRef]
  11. Womack, J.P.; Jones, D.T. Beyond Toyota: How to root out waste and pursue perfection. Harv. Bus. Rev. 1996, 74, 140–172. [Google Scholar]
  12. Kaushik, P.; Khanduja, D. Application of Six Sigma DMAIC methodology in thermal power plants: A case study. Total Qual. Manag. 2009, 20, 197–207. [Google Scholar] [CrossRef]
  13. Delsanter, J.M. Six Sigma. Manag. Serv. Qual. 1992, 2, 203. [Google Scholar] [CrossRef]
  14. Barney, M. Motorola’s second generation. Six Sigma Forum Mag. 2002, 1, 13–16. [Google Scholar]
  15. Hajikordestani, R.N. A Taxonomy of Lean Six Sigma Success Factors for Service Organizations; University of Central Florida: Orlando, FL, USA, 2010. [Google Scholar]
  16. Fink, R.; Bevington, N. How Caterpillar uses 6 Sigma to execute strategy. Strateg. Financ. 2010, 91, 25. [Google Scholar]
  17. Basu, R.; Wright, J.N. Quality beyond Six Sigma; Routledge: Oxfordshire, UK, 2012. [Google Scholar]
  18. Schroeder, R.G.; Linderman, K.; Liedtke, C.; Choo, A.S. Six Sigma: Definition and underlying theory. J. Oper. Manag. 2008, 26, 536–554. [Google Scholar] [CrossRef]
  19. Klefsjö, B.; Wiklund, H.; Edgeman, R.L. Six Sigma seen as a methodology for total quality management. Meas. Bus. Excell. 2001, 5, 31–35. [Google Scholar] [CrossRef]
  20. Eskandari, M.; Hamid, M.; Masoudian, M.; Rabbani, M. An integrated lean production-sustainability framework for evaluation and improvement of the performance of pharmaceutical factory. J. Clean. Prod. 2022, 376, 134132. [Google Scholar] [CrossRef]
  21. Shanmugaraja, M.; Nataraj, M.; Gunasekaran, N. Quality and productivity improvement using Six Sigma and Taguchi methods. Int. J. Bus. Excell. 2011, 4, 544–572. [Google Scholar] [CrossRef]
  22. Gijo, E.V.; Antony, J.; Kumar, M.; McAdam, R.; Hernandez, J. An application of Six Sigma methodology for improving the first pass yield of a grinding process. J. Manuf. Technol. Manag. 2014, 25, 125–135. [Google Scholar] [CrossRef]
  23. Girmanová, L.; Šolc, M.; Kliment, J.; Divoková, A.; Mikloš, V. Application of Six Sigma using DMAIC methodology in the process of product quality control in metallurgical operation. Acta Technol. Agric. 2017, 20, 104–109. [Google Scholar] [CrossRef] [Green Version]
  24. Linderman, K.; Schroeder, R.G.; Zaheer, S.; Choo, A.S. Six Sigma: A goal-theoretic perspective. J. Oper. Manag. 2003, 21, 193–203. [Google Scholar] [CrossRef]
  25. Breyfogle, F.W.; Meadows, B. Bottom-line success with Six Sigma. Qual. Prog. 2001, 34, 101–104. [Google Scholar]
  26. Corbett, L.M. Lean Six Sigma: The contribution to business excellence. Int. J. Lean Six Sigma 2011, 2, 118–131. [Google Scholar] [CrossRef]
  27. Thomas, A.J.; Francis, M.; Fisher, R.; Byard, P. Implementing Lean Six Sigma to overcome the production challenges in an aerospace company. Prod. Plan. Control. 2016, 27, 591–603. [Google Scholar] [CrossRef]
  28. Dumitrescu, C.; Dumitrache, M. The impact of Lean Six Sigma on the overall results of companies. Econ. Ser. Manag. 2011, 14, 535–544. [Google Scholar]
  29. Timans, W.; Antony, J.; Ahaus, K.; van Solingen, R. Implementation of Lean Six Sigma in small-and medium-sized manufacturing enterprises in the Netherlands. J. Oper. Res. Soc. 2012, 63, 339–353. [Google Scholar] [CrossRef]
  30. Costa, L.B.M.; Godinho Filho, M.; Fredendall, L.D.; Ganga, G.M.D. The effect of Lean Six Sigma practices on food industry performance: Implications of the Sector’s experience and typical characteristics. Food Control. 2020, 112, 107110. [Google Scholar] [CrossRef]
  31. Panat, R.; Dimitrova, V.; Selvamuniandy, T.S.; Ishiko, K.; Sun, D. The application of Lean Six Sigma to the configuration control in Intel’s manufacturing R&D environment. Int. J. Lean Six Sigma 2014, 5, 444–459. [Google Scholar]
  32. Kalkar, P.; Chitanand, A. Dealing the Sustainability Challenges with Lean Six Sigma Framework. Int. J. Manag. 2018, 9, 21–31. [Google Scholar]
  33. Indrawati, S.; Ridwansyah, M. Manufacturing continuous improvement using lean six sigma: An iron ores industry case application. Procedia Manuf. 2015, 4, 528–534. [Google Scholar] [CrossRef] [Green Version]
  34. Vinodh, S.; Gautham, S.G.; Ramiya, R.A. Implementing lean sigma framework in an Indian automotive valves manufacturing organisation: A case study. Prod. Plan. Control. 2011, 22, 708–722. [Google Scholar] [CrossRef]
  35. Brue, G. McGraw-Hill 36-Hour Course: Six Sigma; McGraw-Hill Education: New York, NY, USA, 2006. [Google Scholar]
  36. Zhang, M.; Wang, W.; Goh, T.N.; He, Z. Comprehensive Six Sigma application: A case study. Prod. Plan. Control. 2015, 26, 219–234. [Google Scholar] [CrossRef]
  37. Rahman, A.; Shaju, S.U.C.; Sarkar, S.K.; Hashem, M.Z.; Hasan, S.K.; Mandal, R.; Islam, U. A case study of six sigma define-measure-analyze-improve-control (DMAIC) methodology in garment sector. Indep. J. Manag. Prod. 2017, 8, 1309–1323. [Google Scholar] [CrossRef] [Green Version]
  38. Johansen, A.; Eik-Andresen, P.; Ekambaram, A. Stakeholder benefit assessment–Project success through management of stakeholders. Procedia-Soc. Behav. Sci. 2014, 119, 581–590. [Google Scholar] [CrossRef] [Green Version]
  39. Jenkins, G.P. Evaluation of stakeholder impacts in cost-benefit analysis. Impact Assess. Proj. Apprais. 1999, 17, 87–96. [Google Scholar] [CrossRef]
  40. Aramovich, N.P.; Blankenship, J.R. The relative importance of participative versus decisive behavior in predicting stakeholders’ perceptions of leader effectiveness. Leadersh. Q. 2020, 31, 101387. [Google Scholar] [CrossRef]
  41. Bourne, L.; Walker, D.H.T. Visualising and mapping stakeholder influence. Manag. Decis. 2005, 43, 649–660. [Google Scholar] [CrossRef]
  42. Surachman, E.N.; Perwitasari, S.W.; Suhendra, M. Stakeholder management mapping to improve public-private partnership success in emerging country water projects: Indonesia’s experience. Util. Policy 2022, 78, 101411. [Google Scholar] [CrossRef]
  43. Ward, S.; Chapman, C. Stakeholders and uncertainty management in projects. Constr. Manag. Econ. 2008, 26, 563–577. [Google Scholar] [CrossRef]
  44. Macharis, C. The importance of stakeholder analysis in freight transport. Eur. Transport 2005, 114–126. [Google Scholar]
  45. Sunder, M.V. Lean six sigma project management—A stakeholder management perspective. TQM J. 2016, 28, 132–150. [Google Scholar] [CrossRef]
  46. Elias, A.A. Stakeholder analysis for Lean Six Sigma project management. Int. J. Lean Six Sigma 2016, 7, 394–405. [Google Scholar] [CrossRef]
  47. Bryde, D.J.; Schulmeister, R. Applying Lean principles to a building refurbishment project: Experiences of key stakeholders. Constr. Manag. Econ. 2012, 30, 777–794. [Google Scholar] [CrossRef] [Green Version]
  48. Antony, J.; Lizarelli, F.L.; Fernandes, M.M. A Global study into the reasons for Lean Six Sigma project failures: Key findings and directions for further research. IEEE Trans. Eng. Manag. 2020, 69, 2399–2414. [Google Scholar] [CrossRef]
  49. Psychogios, A.G.; Atanasovski, J.; Tsironis, L.K. Lean Six Sigma in a service context: A multi-factor application approach in the telecommunications industry. Int. J. Qual. Reliab. Manag. 2012, 29, 122–139. [Google Scholar] [CrossRef]
  50. Laureani, A.; Antony, J.; Douglas, A. Lean six sigma in a call centre: A case study. Int. J. Product. Perform. Manag. 2010, 59, 757–768. [Google Scholar] [CrossRef] [Green Version]
  51. Albliwi, S.; Antony, J.; Lim, S.A.H.; van der Wiele, T. Critical failure factors of Lean Six Sigma: A systematic literature review. Int. J. Qual. Reliab. Manag. 2014, 31, 1012–1030. [Google Scholar] [CrossRef]
  52. Ahmed, Z.; Kumar, U.; Kumar, V. Managing critical success factors for IS implementation: A stakeholder engagement and control perspective. Can. J. Adm. Sci. 2018, 35, 403–418. [Google Scholar] [CrossRef]
  53. Elias, A.A.; Cavana, R.Y.; Jackson, L.S. Stakeholder analysis for R&D project management. RD Manag. 2002, 32, 301–310. [Google Scholar]
  54. Lee, M.T.; Raschke, R.L. Stakeholder legitimacy in firm greening and financial performance: What about greenwashing temptations?☆. J. Bus. Res. 2023, 155, 113393. [Google Scholar] [CrossRef]
  55. Doloi, H.K. Understanding stakeholders’ perspective of cost estimation in project management. Int. J. Proj. Manag. 2011, 29, 622–636. [Google Scholar] [CrossRef]
  56. Carr, R.I. Cost-estimating principles. J. Constr. Eng. Manag. 1989, 115, 545–551. [Google Scholar] [CrossRef]
  57. Jacobs, F.R.; Chase, R.B.; Lummus, R.R. Operations and Supply Chain Management; McGraw-Hill/Irwin: New York, NY, USA, 2014. [Google Scholar]
  58. Seth, D.; Gupta, V. Application of value stream mapping for lean operations and cycle time reduction: An Indian case study. Prod. Plan. Control. 2005, 16, 44–59. [Google Scholar] [CrossRef]
  59. Schreyer, P.; Pilat, D. Measuring productivity. OECD Econ. Stud. 2001, 33, 127–170. [Google Scholar]
  60. Tenera, A.; Pinto, L.C. A Lean Six Sigma (LSS) project management improvement model. In Procedia—Social and Behavioral Sciences; Elsevier: Amsterdam, The Netherlands, 2014. [Google Scholar]
  61. Ilie, G.; Ciocoiu, C.N. Application of fishbone diagram to determine the risk of an event with multiple causes. Manag. Res. Pract. 2010, 2, 1–20. [Google Scholar]
  62. Yu, F.; Huang, G.; Ni, H.; Nie, Z.; Li, W.; Li, J.; Jiang, W. Analysis of the main factors affecting bottom hole assembly Re-entry into main hole in forward drilling of fishbone wells. J. Pet. Sci. Eng. 2020, 189, 107018. [Google Scholar] [CrossRef]
  63. Gangidi, P. A systematic approach to root cause analysis using 3 × 5 why’s technique. Int. J. Lean Six Sigma 2019, 10, 295–310. [Google Scholar] [CrossRef]
  64. Knop, K.; Mielczarek, K. Using 5W-1H and 4M Methods to Analyse and Solve the Problem with the Visual Inspection Process-case study. In MATEC Web of Conferences; EDP Sciences: Les Ulis, France, 2018. [Google Scholar]
  65. Suhardi, B.; Anisa, N.; Laksono, P.W. Minimizing waste using lean manufacturing and ECRS principle in Indonesian furniture industry. Cogent Eng. 2019, 6, 1567019. [Google Scholar] [CrossRef]
  66. Omachonu, V.K.; Ross, J.E. Principles of Total Quality; CRC Press: Boca Raton, FL, USA, 2004. [Google Scholar]
  67. 100pceffective. Six Sigma Conversion Table. 2022. Available online: https://www.100pceffective.com/wp-content/uploads/6-Sigma-Conversion-Table.pdf (accessed on 2 November 2022).
  68. Sundar, R.; Balaji, A.N.; Kumar, R.S. A review on lean manufacturing implementation techniques. Procedia Eng. 2014, 97, 1875–1885. [Google Scholar] [CrossRef] [Green Version]
  69. Taj, S. Lean manufacturing performance in China: Assessment of 65 manufacturing plants. J. Manuf. Technol. Manag. 2008, 19, 217–234. [Google Scholar] [CrossRef]
  70. Seth, D.; Seth, N.; Dhariwal, P. Application of value stream mapping (VSM) for lean and cycle time reduction in complex production environments: A case study. Prod. Plan. Control. 2017, 28, 398–419. [Google Scholar] [CrossRef]
  71. Rahani, A.R.; Al-Ashraf, M. Production flow analysis through value stream mapping: A lean manufacturing process case study. Procedia Eng. 2012, 41, 1727–1734. [Google Scholar] [CrossRef] [Green Version]
  72. Zhang, W.; Hou, L.; Jiao, R.J. Dynamic takt time decisions for paced assembly lines balancing and sequencing considering highly mixed-model production: An improved artificial bee colony optimization approach. Comput. Ind. Eng. 2021, 161, 107616. [Google Scholar] [CrossRef]
  73. Chabowski, P.; Rewers, P.; Trojanowska, J. Impact of shortening changeover times on manufacturing flexibility. In Proceedings of the 7th International Technical Conference Technological Forum 2016, Prague, Czech Republic, 28–30 June 2016. [Google Scholar]
  74. Alukal, G. Lean kaizen in the 21st century. Qual. Prog. 2007, 40, 69. [Google Scholar]
  75. Wilkinson, L. Revising the Pareto chart. Am. Stat. 2006, 60, 332–334. [Google Scholar] [CrossRef]
  76. Anderson, D.J. Kanban: Successful Evolutionary Change for your Technology Business; Blue Hole Press: Chicago, IL, USA, 2010. [Google Scholar]
  77. Weflen, E.; MacKenzie, C.A.; Rivero, I.V. An influence diagram approach to automating lead time estimation in Agile Kanban project management. Expert Syst. Appl. 2022, 187, 115866. [Google Scholar] [CrossRef]
Figure 1. Flowchart for lean Six Sigma.
Processes 10 02591 g001
Figure 2. Outdoor unit testing process flow.
Processes 10 02591 g002
Figure 3. The capacity of expanding machine and welding line.
Processes 10 02591 g003
Figure 4. Key stakeholders.
Processes 10 02591 g004
Figure 8. Drawing/layout of the power cord.
Processes 10 02591 g008
Figure 9. Old and new power cord.
Processes 10 02591 g009
Figure 10. Before and after comparison of expanding machine.
Processes 10 02591 g010
Figure 11. Before and after drawing of power cord.
Processes 10 02591 g011
Figure 12. Spring installed in expanding machine.
Processes 10 02591 g012
Table 1. Lean manufacturing and its outcome.
AdvantagesRef.
Lean manufacturing is an excellent way to simultaneously meet customer demands and have a competitive edge.[6,7]
Lean manufacturing is used to reduce cycle time and labor and increase efficiency. It is also used to reduce inventory.[5,8]
Lean manufacturing is used to reduce product lead time in manufacturing industries.[9]
Lean manufacturing eliminates waste from production, including product design, customer relations, and factory management.
Lean manufacturing eliminates anything that does not add value to the product.
[10,11]
Lean manufacturing is also used to reduce the environmental impact of the product.[10]
Lean manufacturing improves line of balance (LOB) and increases net profit through cost saving.[4]
Table 2. Six sigma and its outcome.
AdvantagesRef.
Six Sigma is widely used to reduce costs with the help of process and product improvement.[18,19,20]
Six Sigma is used to reduce or eliminate defects from processes and products and to increase the precision of small products such as grinders, gloves, etc.[20,21,22]
Six Sigma reduces defects frequency from 3.4 defects per million and improves the Six Sigma level.[21,23]
Six Sigma is also used to improve the cultural values of an organization.[24]
Six Sigma also improves logistics, human resources, purchasing processes, etc.[25]
Six Sigma is a revolutionary technique that continuously improves the process through statistical tools [12]
Table 3. Lean six sigma and its outcome.
AdvantagesRef.
Lean Six Sigma is used to reduce costs with the help of process and product quality improvement.
It is also used to reduce new product launching time.
Lean Six Sigma reduces the impact of the product on the environment.
[28]
Lean Six Sigma successfully reduces idle time in R&D projects.[31]
Lean Six Sigma helps on-time delivery of the product to the market.
Lean Six Sigma reduces value-added and non-value-added activities time.
[27]
The utilization of lean Six Sigma is a key framework for achieving sustainability[32]
Lean Six Sigma is used to improve manufacturing process capability and capability index.[33]
Lean Six Sigma can reduce setup changeover time and increase equipment efficiency.[34]
Table 7. Modifications in expanding machine.
#DescriptionFromToIncrease Quantity
1Increase no of expanding rods64Processes 10 02591 i00196Processes 10 02591 i00432
2Increase no of sockets32Processes 10 02591 i00248Processes 10 02591 i00516
3Small supporting clamp replaced by large clamps Processes 10 02591 i003 Processes 10 02591 i006
Table 8. Results of power cord design improvement.
#DescriptionUnitBeforeAfterIncrease/
Decrease
Improvement
%
1Takt time of lineSec2522(3)12%
2Capacity of lineNo.1080122714714%
3Unit per hour (UPH)No.1351531814%
4No. of defectsNo.62(4)
5No. of unitsNo.13515318
6No. of opportunitiesNo.330
7DPMO 14,8154357
8Sigma level (final)σ3.74.71
9No. of employeesNo.143137(6)4%
10Unit per man per hour (UPMH) 0.941.070.1314%
11Labor cost per unit (saving)USD0.450.43(0.019)4%
12Total savings (6 months)USD69,65466,732(2923)4%
13Total investmentUSD 3571
14Estimated productionNo. 309,000
15ROI (time)Year 0.61
16ROI (production quantity)No. (188,802)
Table 9. Results of expanding machine improvement.
#DescriptionUnitBeforeAfterIncrease/
Decrease
Improvement
%
1Capacity of machineNo.8001600800100%
2Unit per hour (UPH)No.100200100100%
3kW loss per unitNo.0.170
4No. of unitNo.11
5No. of opportunitiesNo.11
6DPMO 170,0000
7Sigma level (Final)σ2.46
8No. of working shiftsNo.32(1)33%
9No. of EmployeesNo.96(3)33%
10Unit per man per hour (UPMH)No.367136100%
11Energy consumption per unit (kW)USD0.0210.012(0.009)43%
12Cost saving from labor (6 months)USD61714114(2057)33%
13Cost saving from energy consumption (6 months)USD32271848(1389)43%
14Total savings (6 months)USD94095963(3446)37%
15Per unit savingUSD0.0610.039(0.022)37%
16Total investmentUSD 893
17Estimated productionNo 309,000
18ROI (Time)Year 0.13
19ROI (production quantity)No. 40,033
Table 10. Total saving.
DescriptionUnitPeriodAmount
Savings amount in case study 1USD6 months2923
Savings amount in case study 2USD6 months3446
Total savings in both case studies 6 months6368
Table 11. Amounts lost due to the lack of stakeholders’ involvement.
DescriptionUnitCost
Power cord initial development costUSD3571
Improvement in power cord after R&D changesUSD4167
Expanding the M/C initial cost to modificationsUSD893
Improvement in expanding M/C after supplier suggestionUSD446
Total LossUSD9077
Table 12. Net loss in LSS project.
DescriptionUnitAmount
Total savings in the projectUSDUSD 6368
Total loss in projectUSDUSD 9077
Net loss in projectUSDUSD 2709
Publisher’s Note: MDPI stays neutral with regard to jurisdictional claims in published maps and institutional affiliations.

