Abstract
The distribution and evolution of air in airliner cabins is an important basis for the study of cabin thermal environment and pollutant propagation. Due to the complex heat and mass transfer problems caused by forced and natural convection in a large-scale space, the accurate prediction of air distribution in airliner cabins still faces huge challenges. This study takes the cabin of the Airbus A320 as the research object. The accurate numerical simulation of the flow and heat transfer process in an airliner cabin under mixing ventilation mode was carried out using the Hybrid Thermal Lattice Boltzmann Method (HTLBM) combined with GPU (Graphics Processing Unit) acceleration technology, and the influence of human thermal plumes on air distribution and evolution characteristics in an airliner cabin was analyzed. The research shows that the human thermal plume changes the air distribution in the passenger cabin. The thermal plume slows down the jet attenuation, increases the energy exchange in the area near the passengers, and offsets the jet trajectory. The airflow self-locking effect is easier to form in the passenger breathing area, which increases the time for the flow field to develop into the steady state. The influence of human thermal plumes on the airflow distribution in the passenger cabin cannot be ignored.
1. Introduction
The cabin environment of the airliner is characterized by a complex structure, narrow space, and dense personnel. The influence of passenger heat dissipation with the ambient air temperature difference caused by the thermal plume on the organization and distribution of the cabin airflow cannot be ignored [1]. With people’s increasingly demanding requirements for thermal comfort, how to optimize the airflow organization and further improve the environmental quality in the cabin is an important research topic in the field of thermal management in the cabin.
At present, most of the ventilation systems used in the cabin adopt the principle of mixing ventilation. The supply jet is blown into the cabin with a high momentum to form a sandwich layer for air recirculation; it is effectively mixing to dilute the air and create a clean environment before the air leaves the cabin. However, the airflow forms vortices in some areas of the cabin in mixing ventilation systems, causing the airflow self-locking phenomenon formed by airflow stagnation. The air pollutants spread are easily locked and repeatedly transmitted by the airflow in the self-locking area, which greatly increases the risk of transmission in the cabin. Zhao et al. [2] found that compared with other areas in the cabin, the human body’s exhaled carbon dioxide concentration was relatively high in the airflow self-locking area in their study. Bosbach et al. [3,4] of the German Aerospace Center took the A320 cabin as the research object, experimentally studied the flow heat transfer problem in the cabin under mixing ventilation and displacement ventilation, and conducted experimental research on the displacement ventilation in the cabin of a real passenger airliner. The results show that the low airspeed provided by displacement ventilation can better control the air temperature. As the main heat source in the cabin, the interaction between the human thermal plume and the air supply jet is the basic characteristic of the air distribution in the mixing ventilation mode in the cockpit of an airliner. Kühn et al. [5] used large-scale tracer Particle Image Velocimetry (PIV) technology to conduct an experimental study in a full-size A380 cabin model and found that different fluxes affect the interaction between the thermal plume and supply air jet in the cabin. Cao et al. [6] measured and compared the difference in the two-dimensional cross-section flow field structure of the human body in a Boeing 767–300 cabin under isothermal cooling conditions. The cabin airflow is characterized by low speed and high turbulence intensity, and the influence of the thermal plume makes the large vortex flow in the cabin develop into a stable small vortex flow. Furthermore, Yan et al. [7] found that passenger heat dissipation has a significant impact on the overall and local flow fields in the cabin, which changes the transport trajectory of exhaled particles, making the particles released by passengers with window seats stay in the breathing area of other passengers for a longer time.
Previous studies mainly focused on the steady-state or time–mean distribution characteristics of air distribution in airliner cabins through experimental measurement or numerical simulation [8,9,10,11,12]. However, due to the interaction of supply air jets and thermal plumes, the airflow has significant unsteady characteristics, which affects human comfort and the dynamic process of pollutant propagation. Liu et al. [13] simulated the unsteady characteristics of the human thermal plume in an enclosed space and found from the energy spectrum of the velocity fluctuation that the thermal plume mainly fluctuated at a low frequency of 1 Hz with an obvious intermittent phenomenon. In a cabin environment without ventilation, the research results of Li et al. [14] showed that the development of the human thermal plume has a certain periodicity, appearing successively every 5 s, and the fluctuation in thermal plume velocity in different periods reveals the multiscale characteristics of the thermal plume. For the Boeing 737–200 airliner cabin, Wang et al. [15] used MINI-Particle Imaging Velocimetry (MINI-PIV) systems to measure the time-scale characteristics of the human thermal plume in the seven-row cabin, which analyzes the unsteady and chaotic behavior of human thermal plume and its oscillation characteristics from the chaos theory. However, the understanding of the unsteady characteristics of airflow structure and the influence mechanism of the air self-locking phenomenon in the passenger cabin needs to be further improved, and less attention has been paid to the evolution process of airflow structure under the coupling effect of thermal plume and supply air jet on the time scale. Thermal comfort and pollutant transmission are not only reflected in the stable spatial characteristics but also, more importantly, in the dynamic change law in the time scale.
Based on this, with the support of the National Numerical Wind Tunnel Foundation of China (NNW), this study takes the Airbus A320 cabin as the research object to accurately predict the convective heat transfer problem under the coupling effect of human thermal plume and supply air jet in the mixing ventilation systems in the airliner cabin. The purpose of this study is to obtain the three-dimensional fine flow heat transfer characteristics of air distribution and the evolution characteristics under the influence of human thermal plumes to provide a certain reference for the fine design of thermal management systems in the airliner cabin.
2. Numerical Model and Method
2.1. Numerical Model
Previous studies [16,17] have pointed out that in the typical air supply mode, the results are in good agreement with the experimental data when analyzing the cabin air-flow field simulated only in one row. To save computer resources and computing time, the cabin model is simplified. In this study, the numerical model is shown in Figure 1, which is modeled based on the Airbus A320 cabin, where the periodic boundary condition is set to represent the infinite-length cabin model, a row of economy classes is selected for analysis, and the local location is appropriately simplified. The maximum sizes of the cabin in the X, Y, and Z directions are 3.9 m × 2.2 m × 0.9 m, respectively, and the width of each seat is 0.4 m, whereas the width of the center aisle is 0.44 m. The height of the passenger’s head (when seated) is approximately 1.1 m from the floor. The air inlets are located at the luggage rack positions, 1.6 m above the floor, and are discharged through the exhaust port at the bottom of the side wall, where the outlets are the pressure boundary. According to ASHRAE 161-2018 [18], the aircraft cabin ventilation system should ensure the minimum air supply rate of 9.4 L/s per passenger, and the air supply speed in this study is 1 m/s. Six simplified manikins are placed on the seat, which is the main heat source in the cabin. The thermal boundary of the manikins was set as a fixed temperature boundary, each manikin is divided into 8 segments according to the difference in heat loss, and each segment has its temperature boundary. The temperature is set according to the research results of Dusan et al. [19] as shown in Table 1, and the initial cabin environment T0 = 298 K, V0 = 0.
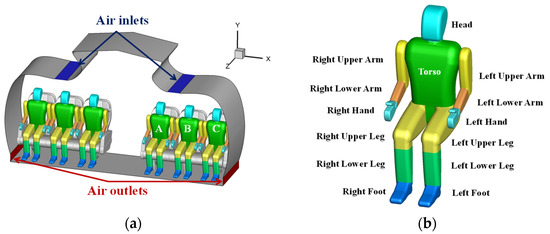
Figure 1.
Cabin numerical model: (a) schematic diagram of the cabin model with passengers; (b) the distribution of body segments.

Table 1.
Boundary conditions.
2.2. Hybrid Thermal Lattice Boltzmann Method for Predicting Cabin Heat Transfer Characteristics
Due to the simulation of the convective heat transfer process in an airliner cabin involving multiscale flow in a complex space, there are many problems, such as complicated grid generation, coupling of multi-physical influence mechanisms, and difficulty in balancing computational efficiency and accuracy. It is difficult to use commercial software such as FLUENT, Open-Foam, and THESEUS-FE to show the convective heat transfer process in the cabin. Given the natural parallelism of LBM itself, its algorithm perfectly matches the GPU of the Single Instruction Multi-Thread (SIMT) parallel mode. In addition, the boundary of complex geometric configurations can be processed more concisely and effectively. According to the pre-processing results of the geometric weights of the near-wall lattice points, the appropriate particle reflection model can accurately describe the boundary information of fluid passing through the wall, such as mass, momentum, and energy flow [20,21]. Therefore, in combination with GPU to achieve large-scale parallel computing, LBM has more advantages [22,23].
Therefore, according to the characteristics of the research object, the calculation was carried out in combination with the HTLBM calculation program independently developed by the research group. The D3Q19 model (Figure 2) is adopted, and the evolution equation of the flow field is as follows:
where and are the particle distribution function and the equilibrium state distribution function, respectively, represents the particle discrete speed, is the time step, is the dimensionless escape time, is the discrete velocity space external force term, and the external force term using the Buick-Greated model [24] is expressed as:
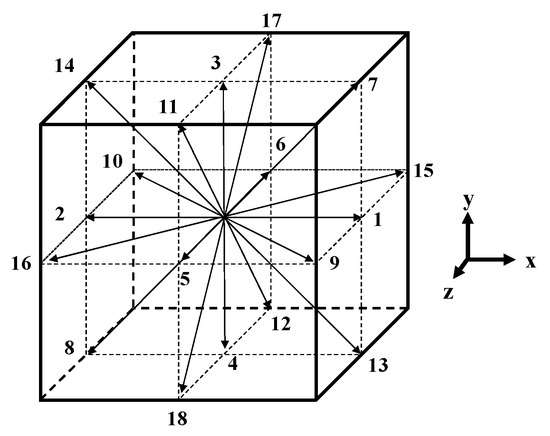
Figure 2.
Schematic diagram of the D3Q19 model.
Furthermore, to recover the corresponding macroscopic N-S equation, the equilibrium state distribution function is defined as follows:
For the natural convection heat transfer process in the airliner cabin affected by gravity, the assumed buoyancy term expression is adopted as:
where is density, is gravity acceleration, is the thermal expansion coefficient, is fluid temperature, and is cabin inlet temperature. In addition, in the Buick-Greated model, the macroscopic density and velocity are expressed as:
The temperature field is calculated using finite difference, and the basic form of the energy equation is:
where is the thermal diffusion coefficient. Dimensionless Equation (7) to realize the convection-diffusion equation and the lattice Boltzmann equation synergy:
The convection term and the diffusion terms of the convective-diffusion Equation (7) adopt the QUICK and second-order central differential schemes, respectively.
To ensure the stability of the numerical calculation, the time step of the finite difference should meet the following two conditions:
- (1)
- CFL condition limitation:
- (2)
- Restriction condition of the diffusion term:
This determines that the final time step should meet:
Therefore, the time interval is Δt = 0.1 s, and the unsteady calculation time of 420,347 time steps is about 200 s, and each time step includes the calculation of flow and heat transfer.
In addition, considering the complex geometry and multiscale flow characteristics in the airliner cabin, Large-eddy Simulation (LES) was used for the turbulence model, which removes vortices smaller than the filter width or given physical width from the wave-number space or physical space in the Navier-Stokes equation, and the governing equation of the large vortices can be obtained by the expression as follows:
The standard Smagorinsky subgrid stress (SGS) model [25] is applied to the fluid flow and heat flow, and the SGS stress is:
The subgrid viscosity can be calculated as:
2.3. Numerical Simulations for Validation
To verify the accuracy of the numerical method, this study adopted a benchmark experimental case [26] as validation. The numerical model geometry, as shown in Figure 3, is L × W × H = 0.8 m × 0.4 m × 0.4 m. Its inlet and outlet are the same size, and the centers are located at z = 0.36 m and z = 0.04 m on the measuring plane (y = 0.2 m), respectively. The inlet air velocity was v = 0.225 m/s when the flow field was stable, and the velocity distribution at the measured location and plane was compared with the experimental results, which show that the algorithm seems to be quite feasible.
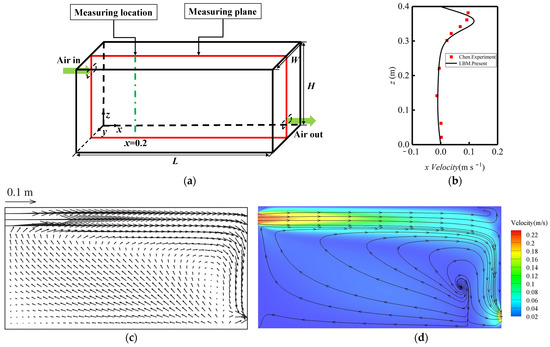
Figure 3.
Numerical model and calculation results: (a) schematic of the ventilation chamber; (b) measured and predicted x direction velocities at measuring location (red squares denote the reference experimental data [26], black solid lines denote the simulation result using the LBM); (c) typical airflow pattern in the model room measured with experiment [26]; (d) typical air flow pattern in the model room simulated using LBM.
3. Numerical Results and Discussion
To analyze the distribution characteristics of the airflow tissue in the lower cabin, the manikin was set as the adiabatic and non-isothermal heat dissipation boundary. Three groups of cases were set, where case 1 represents human body insulation, case 2 represents the working condition of the human body non-isothermal heat dissipation and an air supply speed of 1 m/s, case 3 represents the human body non-isothermal heat dissipation and an air supply speed of 1.5 m/s. For the interface processing of the complex geometric configurations inside the cabin, the cross-scale prediction method for an aircraft cabin thermal environment established in a previous work [27] was adopted to generate a standard Cartesian grid, and the boundary information of the complex configurations is accurately mapped onto standard lattice points for calculation. In this study, the cabin model calculates the number of grids: nx × ny × nz = 640 × 360 × 160, and all calculations were accelerated using two Tesla A100 GPU s.
3.1. Distribution Characteristics of Airflow Organization
Considering that the cabin’s internal structure and flow field characteristics have a certain symmetry, half of the cabin structure is taken for analysis, as shown in Figure 1a, and passengers are marked as A, B, and C. Figure 4 shows the distribution of the flow lines in the cabin when the manikins’ adiabatic and non-isothermal heat dissipation are considered. On the whole, in the mixing ventilation systems, fresh air enters the cabin in the form of a jet and absorbs the surrounding air, forming a self-locking area of airflow around passengers B and C and the cabin roof. In addition, when the human body is adiabatic, the airflow near the human body is blocked and the jet effect is weakened, and the airflow moves through the passenger breathing area to the side wall of the cabin. The cabin airflow pattern is determined by forced convection and influenced by the geometry of the body and the seat. The thermal plume significantly affects the air distribution in the cabin. The human thermal plume formed by the heat dissipation of the human body generates upward thermal buoyancy, which makes the airflow move upward near the human body, and the airflow forms a large-scale circulation surrounding passengers A, B, and C in the passenger area, and the air mixing effect in the cabin is enhanced. Furthermore, the thermal plume adds extra momentum to the jet, slowing its attenuation and shifting the jet path toward the top of the cabin. The thermal plume from the legs of the human body drives part of the airflow upward before reaching the air outlets then participates in the circulation of airflow in the cabin again, increasing the recirculation area in the cabin.
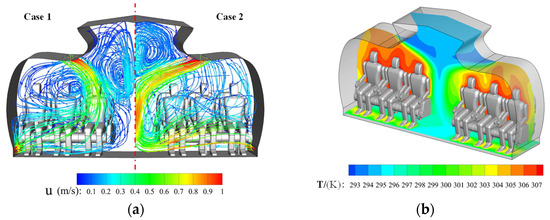
Figure 4.
Numerical results of cabin steady velocity and temperature field: (a) streamline; (b) temperature field (case 2).
The temperature distribution in the cabin showed obvious stratification, forming local high-temperature areas near the manikins and the side walls of the cabin. The airflow flows around the passengers and seats are blocked, which reduces the convective heat transfer. Under the action of large-scale circulation and intake jet entrainment, the airflow with a low velocity in this region is mainly natural convection, and the high-temperature air cannot be discharged in time, which leads to a poor heat transfer effect in the circulation and self-locking area and heat accumulation. Furthermore, compared with the cold air in the air inlet, the temperature of the cold air from the air inlet is higher when it reaches the side wall of the cabin because of the convective heat transfer of the airflow through the other passengers.
To compare the distribution characteristics of airflow under differences in human thermal boundary, this study selected six representative vertical positions in the cabin and analyzed the distribution of relevant parameters along the cabin height, as shown in Figure 5. P1~P3 are located in front of the passenger’s torso, and P4~P6 are located between the front of the body and the seat back. In addition, five planes were selected. Plane1 and Plane2 are located at z = 0.6Lz and z = 0.8Lz respectively, and Plane3, Plane4, and Plane5 are sections of the passengers’ respiratory zones.
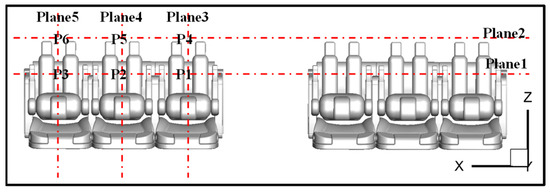
Figure 5.
Schematic diagram of analysis position.
To better compare the influence of thermal plumes on the flow field distribution, the cabin is divided into different areas according to the characteristics of internal structure and airflow. Figure 6 shows the cabin roof position of the flow field structure. Compared with the adiabatic condition (Case 1), the influence of the human body thermal effect reduces the airflow distribution area of the self-locking region, which makes the vortex center shift and the airflow self-locking zone concentrate in the roof of the cabin. Limited by the geometric configuration of the cabin, the approximate shape of the self-locking zone changes from triangle to oval.
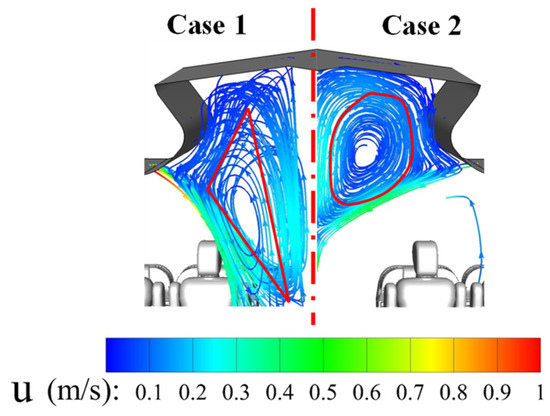
Figure 6.
Streamline distribution in the cabin roof area.
Figure 7 shows the jet velocity and vorticity nephogram diagram of the jet flow field in the Plane2 section under adiabatic and non-isothermal heat dissipation conditions of the human body. Compared with the jet centerline locus of the adiabatic condition, the jet centerline locus occurs when the human body heat in the cabin is at the top of the migration, there is a slow attenuation, the jet stream to aisle position is at a high speed, and the flow rate is higher than the thermal insulation of the region in the cross-section of passenger speed. The vorticity can be used to further characterize the mixing effect of cabin air flows. The formula of vorticity is:
where represents the y-direction velocity; represents the x-direction velocity, the color indicates the rotation direction of the vortex, and the interface of positive and negative vorticity indicates the jet centerline.
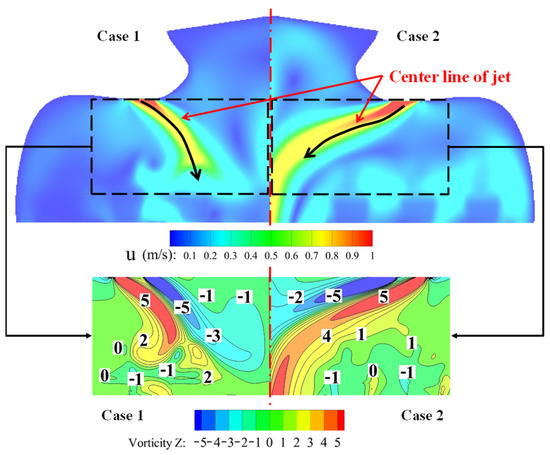
Figure 7.
Jet velocity and vorticity nephogram diagram.
According to the results in Figure 4a, the position between passengers A and B is under the air inlet, and the high air inlet speed makes the jet flow under both conditions dominated by inertial force. The thermal plume strengthens the entrainment and mixing of the jet to the surrounding air, which increases the vorticity and velocity of the non-isothermal jet between passengers B and C. The pressure difference is caused by the uneven velocity on both sides of the jet centerline, which leads to the upward offset of the jet trajectory and slows down the attenuation of the jet. In addition, combined with Figure 4, the flow direction of the thermal plume in this area is consistent with that of the large-scale circulation on the whole. The jet adds additional driving force to strengthen the energy transfer to the surrounding air, thus increasing the area of the jet.
Compared with the airflow distribution in the adiabatic condition, the thermal plume greatly changes the airflow distribution in the passenger breathing area. As shown in Figure 8, the thermal plume drives the airflow around passengers to move upward along the manikin surface, increasing the flow velocity around the manikin. The thermal plume is coupled with the jet flow from the air inlet and the large-scale circulation in the cabin and forms a self-locking area in the breathing area, especially at passenger A. The thermal plume generated by passenger A cannot penetrate the air intake jet at the manikin head height. The upward thermal plume interacts with the downward flow of the air intake jet and forms a self-locking area in the breathing area, showing a strong mixing effect. The large-scale circulation velocity at passengers B and C is smaller, and the self-locking region has a larger distribution area.
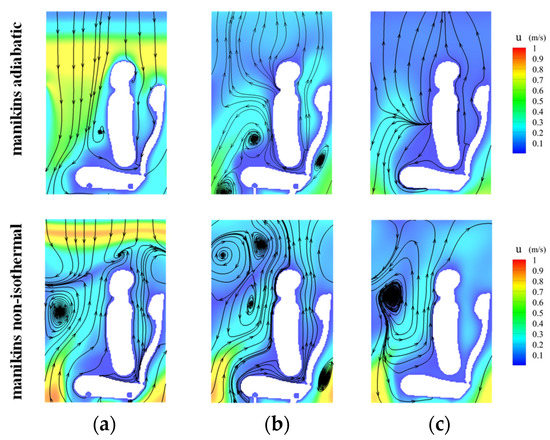
Figure 8.
Velocity distribution of passenger breathing area: (a) passenger A; (b) passenger B; (c) passenger C.
Figure 9 shows the velocity distribution at different positions, and the discontinuous part indicates that the velocity through the seat is zero. The air velocity is stratified along the height of the cabin. Compared with the adiabatic condition of the manikin, the air velocity around the body is higher when the manikin non-isothermal heat dissipation, especially at the position near the air inlet, and the obstructed air velocity of the manikin and the seat is higher at the position far away from the manikin. Due to the influence of heat dissipation from the legs, the airflow along the body surface makes the air velocity above the passenger’s head (P1~P3) higher than that at positions P4~P6. In addition, the self-locking of airflow at the head height weakens the jet effect, making the air velocity at positions P1, P2, P4, and P5 lower.
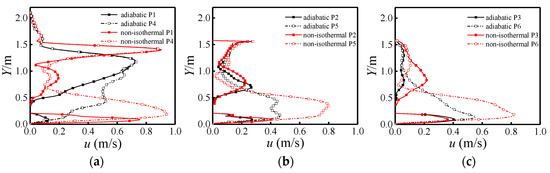
Figure 9.
Passenger position velocity distribution during adiabatic and non-isothermal conditions of the manikins: (a) passenger A; (b) passenger B; (c) passenger C.
When the air supply velocity increases, the forced convection is strengthened, and when the flow field reaches a steady state, the airflow forms a self-locking area in the passenger breathing area. Moreover, at different air supply speeds, the coupling effects of the air supply jet and hot plume are inconsistent, resulting in deviations in the distribution position of the air self-locking region, as shown in Figure 10.
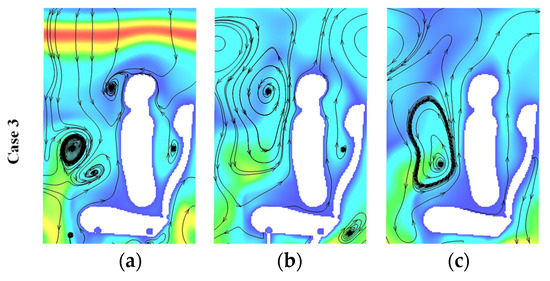
Figure 10.
Case 3 velocity distribution of passenger breathing area: (a) passenger A; (b) passenger B; (c) passenger C.
3.2. Evolution Characteristics of Airflow Organization
As shown in Figure 11, the instantaneous velocity fields at four different time points were selected to study the transient characteristics of cabin air distribution under the influence of the human thermal plume. At the initial time (t = 1~10 s), when the thermal plume is formed, the airflow has similar flow characteristics in the jet area. Compared with the adiabatic condition, the airflow has an upward flow trend around the human body. In the development stage of the thermal plume (t = 10~30 s), the airflow in the cabin is under the joint effect of the air intake jet, and the thermal plume shows a strong mixing effect at t = 10 s. The airflow velocity in the area around the manikins increases significantly, and when the air supply speed increases, the jet deflects to the aisle faster. With the continuous development of the thermal plume (t = 30~100 s), the interaction between the jet and the thermal plume gradually overflows to a steady state, and an obvious upward airflow is formed in the area around the human body. Because of the adherent effect, the airflow velocity on the wall of the cabin luggage rack decreases. The airflow velocity in the body area below the jet is higher than that at the top of the aisle, and the centerline of the jet shifts and reaches the aisle position, making the position of the self-locking area shift. However, the flow field structure in the adiabatic case has similar characteristics after t = 30 s, with less fluctuation in the velocity distribution, and the flow field can reach the steady state faster.
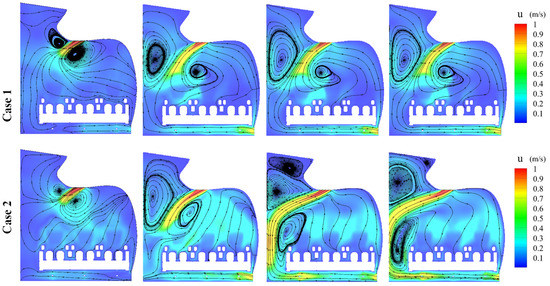
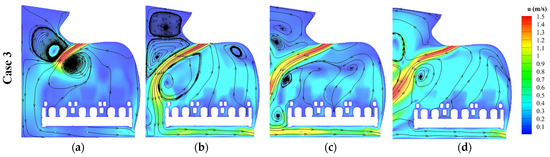
Figure 11.
The instantaneous velocity distribution of the Plane1: (a) t = 1 s; (b) t = 10 s; (c) t = 30 s; (d) t = 100 s.
The instantaneous vorticity distribution in Figure 12 indicates that after the airflow enters the cabin (t = 1 s), the jet is dominated by inertia force. Under the two human thermal boundary conditions, the vorticity distribution in the jet area is consistent and has similar flow characteristics, and the airflow has a strong energy exchange around the human body due to the influence of human heat dissipation. With the development of the thermal plume (t = 10 s), the mixing effect of the thermal plume and inlet jet increases, increasing the vortex area and increasing the wind speed in the passenger area. As the forward shear area, the jet reaches the passage area (t = 30~100 s), which essentially explains the result of Figure 7. As the cold air enters the cabin, the interaction between the thermal plume and jet gradually develops into a stable state, and the vortex distribution near the manikins tends to be stable.
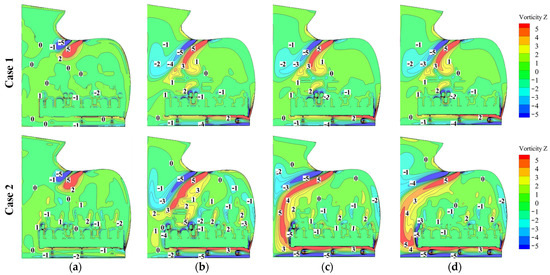
Figure 12.
The instantaneous vorticity distribution of Plane1: (a) t = 1 s; (b) t = 10 s; (c) t = 30 s; (d) t = 100 s.
Figure 13 shows the velocity distribution of the human body under different thermal boundary conditions at different positions in the Plane1 section. The influence of the thermal plume at the same time makes the velocity in the cabin increase, and the velocity distribution near the head is larger. Passenger A was on the jet path, and the airflow was mainly forced convection, so there was little difference in the velocity distribution between human body heat insulation and heat dissipation, where the maximum velocity was the center point of the jet. Compared with time t = 10 s, the height of the jet center shifts upward with the development of the thermal plume (t = 30 s), which also confirms the results in Figure 7. For passengers B and C, at the same position, the thermal plume is in the formation stage (t = 10 s) with a large speed, and the thermal plume drives the airflow around the passengers upward and promotes large-scale circulation in the cabin. In the adiabatic case, the velocity around the passengers has a good consistency after t = 30 s, and the airflow can develop into a steady state faster. The influence of the thermal plume increases the process of the airflow in the cabin reaching a steady state.
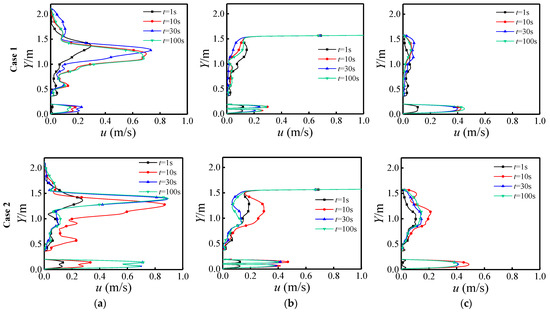
Figure 13.
Instantaneous velocity distribution at different positions in Plane1: (a) P1; (b) P2; (c) P3.
4. Conclusions
In this study, taking the cabin of an Airbus A320 airliner as the research object, the study on the flow and heat transfer characteristics of the manikins under mixing ventilation systems was carried out, and the differences in the organization distribution and evolution characteristics of airflow in the airliner cabin under different thermal boundary conditions (manikins are adiabatic and non-isothermal) were compared and analyzed. The main conclusions are as follows:
(1) The airflow pattern in the cabin is determined by the forced convection from the air inlet and is affected by the human body and the seat geometry. The thermal plume caused by the temperature difference between the heat dissipation of the human body and the surrounding air slows down the attenuation of the jet at different air supply velocities, and the centerline of the jet shifts to the cabin top, promoting the flow of large-scale circulation in the cabin, and the airflow forms a complete large vortex surrounding passengers in the cabin.
(2) The coupling effect of the air inlet jet and thermal plume has significantly changed the organization form of the cabin airflow. It is easy to form a self-locking area of airflow in the respiratory section of passengers, which can easily lead to the accumulation and an increase in the transmission risk of pollutants. The influence of the human thermal effect on the organization distribution of cabin airflow cannot be ignored.
(3) The thermal dissipation of the human body strengthens the energy exchange of airflow around passengers, leading to heat accumulation and forming a local high-temperature area over the window-seat passengers and the side wall of the cabin. The interactions between the thermal plume and jet range from strong to weak and then go to steady. Moreover, the time to reach the steady state of the flow field in the cabin with manikins that are adiabatic is shorter than that when the manikins are non-isothermal.
Author Contributions
Conceptualization, Z.Y.; methodology, Z.Y. and G.X.; software, Z.Y. and C.Z.; validation, Z.Y. and G.X.; formal analysis, Y.G. and Y.D.; investigation, Z.Y. and G.X.; resources, Y.G.; data curation, Z.Y. and C.Z.; writing—original draft preparation, Z.Y.; writing—review and editing, Y.G. and Y.D.; visualization, Z.Y.; supervision, Y.G. and Y.D.; project administration, Y.D.; funding acquisition, Y.G. and Y.D. All authors have read and agreed to the published version of the manuscript.
Funding
This research was supported by the National Key Research and Development Program of China (No. 2019YFA0405202) and the National Numerical Wind Tunnel Foundation of China.
Data Availability Statement
Not applicable.
Acknowledgments
The results of this study could not have been possible without the efforts of the staff on the research team, and at the same time, the authors sincerely thank Yanxia Du for her help in data processing and writing the manuscript.
Conflicts of Interest
The authors declare that they have no conflict of interest.
References
- Brent, A.; Settles, G.S. A Computational and Experimental Investigation of the Human Thermal Plume. J. Fluids Eng. Trans. ASME 2006, 128, 1251–1258. [Google Scholar]
- Li, M.X.; Zhao, B.; Tu, J.Y.; Yan, Y.H. Study on the carbon dioxide lockup phenomenon in airliner cabin by computational fluid dynamics. Build. Simul. 2015, 8, 431–441. [Google Scholar] [CrossRef]
- Bosbach, J.; Heider, A.; Dehne, T. Flight Testing of Alternative Ventilation Systems for Airliner Cabins. In New Results in Numerical and Experimental Fluid Mechanics IX; Springer International Publishing: Berlin/Heidelberg, Germany, 2014; Volume 28, pp. 275–283. [Google Scholar]
- Bosbach, J.; Heider, A.; Dehne, T. Evaluation of cabin displacement ventilation under flight conditions. In Proceedings of the 28th Congress of the International Council of the Aeronautical Sciences in ICAS2012, Paper 304. Brisbane, Australia, 23–28 September 2012. [Google Scholar]
- Kühn, M.; Bosbach, J.; Wanger, C. Experimental parametric study of forced and mixed convection in a passenger airliner cabin mock-up. Build. Environ. 2009, 44, 961–970. [Google Scholar] [CrossRef]
- Cao, X.D.; Liu, J.J.; Pei, J.J.; Zhang, Y.; Li, J.Y.; Zhu, X.L. 2D-PIV measurement of airliner cabin air distribution with a high spatial resolution. Build. Environ. 2014, 82, 9–19. [Google Scholar] [CrossRef]
- Yan, Y.H.; Li, X.D.; Tu, J.Y. Effects of passenger thermal plume on the transport and distribution characteristics of airborne particles in an airliner cabin section. Sci. Technol. Built Environ. 2016, 22, 153–163. [Google Scholar] [CrossRef]
- Singh, A.; Mohammad, H.; Hosi, R.H. Numerical simulation of airflow in an airliner cabin section. ASHRAE Trans. 2002, 108, 1005–1013. [Google Scholar]
- Baker, A.; Ericson, S.; Orzechowski, J. Airliner Passenger Cabin ECS-117 Generated Ventilation Velocity and Mass Transport CFD Simulation: Velocity Field Validation. J. IEST 2006, 49, 51–83. [Google Scholar] [CrossRef]
- Li, J.Y.; Cao, X.D.; Liu, J.J.; Wang, C.C. Global airflow field distribution in a cabin mock-up measured via large-scale 2D-PIV. Build. Environ. 2015, 93, 234–244. [Google Scholar] [CrossRef]
- Liu, W.; Wen, J.Z.; Chao, J.Y.; Yin, W.Y. Accurate and high-resolution boundary conditions and flow fields in the first-class cabin of an MD-82 commercial airliner. Atmos. Environ. 2012, 56, 33–44. [Google Scholar] [CrossRef]
- Zhang, Z.; Chen, X.; Mazumdar, S.; Zhang, T.F. Experimental and numerical investigation of airflow and contaminant transport in an airliner cabin mockup. Build. Environ. 2009, 44, 85–94. [Google Scholar] [CrossRef]
- Liu, Y.L.; Liu, Z.X.; Luo, J.S. Numerical Investigation of the Unsteady Thermal Plume around Human Body in Closed Space. Procedia Eng. 2015, 121, 1919–1926. [Google Scholar] [CrossRef]
- Li, J.Y.; Liu, J.J.; Wang, C.C.; Jiang, N. PIV methods for quantifying human thermal plumes in a cabin environment without ventilation. J. Vis. 2017, 20, 535–548. [Google Scholar] [CrossRef]
- Wang, C.C.; Liu, J.J.; Li, J.Y.; Li, F. Chaotic behavior of human thermal plumes in an airliner cabin mockup. Int. J. Heat Mass Transf. 2018, 119, 223–235. [Google Scholar] [CrossRef]
- Yang, C.; Liu, J.; He, F. Evolution of large-scale flow structures and traces of marked fluid particles within a single-aisle cabin mock-up. Build Simul. 2017, 10, 723–736. [Google Scholar] [CrossRef] [PubMed]
- Zhao, Y.; Liu, Z.; Li, X.; Zhao, M.; Liu, Y. A modified turbulence model for simulating airflow aircraft cabin environment with mixed convection. Build Simul. 2020, 13, 665–675. [Google Scholar] [CrossRef] [PubMed]
- ASHRAE. Standard 161–2018; Air Quality within Commercial Aircraft. Atlanta, American Society of Heating, Refrigerating and Air-Conditioning Engineers, Inc.: Atlanta, GA, USA, 2017. [Google Scholar]
- Fiala, D.; Lomas, K.J.; Stohrer, M. Computer prediction of human thermoregulatory and temperature responses to a wide range of environmental conditions. Int. J. Biometeorol. 2001, 45, 143–159. [Google Scholar] [CrossRef]
- Chen, Y.S.; Shan, X.W.; Chen, H.D. New direction of computation fluid dynamics and its applications in industry. Sci. China Ser. E Technol. Sci. 2007, 37, 1107–1116. (In Chinese) [Google Scholar]
- Wang, X.; Shangguan, Y.Q.; Zhang, H.; Li, Y.M. Numerical study on the near-wall characteristics of compound angled film cooling based on hybrid thermal lattice Boltzmann method. Appl. Therm. Eng. 2018, 129, 1670–1681. [Google Scholar] [CrossRef]
- Wang, X.; Aoki, T. Multi-GPU performance of incompressible flow computation by lattice Boltzmann method on GPU cluster. Parallel Comput. 2011, 37, 521–535. [Google Scholar]
- Shangguan, Y.; Wang, X.; Li, Y. Investigation on the mixing mechanism of single-jet film cooling with various blowing ratios based on hybrid thermal lattice Boltzmann method. Int. J. Heat Mass Transf. 2016, 97, 880–890. [Google Scholar] [CrossRef]
- Buick, J.M.; Greated, C.A. Gravity in a lattice Boltzmann model. Phys. Rev. E 2000, 61, 5307–5320. [Google Scholar] [CrossRef] [PubMed]
- Hou, S.; Sterling, J.; Chen, S.; Doolen, G.D. A lattice Boltzmann subgrid model for high Reynolds number flows. Fields Inst. Commun. 1994, 6, 151–168. [Google Scholar]
- Chen, F.; Yu, S.C.M.; Lai, A.C.K. Modeling particle distribution and deposition in indoor environments with a new drift–flux model. Atmos. Environ. 2006, 40, 357–367. [Google Scholar] [CrossRef]
- Xiao, G.M.; Zhang, C.; Gui, Y.W.; Du, Y.X.; Liu, L.; Wei, D. TLBM-FVM cross-scale method for thermal environment prediction of airliner cabin. Acta Aeronaut. Astronaut. Sin. 2021, 42, 625710. (In Chinese) [Google Scholar]


Publisher’s Note: MDPI stays neutral with regard to jurisdictional claims in published maps and institutional affiliations. |
© 2022 by the authors. Licensee MDPI, Basel, Switzerland. This article is an open access article distributed under the terms and conditions of the Creative Commons Attribution (CC BY) license (https://creativecommons.org/licenses/by/4.0/).