Article

Determination and Validation of Discrete Element Model Parameters of Soybeans with Various Moisture Content for the Discharge Simulation from a Cylindrical Model Silo

1
Department of Food Science and Biotechnology, College of Agriculture and Life Sciences, Kangwon National University, Chuncheon 24341, Republic of Korea
2
Elderly-Friendly Food Research Center, Agriculture and Life Science Research Institute, Kangwon National University, Chuncheon 24341, Republic of Korea
*
Author to whom correspondence should be addressed.
Processes 2022, 10(12), 2622; https://doi.org/10.3390/pr10122622
Submission received: 28 October 2022 / Revised: 21 November 2022 / Accepted: 5 December 2022 / Published: 7 December 2022

Abstract

:
This study investigates the physical parameters that affect the flow patterns of soybeans with various moisture content (12% to 60%) at varying orifice sizes (20, 40, and 60 mm) in a cylindrical silo. The flow conditions required to obtain a steady mass flow during discharge were evaluated via experiments and three-dimensional discrete element method (DEM) simulation. The discharged mass flow rates at different flow conditions provided the critical size of the orifice. If the reduced diameter (Dred) of an orifice is >5.59, the flow showed a steady state. Based on the mass flow index (MFI), the flow patterns at 40% and 60% moisture content at 40 and 60 mm orifice sizes, respectively, showed funnel flows. although these flow conditions were satisfied to maintain a steady flow. The maximum wall pressure for the funnel flow showed the location of the interlocking phenomenon where the stagnant zone began during discharging. DEM simulation was validated through the mass profiles using the parameters obtained by the experiments. This study demonstrates that the experimental and analytical results with DEM simulation predict the flow behaviors of soybeans well at various moisture contents. These results are useful for designing silos for continuous food processing.

1. Introduction

Many commercial soybean-based processed foods, such as soymilk, bulgur, tofu, and cooked soybeans, are available in the market. The consumption of such foods by humans and animals has continuously increased. Soybeans are a major source of plant proteins for human nutrition and contain important nutrients, including oil and many bioactive components, such as saponins, phytosterols, isoflavones, and oligosaccharides [1].
Soaking is an essential pretreatment for soybean processing because soybeans are generally provided in dried form to the industry. Soaking is required prior to cooking to remove the toxic content in raw soybeans and ensure lower amounts of heat treatment to maintain the quality of soybean proteins [2]. Soaking improves the efficiency of many operations in soybean-based food processing, such as crushing, flaking, extruding, and cooking —however, soaking influences the shape and physical characteristics of the soybeans. Dried soybeans have a nearly spherical shape, but they gradually transform into an elliptical shape via moisture uptake [3]. The mechanical properties of soybeans are highly dependent on their moisture content and shapes [4]. These properties significantly influence the grain–grain and grain–silo-wall interactions during discharging of soybeans from the silos [5]. In such circumstances, the discharging flow of soybeans must be controlled when feeding them into the processing lines to prevent unstable and uncontrolled flow resulting in jamming or failure of the silos. Therefore, accurate control of the mass flow rate of soaked soybeans at the silo discharging area, i.e., orifice, is essential for designing a large-scale continuous process with a steady-state flow.
The flow of granules is different from that of a continuous medium. The flow patterns from a silo or container depend on the physical properties of the granules as well as the geometry and material properties of the silo walls [6]. The main possible flow patterns of granules developed in the discharging processes are mass and funnel flows. Mass flow is characterized by the discharge of the entire volume of granules at a continuous and steady flow rate without a shear gradient across the cross-sectional area of the silo. However, in funnel flow, a stagnant zone (also called a dead zone) exists in the region with non-moving granules during discharge. In this case, the granules in the stagnant zone remain in the silo, which may cause sanitation issues because the stagnant zone promotes spoilage [7]. Therefore, controlling the flow conditions deserves more attention in food processing, and the continuous processing of food grains requires a suitable design so that the steady-state and mass flows comply with the first-in-first-out concept.
Granular flow is a complex phenomenon owing to the physical properties of the granules and takes into account the granule–granule and granule–wall interactions. Most of the previous studies investigating the flowability of granules have used empirical models that predict the flow rates depending on various silo geometries, such as orifice diameter, height and diameter of the silo, and diameter and density of the grains [8]. However, empirical approaches are limited to providing general solutions to design silos for various circumstances based on the physical properties of food grains. In particular, the moisture content of food grains alters the important parameters that influence the flow properties greatly, such as shape, friction properties, restitution properties, Young’s modulus, and Poisson’s ratio of the grain [9]. In such cases, the experimental factors of the models may become extremely complex, and it is difficult to predict the flow rate accurately. The discrete element method (DEM) simulations have been proven to be efficient and promising tools against such complex granular food materials [6].
DEM simulation models have been used to successfully describe the dynamic behaviors of discontinuous and heterogeneous granular media [10,11]. DEM applications in the field of food science have increased in recent years, such as the discharging behaviors of maize grains [11], discharging flow rates of rapeseed through orifices of various sizes [12], discharging process of soybeans with different geometries [13], and accumulation after discharging of rice grains with various moisture content [14]. However, discharging studies and DEM simulations of grains with high variations in the moisture content (e.g., dried to fully soaked state) in practical food processing are scarcely available. The present work investigates the physical properties of soybeans with various moisture content on the discharge process and the effects of the outlet size of a silo. The validation of soybean discharge through experiments and DEM simulations provides insights into designing an optimum silo that can achieve a steady-state and mass flow discharge for continuous soybean processing regarding moisture variations in soybeans via soaking. This study aims to (i) measure the grain properties for the DEM simulation parameters of soybeans with varying moisture contents, (ii) evaluate the flow properties and discharge patterns of soybeans from cylindrical silos with varying orifice sizes based on the flow rate and wall pressure, and (iii) evaluate the flow patterns at various circumstances using the experimental results and DEM simulations.

2. Materials and Methods

2.1. Soybean Soaking

Dried soybeans (Glycine max L.) with an initial moisture content of 12% (w.b.) were provided by the National Institute of Crop Science of the Republic of Korea. Soybeans with various moisture contents (12%, 20%, 40%, and 60% w.b.) were obtained by soaking the grains in distilled water at 25 °C for 0, 10, 120, and 1080 min. After soaking, the water was drained using a mesh, and the soybeans were gently wiped using paper tissues to remove the excess water on the surface. The soaked soybeans were packed in polyethylene sample bags and stored at 25 °C for 24 h before conducting experiments to allow water migration because of the existence of a moisture gradient inside the grains immediately after soaking.

2.2. Particle Properties of Soybeans

2.2.1. Geometry of the Grains

The average grain geometry was obtained by measuring the length, width, and thickness of 30 representative soybean grains using a Vernier caliper with a reading resolution of 0.01 mm (Figure 1). The geometrical diameter (dmean) and sphericity (ϕ) were estimated for soybeans with various moisture content (12–60%) as follows:
d m e a n = l e n g t h × w i d t h × t h i c k n e s s 1 / 3
ϕ = d m e a n l e n g t h × 100

2.2.2. Poisson’s Ratio and Young’s Modulus

The stress–strain curve of the soybeans for each moisture content was acquired using a texture analyzer (CT3, Brookfield Inc., Middleboro, MA, USA) to obtain Poisson’s ratio and Young’s modulus. Compression tests were then performed with a displacement rate of 0.1 mm/s using a cylindrical probe (10 mm diameter) in the linear region. The measurements were recorded on video using a digital camera (DC-GX9, Panasonic, Osaka, Japan) until the material failed, and the changes in the horizontal and vertical diameters were analyzed with ImageJ v.1.49 software (National Institute of Health, Bethesda, MD, USA). Poisson’s ratio was calculated using Equation (3):
μ = Δ d / D Δ l / L
where μ is Poisson’s ratio (dimensionless), Δd is the transverse deformation (mm), D is the sample width (mm), Δl is the axial deformation (mm), and L is the sample length (mm).
Young’s modulus (E) is defined as the slope of the stress–strain curve in the linear region. When stress σ was applied, the diameter of the soybean sample changed. Thus, the contact areas of compression were calculated using the geometrical diameters of the soybeans at different moisture contents:
σ = f π r s
E = σ ε
where σ is the stress (MPa), f is the force applied to the soybean (N), rs is the contact area of compression that is calculated using the average values of the width and length of the soybean, and ε is the strain.

2.2.3. Particle–Particle (ep) and Particle–Wall Coefficients of Restitution (ew)

The particle–particle and particle–wall coefficients of restitution were calculated based on a drop test according to the method of González-Montellano et al. [15] (Figure 2). The soybean grains were glued at the end of two strings with equal lengths, and the tops of both strings were fixed to a horizontal bar, with the suspended grains perfectly aligned. One of the grains was held at a height H0 using a vacuum system (Figure 2a), and then was released and impacted against the other grain via suppression of the vacuum (Figure 2b). The obtained heights after the impact of both grains (H1 and H2 in Figure 2b) were used to calculate the value of the particle–particle coefficient of restitution in accordance with Equation (6) [16]. At least 15 soybean grains were measured for each moisture content level.
e p = H 2 H 1 H 0
For measuring the particle–wall coefficient of restitution, the soybean grains were released vertically at the height of 250 mm (H0) above the acryl plate via suppression of the vacuum that maintained the grains in place. The particles fell freely until impacting the acryl plate and bounced to a height of H1 (Figure 3). The value of the particle–wall coefficient of restitution is expressed as shown in Equation (7) [15]. At least 15 soybean grains were measured for each moisture content level.
e w = H 1 H 0

2.2.4. Particle–Wall Coefficient of Static Friction (μw)

The value of the particle–wall coefficient of static friction was determined using an inclinable platform containing a tray of soybeans [16]. Three soybeans were fixed on this tray in a triangular arrangement. A piece of acryl plate was laid over these three grains, and the platform was raised progressively at one end until the wall material lying over the particles began to slide. The angle of inclination of the platform at the point of beginning to slide (αd) is related to the particle–wall coefficient of static friction as follows (Equation (8)). At least 30 soybean grains were tested for each moisture content level.
μ w = tan α d

2.2.5. Particle–Wall Coefficient of Rolling Resistance (μr)

The coefficient of rolling resistance was measured by rolling a soybean grain of mass m (assuming that there is no sliding/slipping between the surfaces) on an inclined plane of height h (3 cm) for a rolling distance of d after the grain rolling was terminated (Figure 4). The value was calculated as Equation (9) [17]:
μ r = h d

2.3. Experimental Equipment

An experimental setup composed of a cylindrical acryl silo with various orifice sizes is shown in Figure 5a,b. The height of the wall was 500 mm, the orifice diameters were 40, 50, and 60 mm, and the angle of transition between the wall and hopper was 55°. Changing the orifice size will change the height of the hopper because the hopper height is dependent on the orifice size when the angle of transition is fixed. Approximately 7 kg of soybeans were charged inside the acryl silo, and discharging was carried out by opening the orifice 30 min after charging. A plastic box on a plate supported by a load cell was placed under the silo, weighing the soybeans falling out of the orifice during discharging. Membrane pressure sensors FSR406 (Interlink Electronics, Camarillo, CA, USA) were attached at five locations at different heights inside the silo wall to measure the wall pressure (Figure 5a). For comparison of the flow pattern, marker soybeans were prepared by coloring with Brilliant Blue FCF (Sigma-Aldrich, St. Louise, MO, USA) during soaking. The marker soybeans had the same moisture content and physical properties as the surrounding soybeans. A layer of marker grains was placed at the half-height point of the total charge of soybeans (Figure 5c), and a video was recorded using a Panasonic DC-GX9 digital camera to obtain the flow pattern during discharge. Five replications of the measurements were performed for each orifice size and each moisture content level of the soybeans. The marker grains were used to visualize particle velocity at the wall (vwall) and at the center (vcenter) during discharge. The particle velocity was analyzed using ImageJ v.1.49, and the obtained velocity was used to evaluate the mass flow index (MFI) (Equation (10)). The values of MFI > 0.3 and MFI < 0.3 are indicative of mass and funnel flows, respectively [18,19].
MFI = v w a l l v c e n t e r

2.4. DEM Simulation

The particle–particle and particle–wall contact properties are based on the Hertz–Mindlin no-slip contact model with viscous damping and a frictional slider in the tangential direction of contact [20]. The explicit numerical method is the foundation of DEM, in which the granular system is modeled as an assembly of a finite number of singular discrete elements interacting (particle–particle or particle–wall or particle–fluid) via contact (tangential and normal) and noncontact forces (van der Waals, electrostatic, and liquid bridge). Each element can move laterally and rotationally (based on the force and torque acting on it) and is described by Newton’s second law of motion [21,22]. The governing equations for the translational and rotational motions of particle i with mass mi and moment of inertia Ii can be written as:
m i d v i d t = j = 1 K ( F c , i j n + F c , i j t + F d , i j n + F d , i j t ) + F i g
I i d w i d t = j = 1 K M i j
where vi and wi are the translational and angular velocities of particle i, respectively; K is the number of contacts between particle i and the neighboring particles or walls; F c , i j n and F c , i j t are the normal and tangential contact forces between particles i and j, respectively; F d , i j n and F d , i j t are the normal and tangential damping forces between particles i and j, respectively; F i g is the gravitational force; M i j is the torque generated between particles i and j.
Furthermore, in DEM, the motion of the granular system is modeled particlewise; hence, in this dynamic process of simulation, the future of each particle (loss of contact and creation of new contact) is anticipated by the cyclic repetition of a mathematical algorithm (model) implemented at any time interval into which the entire study time is split [15,23]. The simulations were performed using STAR-CCM+ v17.04 (Siemens PLM Software, Plano, TX, USA) software for discrete element modeling in this study.

2.5. Statistical Analysis

The experiments were performed at least in triplicate, and an analysis of variance (ANOVA) was conducted to evaluate the significance (p < 0.05) of the physical properties of the soybeans with various moisture content. A least significant difference test was performed with the IBM SPSS Statistics 21 software (IBM Corp., New York, NY, USA).

3. Results and Discussion

3.1. Physical Properties of Soybeans with Various Moisture Content

The physical properties of soybeans with different moisture contents are affected by the amount of water absorbed and the subsequent biological changes, such as germination. As the soaking time increases, the amount of water absorbed by the soybean increases until it reaches the equilibrium moisture content for the germination process [24]. The appearance and internal structure of the soybean dramatically change when it is ready to germinate, and such structural changes highly influence the mechanical properties [25], which then affect the granular flow characteristics.

3.1.1. Shape and Size

The shapes and sizes of the soybeans with different moisture contents are presented in Figure 6 and Table 1. The dimensions and mean diameter increased, and the sphericity decreased as the soybeans showed moisture uptake. This observation agrees with the report of Davies and El-Okene [3] for soybeans and other legume seeds [26]. The grain shape’s influence must be incorporated for a comprehensive understanding of the granular flow behavior [27]. Since the flow properties of granules are greatly affected by both the geometrical and following changes in the frictional properties of the granules, the size and shape changes of the soybean grains at different moisture contents are taken into account with importance.

3.1.2. Poisson’s Ratio and Young’s Modulus

Poisson’s ratios of the soybeans at different moisture content were measured by image analysis during deformation in the linear region of the stress–strain curve, and the results are shown in Table 2. Poisson’s ratio initially increases with increasing moisture content; however, when the moisture content was 60%, Poisson’s ratio became very low. The 60% moisture content was then found to be the equilibrium moisture content for soybeans used in this experiment because the moisture content no longer increased with soaking time. The increase in Poisson’s ratio indicates that the structure of the soybean becomes rubbery as the amount of water absorbed by the bean increases. However, when the moisture content was 60%, the decrease in Poisson’s ratio diminished; this might be related to the internal structural changes owing to the high moisture and biological changes of the soybeans. When the moisture content is at equilibrium, the absorbed water is used for the enlargement of the cotyledons. The cell structure of the soybean may be expanded by water, and the vertical deformation may only compact the soybean [25]. Thus, the deformation in the horizontal direction may not increase further, so Poisson’s ratio may decrease. Additionally, the germination process may alter the internal structure of the soybean dramatically.
Young’s moduli at different moisture contents are shown in Table 2. The values decreased until the moisture content was 40%, and this decrease in Young’s modulus may be attributed to softening of the structure of the soybean as the amount of absorbed water increases. However, Young’s modulus increased at 60%, which might be attributed to the internal structural changes associated with germination. For germination, the adaxial epidermal tissues and internal structures of the soybean cotyledons are strongly developed, leading to an intensified internal structure [25]. Thus, more force is required to deform the soybeans compared to that of the 40% moisture content. This exceptional change for the 60% moisture content is in agreement with the results of Poisson’s ratio.

3.1.3. Coefficients of Restitution

The particle–particle (i.e., soybean–soybean) and particle–wall (i.e., soybean–acryl wall) coefficients of restitution (CORs) are shown in Table 2. The CORs are generally determined by experiments owing to their physical complexity. The amount of energy required to bounce back depends on the mechanical properties of the material and the wall, such as Young’s modulus and Poisson’s ratio, as well as the geometrical parameters of the materials, such as sphericity. The soybeans with different moisture contents show wide variations in their mechanical properties as well as shapes. For soybeans with 12% and 20% moisture contents, the particle–particle CORs showed no significant differences, whereas the particle–wall CORs were significantly different. The higher particle–wall COR for the soybeans with 20% moisture may be attributed to the higher impact energy from the higher mass of the grain when the 12% and 20% moisture contents have similar Poisson’s ratios and hence similar impact energy losses by deformation. However, when the moisture content was above 40%, both particle–particle and particle–wall CORs reduced and showed very high standard deviations. This is because the sphericity became very low even though there was a large increase in mass compared to those of the grains with 12% and 20% moisture (Table 1). The lower sphericity causes dissipation of the normal force so as to bounce back to the normal direction by rotational movements and different directions by translational movements. Such rotational movements and moving in different directions generate high standard deviations in the CORs [15].

3.1.4. Coefficient of Friction

The coefficients of friction among the soybeans and between the soybean and silo wall are related to the wall pressure that directly affects the flow pattern in the silo [28]. The friction coefficients are also obtained empirically owing to the complexity associated with the irregularity of the particles and roughness of the grain surface [29].
The static and rolling friction coefficients between the particle and wall increased with the increasing moisture content of the soybeans. The friction force between the materials is related to the roughness and adhesiveness of their surfaces. In particular, the static friction coefficient is highly dependent on surface properties. High moisture in the soybeans increases the adhesiveness of the surface and dramatically increases the static friction coefficient. As the moisture content approaches equilibrium, the surface of the soybean may have more possibility to release the absorbed water inside through a thin membrane in the seed coat to control the moisture between the seed and the environment [30]. The static friction coefficient near the equilibrium moisture content (60%) is approximately three times higher than that at 40% moisture (Table 2).
The coefficient of rolling friction (μr) is defined as the ratio of the force of friction to the force normal to the surface of contact that prevents the particle from rolling. The rolling friction also increases upon moisture uptake, and this change is perhaps dominated by the shape changes to the soybeans because of the lower sphericity and high probability of rolling in different directions [31].

3.2. Discharge Characteristics of Soybeans from the Silo

3.2.1. Flow Rates of Soybeans with Different Moisture Content at Different Silo Orifice Sizes

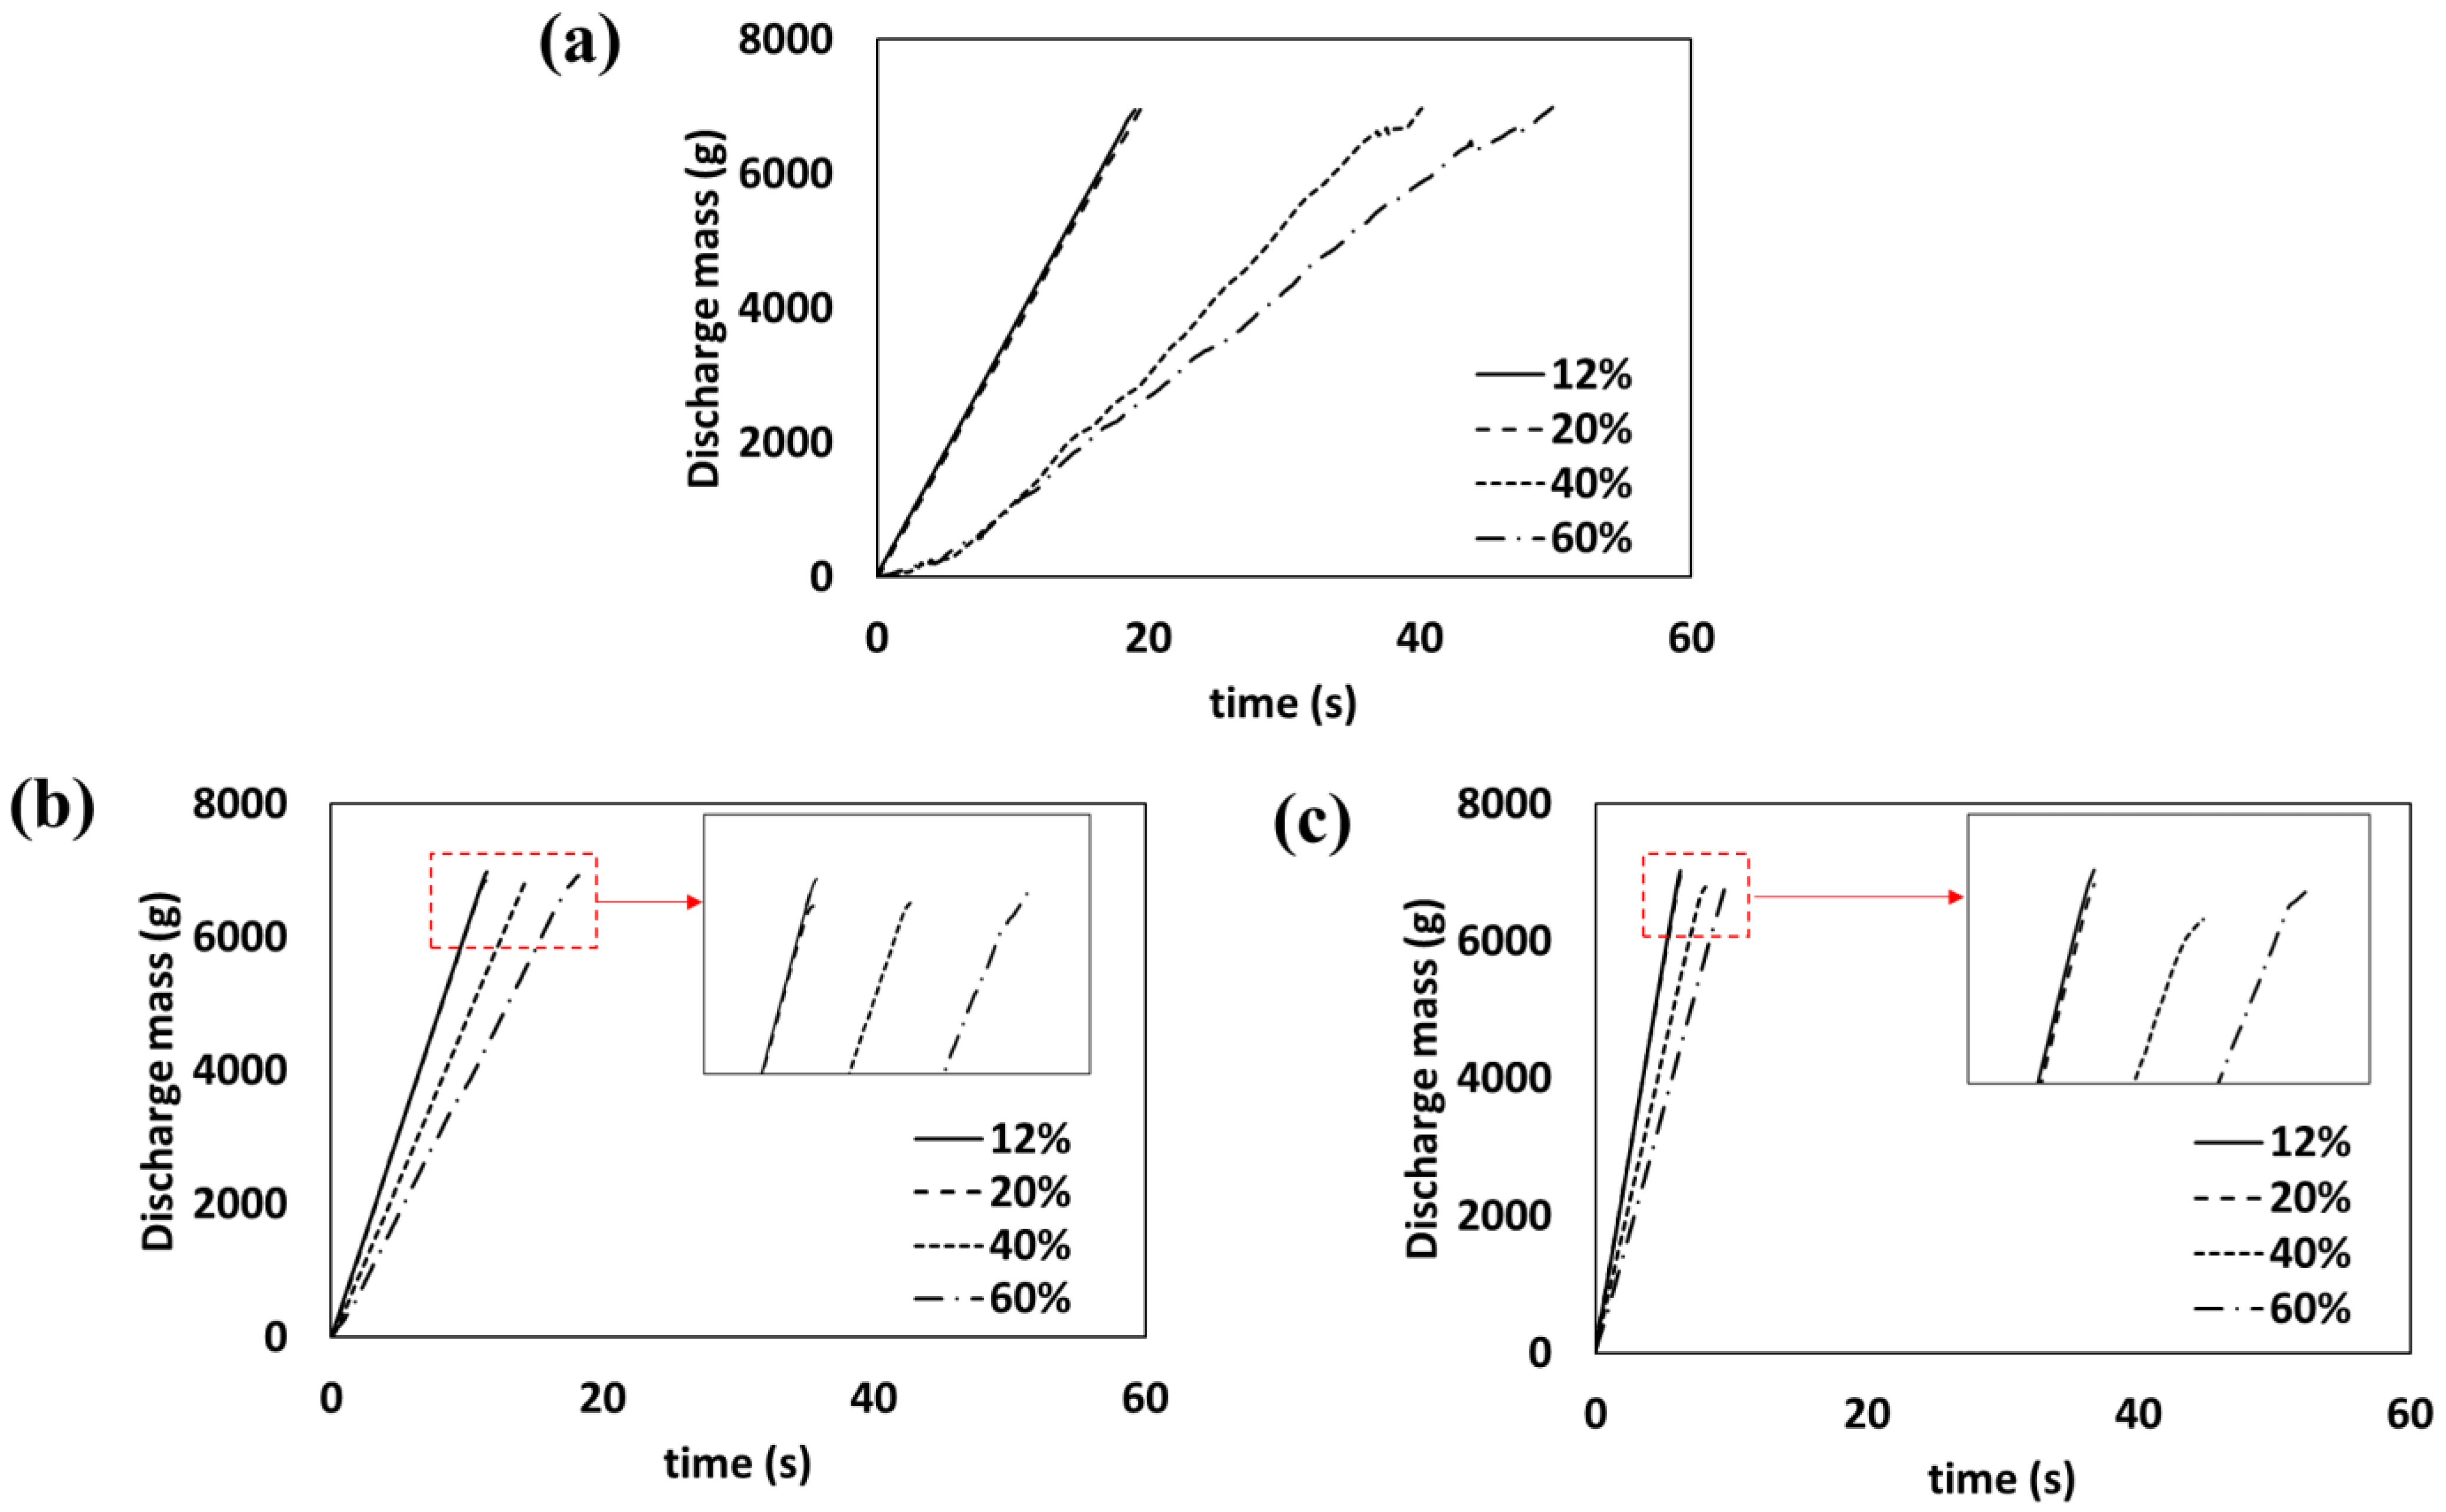
The mass profiles of the soybeans discharged through orifices of different sizes in the silo were measured (Figure 7). Notable, the rates of discharge mass for 12% and 20% moisture were nearly identical regardless of the orifice size compared to those of the 40% and 60% moisture. This result provides a significant clue in determining the key parameters affecting the discharge flow rates of soybeans having different moisture content. The shape and friction coefficients of the beans with 12% and 20% moisture showed similar values, but those of the soybeans from 20% to 60% moisture were significantly different. This clearly demonstrates that the shape and friction coefficients are the key parameters controlling the discharge flow rates of soybeans with different moisture contents for varying orifice sizes. Another interesting observation was that the discharge flow of the soybeans with 60% moisture was absent at the orifice size of 40 mm when opening the orifice to start discharge. This is a typical observation of the interlocking phenomenon occurring with large granules at small outlet sizes [32]. The flow curve in Figure 8a for the soybeans with 60% moisture is recorded after poking the stuck soybeans with a stick. Thus, the flow rate was not calculated in Table 3.
The increase in the flow rates of the soybeans with increasing orifice sizes provides important information to estimate a suitable size of the orifice for certain processing methods that require a target moisture content of the soybeans. As the diameter of the orifice size increased from 40 to 60 mm, the beans with 12% and 20% moisture presented nearly identical changes in the flow rate. However, the beans with 40% and 60% moisture show distinct flow rates. In addition, the increase in the flow rate with increasing orifice sizes for such soybeans was smaller for the higher moisture content. This result indicates that the flow rate is dependent on the moisture content of the soybeans regardless of the orifice size. However, the increment ratio with orifice size may be independent of the moisture content when the orifice size is large enough to allow steady flow, as there is a nearly identical increment of the flow rate for an increase in orifice sizes from 50 to 60 mm (1.87, 1.83, 1.81, and 1.80 for the beans with 12%, 20%, 40%, and 60% moisture, respectively). This implies that the 60 mm orifice size might be a critical diameter, defined as the orifice diameter, that induces a relatively smooth flow [8].
The critical diameter is generally accepted when the orifice diameter (D) is six times greater than the particle size (d) (D > 6d). Additionally, Hirshfeld and Rapaport [8] noted another critical diameter (D < 4d) that may cause blockage of granular flow in silos. In the present study, the reduced orifice diameter (Dred) was defined as follows:
D r e d = D d m e a n
The Dred of the soybeans is presented in Table 4. The Dred at 60% moisture for the 40 mm orifice was 3.73 (Dred < 4). This explains the no-flow observation for the soybeans with 60% moisture in the silo for the 40 mm orifice. However, for the 60 mm orifice, Dred for all moisture values exceeded 5.59. This implies that the critical diameter obtained from the experimental conditions in our study is approximately 5.59.
Apart from the soybeans with 60% moisture content at a 40 mm orifice size, all the soybeans were discharged from the silo. However, fluctuations were observed during discharge for several of the flows. Hence, the discharge rate profile calculated from Figure 7 and is shown in Figure 8 because the fluctuations in the flow rate may cause unsteady-state discharging flow that may cause difficulties with process control. For the soybeans with 12% and 20% moisture, the discharge flow rate showed stable linear patterns for all orifice sizes, aside from the downward peak corresponding to the transition of soybean movement from the barrel to the hopper at the last step of discharging. However, unsteady flow patterns were observed at 40% and 60% moisture content at orifice sizes of 40 and 60 mm, respectively. Although the discharge was complete at these conditions, the rate profiles of the discharge flows showed unstable and unsteady-state flow patterns. This implies that these orifice sizes must be avoided to maintain steady-state and mass flow patterns.

3.2.2. Flow Patterns in the Silo during Discharge

Granular flows in the silo showed unique flow patterns, such as mass and funnel flows. There is a possibility that the steady-state flow has a funnel flow pattern with a stagnant zone. Thus, to evaluate the steady-state flow with the mass flow pattern, the mass flow index (MFI) was defined as Equation (10) [18]. The MFI was estimated empirically using the values of vwall and vcenter from the data obtained with the marker soybeans (Table 5). The MFI of the beans with 40% moisture with the 40 mm orifice and 60% moisture with the 60 mm orifice was approximately 0.3, whereas the other discharging conditions show values higher than 0.3. The beans with 60% moisture and the 50 mm orifice showed an MFI lower than 0.3 and were not considered because this discharging condition was clearly regarded as a funnel flow. The MFI demonstrates that the discharging conditions for flows with MFI ≤ 0.3 show funnel flow patterns even though they maintain steady-state flow. For food processing, a mass flow pattern must be achieved especially when the material contains a high moisture content as it can be easily spoiled by microorganisms, particularly food pathogens.
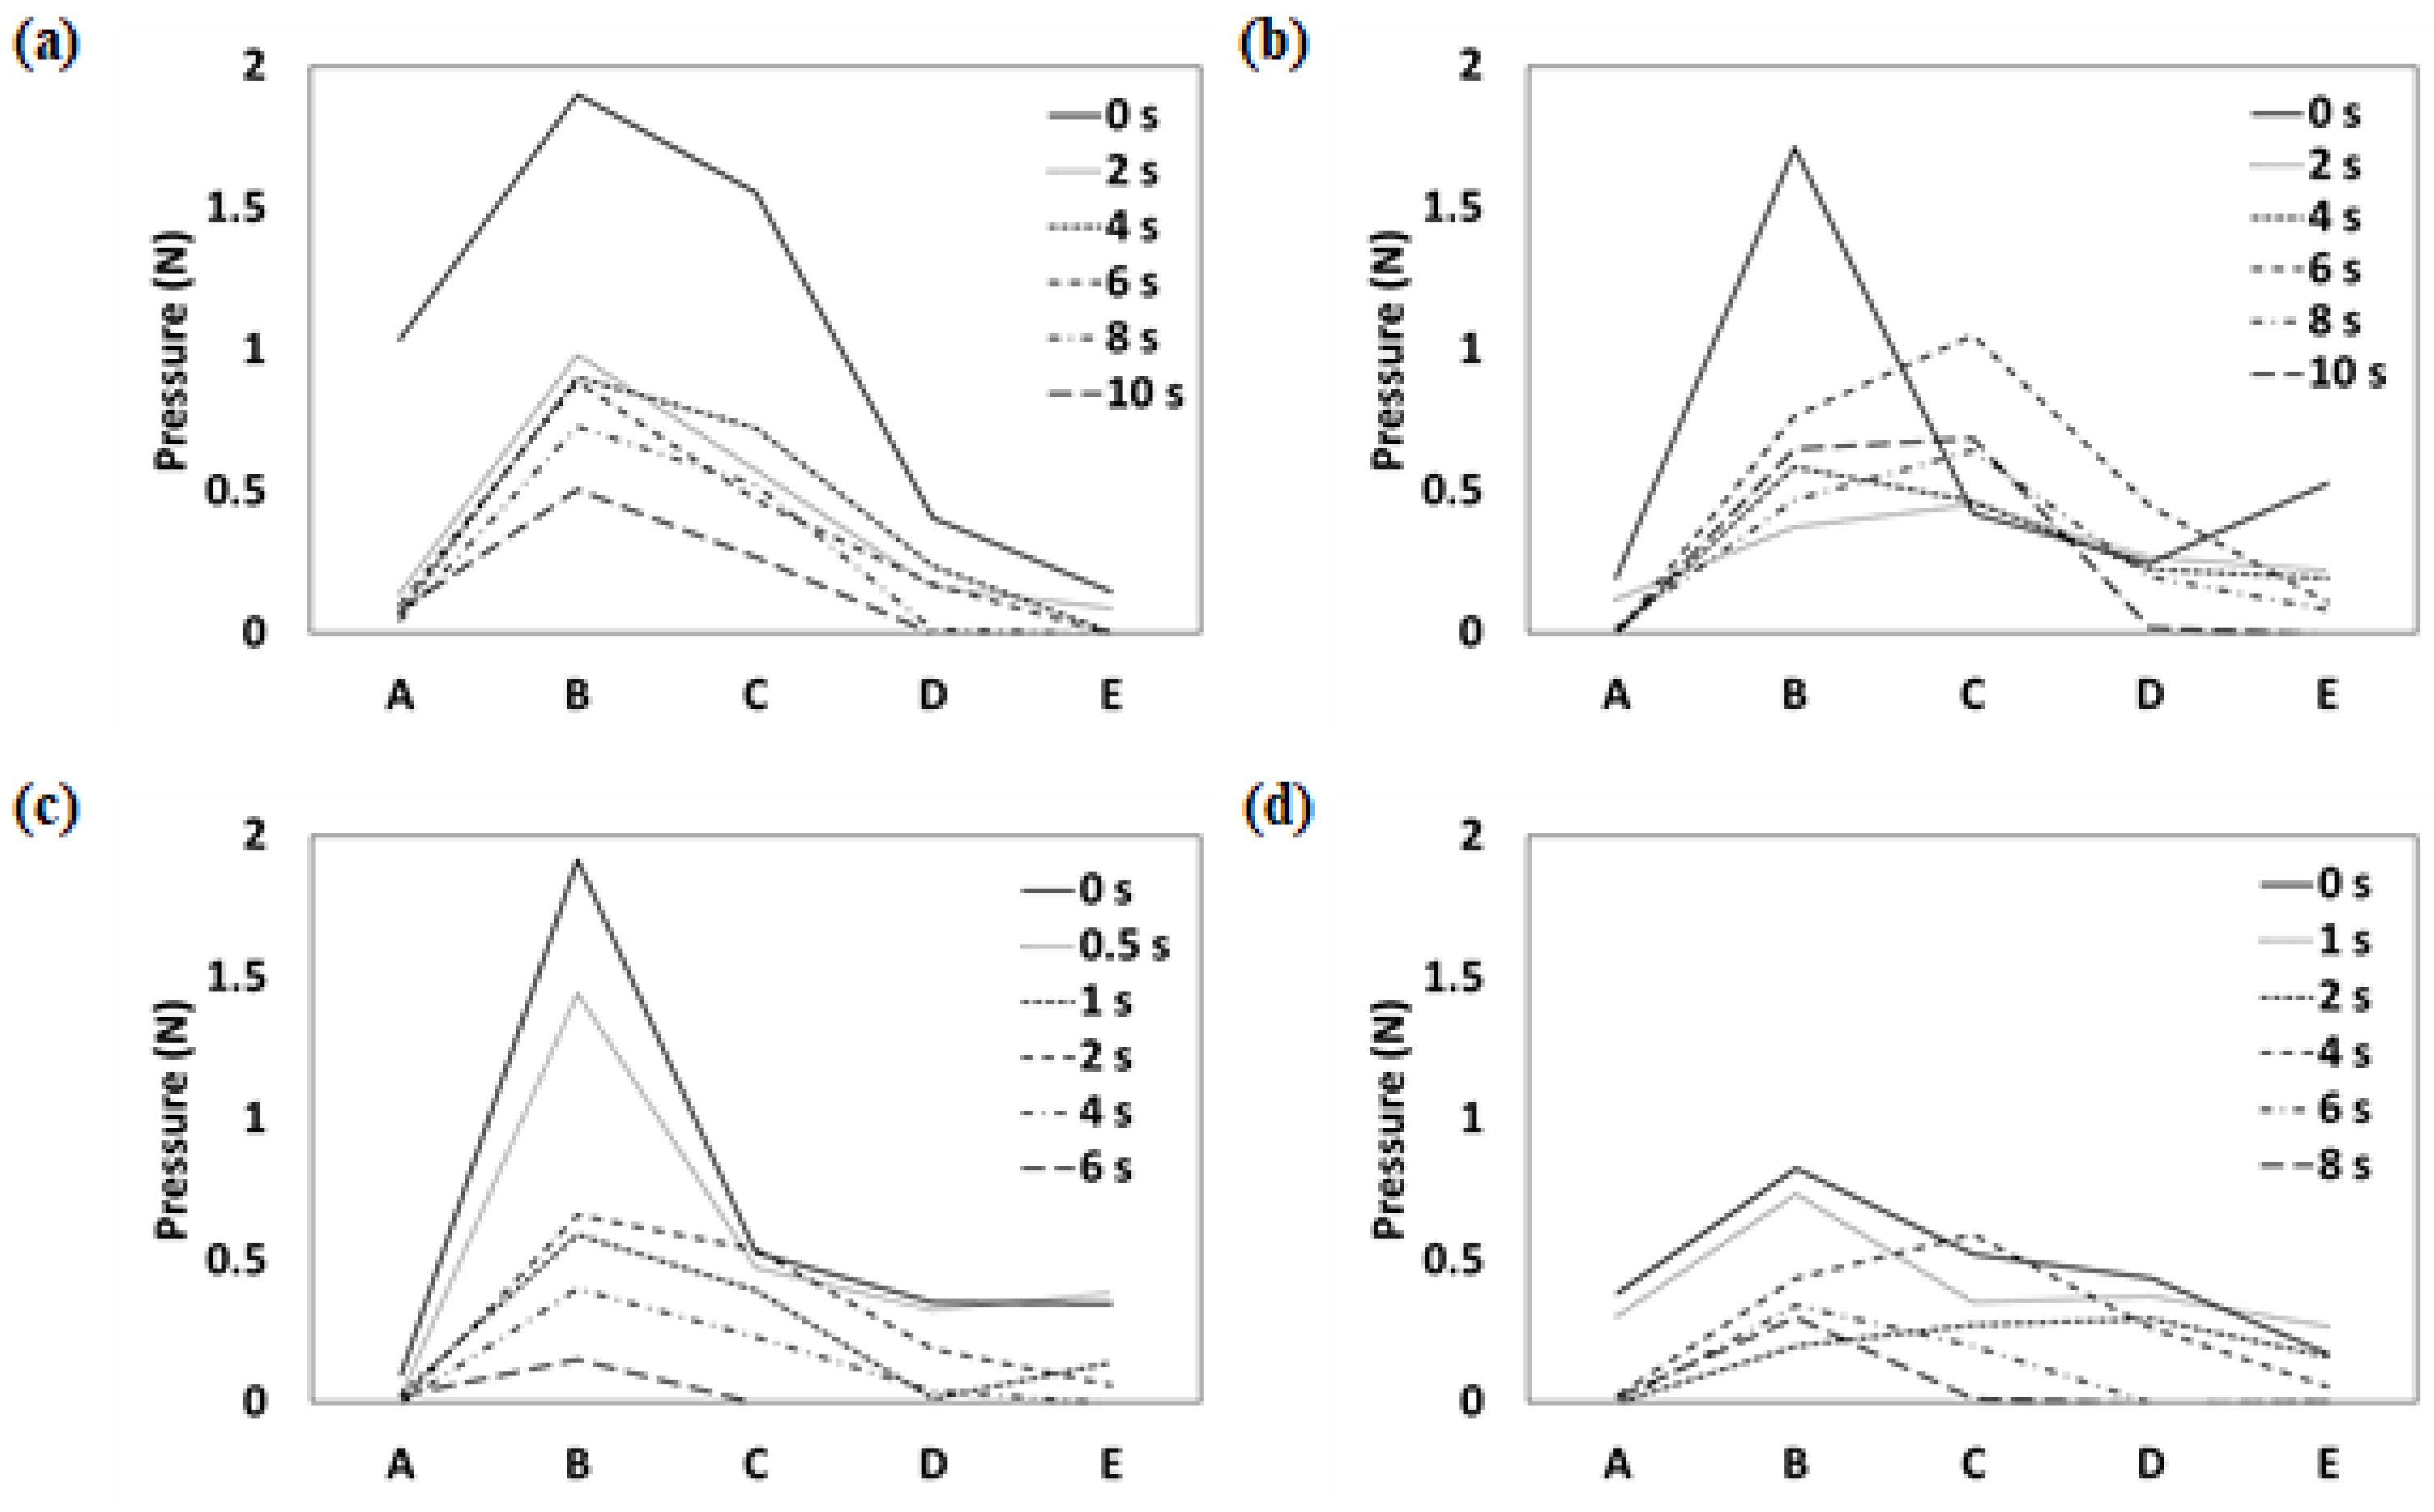
The stagnant zone is produced in the funnel flow owing to the interlocking of the granules. When interlocking occurs in the silo, the discharge pressures on the silo walls around the interlocking area show high values. For mass flow, the maximum wall pressure during discharging is always found at the transition point from the barrel to the hopper. The wall pressures during discharging were obtained using pressure sensors at various heights, and the representative pressures at several time steps are presented in Figure 9. The maximum wall pressure during discharging of the beans with 40% and 60% moisture at 40 and 60 mm orifice sizes was located at C for both conditions, which is above the transition point (B) of the barrel to the hopper in the silo. This result indicates that the apparent funnel flow pattern for these discharging conditions maintains a steady-state flow. In addition, the location of the stagnant zone can be identified by measuring the wall pressures at different locations on the silo wall.

3.3. DEM Simulation of Soybean Discharge

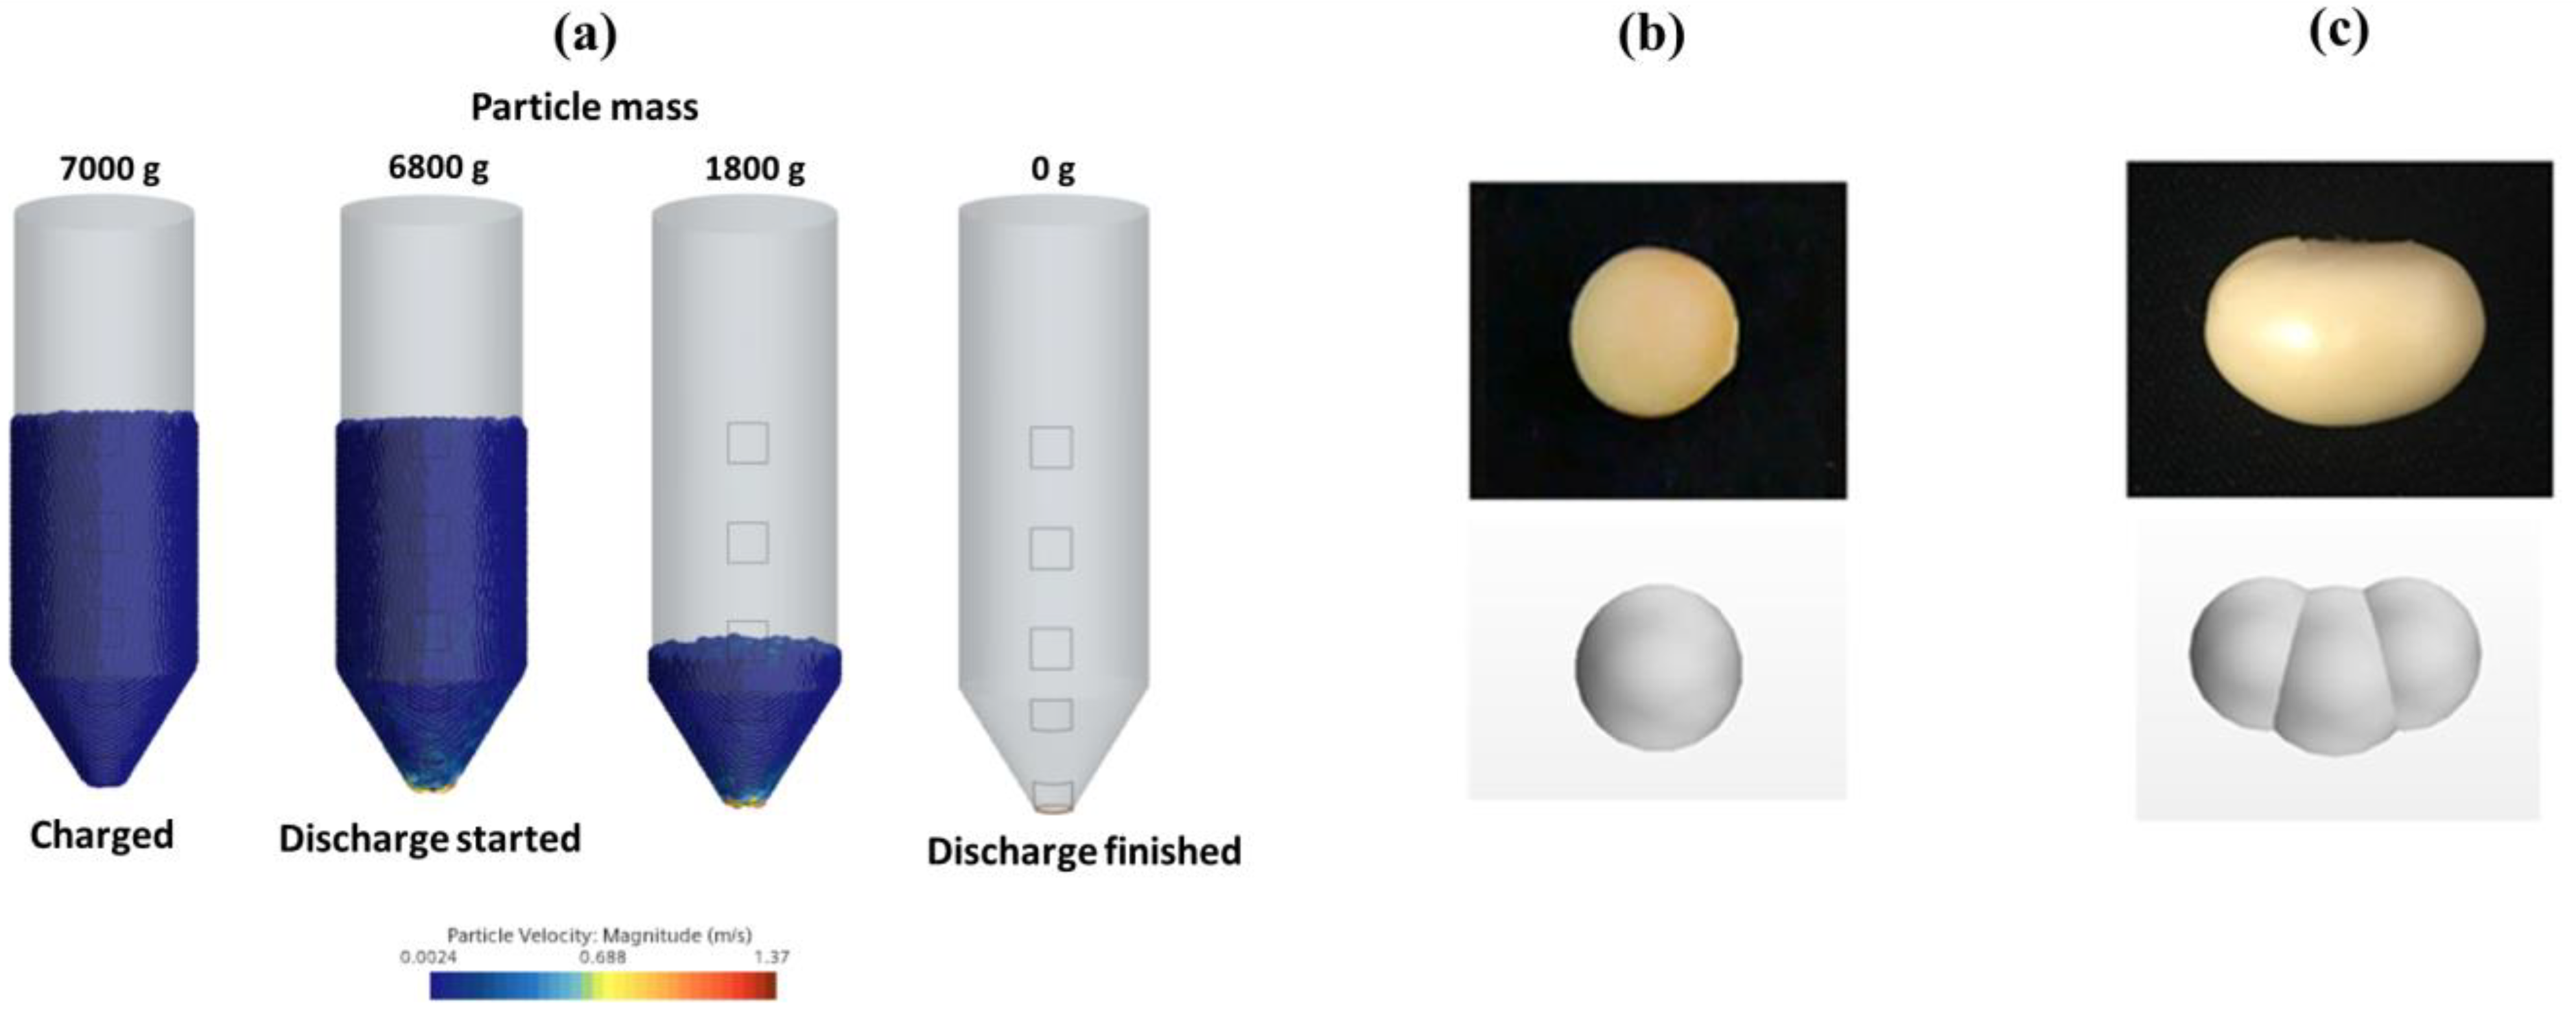
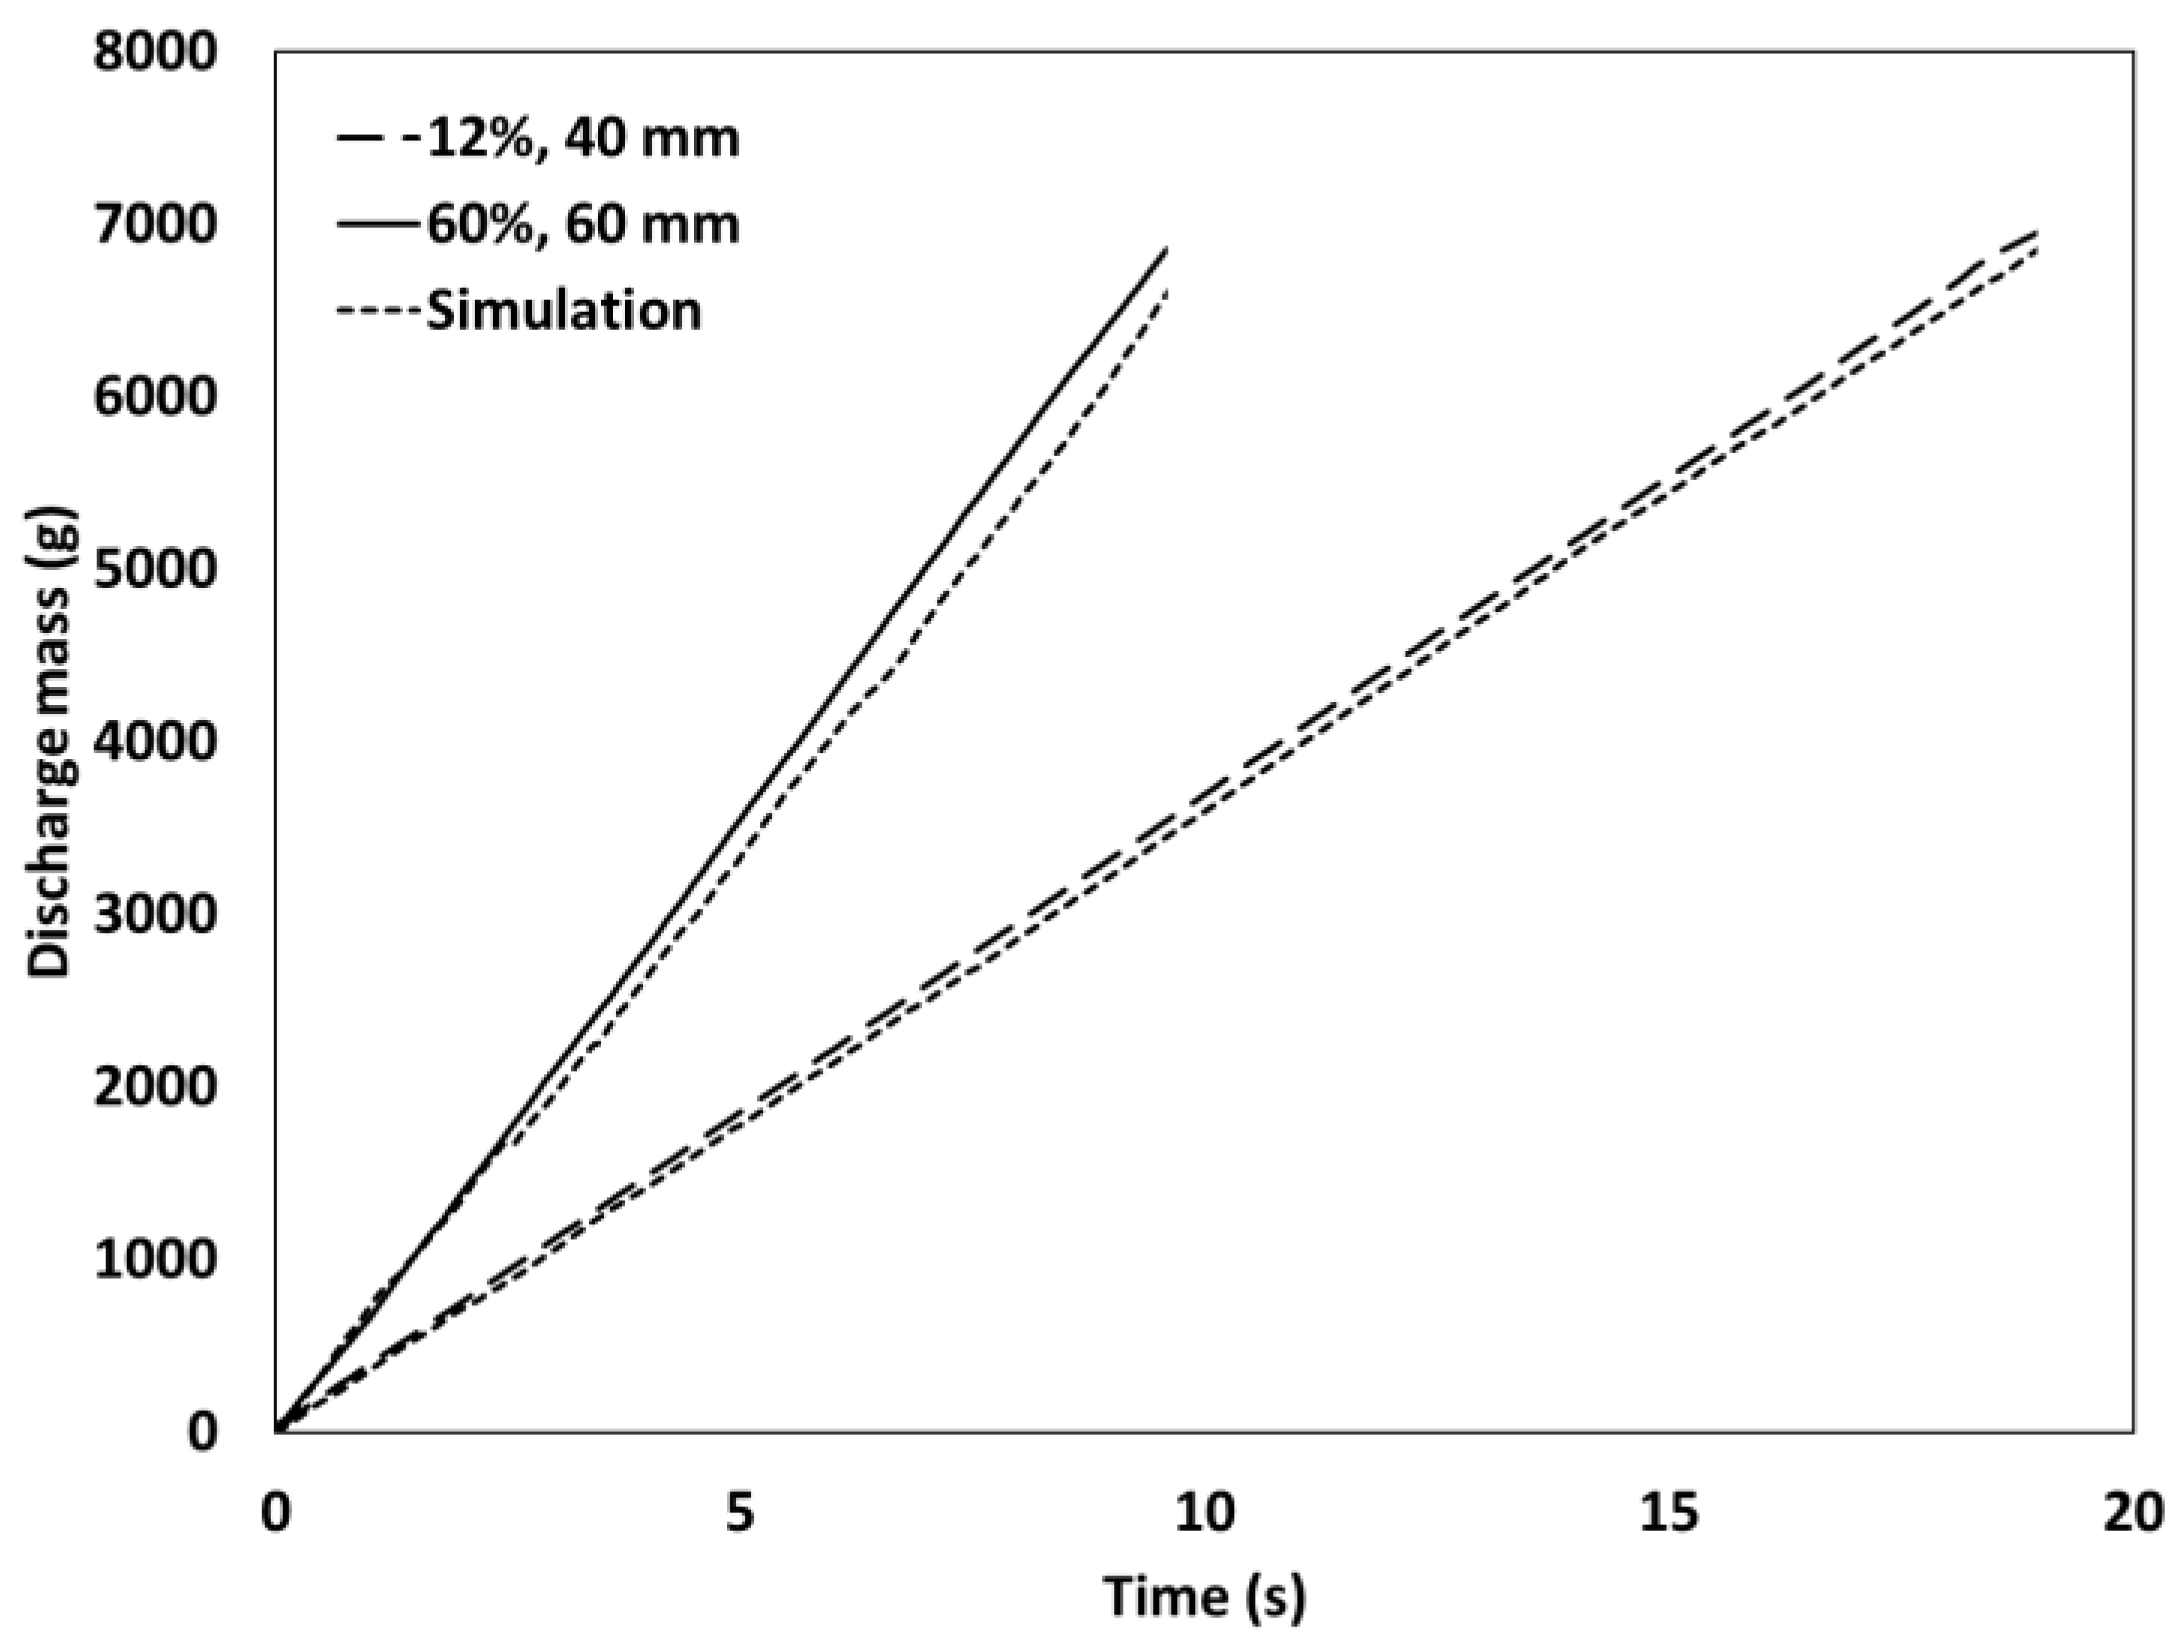
DEM simulations were conducted for various flow conditions, the same as in the experiments, and three of them are described here: (1) 12% moisture for a 40 mm orifice, (2) 60% moisture for a 60 mm orifice, and (3) 60% moisture for a 40 mm orifice using the grain properties obtained by the experiments. The discharge process in the simulation for 12% soybeans at a 40 mm orifice size is shown in Figure 10a as a representative image. The shape of the soybean with 12% moisture content was modeled as a single-sphere particle because the sphericity of the soybean grain is sufficiently close to a sphere (>96%). On the other hand, soybeans with a 60% moisture content were modeled as multi-sphere composite particles composed of three spheres (Figure 10b,c). The sizes of the particles were set to the same size as those experimentally measured. The simulated mass profiles of the soybean discharge agree well with the experimental data (Figure 11 and Figure S1). This implies that the DEM simulation aptly reflects the flow of soybeans with various moisture content at different orifice sizes. Additionally, the simulation results for 60% moisture with a 40 mm orifice showed no flow (data not shown). The particle-wall COR was used for both particle–particle and particle–wall interactions in the simulation. The simulation may be more accurate if the particle–particle COR is calibrated; however, the effect of the shape on particle interactions in this study was sufficiently represented by the parameters from the experiments (R2 > 0.99 for the discharge mass profiles).
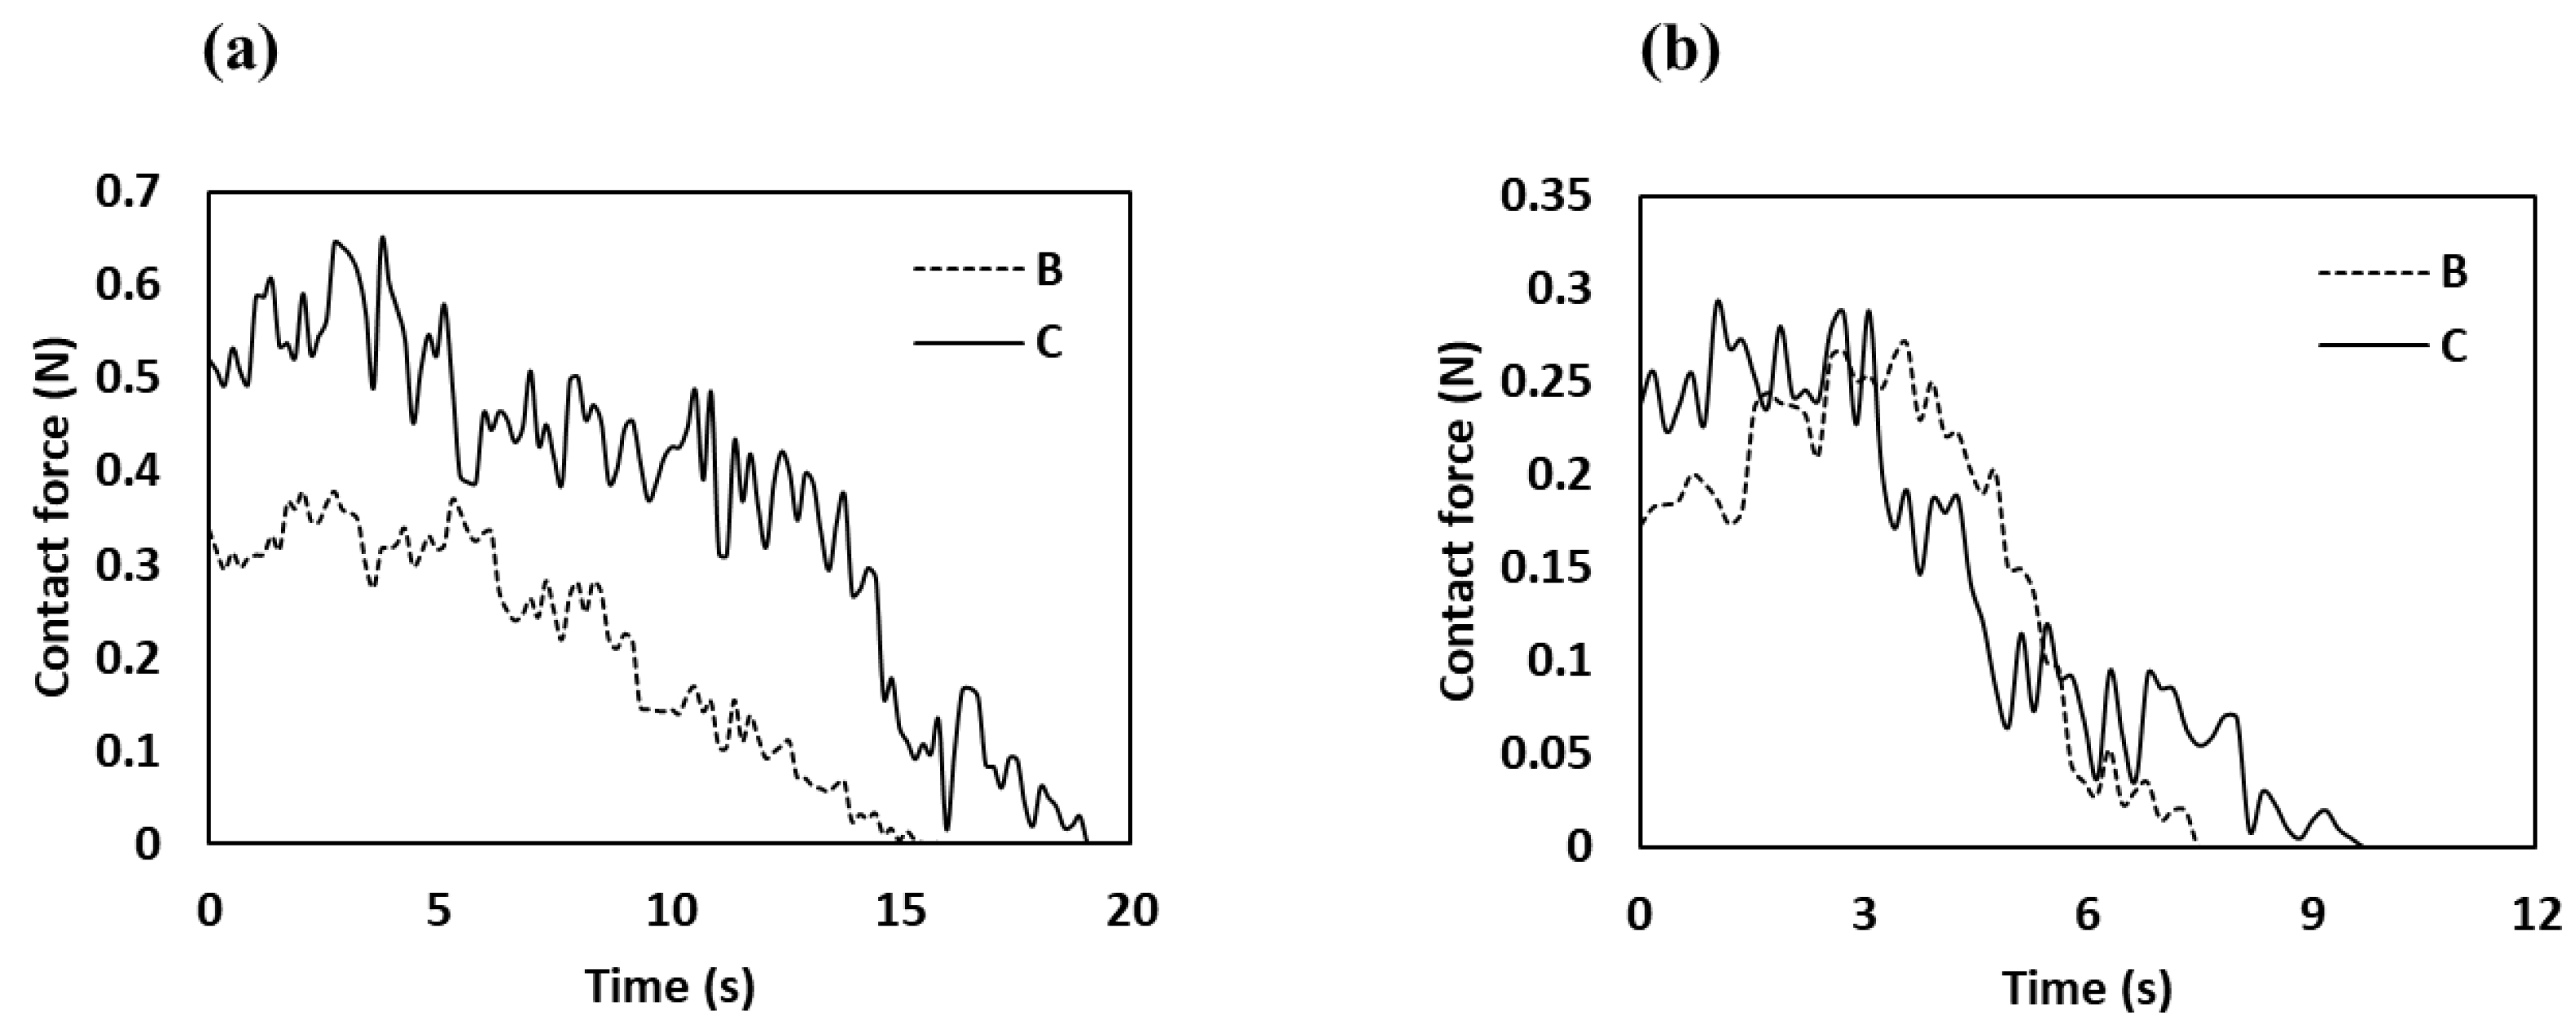
The contact forces of the soybeans with the silo wall at the same locations as pressure sensors B and C were simulated. The DEM simulation in Figure 12a for the discharge flow at 12% moisture with a 40 mm orifice shows profiles for the mass flow pattern. The simulated contact force at the transition point from the barrel to the hopper (location B) was always the highest during discharge. On the other hand, the contact force for 60% moisture with the 60 mm orifice showed a typical profile for a funnel flow pattern, similar to the experimental results (Figure 12b). The higher contact force at location C than B indicates that the stagnant zone is formed between B and C. The results of the DEM simulation depict the location of the maximum wall pressure during the discharge of soybeans and different discharge conditions well. This demonstrates that the DEM simulations are useful for predicting flow patterns of soybeans with various moisture contents.

4. Conclusions

This study aimed to determine the flow patterns of soybeans in a cylindrical silo for maintaining a steady-state discharge mass flow rate for continuous soybean processing via experiments and DEM simulations. The effects of the physical properties of the soybeans on granular flow during discharging of silos with various orifice sizes were evaluated by experiments, and the parameters were used to validate DEM simulation. The values for the microscopic properties of the soybeans based on hydration were measured to reflect the real process. All of the microscopic properties changed with moisture content; however, the key parameters were the size, shape, and friction coefficients for the granular flow of the soybeans. The discharged mass flow rates for different moisture contents and different sizes of the silo orifice provided the critical size of the orifice. In this study, a reduced diameter of the orifice size was evaluated, and it was found that if Dred > 5.59, the flow showed a steady state. Based on the MFI, the flow patterns at 40% and 60% moisture content with 40 and 60 mm orifice sizes, respectively, showed funnel flows, although these conditions were satisfied to maintain a steady flow. The maximum wall pressure during discharging for the funnel flow showed the location of the interlocking phenomenon, where the stagnant zone begins during discharging. The DEM simulation predicted the flow patterns of the soybeans with varying moisture content for various orifice sizes well. This study demonstrates that the experiments and analytical approach with DEM simulation adequately predict the flow behaviors of soybeans with varying moisture contents, and this approach is expected to be useful for designing the hopper or silo for continuous food processing.

Supplementary Materials

The following supporting information can be downloaded at: https://www.mdpi.com/article/10.3390/pr10122622/s1, Figure S1: Mass profiles of soybeans with various moisture content during discharge at different orifice sizes obtained by experiments and simulations.

Author Contributions

Conceptualization, H.J. and W.B.Y.; methodology, H.J. and W.B.Y.; software, H.J.; investigation, H.J.; writing—original draft preparation, H.J. and W.B.Y.; writing—review and editing, H.J. and W.B.Y.; supervision, W.B.Y.; All authors have read and agreed to the published version of the manuscript.

Funding

Following are the results of a study on the “Leaders in INdustry-university Cooperation 3.0” Project [202210760001], supported by the Ministry of Education and National Research Foundation of Korea. This research was supported by the Basic Science Research Program through the National Research Foundation of Korea (NRF) funded by the Ministry of Education [grant number NRF-2018R1D1A3B06042501], [grant number NRF-2020-D-G035-010104], and [grant number 2021R1A6A1A0304424211].

Data Availability Statement

The data presented in this study are available on request from the corresponding author.

Conflicts of Interest

The authors declare no conflict of interest.

References

  1. Isanga, J.; Zhang, G. Soybean bioactive components and their implications to health—A review. Food Rev. Int. 2008, 24, 252–276. [Google Scholar] [CrossRef]
  2. Bayram, M.; Öner, M.D.; Kaya, A. Influence of soaking on the dimensions and colour of soybean for bulgur production. J. Food Eng. 2004, 61, 331–339. [Google Scholar] [CrossRef]
  3. Davies, R.M.; El-Okene, A.M. Moisture-dependent physical propeties of soybeans. Int. Agrophys. 2009, 23, 299–303. [Google Scholar]
  4. Kashaninejad, M.; Ahmadi, M.; Daraei, A.; Chabra, D. Handling and frictional characteristics of soybean as a function of moisture content and variety. Powder Technol. 2008, 188, 1–8. [Google Scholar] [CrossRef]
  5. Boac, J.M.; Casada, M.E.; Maghirang, R.G.; Harner, J.P. Material and Interaction Properties of Selected Grains and Oilseeds for Modeling Discrete Particles; American Society of Agricultural and Biological Engineers: Reno, NV, USA, 2009. [Google Scholar]
  6. Horabik, J.; Molenda, M. Parameters and contact models for DEM simulations of agricultural granular materials: A review. Biosyst. Eng. 2016, 147, 206–225. [Google Scholar] [CrossRef]
  7. Cheng, Z.; Leal, J.H.; Hartford, C.E.; Carson, J.W.; Donohoe, B.S.; Craig, D.A.; Xia, Y.; Daniel, R.C.; Ajayi, O.O.; Semelsberger, T.A. Flow behavior characterization of biomass Feedstocks. Powder Technol. 2021, 387, 156–180. [Google Scholar] [CrossRef]
  8. Hirshfeld, D.; Rapaport, D.C. Granular flow from a silo: Discrete-particle simulations in three dimensions. Eur. Phys. J. E 2001, 4, 193–199. [Google Scholar] [CrossRef]
  9. Thompson, S.A.; Ross, I.J. Compressibility and frictional coefficients of wheat. Trans. ASAE 1983, 26, 1171–1176. [Google Scholar] [CrossRef]
  10. Balevičius, R.; Kačianauskas, R.; Mroz, Z.; Sielamowicz, I. Analysis and DEM simulation of granular material flow patterns in hopper models of different shapes. Adv. Powder Technol. 2011, 22, 226–235. [Google Scholar] [CrossRef]
  11. González-Montellano, C.; Ramírez, Á.; Gallego, E.; Ayuga, F. Validation and experimental calibration of 3D discrete element models for the simulation of the discharge flow in silos. Chem. Eng. Sci. 2011, 66, 5116–5126. [Google Scholar] [CrossRef]
  12. Parafiniuk, P.; Molenda, M.; Horabik, J. Discharge of rapeseeds from a model silo: Physical testing and discrete element method simulations. Comput. Electron. Agric. 2013, 97, 40–46. [Google Scholar] [CrossRef]
  13. Xu, T.; Yu, J.; Yu, Y.; Wang, Y. A modelling and verification approach for soybean seed particles using the discrete element method. Adv. Powder Technol. 2018, 29, 3274–3290. [Google Scholar] [CrossRef]
  14. Wang, J.; Xu, C.; Xu, W.; Fu, Z.; Wang, Q.; Tang, H. Discrete element method simulation of rice grain motion during discharge with an auger operated at various inclinations. Biosyst. Eng. 2022, 223, 97–115. [Google Scholar] [CrossRef]
  15. González-Montellano, C.; Fuentes, J.M.; Ayuga-Téllez, E.; Ayuga, F. Determination of the mechanical properties of maize grains and olives required for use in DEM simulations. J. Food Eng. 2012, 111, 553–562. [Google Scholar] [CrossRef]
  16. Ghodki, B.M.; Goswami, T.K. DEM simulation of flow of black pepper seeds in cryogenic grinding system. J. Food Eng. 2017, 196, 36–51. [Google Scholar] [CrossRef]
  17. Ketterhagen, W.R.; Bharadwaj, R.; Hancock, B.C. The coefficient of rolling resistance (CoRR) of some pharmaceutical tablets. Int. J. Pharm. 2010, 392, 107–110. [Google Scholar] [CrossRef]
  18. González-Montellano, C.; Ayuga, F.; Ooi, J.Y. Discrete element modelling of grain flow in a planar silo: Influence of simulation parameters. Granul. Matter 2011, 13, 149–158. [Google Scholar] [CrossRef]
  19. Johanson, J.R. Stress and velocity fields in the gravity flow of bulk solids. J. Appl. Mech. 1964, 31, 499–506. [Google Scholar] [CrossRef]
  20. Tsuji, Y.; Tanaka, T.; Ishida, T. Lagrangian numerical simulation of plug flow of cohesionless particles in a horizontal pipe. Powder Technol. 1992, 71, 239–250. [Google Scholar] [CrossRef]
  21. Cundall, P.A.; Strack, O.D. A discrete numerical model for granular assemblies. Geotechnique 1979, 29, 47–65. [Google Scholar] [CrossRef]
  22. Zhao, Y.; Yang, S.; Zhang, L.; Chew, J.W. Understanding the varying discharge rates of lognormal particle size distributions from a hopper using the discrete element method. Powder Technol. 2019, 342, 356–370. [Google Scholar] [CrossRef]
  23. Mishra, B.K. A review of computer simulation of tumbling mills by the discrete element method: Part I—Contact mechanics. Int. J. Miner. Process. 2003, 71, 73–93. [Google Scholar] [CrossRef]
  24. Soyoye, B.O.; Ademosun, O.C.; Agbetoye, L.A. Determination of some physical and mechanical properties of soybean and maize in relation to planter design. Agric. Eng. Int. CIGR J. 2018, 20, 81–89. [Google Scholar]
  25. Koizumi, M.; Kikuchi, K.; Isobe, S.; Ishida, N.; Naito, S.; Kano, H. Role of seed coat in imbibing soybean seeds observed by micro-magnetic resonance imaging. Ann. Bot. 2008, 102, 343–352. [Google Scholar] [CrossRef]
  26. Altuntas, E.; Demirtola, H. Effect of moisture content on physical properties of some grain legume seeds. N. Z. J. Crop Hortic. Sci. 2007, 35, 423–433. [Google Scholar] [CrossRef]
  27. Höhner, D.; Wirtz, S.; Scherer, V. Experimental and numerical investigation on the influence of particle shape and shape approximation on hopper discharge using the discrete element method. Powder Technol. 2013, 235, 614–627. [Google Scholar] [CrossRef]
  28. Zhong, Z.; Ooi, J.Y.; Rotter, J.M. The sensitivity of silo flow and wall stresses to filling method. Eng. Struct. 2001, 23, 756–767. [Google Scholar] [CrossRef]
  29. Pasha, M.; Hare, C.; Ghadiri, M.; Gunadi, A.; Piccione, P.M. Effect of particle shape on flow in discrete element method simulation of a rotary batch seed coater. Powder Technol. 2016, 296, 29–36. [Google Scholar] [CrossRef] [Green Version]
  30. Qutob, D.; Ma, F.; Peterson, C.A.; Bernards, M.A.; Gijzen, M. Structural and permeability properties of the soybean seed coat. Bot. 2008, 86, 219–227. [Google Scholar] [CrossRef]
  31. Wensrich, C.M.; Katterfeld, A. Rolling friction as a technique for modelling particle shape in DEM. Powder Technol. 2012, 217, 409–417. [Google Scholar] [CrossRef]
  32. Liu, S.D.; Zhou, Z.Y.; Zou, R.P.; Pinson, D.; Yu, A.B. Flow characteristics and discharge rate of ellipsoidal particles in a flat bottom hopper. Powder Technol. 2014, 253, 70–79. [Google Scholar] [CrossRef]
Figure 1. Schematic illustration of the soybean grain shape.
Processes 10 02622 g001
Figure 2. Schematic apparatus and method of determination of the particle–particle coefficient of restitution before (a) and after (b) impact of the soybeans, and the image taken during the experiment (c).
Processes 10 02622 g002
Figure 3. Schematic apparatus and method to determine the particle–wall coefficient of restitution (a) and the image taken during the experiment (b).
Processes 10 02622 g003
Figure 4. Schematic drawing (a) and image (b) of the apparatus to measure the coefficient of rolling friction.
Processes 10 02622 g004
Figure 5. Schematic picture and photo of the experimental setup ((a) and (b), respectively) of the silo for discharge of soybeans, and the soybean-filled silo with the marker soybeans (c).
Processes 10 02622 g005
Figure 6. Shape and size changes of soybeans by moisture content.
Processes 10 02622 g006
Figure 7. Mass profiles of soybeans with different moisture contents (12, 20, 40, and 60%) discharged through orifices of different sizes: (a) 40 mm, (b) 50 mm, and (c) 60 mm. Insets are the expanded mass profiles.
Processes 10 02622 g007
Figure 8. Discharge rate profiles of soybeans with various moisture contents at different orifice sizes of the silo: (a) 12%, (b) 20%, (c) 40%, and (d) 60% moisture content.
Processes 10 02622 g008
Figure 9. Wall pressures measured at different locations on the silo wall during discharging of soybeans with different moisture contents: (a) 12% and 40 mm orifice, (b) 40% and 40 mm orifice, (c) 40% and 60 mm orifice, and (d) 60% and 60 mm orifice.
Processes 10 02622 g009
Figure 10. Discharge process in the simulation for the soybeans with 12% moisture content at 40 mm orifice size (a), and shapes of the soybean particles for DEM simulations of grains with 12% (b) and 60% (c) moisture contents.
Processes 10 02622 g010
Figure 11. Mass profiles for soybeans with 12% and 60% moisture content at 40 and 60 mm orifice sizes, respectively, obtained by experiments and simulations during discharge.
Processes 10 02622 g011
Figure 12. Simulated contact force profiles with the wall at locations B and C in the silo during discharge of soybeans: (a) 12% moisture and 40 mm orifice; (b) 60% moisture and 60 mm orifice.
Processes 10 02622 g012
Table 1. Sizes of soybean grains with various moisture content.
Properties (mm)Moisture Content (% w.b.)
12204060
Length8.20 ± 0.31 a8.67 ± 0.41 a10.44 ± 0.45 b14.61 ± 0.66 c
Width7.52 ± 0.37 a7.61 ± 0.38 a7.80 ± 0.41 a8.74 ± 0.35 b
Thickness7.93 ± 0.32 a8.04 ± 0.33 a8.40 ± 0.35 a9.69 ± 0.28 b
Geometric mean diameter (dmean)7.88 ± 0.30 a8.09 ± 0.34 ab8.81 ± 0.33 b10.73 ± 0.32 c
Sphericity (ϕ)96.07 ± 1.92 c93.45 ± 1.93 c84.45 ± 2.62 b73.55 ± 1.81 a
Means in the same row with different letters (a–c) are significantly different (p < 0.05, ANOVA).
Table 2. Physical properties of the soybean grains with various moisture contents.
PropertiesMoisture Content (% w.b.)
12204060
Poisson’s ratio (μ)0.138 ± 0.030 a0.151 ± 0.045 a0.296 ± 0.045 b0.106 ± 0.013 a
Young’s modulus (E (MPa))2932.9 ± 213.8 d815.8 ± 83.7 c10.5 ± 1.4 a70.8 ± 8.3 b
Particle-particle coefficient of restitution (ep)0.434 ± 0.100 a0.455 ± 0.093 a0.370 ± 0.130 a0.323 ± 0.158 a
Particle-wall coefficient of restitution (ew)0.367 ± 0.078 a0.503 ± 0.032 b0.443 ± 0.064 ab0.428 ± 0.135 ab
Particle-wall coefficient of static friction (μw)0.267 ± 0.048 a0.319 ± 0.015 a0.631 ± 0.120 b1.971 ± 0.445 c
Particle-wall coefficient of rolling friction (μr)0.043 ± 0.018 a0.051 ± 0.014 a0.084 ± 0.021 ab0.140 ± 0.049 b
Means in the same row with different letters (a–d) are significantly different (p < 0.05, ANOVA).
Table 3. Discharge times and flow rates of soybeans with various moisture content at different orifice sizes.
Orifice Size (mm)Moisture Content (% w.b.)
Discharge Time (s)Flow Rate (kg/s)
1220406012204060
4019.0019.6040.30-0.370.360.20-
5011.5011.4014.5018.200.610.610.480.40
606.206.208.109.901.151.120.870.72
Table 4. Reduced diameter at different moisture content for different orifice diameters.
Orifice Size (mm)Reduced Diameter (Dred)
Moisture Content (%)
12204060
405.084.944.543.73
506.356.185.684.66
607.617.426.815.59
Table 5. Mass flow index (MFI) values of soybeans with various moisture content during discharging from the silo with various orifice sizes.
Orifice Size (mm)Mass Flow Index (MFI)
Moisture Content (%)
12204060
400.45 ± 0.01 b0.49 ± 0.02 b0.30 ± 0.02 a-
500.53 ± 0.02 c0.51 ± 0.02 c0.34 ± 0.03 b0.27 ± 0.02 a
600.55 ± 0.02 b0.52 ± 0.01 b0.35 ± 0.02 a0.30 ± 0.02 a
Means in the same row with different letters (a–c) are significantly different (p < 0.05, ANOVA).
Publisher’s Note: MDPI stays neutral with regard to jurisdictional claims in published maps and institutional affiliations.