
Experimental Investigation of Non-Linear Seepage Characteristics in Rock Discontinuities and Morphology of the Shear Section in the Shear Process

Abstract
:1. Introduction
2. Materials and Methods
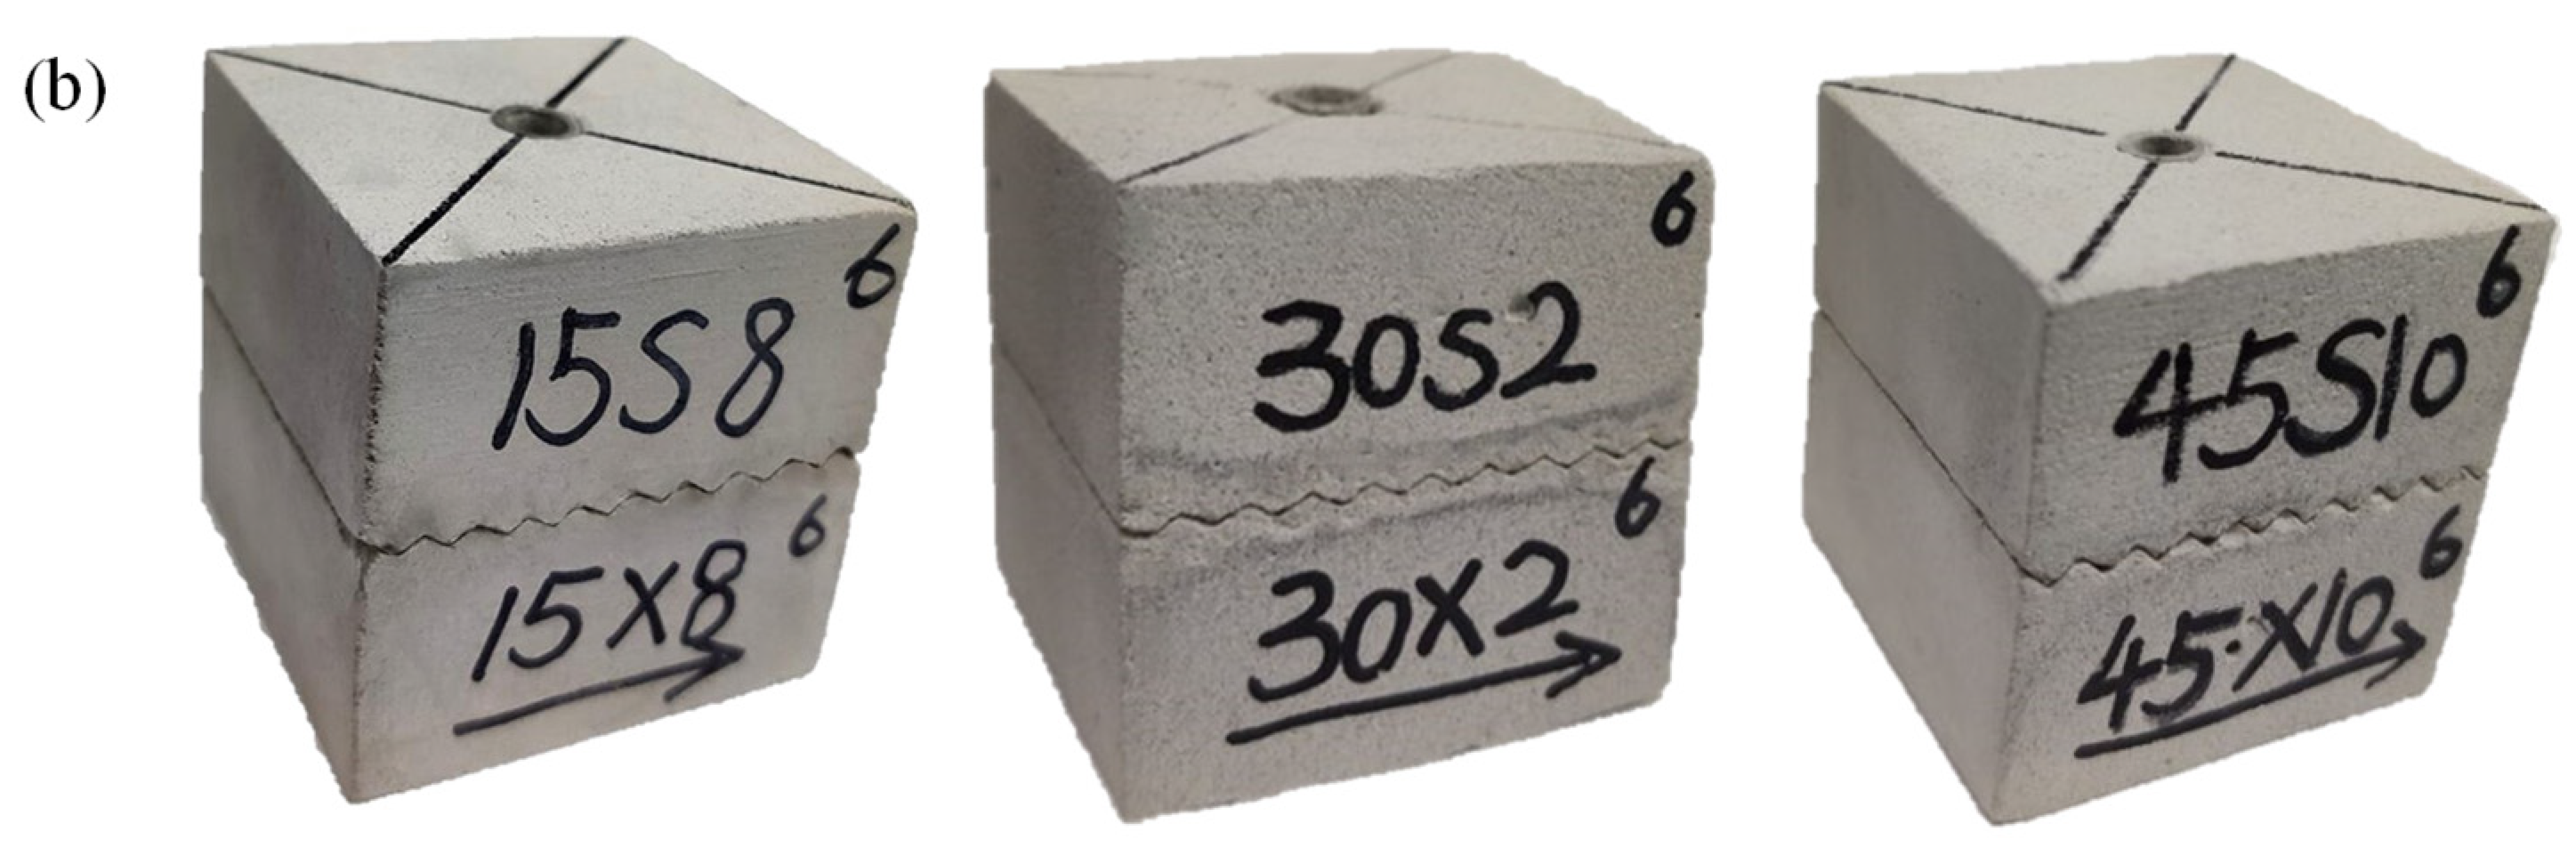
2.1. Samples
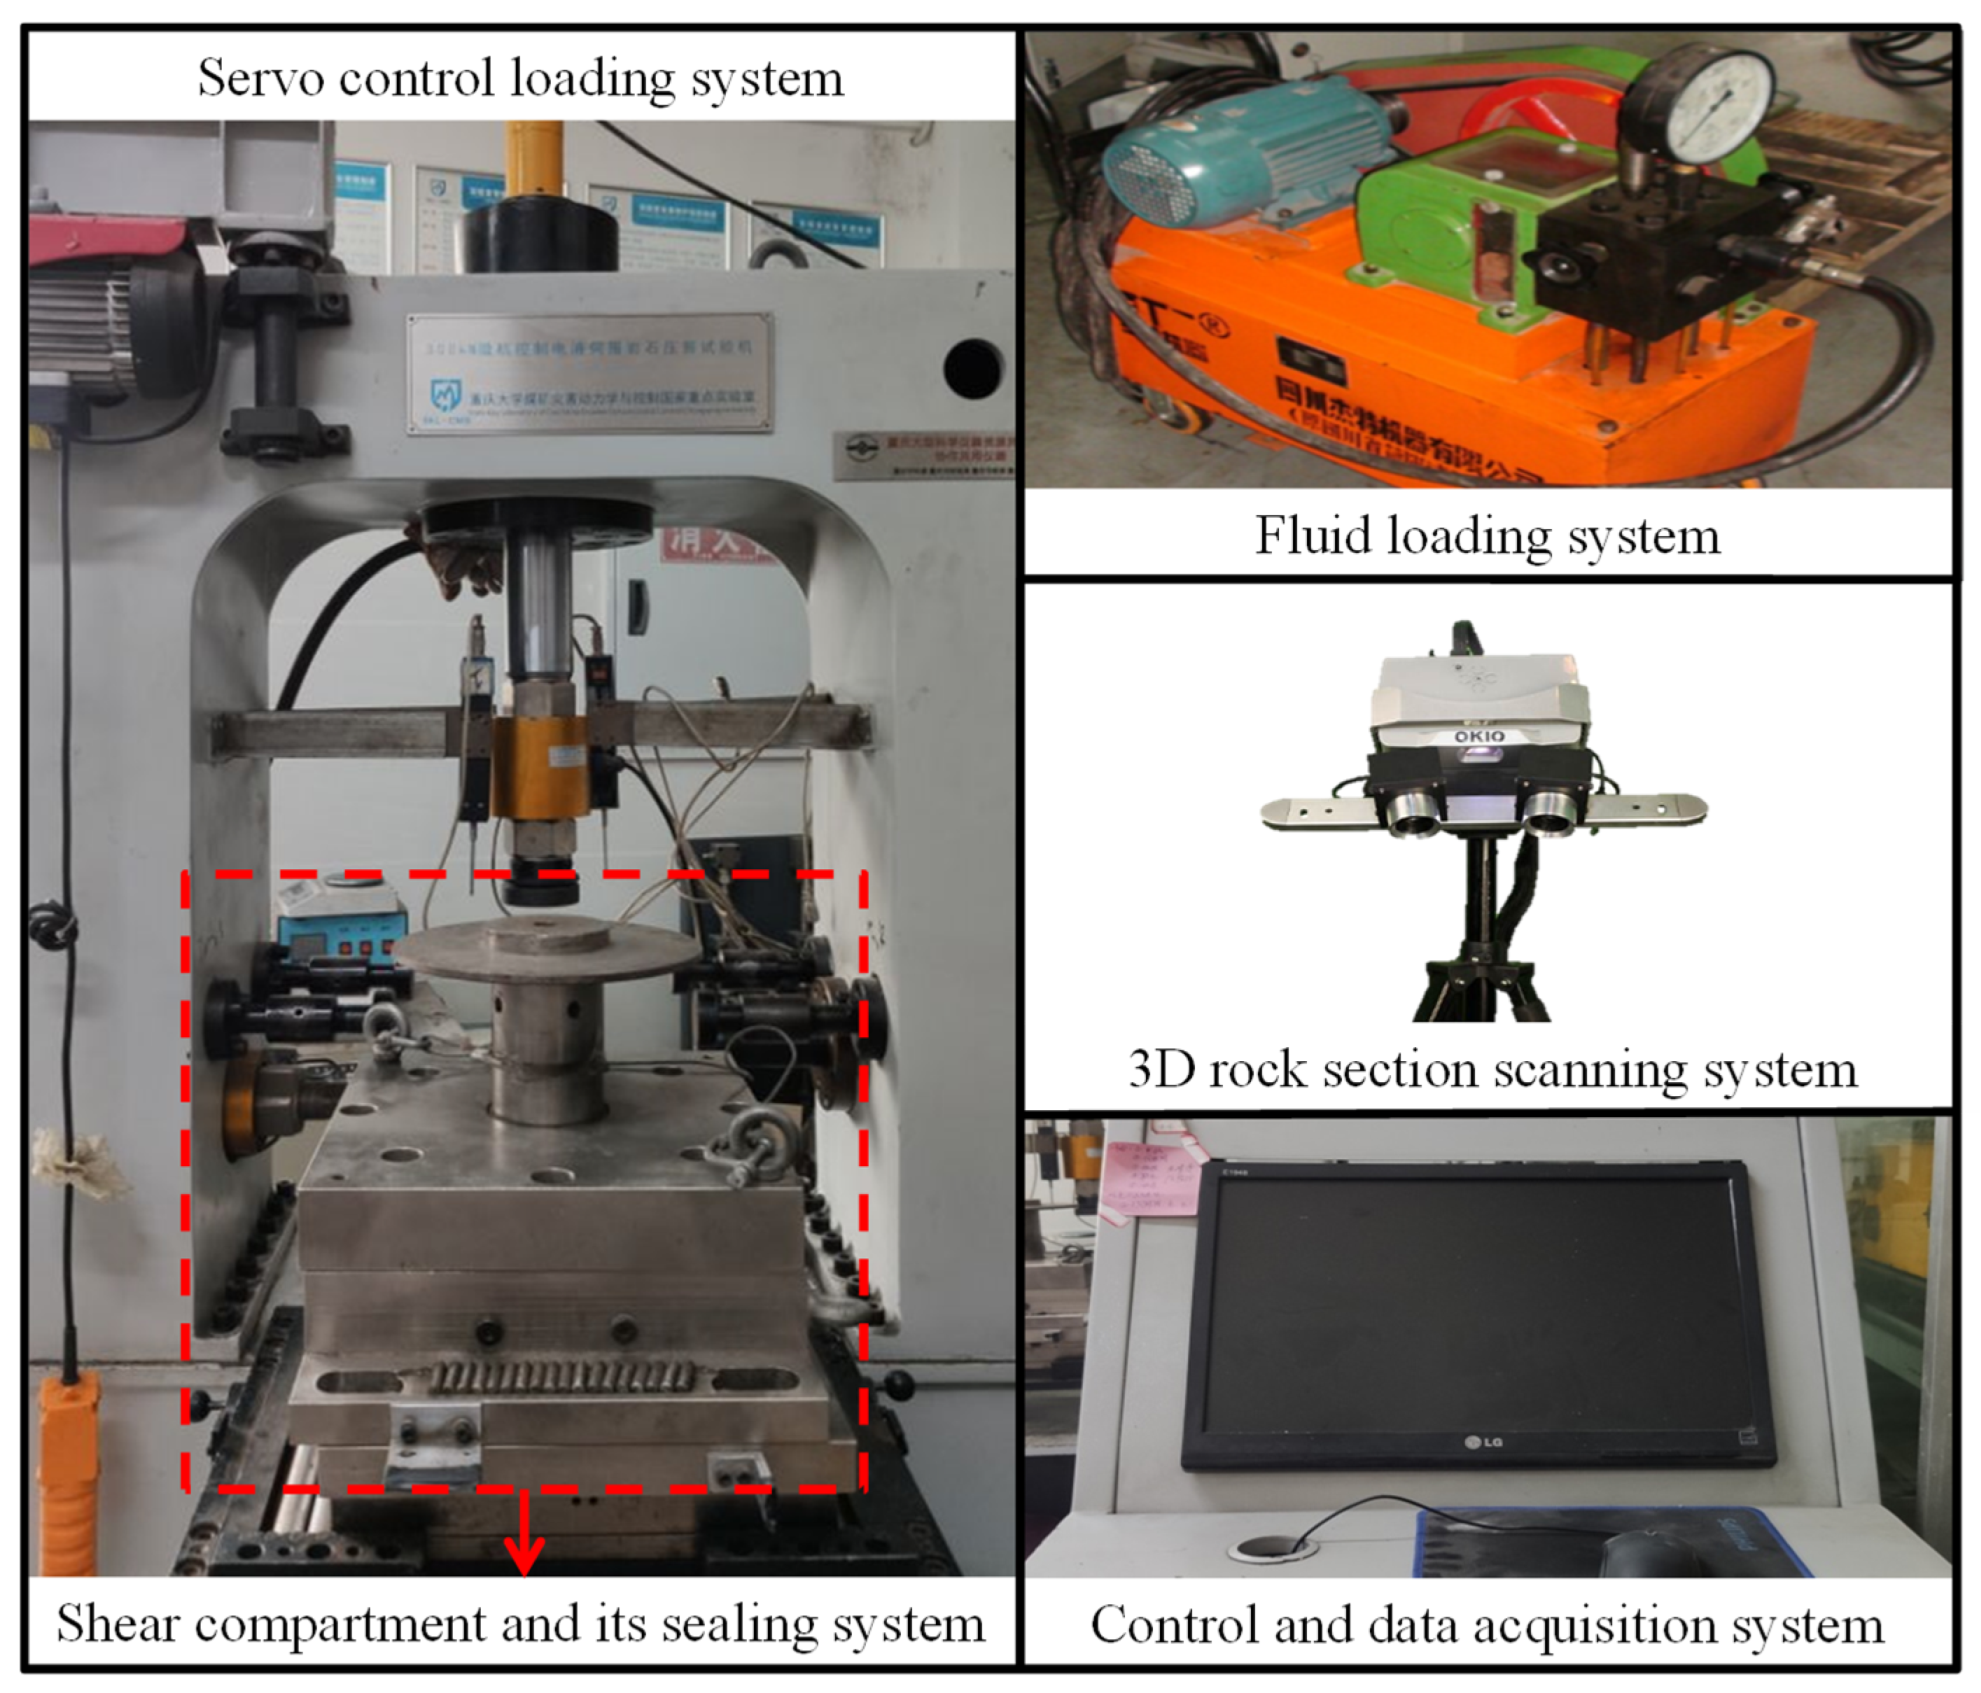
2.2. Test Device
2.3. Shear Tests
2.3.1. Test Program
2.3.2. Experimental Steps
3. Results
3.1. Shear Mechanical Properties of Structural Planes
3.2. Non-Linear Seepage Characteristics of the Structural Plane
3.2.1. Non-Linear Seepage Characteristics
3.2.2. Critical Reynolds Number Criterion
3.3. Three-Dimensional Morphological Characteristics of Structural Planes
4. Conclusions
- (1)
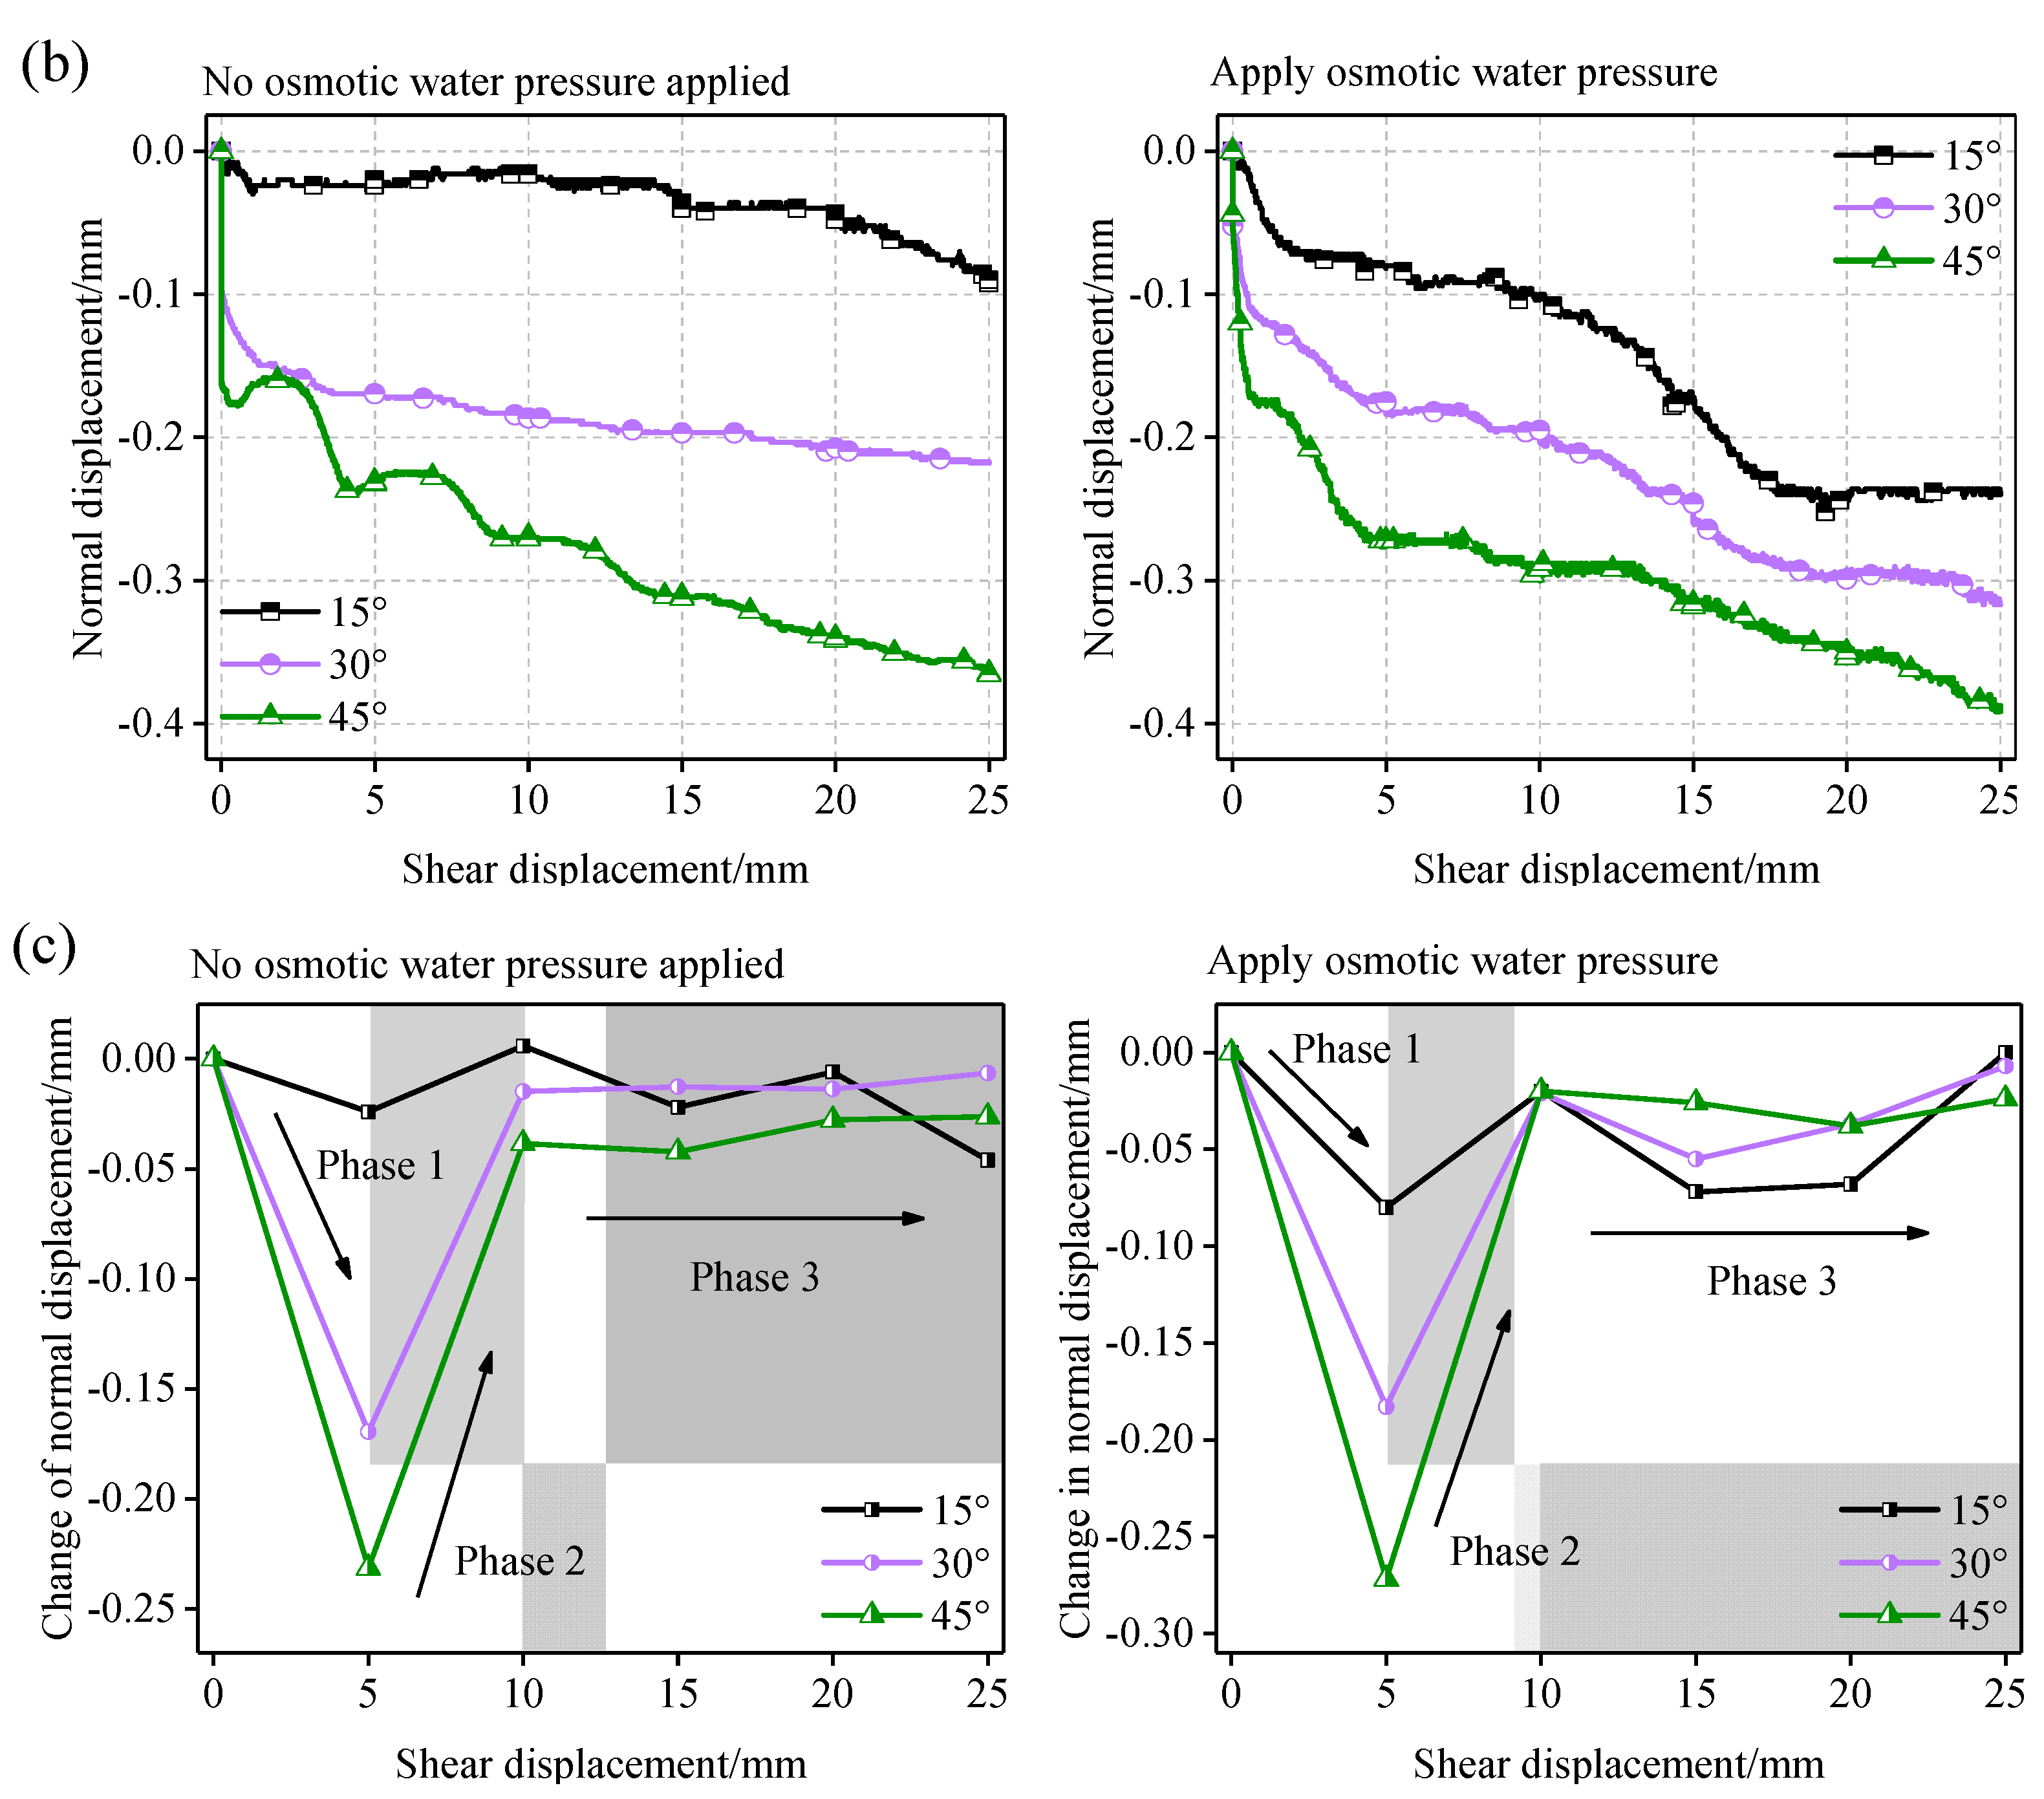
- The shear stresses at structural planes involving different undulation angles fluctuated and showed an increasing trend as the shear displacement increased. The normal displacement associated with an adjacent shear step initially increased and then decreased before stabilising. The shear strength at a structural plane and variation in the normal displacement increased as the undulation angle increased, and the associated shear expansion was enhanced.
- (2)
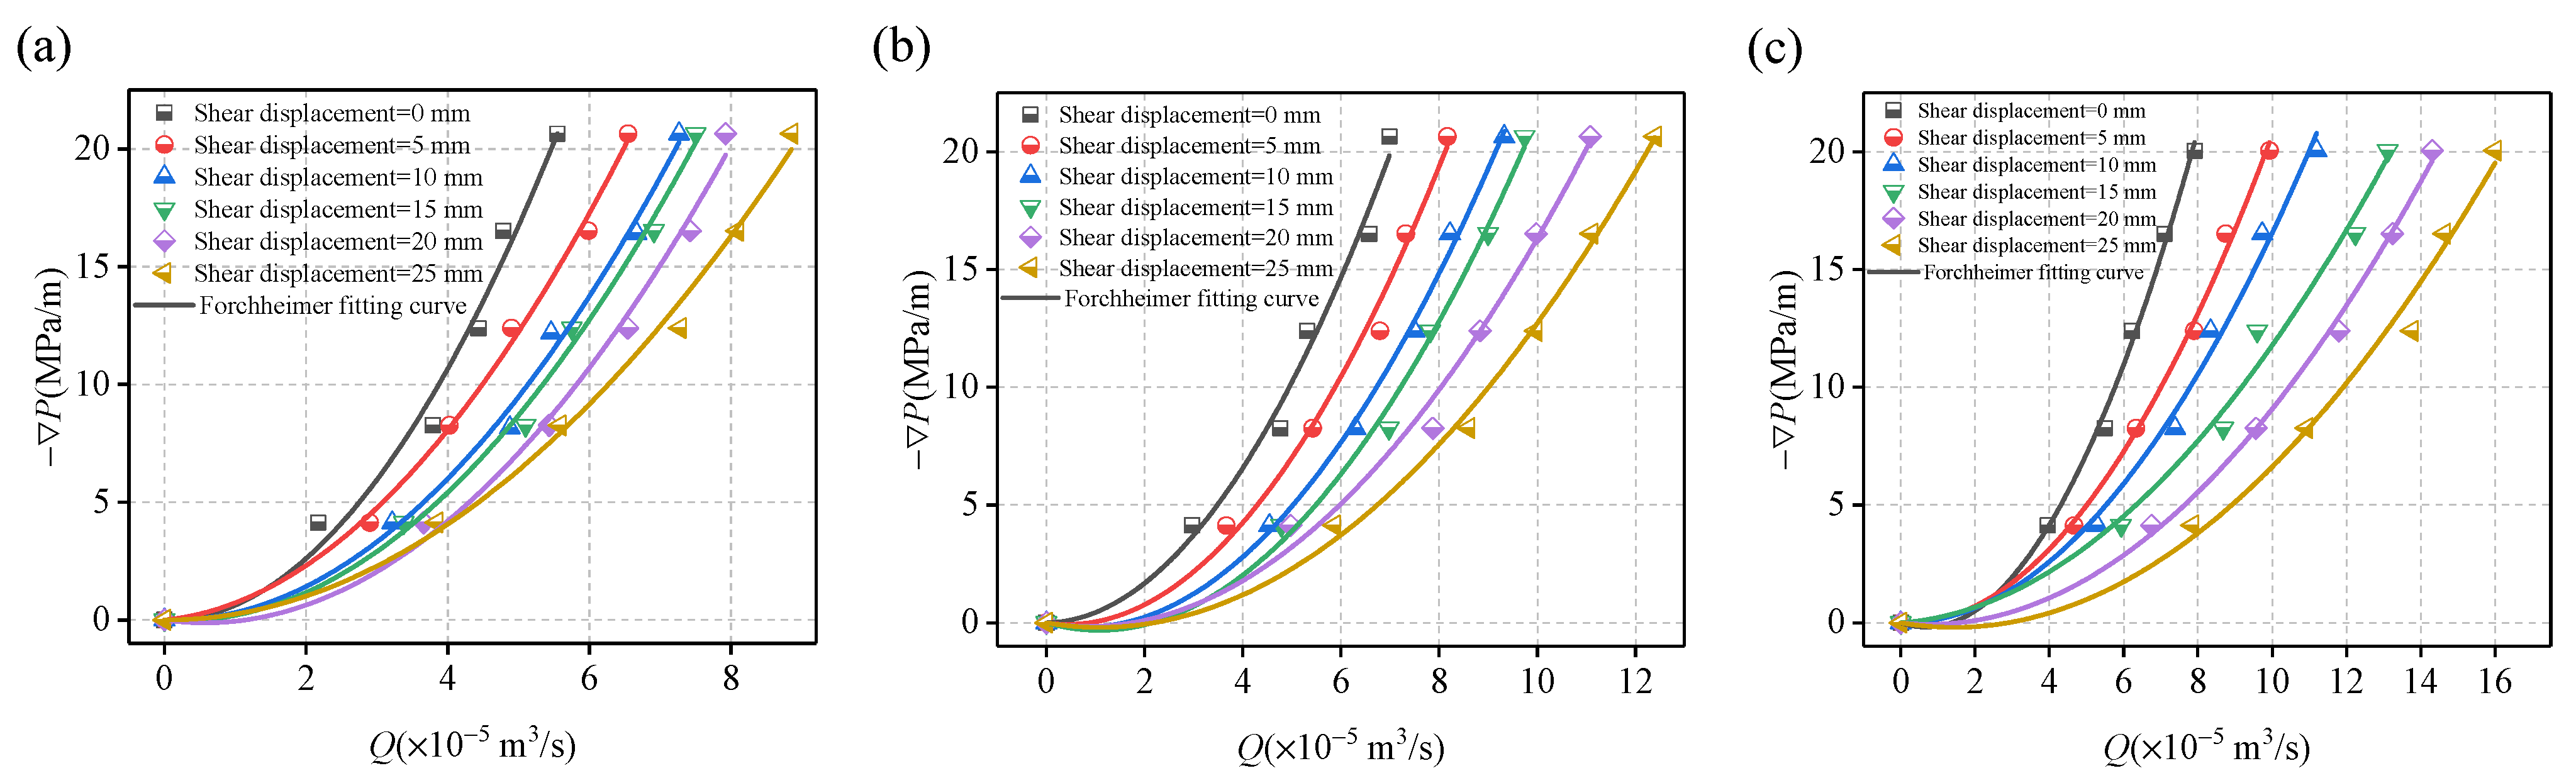
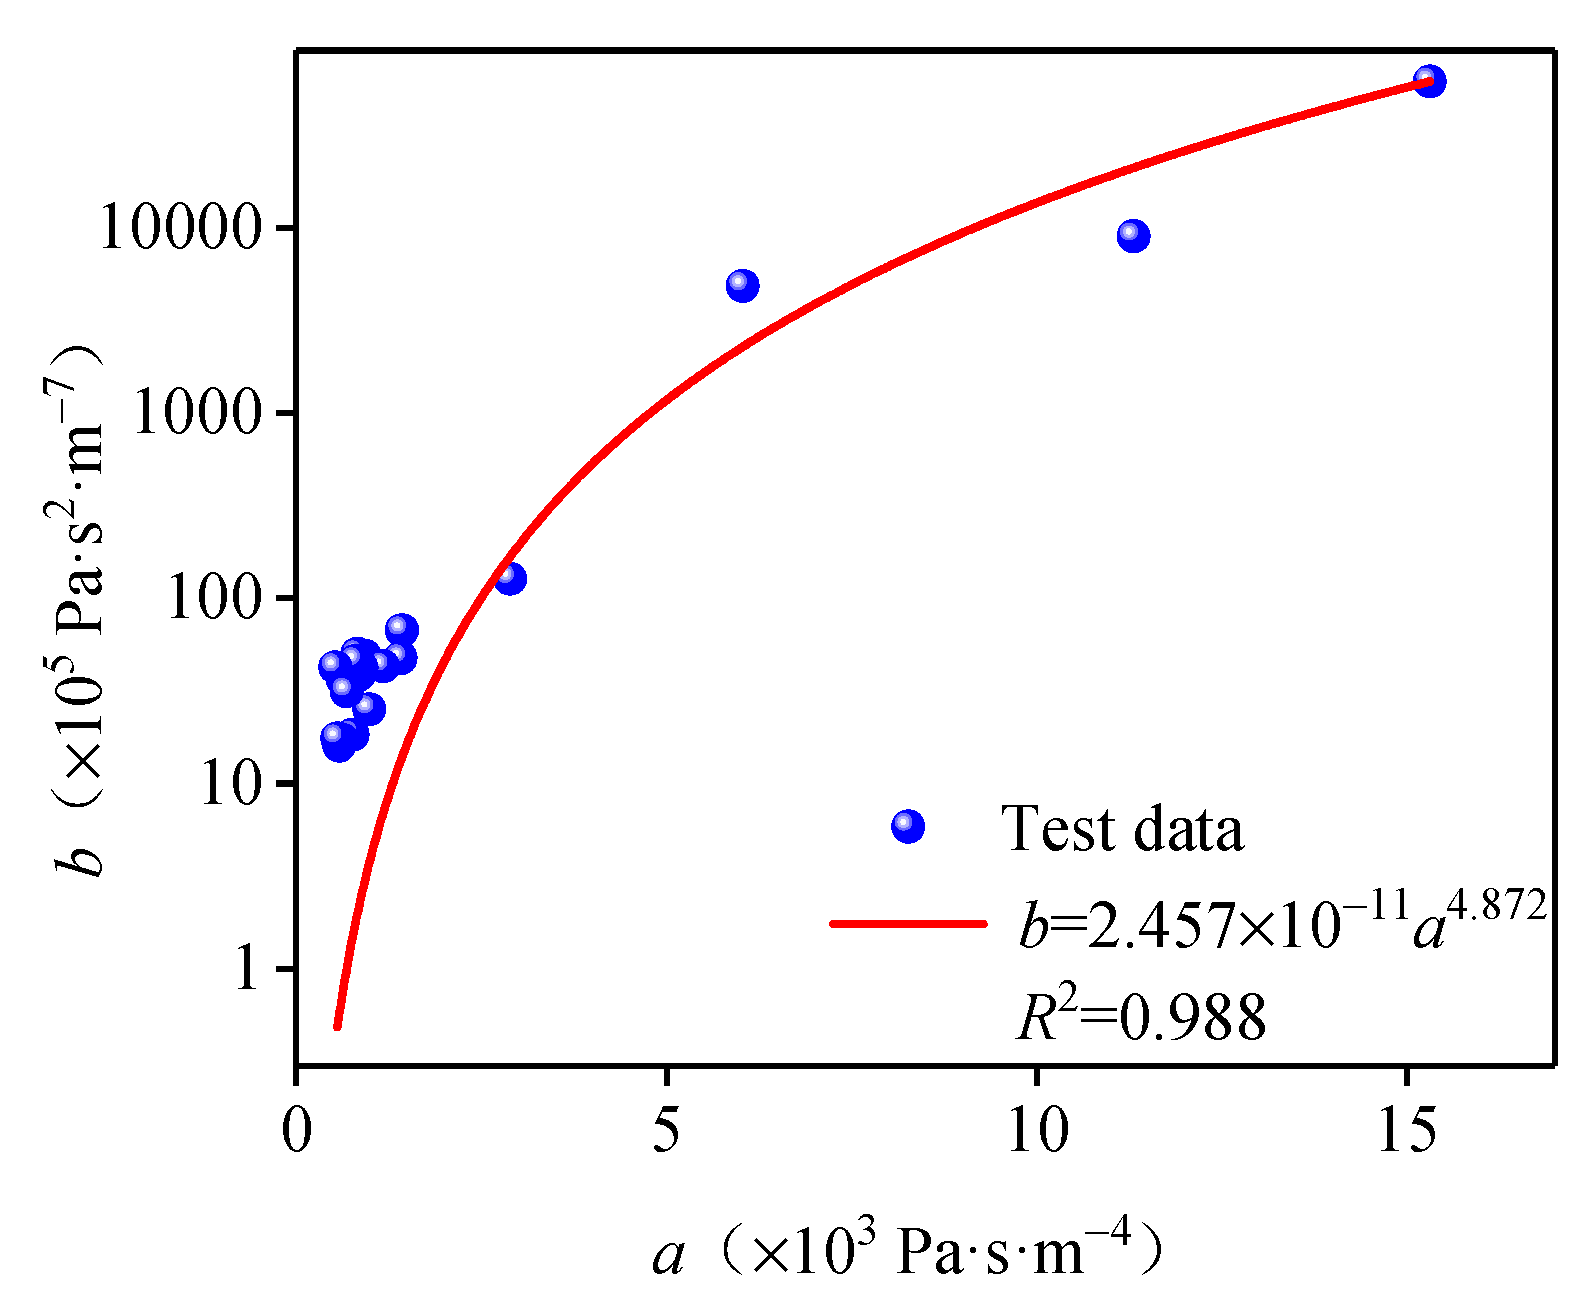
- Under an identical hydraulic gradient, the seepage flow associated with structural planes of equal undulating angles increased as the shear displacement increased. By contrast, both the linear term coefficient a and non-linear term coefficient b in the Forchheimer fitting equation decreased as the shear displacement increased. Fitting of the data generated produced the following empirical relationship between a and b: b = 2.457 × 10⁻¹¹ a4.872.
- (3)
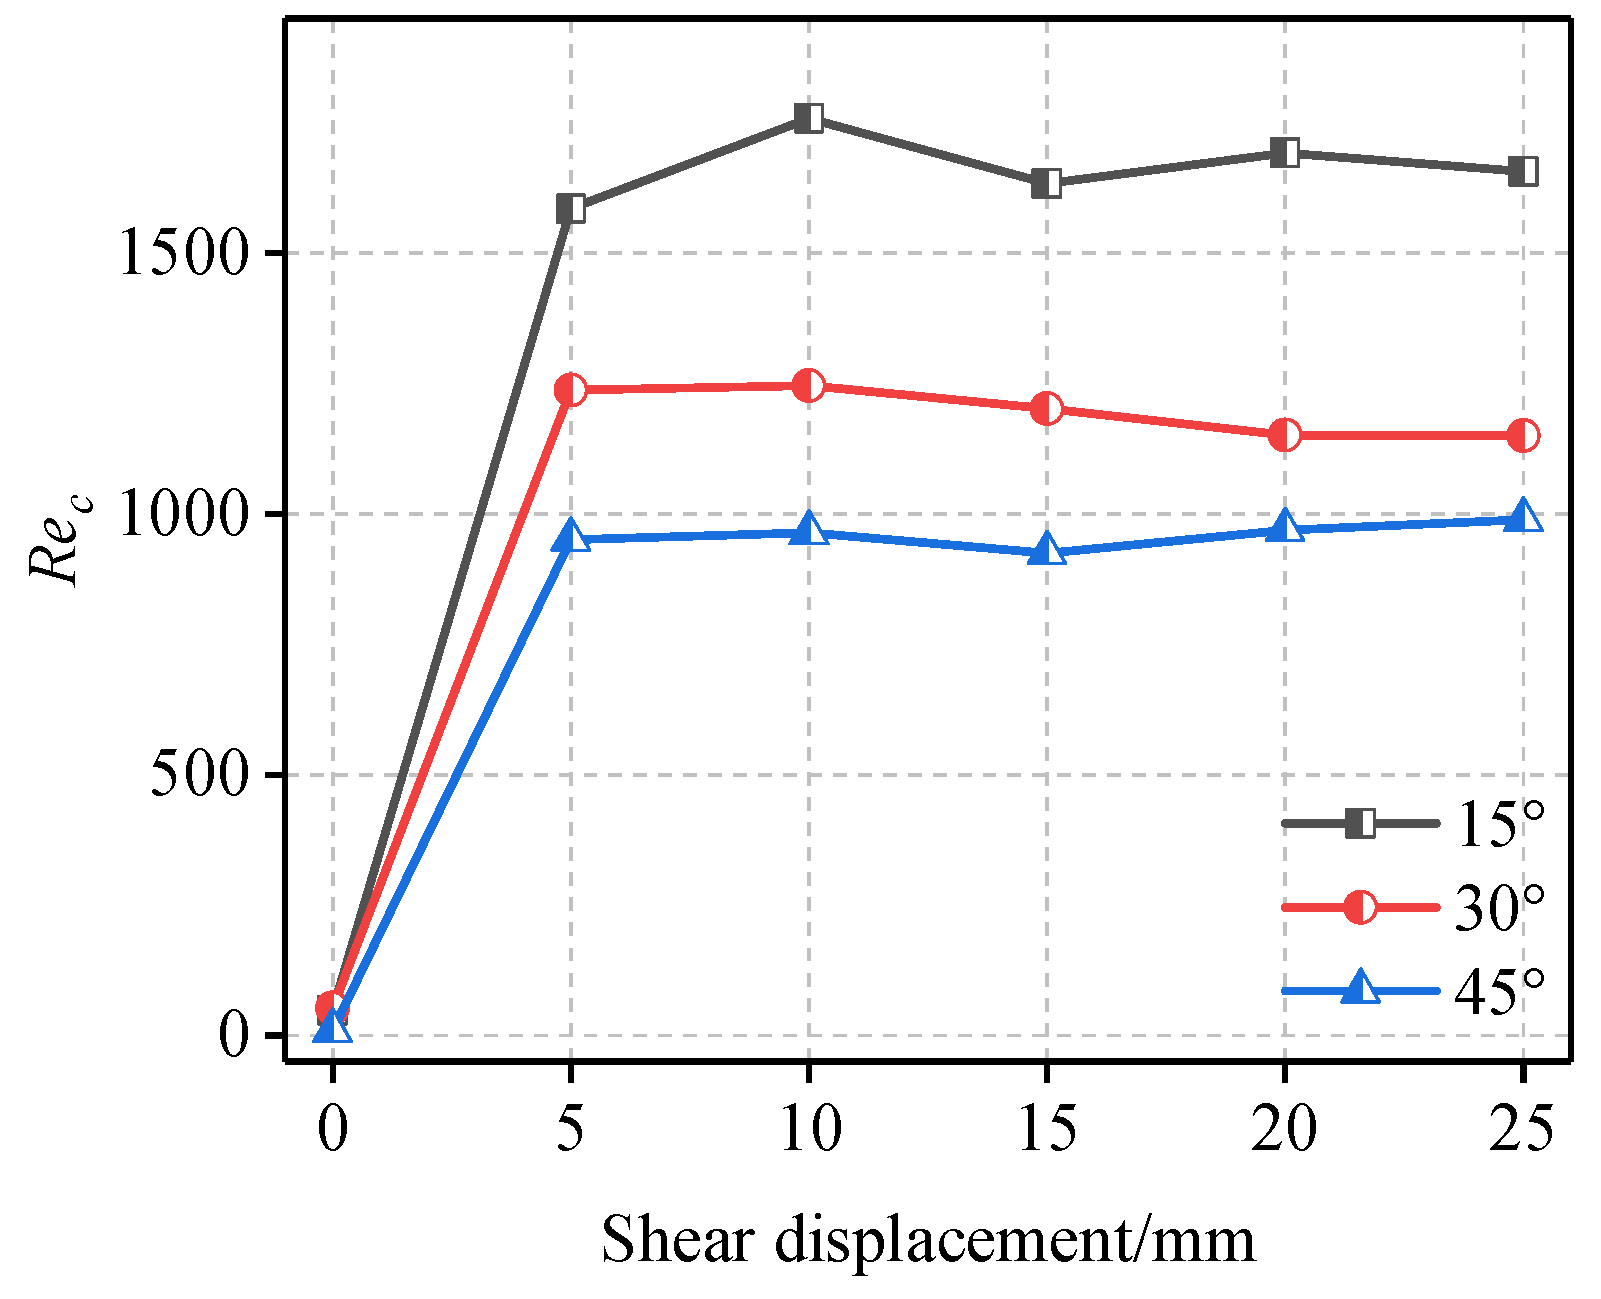
- An analysis of the effects of losses in the non-linear inertial force on the hydraulic gradient enabled the establishment of the variation pattern and range of the critical Reynolds number. During shearing at a structural plane, as the shear displacement increased, the critical Reynolds number initially increased and subsequently stabilised. Critical Reynolds numbers that were obtained in the present study varied from 9.65 to 1758.52.
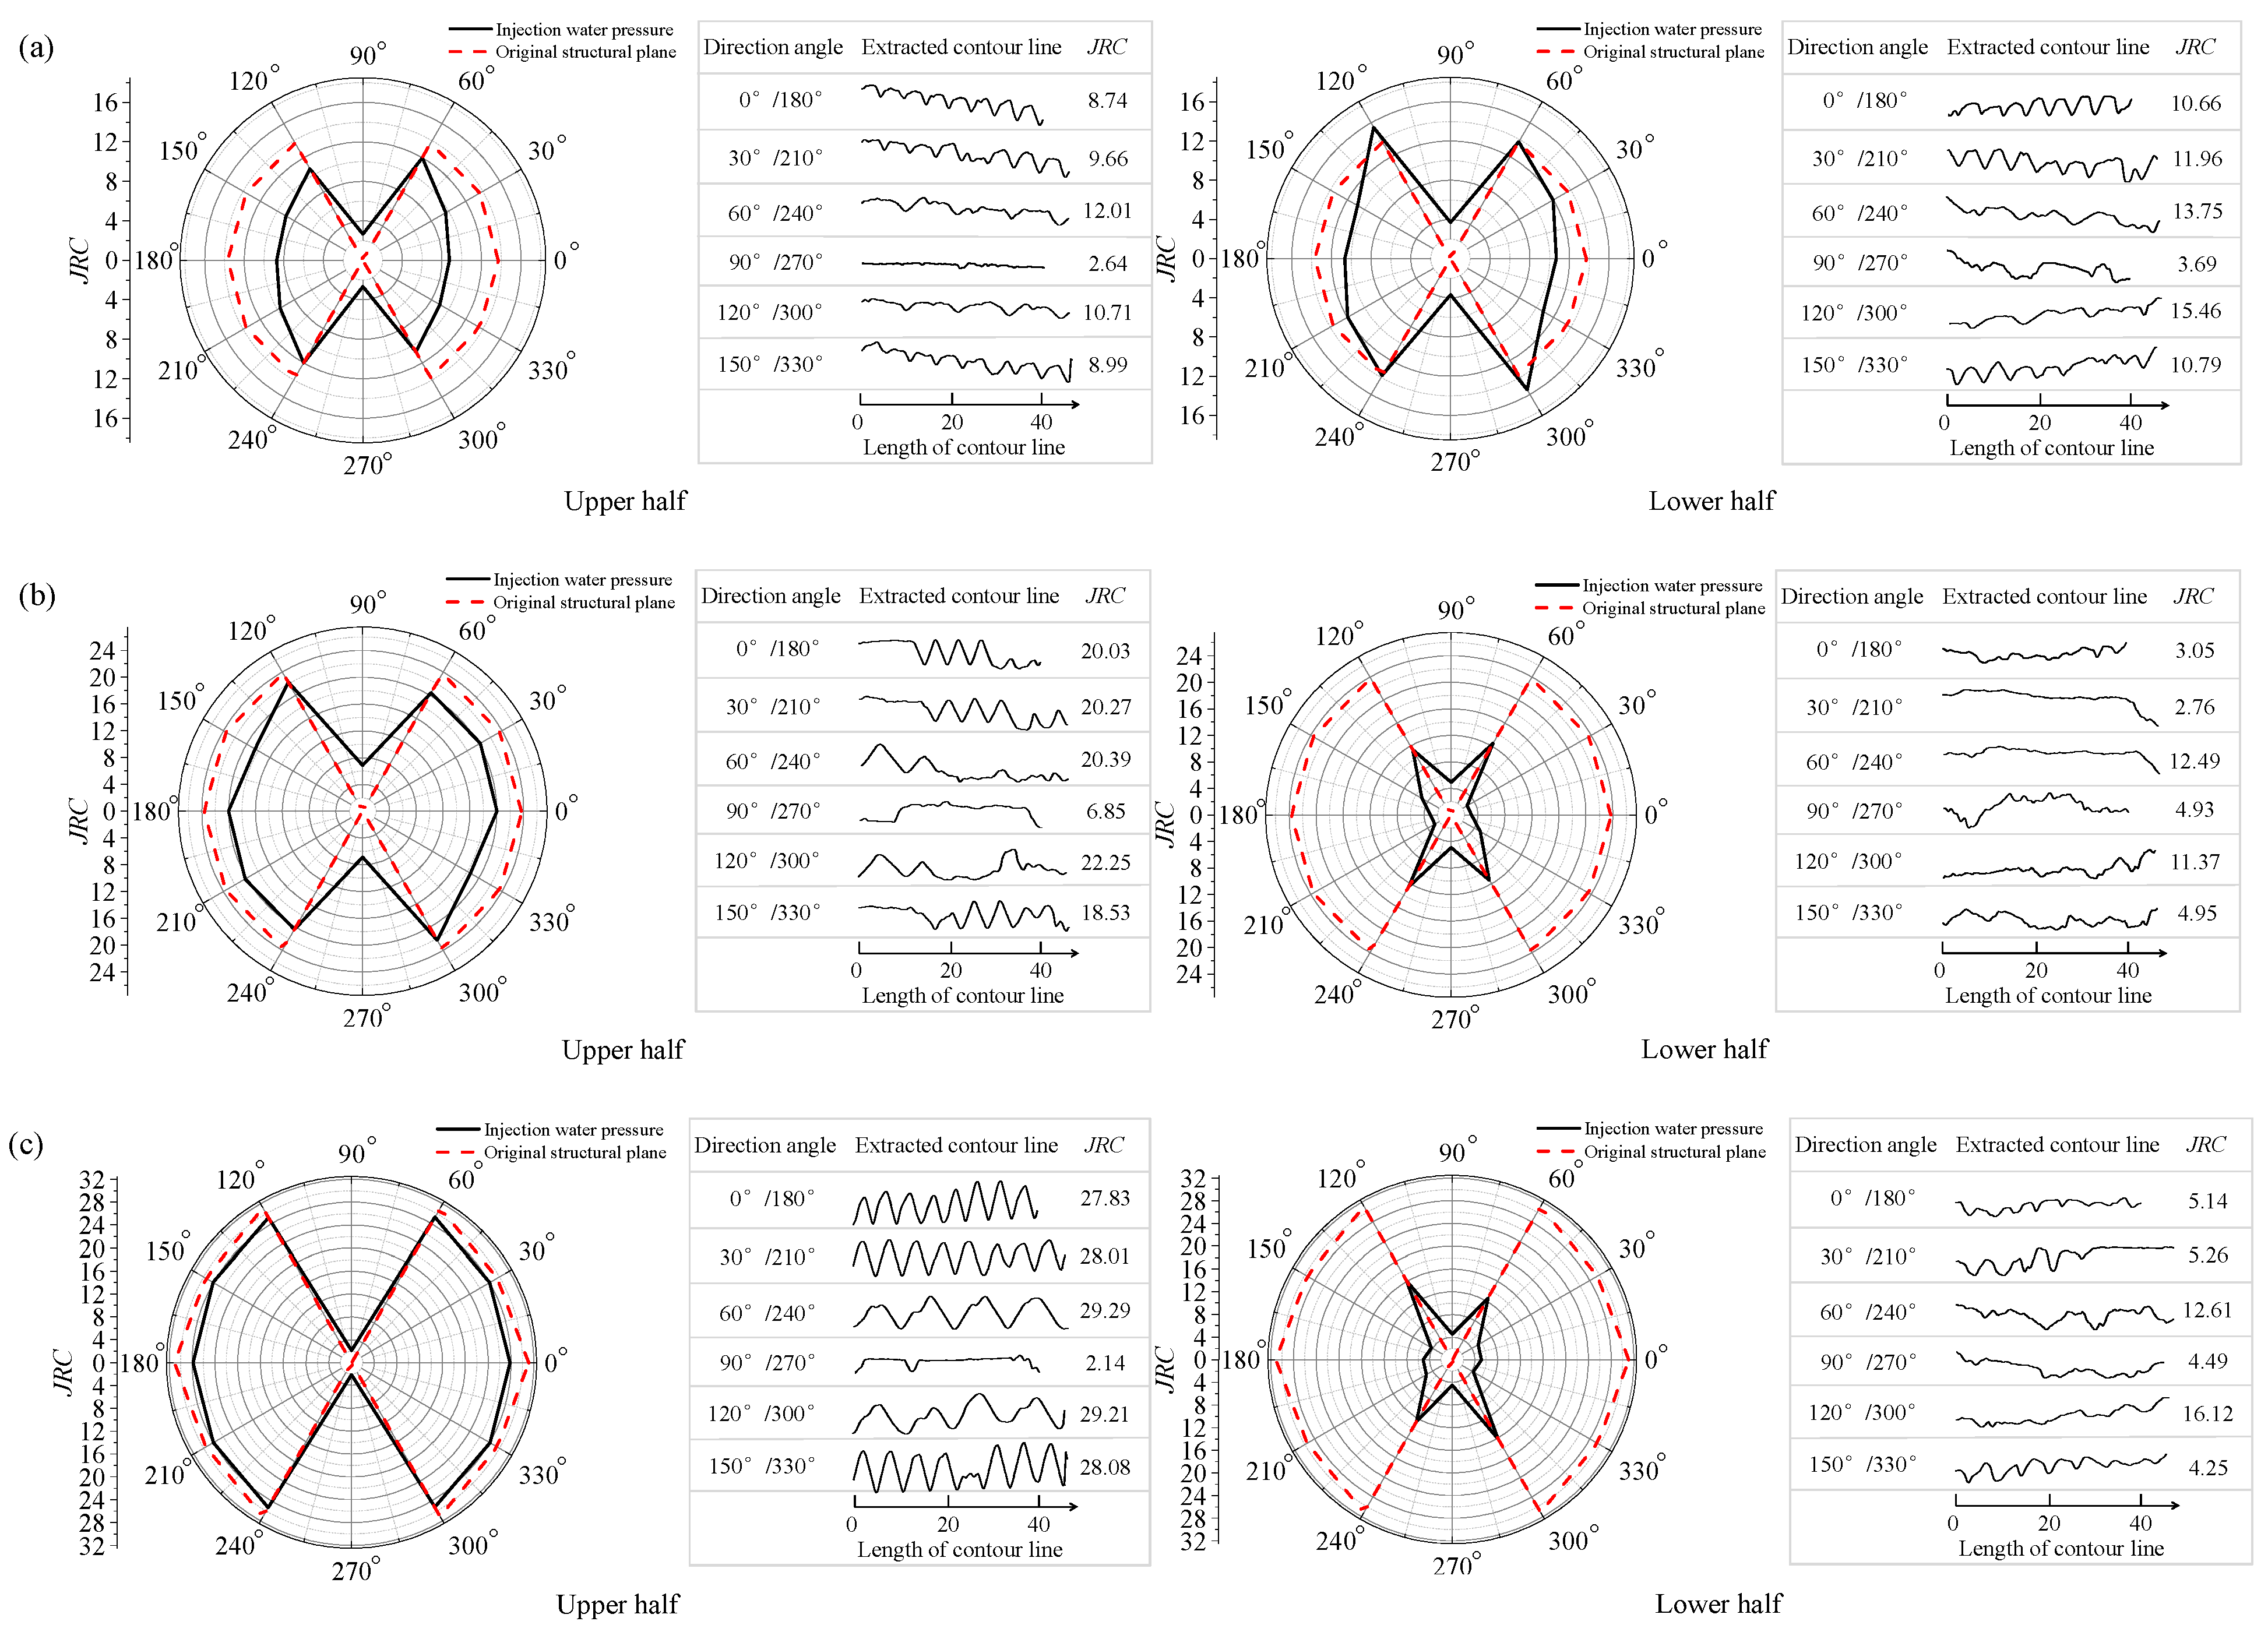
- (4)
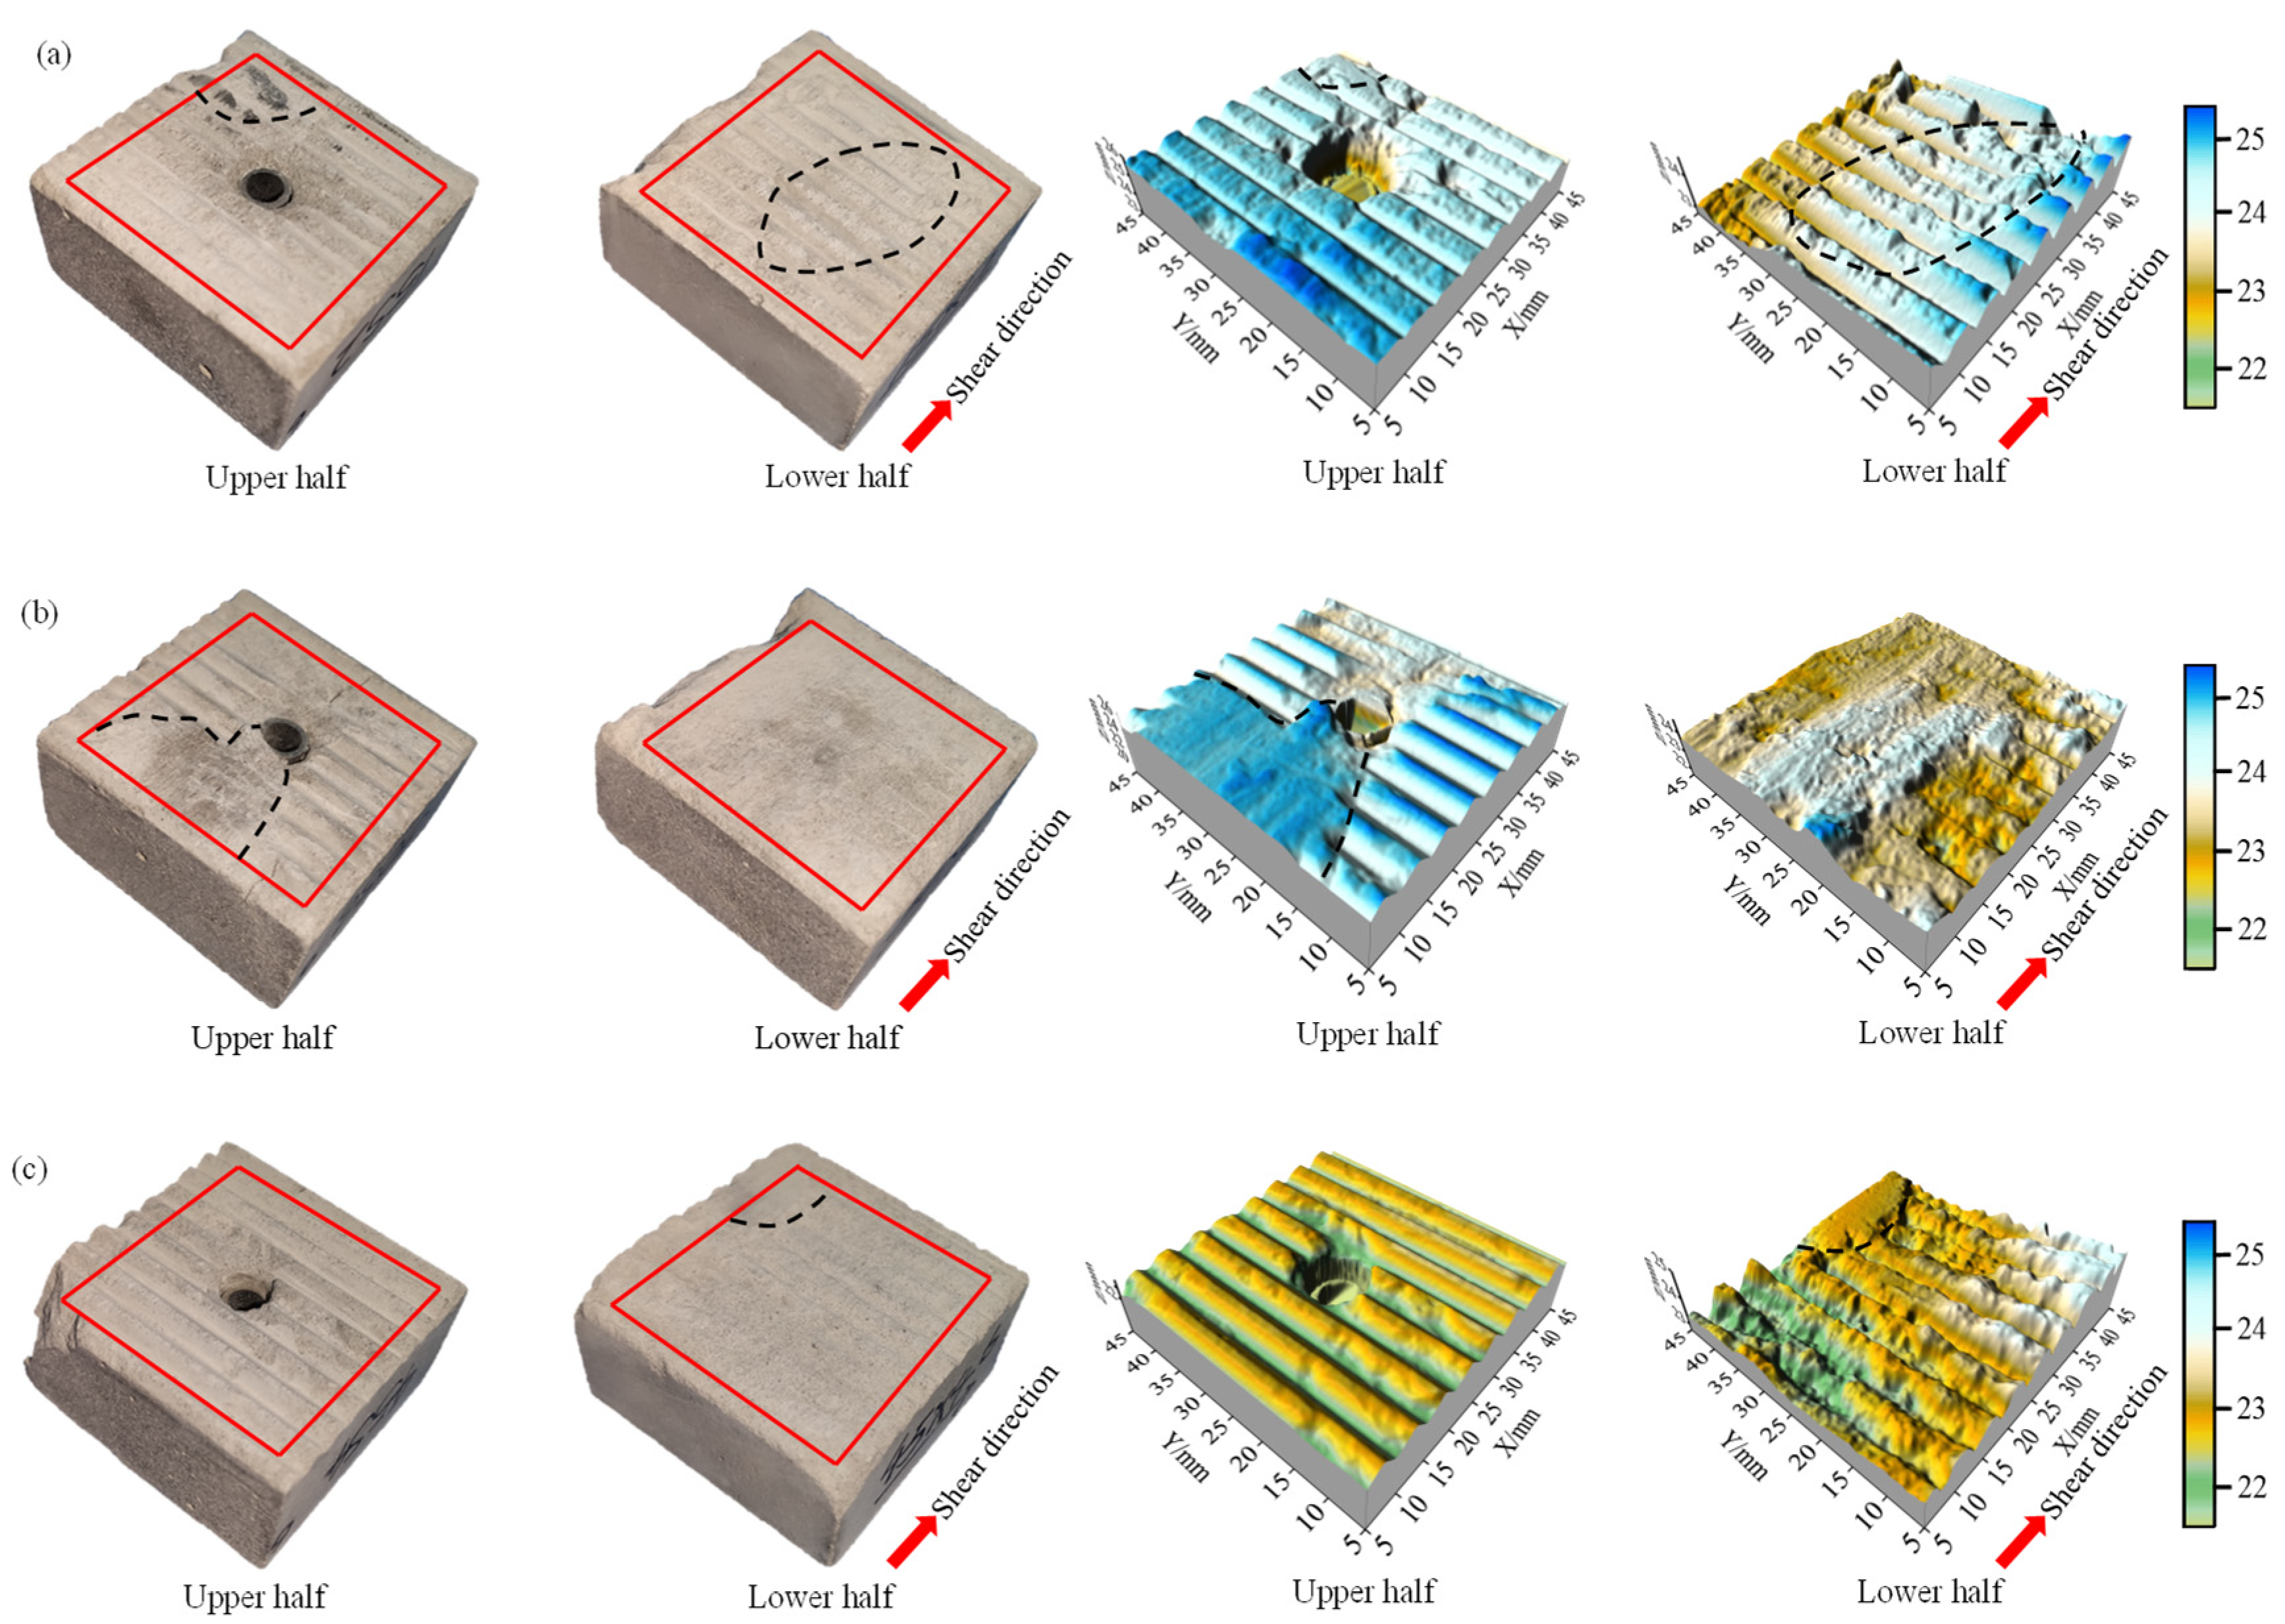
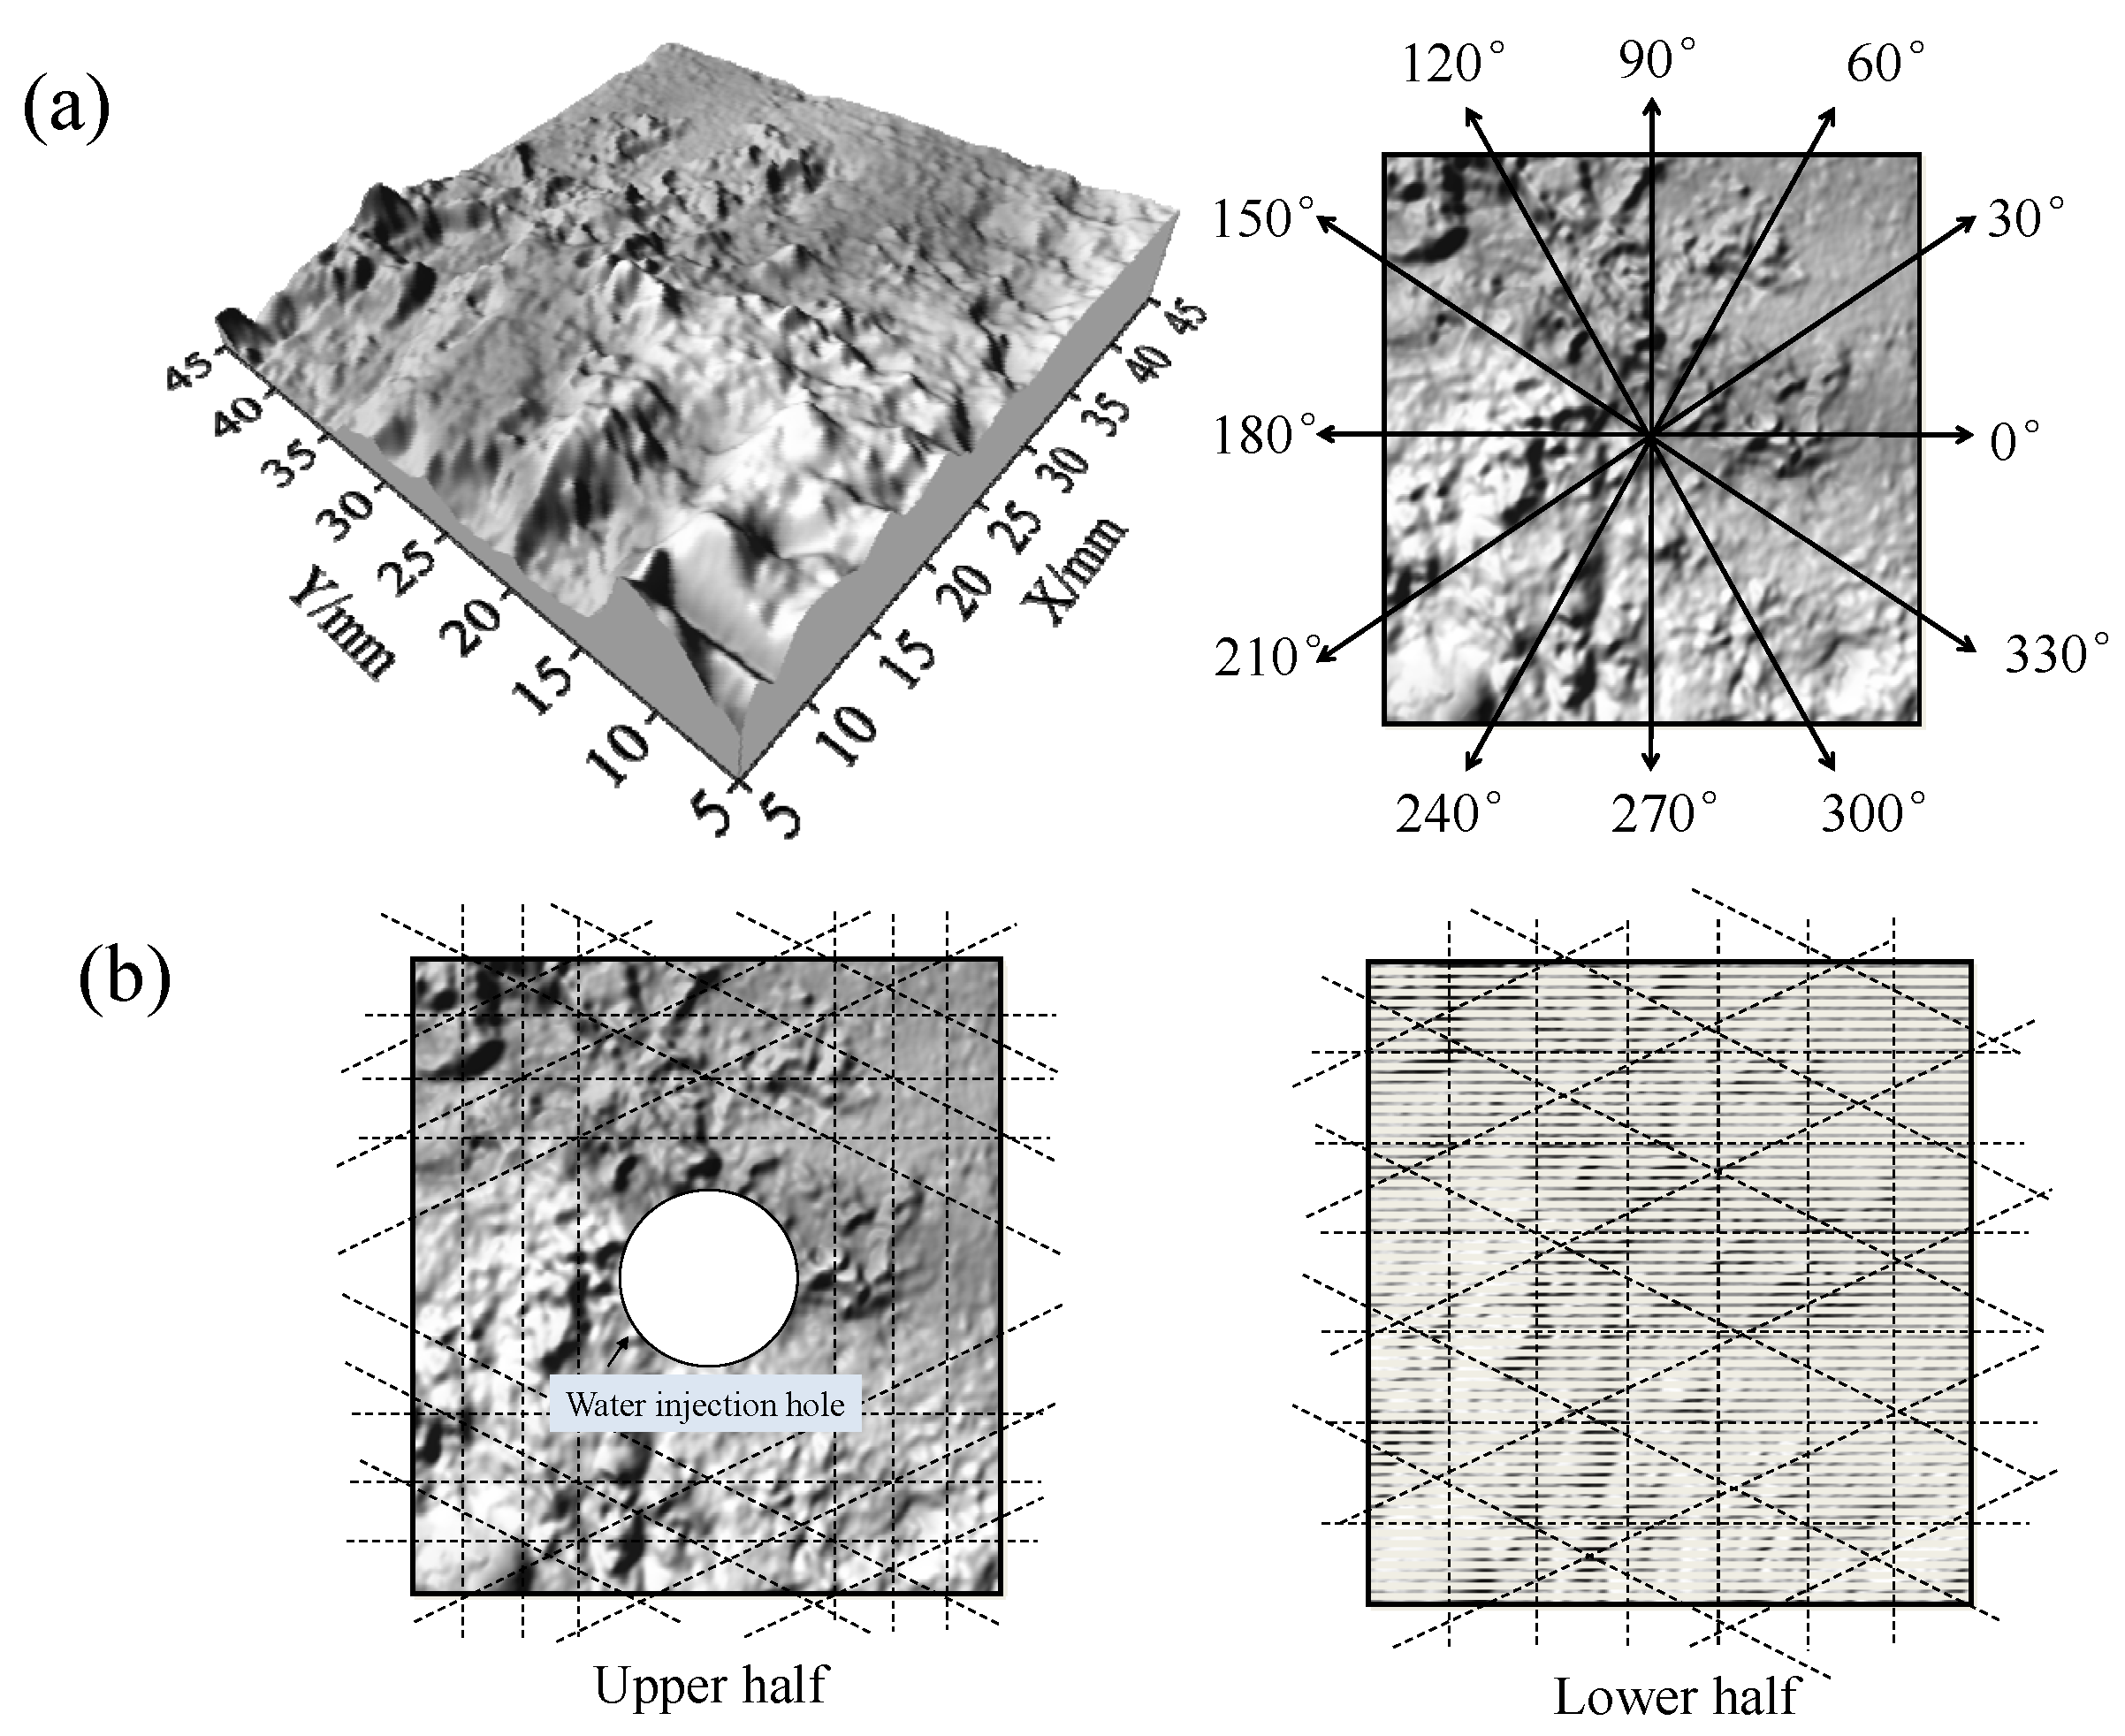
- An evaluation of the JRC and hydraulic fracture data of the structural planes revealed anisotropy of the fracture morphology associated with the hydraulic and mechanical coupling. The JRC varied significantly perpendicular to the shear direction, and its range for a structural plane increased as the fluctuation angle increased. The dominant seepage channel was perpendicular to the shear direction.
Author Contributions
Funding
Data Availability Statement
Conflicts of Interest
References
- Sun, J. Rock rheological mechanics its advance in engineering applications. Chin. J. Rock Mech. Eng. 2007, 26, 1081–1106. [Google Scholar] [CrossRef]
- Yin, L.; Yang, C.; Wang, G.; Chen, R. Study on effect of geostress on permeability of fractured rock mass. Chin. J. Rock Mech. Eng. 2005, 24, 3071–3075. [Google Scholar] [CrossRef]
- Zhang, X. Collection of typical cases of dam failures and accidents at hydropower stations. Dam Saf. 2015, 8, 13–16. [Google Scholar] [CrossRef]
- Lei, J.; Li, S.; Wu, Z.; Yao, Q.; Zeng, Y. Experimental study of shear displacement effect seepage characteristics of random surface cracks. Chin. J. Rock Mech. Eng. 2016, 35 (Suppl. S2), 3898–3905. [Google Scholar] [CrossRef]
- Zhao, Y.; Wan, W.; Wang, W.; Wang, M.; Peng, Q. Shear-seepage numerical simulation and shear dilatancy-seepage model of rock joint with random morphology. J. China Coal Soc. 2013, 38, 2133–2139. [Google Scholar] [CrossRef]
- Yang, J.; Feng, X.; Pan, P. Experimental study of permeability characteristics of single rock fracture considering stress history. Rock Soil Mech. 2013, 34, 1629–1635. [Google Scholar] [CrossRef]
- Zhang, F.; Jiang, A.; Yang, X. Effect of pore water pressure on shear creep characteristics of serrate structural plane. Rock Soil Mech. 2020, 41, 2901–2912. [Google Scholar] [CrossRef]
- Xu, J.; Wang, W.; Liu, Y.; Peng, S.; Wu, S.; Qu, J.; Xiao, Z. Experimental study on shear-seepage for coal-rock shear fracture surface morphological characteristics. Rock Soil Mech. 2018, 39, 4313–4324. [Google Scholar] [CrossRef]
- Peng, S.; Tan, H.; Xu, J.; Liu, Y. Experimental study on shear-seepage of coupled properties for complete sandstone under the action of seepage water pressure. Rock Soil Mech. 2017, 38, 2213–2220. [Google Scholar] [CrossRef]
- Chen, C.; Peng, S.; Xu, J.; Tang, Y.; Shang, D. Experimental study of stress relaxation characteristics of sandstone under stress and pore-water pressure coupling. Chin. J. Rock Mech. Eng. 2022, 41, 1193–1207. [Google Scholar] [CrossRef]
- Xiong, F.; Sun, H.; Jiang, Q.; Ye, Z.; Xue, R.; Liu, R. Theoretical model and experimental verification on non-linear flow at low velocity through rough-walled rock fracture. Rock Soil Mech. 2018, 39, 3294–3302. [Google Scholar] [CrossRef]
- Zhou, X.; Sheng, J.; Ye, Z.; Luo, W.; Huang, S.; Cheng, A. Effects of geometrical feature on Forchheimer-flow behavior through rough-walled rock fractures. Chin. J. Rock Mech. Eng. 2021, 43, 2075–2083. [Google Scholar] [CrossRef]
- Di, S.; Jia, C.; Qiao, W.; Yi, W. Theoretical and Experimental Investigation of Characteristics of Single Fracture Stress-Seepage Coupling considering Microroughness. Math. Probl. in Eng. 2017, 2017, 6431690. [Google Scholar] [CrossRef] [Green Version]
- Zhao, J.; Yin, L.; Guo, W. Stress-Seepage Coupling of Cataclastic Rock Masses Based on Digital Image Technologies. Rock Mech. Rock Eng. 2018, 51, 2355–2372. [Google Scholar] [CrossRef]
- Xu, K.; Lei, X.; Meng, Q.; Zhou, X. Study if Inertial Coefficient of Non-darcy Seepage Flow. Chin. J. Rock Mech. Eng. 2012, 31, 164–170. [Google Scholar] [CrossRef]
- Wang, X.; Zhang, M.; Li, C.; Rong, G. Experimental Study on Shear-Flow Feature of Granite Joints. Water Power 2017, 43, 64–69. [Google Scholar] [CrossRef]
- Hou, D.; Li, S.; Xing, G.; Xiong, J.; Yang, J. Nonlinear flow characteristics in non-mated rock fractures considering 3D definition of fracture surfaces. Chin. Rural Water Hydropower 2018, 7, 118–123. [Google Scholar] [CrossRef]
- Rong, G.; Yang, J.; Cheng, L.; Tan, J.; Peng, J.; Zhou, C. A forchheimer equation-based flow model for fluid flow through rock fracture during shear. Rock Mech. Rock Eng. 2018, 51, 2777–2790. [Google Scholar] [CrossRef]
- Liu, J.; Tang, H.; Yang, Y.; Shi, Q.; Li., Z.; Li., Z.; Gao., J.; Lan, J. Experimental research on visible seepage of sandstone fissure using digital image-based method. Chin. J. Geotech. Eng. 2020, 42, 2024–2033. [Google Scholar] [CrossRef]
- Peng, S.; Yue, Y.; Liu, Y.; Xu, J. Anisotropic characteristics and shear mechanical properties of different genetic structural planes. Rock Soil Mech. 2019, 40, 3291–3299. [Google Scholar] [CrossRef]
- Wang, H.; Su, Y.; Wang, F. Study on non-linear flow anisotropy behaviour in rough rock fractures based on fractal theory. Yangtze River 2019, 50, 174–180. [Google Scholar] [CrossRef]
- Li, H.; Huang, R. Method of quantitative determination of joint roughness coefficient. Chin. J. Rock Mech. Eng. 2014, 33 (Suppl. S2), 3489–3497. [Google Scholar] [CrossRef]
- Ge, Y.; Tang, H.; Wang, L.; Zhao, B.; Wu, Y.; Xiong, C. Anisotropy, scale and interval effects of natural rock discontinuity surface roughness. Chin. J. Geotech. Eng. 2016, 38, 170–179. [Google Scholar] [CrossRef]
- Xiao, W.; Xia, C.; Deng, R. Advances in development in development of coupled stress-flow test system for rock joints. Chin. J. Rock Mech. Eng. 2014, 33 (Suppl. S2), 3456–3465. [Google Scholar] [CrossRef]
- Chen, W.; Wang, L.; Tan, X.; Yang, D.; Yuan, J.; Yang, J. State-of-the-art and development tendency of the underground engineering stability of fractured rock mass. Chin. J. Rock Mech. Eng. 2021, 40, 1945–1961. [Google Scholar] [CrossRef]
- Xu, J.; Liu, Y.; Yin, G.; Li, B.; Peng, S.; Ye, G. Development of shear-flow coupling test device for coal rock. Chin. J. Rock Mech. Eng. 2015, 34 (Suppl. S1), 2987–2995. [Google Scholar] [CrossRef]
- Yang, T.; Shi, W.; Li, S.; Yang, X.; Yang, B. State of the art and trends of water-inrush mechanism of nonlinear flow in fractured rock mass. J. China Coal Soc. 2016, 41, 1598–1609. [Google Scholar] [CrossRef]
- Han, G.; Wang, E.; Liu, X. Discussion on non-Darcy flow in post-peak rock. Chin. J. Geotech. Eng. 2011, 33, 1792–1796. [Google Scholar] [CrossRef]
- Wen, Z.; Huang, G.; Zhan, H. An analytical solution for non-Darcian flow in a confined aquifer using the power law function. Adv. Water Resour. 2008, 31, 44–55. [Google Scholar] [CrossRef]
- Huang, Y.; Zhou, L.; Zhou, Z. Equations for permeability variation of fractured rock mass under high water pressure. J. Eng. Geol. 2018, 26, 1433–1438. [Google Scholar] [CrossRef]
- Yao, C.; Shao, Y.; Yang, J.; He, C.; Huang, F.; Zhou, C. Effect of nonlinear seepage on flow and heat transfer process of fractured rocks. Chin. J. Geotech. Eng. 2020, 42, 1050–1058. [Google Scholar] [CrossRef]
- Wang, E.; Han, X.; Huang, Y. Discussion on the mechanism of percolation in low permeability rocks. Rock Soil Mech 2003, 24 (Suppl. S2), 120–124. [Google Scholar] [CrossRef]
- Liu, R.; Jiang, Y.; Li, B.; Yu, L.; Du, Y. Nonlinear seepage behaviors of fluid in fracture networks. Rock Soil Mech. 2016, 37, 2817–2824. [Google Scholar] [CrossRef]
- Xie, H.; Gao, F.; Ju, Y. Research and development of rock mechanics in deep ground engineering. Chin. J. Rock Mech. Eng. 2015, 34, 2161–2178. [Google Scholar] [CrossRef]
- Jiang, Y.; Wang, G.; Li, B.; Zhao, X. Experimental study and analysis of shear-flow coupling behaviours of rock joints. Chin. J. Rock Mech. Eng. 2007, 26, 2253–2259. [Google Scholar] [CrossRef]
- Zeng, Z.; Grigg, R. A criterion for non-Darcy flow in porous media. Transp. Porous Media. 2006, 63, 57–69. [Google Scholar] [CrossRef]
- Zimmerman, R.; Ai-yaarubi, A.; Pain, C.; Grattoni, C. Non-linear regimes of fluid flow in rock fractures. Int. J. Rock Mech. Min. Sci. 2004, 41, 384. [Google Scholar] [CrossRef]
- Wang, Z.; Zheng, T.; Yang, J.; Liu, J.; Li, W. Seepage characteristics of parallel flow and radiation flow in rock fractures. Rock Soil Mech. 2020, S2, 1–8. [Google Scholar] [CrossRef]
- Gutierrez, M.; Oino, L.; Nygard, R. Stress-dependent permeability of a de-mineralised fracture in shale. Mar. Petrol. Geol. 2000, 17, 895–907. [Google Scholar] [CrossRef]
- Han, S.; Boulon, M. A new device for investigating the hydro-mechanical properties of rock joints. Int. J. Numer Anal. Met. 2003, 27, 513–548. [Google Scholar] [CrossRef]
- Javadi, M.; Sharifzadeh, M.; Shahriar, K.; Mitani, Y. Critical Reynolds number for nonlinear flow through rough-walled fractures: The role of shear processes. Water Resour. Res. 2014, 50, 1789–1804. [Google Scholar] [CrossRef] [Green Version]
- Tse, R.; Cruden, D. Estimating joint roughness coefficients. Int. J. Rock Mech. Min. Sci. Geomech. Abstr. 1979, 16, 303–307. [Google Scholar] [CrossRef]
- Grasselli, G.; Wirth, J.; Egger, P. Quantitative three-dimensional description of a rough surface and parameter evolution with shearing. Int. J. Rock Mech. Min. Sci. 2002, 39, 789–800. [Google Scholar] [CrossRef]
- Wang, M.; Shi, C.; Zhu, W.; Ding, L. Identification and accurate description of preponderance flow path. Pet. Geol. Recovery Effic. 2016, 23, 79–84. [Google Scholar] [CrossRef]


| σn/MPa | µ | E/MPa | c/MPa | φb/° |
|---|---|---|---|---|
| 15 | 0.27 | 3.39 | 2.84 | 28 |
| Fluctuation Angle | Shear Displacement/mm | Fitting Equation | Fitting of Poisonous R2 |
|---|---|---|---|
| 15° | 0 | 0.979 | |
| 5 | 0.995 | ||
| 10 | 0.991 | ||
| 15 | 0.993 | ||
| 20 | 0.991 | ||
| 25 | 0.992 | ||
| 30° | 0 | 0.983 | |
| 5 | 0.989 | ||
| 10 | 0.996 | ||
| 15 | 0.992 | ||
| 20 | 0.988 | ||
| 25 | 0.995 | ||
| 45° | 0 | 0.995 | |
| 5 | 0.996 | ||
| 10 | 0.987 | ||
| 15 | 0.984 | ||
| 20 | 0.997 | ||
| 25 | 0.986 |
Publisher’s Note: MDPI stays neutral with regard to jurisdictional claims in published maps and institutional affiliations. |
© 2022 by the authors. Licensee MDPI, Basel, Switzerland. This article is an open access article distributed under the terms and conditions of the Creative Commons Attribution (CC BY) license (https://creativecommons.org/licenses/by/4.0/).
Share and Cite
Peng, S.; Zhang, X.; Tang, X.; Xu, J.; Jiao, F.; He, M. Experimental Investigation of Non-Linear Seepage Characteristics in Rock Discontinuities and Morphology of the Shear Section in the Shear Process. Processes 2022, 10, 2625. https://doi.org/10.3390/pr10122625
Peng S, Zhang X, Tang X, Xu J, Jiao F, He M. Experimental Investigation of Non-Linear Seepage Characteristics in Rock Discontinuities and Morphology of the Shear Section in the Shear Process. Processes. 2022; 10(12):2625. https://doi.org/10.3390/pr10122625
Chicago/Turabian StylePeng, Shoujian, Xinrui Zhang, Xiaojun Tang, Jiang Xu, Feng Jiao, and Meixin He. 2022. "Experimental Investigation of Non-Linear Seepage Characteristics in Rock Discontinuities and Morphology of the Shear Section in the Shear Process" Processes 10, no. 12: 2625. https://doi.org/10.3390/pr10122625