Article

Dynamic Performance Assessment of PMSG and DFIG-Based WECS with the Support of Manta Ray Foraging Optimizer Considering MPPT, Pitch Control, and FRT Capability Issues

by
Mohamed Metwally Mahmoud
1,*,
Basiony Shehata Atia
2,
Almoataz Y. Abdelaziz
3 and
Noura A. Nour Aldin
4,*
1
Electrical Engineering Department, Faculty of Energy Engineering, Aswan University, Aswan 81528, Egypt
2
Field Service Engineer at Rapiscan Systems, 2805 Columbia St, Torrance, CA 90503, USA
3
Faculty of Engineering and Technology, Future University in Egypt, Cairo 11835, Egypt
4
Electrical Department, Faculty of Technology and Education, Suez University, Suez 43533, Egypt
*
Authors to whom correspondence should be addressed.
Processes 2022, 10(12), 2723; https://doi.org/10.3390/pr10122723
Submission received: 14 November 2022 / Revised: 2 December 2022 / Accepted: 4 December 2022 / Published: 16 December 2022
(This article belongs to the Special Issue Advances in Renewable Energy Systems)

Abstract

:
Wind generators have attracted a lot of attention in the realm of renewable energy systems, but they are vulnerable to harsh environmental conditions and grid faults. The influence of the manta ray foraging optimizer (MRFO) on the dynamic performance of the two commonly used variable speed wind generators (VSWGs), called the permanent magnet synchronous generator (PMSG) and doubly-fed induction generator (DFIG), is investigated in this research article. The PMSG and DFIG were exposed to identical wind speed changes depending on their wind turbine characteristics, as well as a dangerous three-phase fault, to evaluate the durability of MRFO-based wind side controllers. To protect VSWGs from hazardous gusts and obtain the optimum power from incoming wind speeds, we utilized a pitch angle controller and optimal torque controller, respectively, in our study. During faults, the commonly utilized industrial approach (crowbar system) was exclusively employed to aid the studied VSWGs in achieving fault ride-through (FRT) capability and control of the DC link voltage. Furthermore, an MRFO-based PI controller was used to develop a crowbar system. The modeling of PMSG, DFIG, and MRFO was performed using the MATLAB/Simulink toolbox. We compared performances of PMSG and DFIG in reference tracking and resilience against changes in system parameters under regular and irregular circumstances. The effectiveness and reliability of the optimized controllers in mitigating the adverse impacts of faults and wind gusts were demonstrated by the simulation results. Without considering the exterior circuit of VSWGs or modifying the original architecture, MRFO-PI controllers in the presence of a crowbar system may help cost-effectively alleviate FRT concerns for both studied VSWGs.

1. Introduction

The International Energy Agency (IEA) report released in 2020 to address electrical power systems (EPSs) security concerns states that, until 2040, the average yearly contribution of renewable energy sources (RESs) will reach 45% of all generations. The security of EPSs is jeopardized by the changeable nature of RESs [1]. EPS security procurement is now much more essential in light of recent pandemics, such as COVID-19 [2]. To make EPSs resilient to grid faults and the fluctuating power output of RESs, security considerations must be incorporated into their operation [3]. One of the RESs that has been rapidly expanding as a source of power in recent years is wind energy (WE), which is used to contribute to the demand side of the electricity supply chain. This RES is used to address issues such as global CO2 emissions, inadequate load demands, and fossil fuel shortages [4]. Global installed WE capacity will continue to increase due to the decreased costs and high reliability of these systems [5]. WE generation from on- and off-shore wind turbines (WTs) has gained pace, and is currently the cheapest kind of energy in many major markets, signaling that WE is a viable option [5,6]. During electricity transition, the most critical challenges are cost, efficiency, supply security/timing, and wind integration [7,8,9].
WGs in WE markets these days are based on fixed or variable speed concepts in the market [9]. In the past, WGs were based on fixed concepts due to their features such as simplicity and low cost; however, the main drawback was its need for reactive power (Q) to assist voltage support. The latest standard for installed WE is variable-speed wind generators (VSWGs). VSWGs efficiently capture energy and have good voltage control [9,10]. Widely used VSWGs include the doubly-fed induction wind generator (DFIWG) and permanent magnet synchronous wind generator (PMSWG), with a back-to-back (BTB) power converter strategy [8,11,12]. The DFIWG contains a gearbox, and only 20–30% of its BTB converter rating is needed for its working speed range of 0.7–1.3 pu; however, the PMSWG has a high initial cost due to its use of full-rated BTB power converters [13]. Due to features such as gearless design, minimal maintenance, decreased losses, strong controllability, realized MPPT, new grid code requirements, and high efficiency, the PMSWG is recommended [14].
Utilizing the greatest amount of WE possible is crucial given the growing uptake of WE in the power grid. To do this, the WE system must monitor the maximum power point. There is a respectable range of publication reports on maximum power point tracking (MPPT) algorithms for WE systems. However, selecting the precise MPPT algorithm for a given situation requires considerable expertise because each method has its own advantages and disadvantages. In [15], various MPPT algorithms that could be used to extract the most power were discussed. These techniques were categorized based on whether they use a direct or indirect power controller to monitor power. The benefits, drawbacks, and a thorough comparison of the various MPPT algorithms were also described in terms of their complexity, required wind speed, prior training, speed responses, etc., as well as their capacity to obtain maximum energy production. The presented study in [16] used a control method called Kalman MPPT for the extraction of maximum power from grid-connected wind systems under speed variations; moreover, the pitch angle control (PAC) effect was negligible. To achieve faster convergence and less oscillation when used with variable power sources, the golden section search (GSS), perturb and observe (P&O), and incremental conductance (INC) approaches for MPPT were combined in [17]. The results demonstrate the viability and efficacy of the suggested MPPT technique, but harmonic and fault analyses were not conducted. The work in [18] used a real-time fuzzy-based MPPT controller to provide the extremely efficient operation and step-up power conversion of a standalone PV system under low voltage penetration. Grid-connected PV using FLC has major limitations that are not demonstrated. In order to gain quick and maximum PV power with no oscillation tracking, Ref. [19] offered an adaptive neuro-fuzzy inference system–particle swarm optimization (ANFIS–PSO)-based hybrid MPPT method. However, the suggested ANFIS–PSO continues to introduce greater power oscillations over a longer length of time.
In the DFIWG, the BTB power converter lies between the rotor and the grid side. The DFIWG may run at various speeds depending on the incoming wind speeds, allowing for improved WE harvesting [20]. Due to the PAC and dynamic slip management methods of the DFIWG, rebuilding the terminal voltage after a grid disruption is considerably simpler [21]. Furthermore, with the DFIWG, controlling active power (P) and Q using decoupling principles is significantly easier. When the power converters of the DFIWG are exposed to lower voltages, they fall into standby mode [22]. However, during grid faults over threshold voltages, the DFIWG quickly synchronizes with the electricity grid [22]. In comparison with the DFIWG, the PMSWG provides more flexibility [23,24]. As a result, while employing the PMSWG, P and Q regulation is more successful.
Under fault conditions, WTs may be disconnected from the grid, necessitating the use of new grid codes to improve fault ride-through (FRT) capabilities. FRT has two requirements: WTs must remain connected to the grid even if the voltage is above or below the rated value, and Q injections must occur under abnormal situations such as faults [25,26]. DFIWG stator terminals are directly connected to the grid and their rotor terminals are connected to the grid via a BTB converter. Its smaller size converter leads to reduced power losses and is cost-efficient, although Q supply capability is small due to its size. FACTS devices are equipped with the DFIWG to increase Q supply. Grid faults lead to oscillations in rotor speed and electromagnetic torque, which is transferred to the grid voltage. The rotor side converter (RSC) is deactivated with only a conventional crowbar, and this leads to a reduction of injected Q [27,28]. The PMSWG is directly connected to the power grid through a full-scale BTB converter. This converter decouples the PMSWG from the grid, making it less sensitive to grid faults compared with the DFIWG. It is capable of injecting the rated Q to fully meet grid code requirements for voltage support [29].
For improving the transient stability of the DFIWG and PMSWG, different FRT control strategies have been presented in the literature, such as fault current limiters (FCLs), a crowbar switch, DC chopper circuitry, a parallel capacitor, energy storage systems, FACTS, and sliding mode controls (SMC) [30,31,32,33,34,35,36,37]. Different studies evaluated the DFIWG utilizing various control techniques [38], with a focus on the usage of MPPT and PAC using different algorithms [39], whereas peak current limiting and MPPT were used by [40,41], respectively. For augmentation of the FRT capability of the DFIWG, a series of FCL was combined with a metal oxide varistor [42]. The use of a multistep bridge-type FCL for the PMSWG was reported by [43] to increase its FRT performance. The FRT capability of a wind farm (WF) constituting of DFIWGs was improved using a neuro-fuzzy-logic-controlled (FLC) parallel-resonance-type FCL scheme by [44], whereas complete power systems utilizing an FLC capacitive-bridge-type FCL scheme were examined by [45]. An SMC based on the bridge-type FCL was employed in [46] for the FRT-improved DFIWG performance, whereas another way of employing a dynamic multi-cell FCL was reported to enhance the FRT performance of the WF, based on DFIWG control [47]. FRT capability enhancement methods for WGs are summarized in the literature [30].
By providing a comparative analysis between the proposed work for the PMSWG and DFIWG with recently published methods based on FLC, model predictive controller (MPC), SMC, and optimization concepts, we demonstrate the role of MRFO. Table 1 presents and summarizes a comparison of the results between the proposed and previously published techniques in the PMSWG. Furthermore, this comparison is performed for the DFIWG in Table 2.
To resolve thought-provoking engineering challenges in geometry, a wide variety of algorithms motivated by societal, cosmological, and animal behavior have been suggested. The manta ray foraging optimizer (MRFO) technique is applied to optimal controller design (PI) to enhance the dynamic performance of the PMSWG and DFIWG under regular and irregular conditions. As PMSWGs and DFIWGs are widely used and account for the biggest proportion of WE markets, we were interested in investigating their impact on power systems. In light of the earlier discussion, this comparative study presents the effects of wind gusts and grid faults on the dynamic performance of the PMSWG and DFIWG, considering FRT capability, MPPT operation, and PAC issues. Previous research investigations did not include the application of the MRFO technique for the operation of optimum controllers based on the PMSWG and DFIWG. Furthermore, gathering the three issues for the two investigated renewable generators has not appeared in any single research article. As a result, our research aims to fill the gap in the literature. The DFIWG and PMSWG are discussed in terms of their properties, modeling, and control systems. The PMSWG and DFIWG that were tested had the same capacity and were subject to identical wind gusts and severe faults. Furthermore, both VSWTs operated at their rated speed under the assumed fault state (85% voltage dip), depending on their MPPT characteristics. The main benefit of this control technique is its high effectiveness, small overshoot, quick dynamic response, and successful handling of three critical issues in dominant VSWGs.
This paper is prepared as follows: The introduction, relevant literature, and purpose are described in Section 1 of this work, which is divided into six parts. Modeling, development, and the failure ratio of VSWGs and basic concepts of the investigated WE systems are presented in Section 2. In Section 3, the application of the MRFO method is discussed in detail. In Section 4, control of the crowbar system with MRFO-PI is studied for solving FRT issues in the investigated VSWGs. A discussion of simulated results is described in Section 5. Finally, concluding remarks are found in Section 6.

2. Modeling of the Studied WE Systems

Kinetic energy is converted into mechanical energy with a WT. The modeling of WT is discussed in detail [30,34].
P M = 0.5 C p λ . β   ρ A ν W 3
C p   λ . β = 0.5176 116 λ i 0.4 β 5 exp 21 λ i + 0.0068 λ  
1 λ i = 1 λ + 0.08 β 0.035 β 3 + 1  
      λ = ω r   R V W
From Equation (4), we can obtain the value of   ω r at optimal λ and operated V W :
T m = P M ω r        
T m = J eq d ω r dt + B eq ω r + T e
where the variables T m , J eq , B eq , and T e are the turbine torque, total equivalent inertia of turbine, generator, damping coefficient, and electromagnetic torque of the generator, respectively.
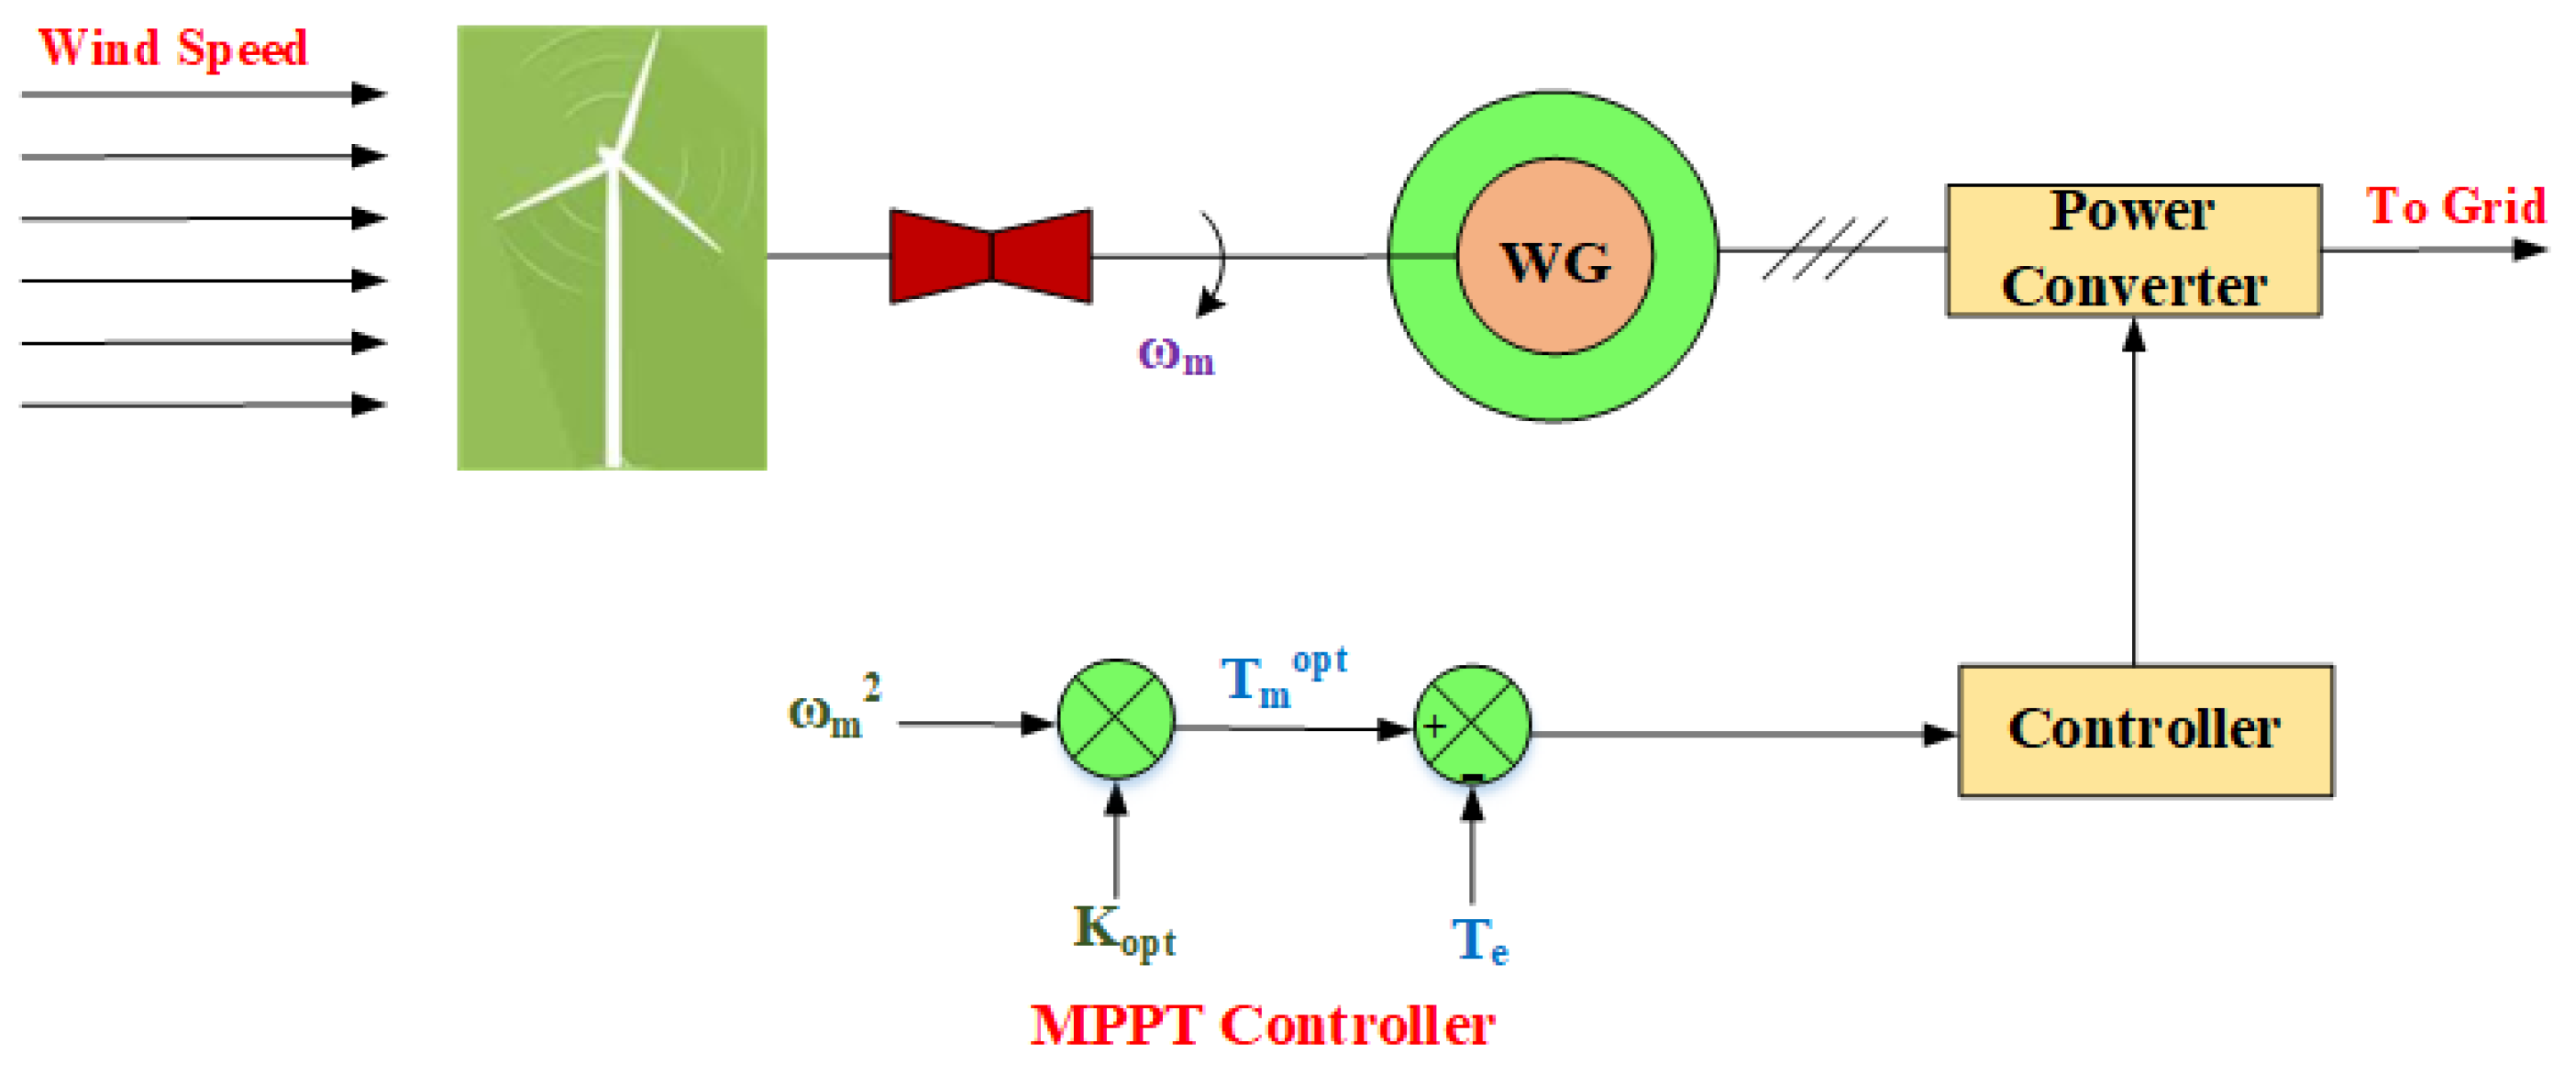
Modeling of WT was performed according to Equations (1)–(6), as shown in Figure 1. The WE power capture is maximized at different wind speeds; the VSWG has the capability to do this for a wide speed range. PAC, one of the software solutions, assists in FRT by keeping the generator operating at rated wind speeds. When a WT is exposed to wind gusts, PAC increases to reduce Cp by controlling the yaw mechanism, and therefore, output power decreases where PA equals zero at normal wind speeds are shown in Figure 2. A variety of MPPT control strategies have been developed, thence MPPT with optimal torque control (OTC) is proposed to be applied due to its merits, such as its power smoothing capability. Figure 3 shows the OTC-MPPT algorithm of WECS.

2.1. Modeling of the PMSWG

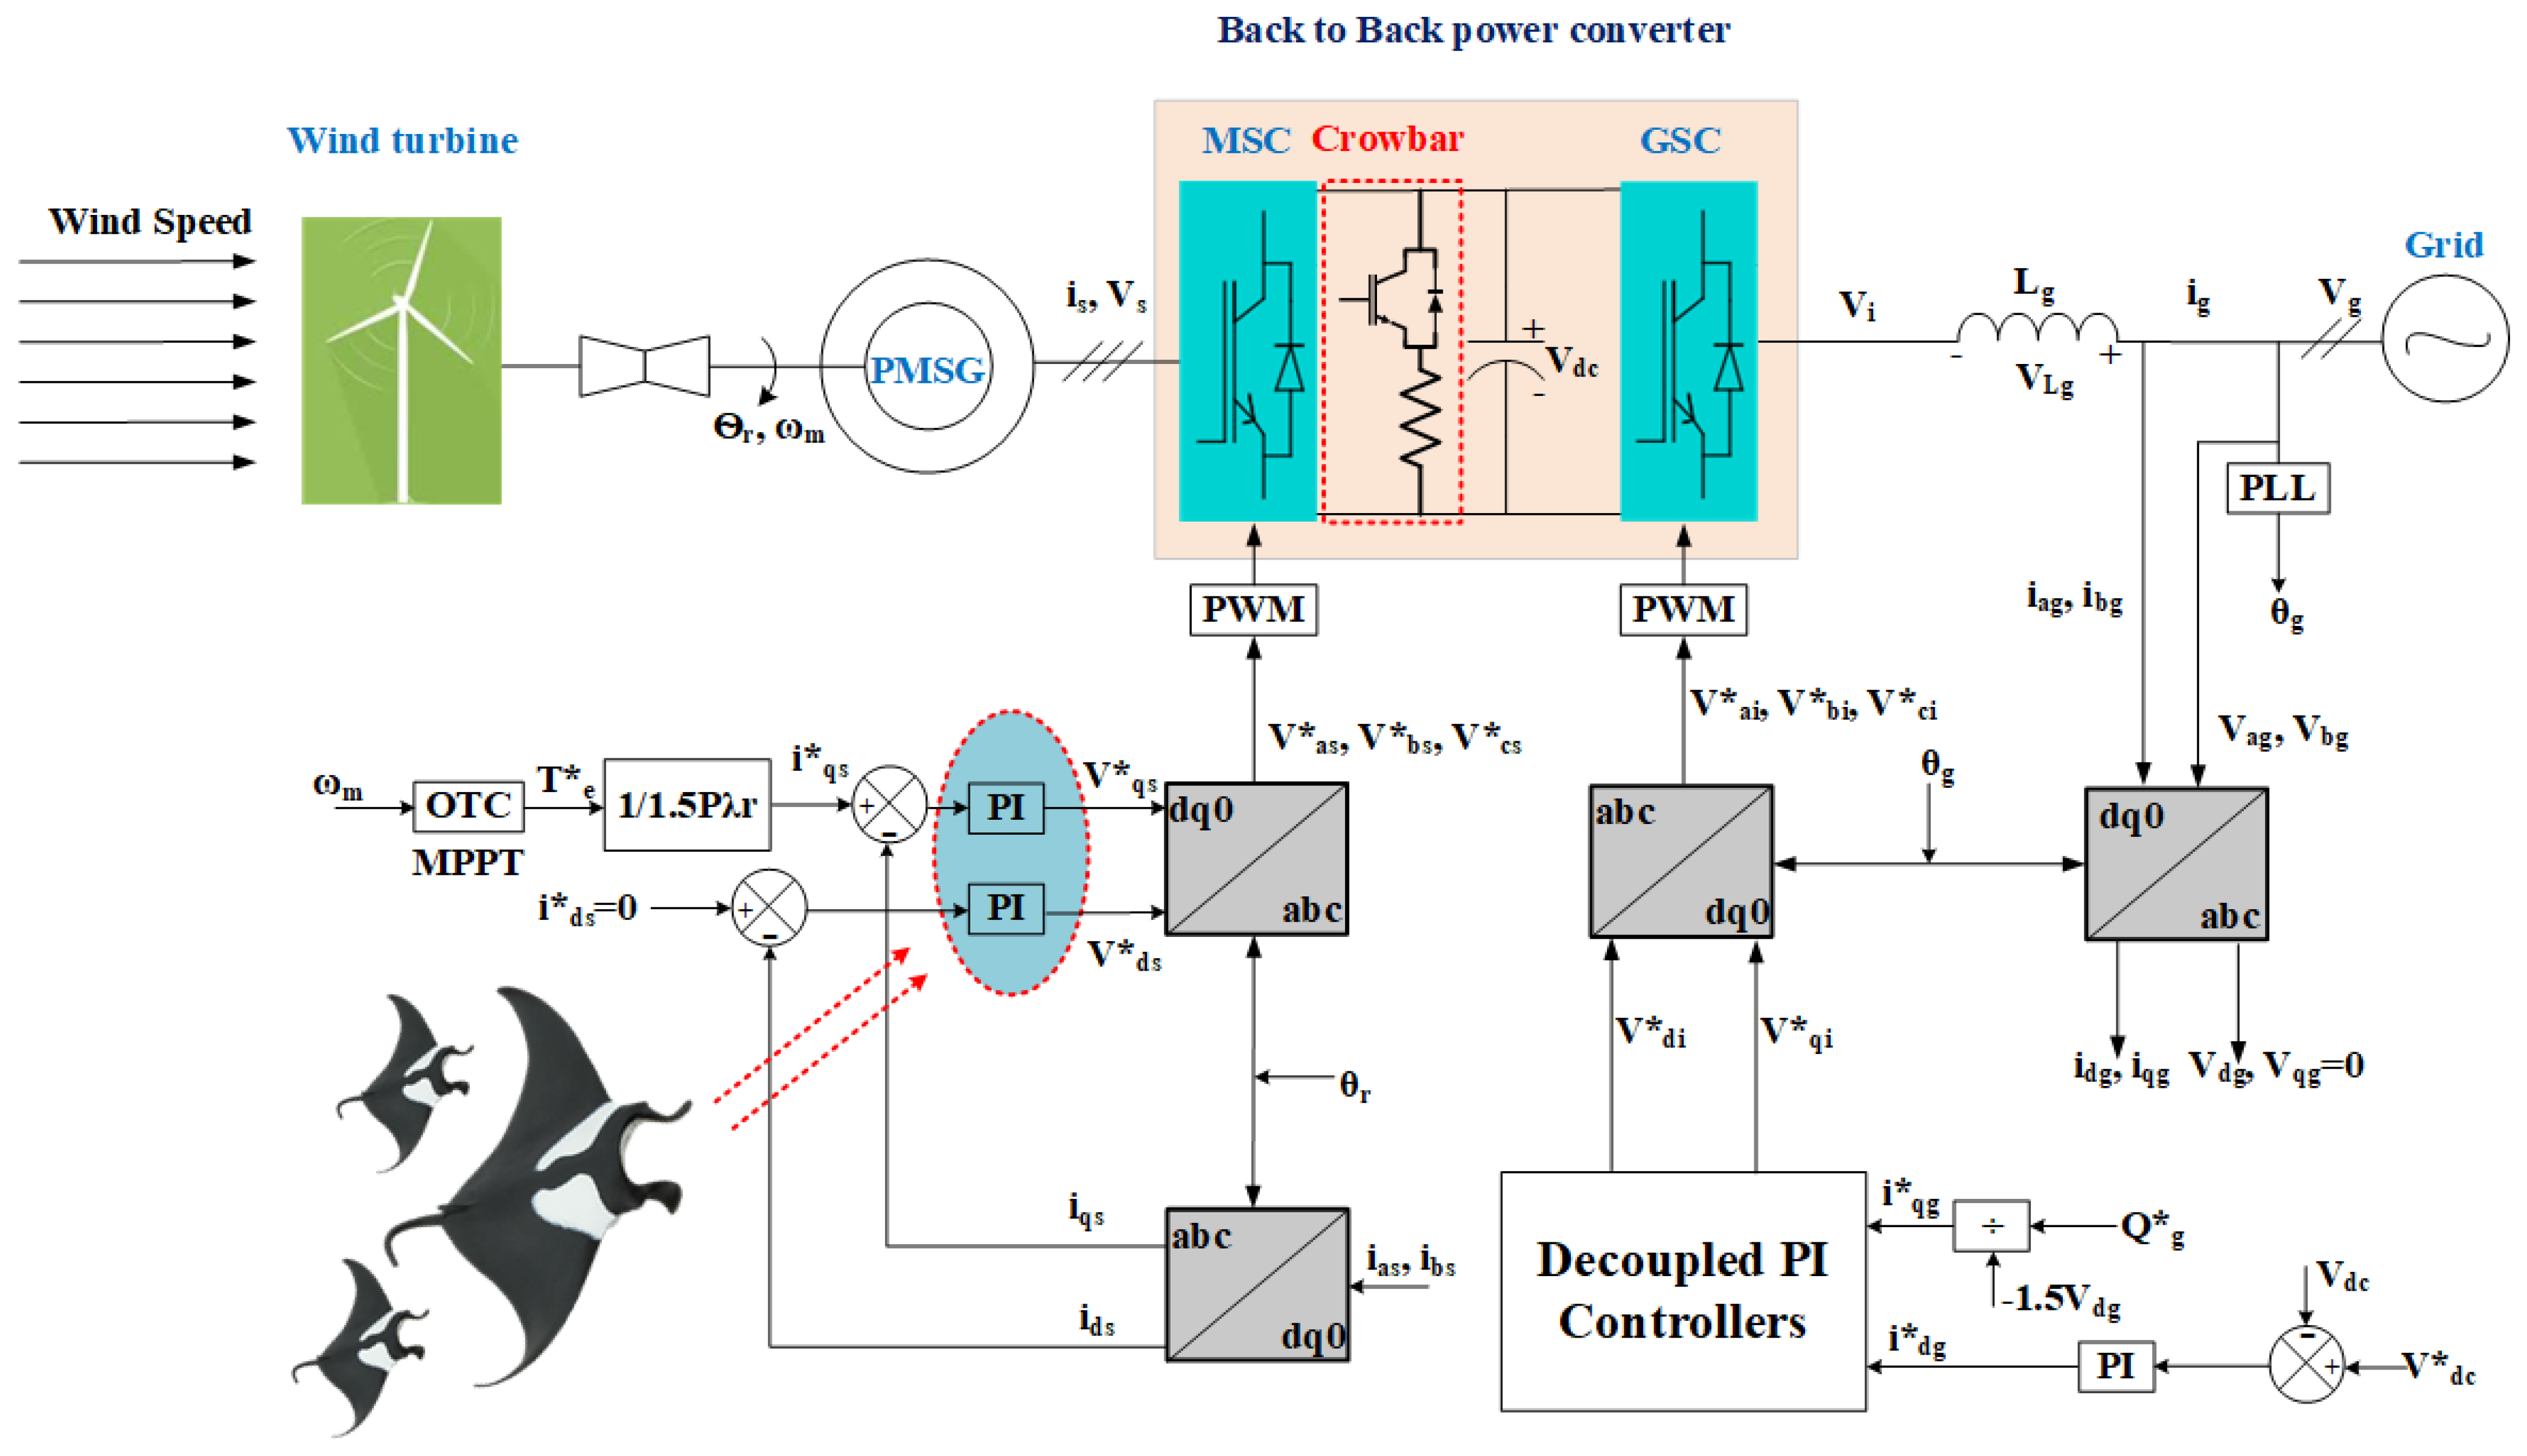
The PMSWG model was run using a d-q equivalent electrical circuit. A full description of the proposed PMSWG with its control system is shown in Figure 4. The parameter definitions are found in [60]. Dynamic equations of the mathematical model are as follows [13,52]:
V ds = R s I d + λ . d ω e ψ q
V qs = R s I q + λ . q ω e ψ d
ψ d =   L d I d + ψ pm
ψ q =   L q I q
λ d =   L d I d +   ψ pm
T e = 3 2   n p ψ pm I q
C dV dc   dt = P MSC   V dc   P GSC   V dc  
V gd * =   V id R g   I gd   L g   d dt   I gd L g ω e   I gq  
V gq * =   V iq R g   I gq   L g   d dt   I gq L g ω e   I gq  
P g = 3 2 V gd   I gd
Q g = 3 2 V gd   I gq
Equations (16) and (17) indicate that P g and Q g are controlled by controlling I gd and I gq currents, respectively. To transfer all of the P g generated from the wind turbine, DC-bus voltage must be constant, according to Equation (13). P GSC   and P MSC   are the active power to the grid and from the WG, respectively.

2.2. Modeling of the DFIWG

The DFIWG is represented through a fifth-order model [30,61]. This model consists of four electrical differential equations (two equations for both the stator and rotor voltages). The electrical equations, expressed in the direct-quadrature (dq) reference frame rotating at synchronous speed ω S , are given by Equations (18)–(26). The DFIWG with its proposed control configuration is depicted in Figure 5.
V d s = R S   I d s d ψ d s d t ω S   ψ q s
V q s = R S   I q s + d ψ q s d t + ω S   ψ d s
V d r = R r   I d r + d ψ d r d t ω S ω r ψ q r  
V q r = R r   I q r + d ψ q r d t + ω S ω r   ψ d r  
ψ d s = L s   I d s + L m   I d r  
ψ q s = L s   I q s + L m   I q s  
ψ d r = L r   I d r + L m   I d r
ψ q r = L r   I q r + L m   I q s  
T e = 3 2   P   ψ d s   I q s ψ q s   I d s  
where V denotes voltage, ψ represents magnetic flux, R denotes resistance, I denotes current, L denotes inductance, the index m denotes magnetization, T e is the electromagnetic torque of the generator, P is number of pole pairs, and indexes s and r refer to stator and rotor, respectively.

2.3. Development and Failure Ratio of Wind-Driven Power Generators

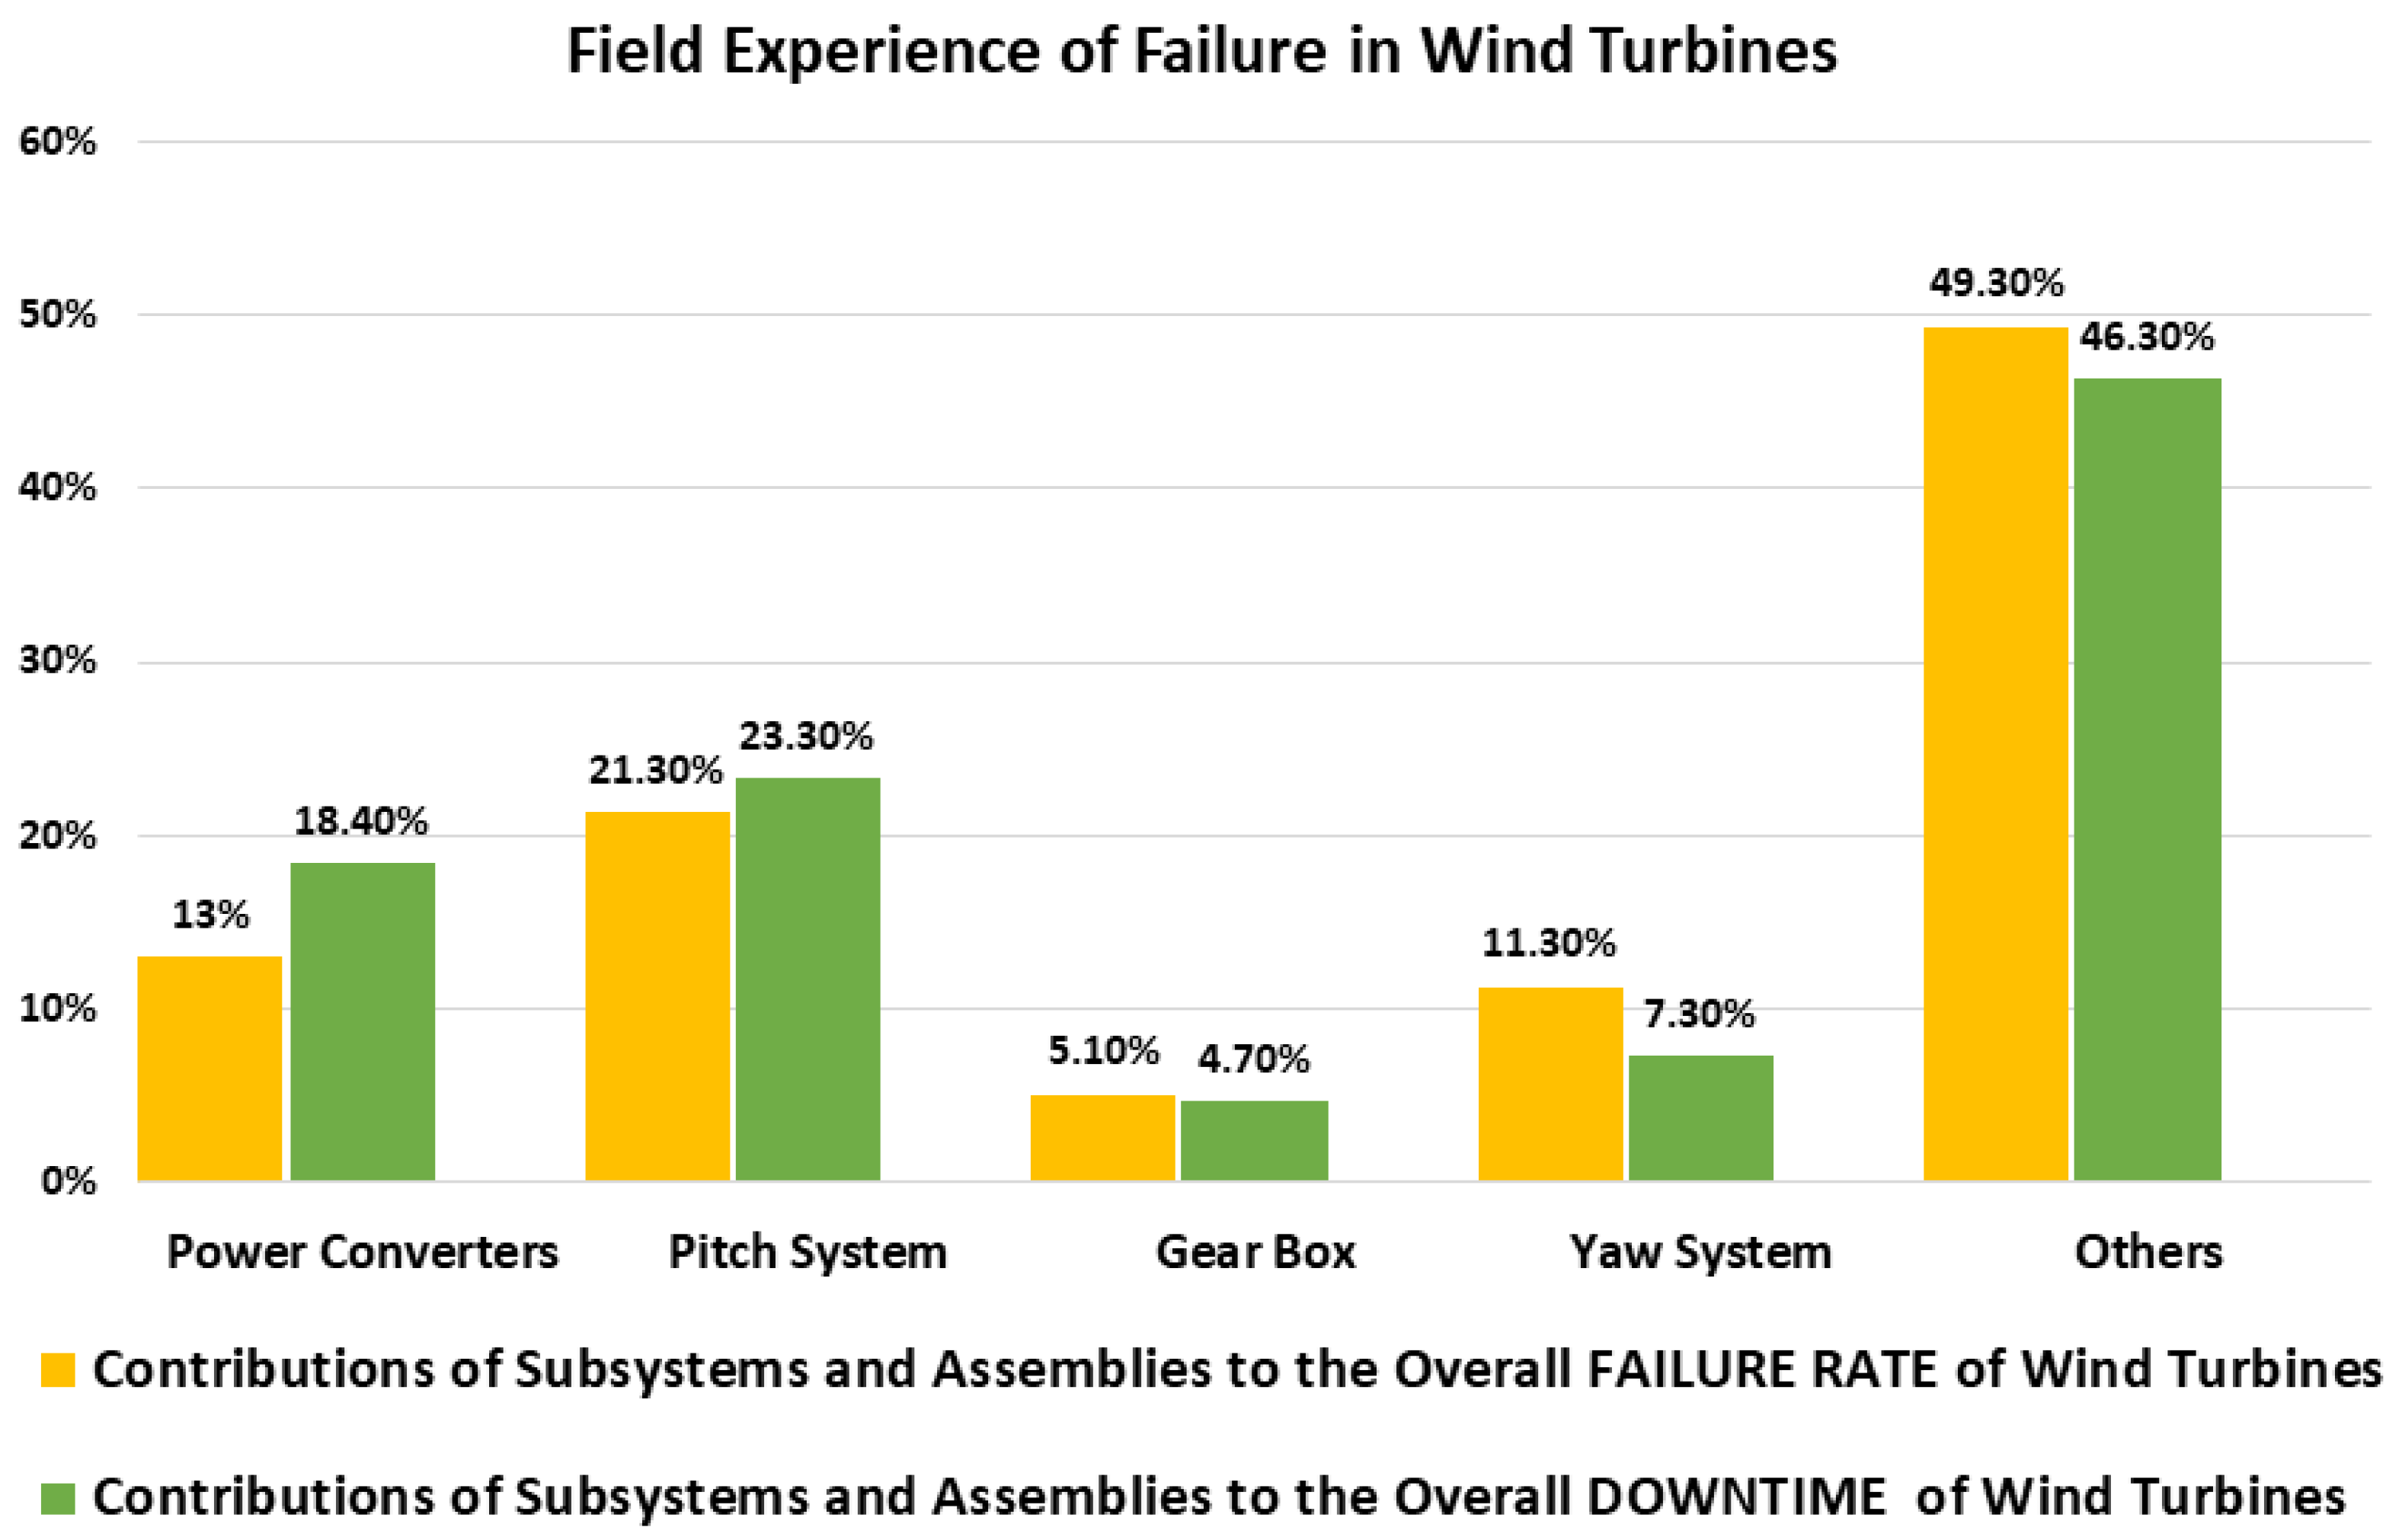
The failure ratio in WG components is shown in Figure 6 [62,63,64]. PAC systems and power converters represent a high ratio of failure for these components, and this is due to the mechanical stress that happens due to the nature of wind speed and faults, where faults lead to an increase in the speed of WG. Thus, protection topologies have great importance, and aid in decreasing the failure ratio [60,65,66]. Manufacturers and technologies for the top five WTs are shown in Table 3. From this table, it can be deduced that the PMSWG and DFIWG are produced by dominant manufacturing companies. With the fastest growth rate in WE between 2009–2018, full-scale power converter WGs, such as the PMSWG, have become dominant in the WE market. Table 4 indicates the top ten biggest turbines [8,9].

3. MRFO Algorithm

(a) 
MRFO mathematical model
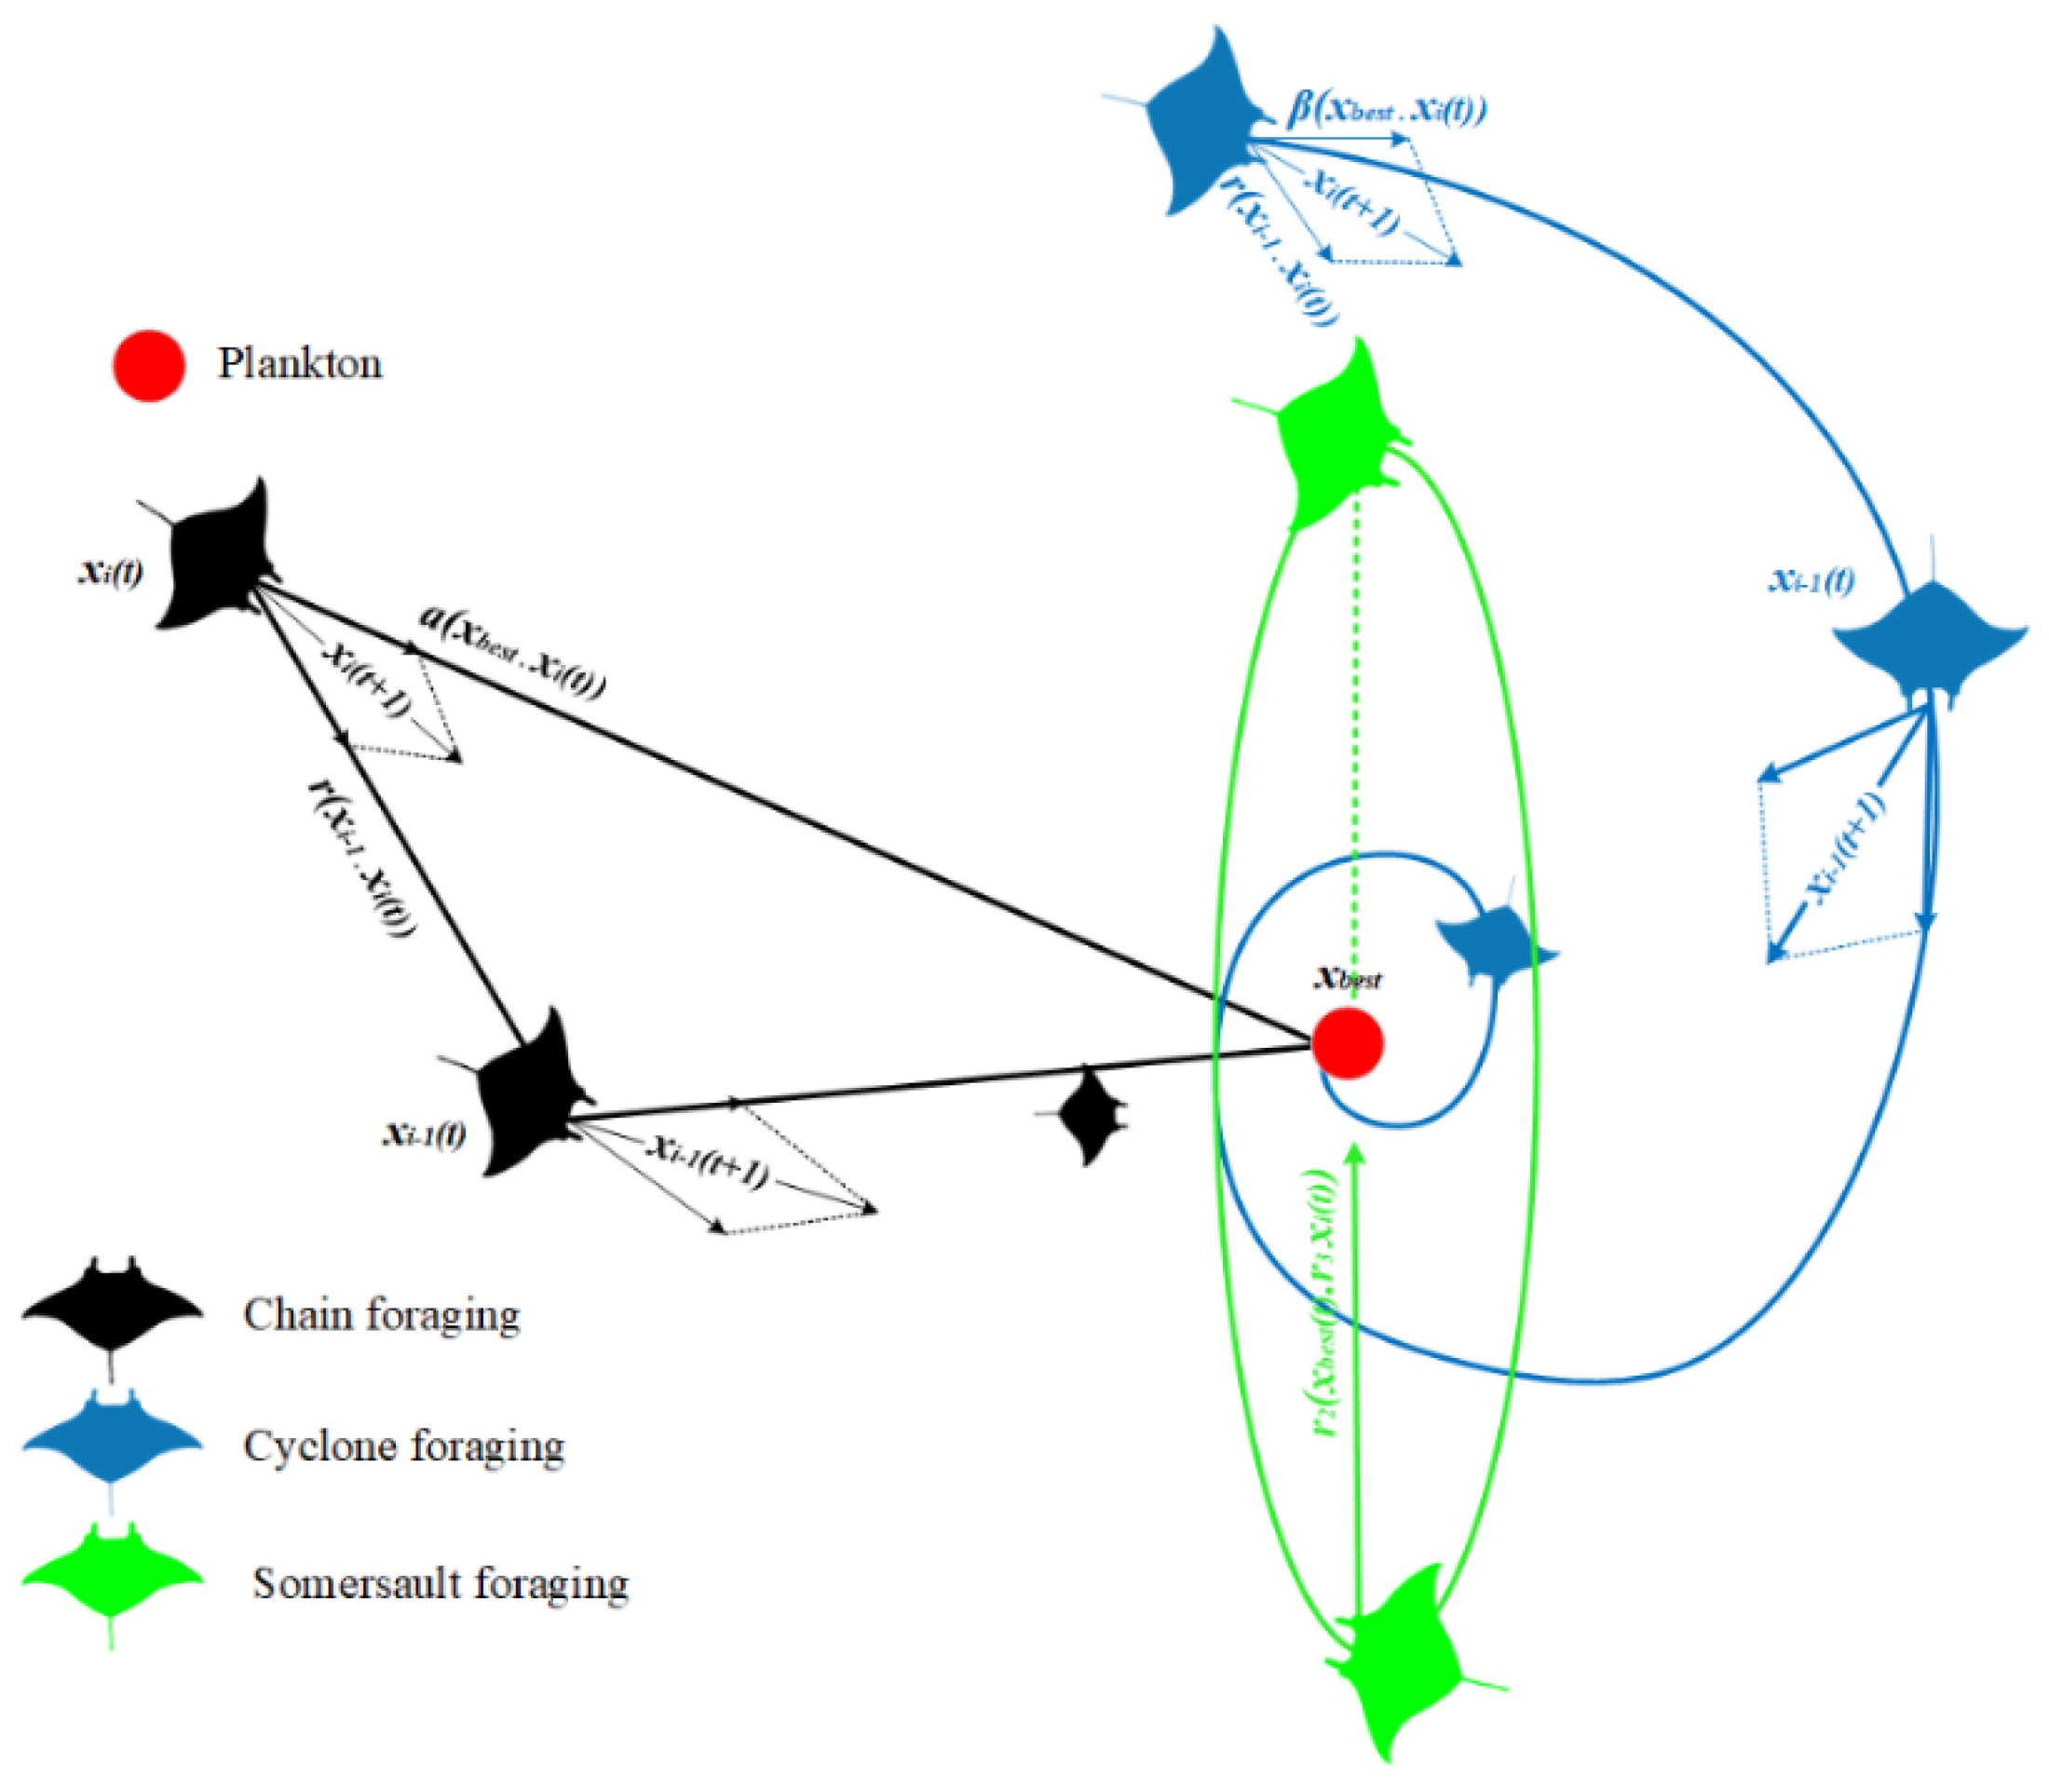
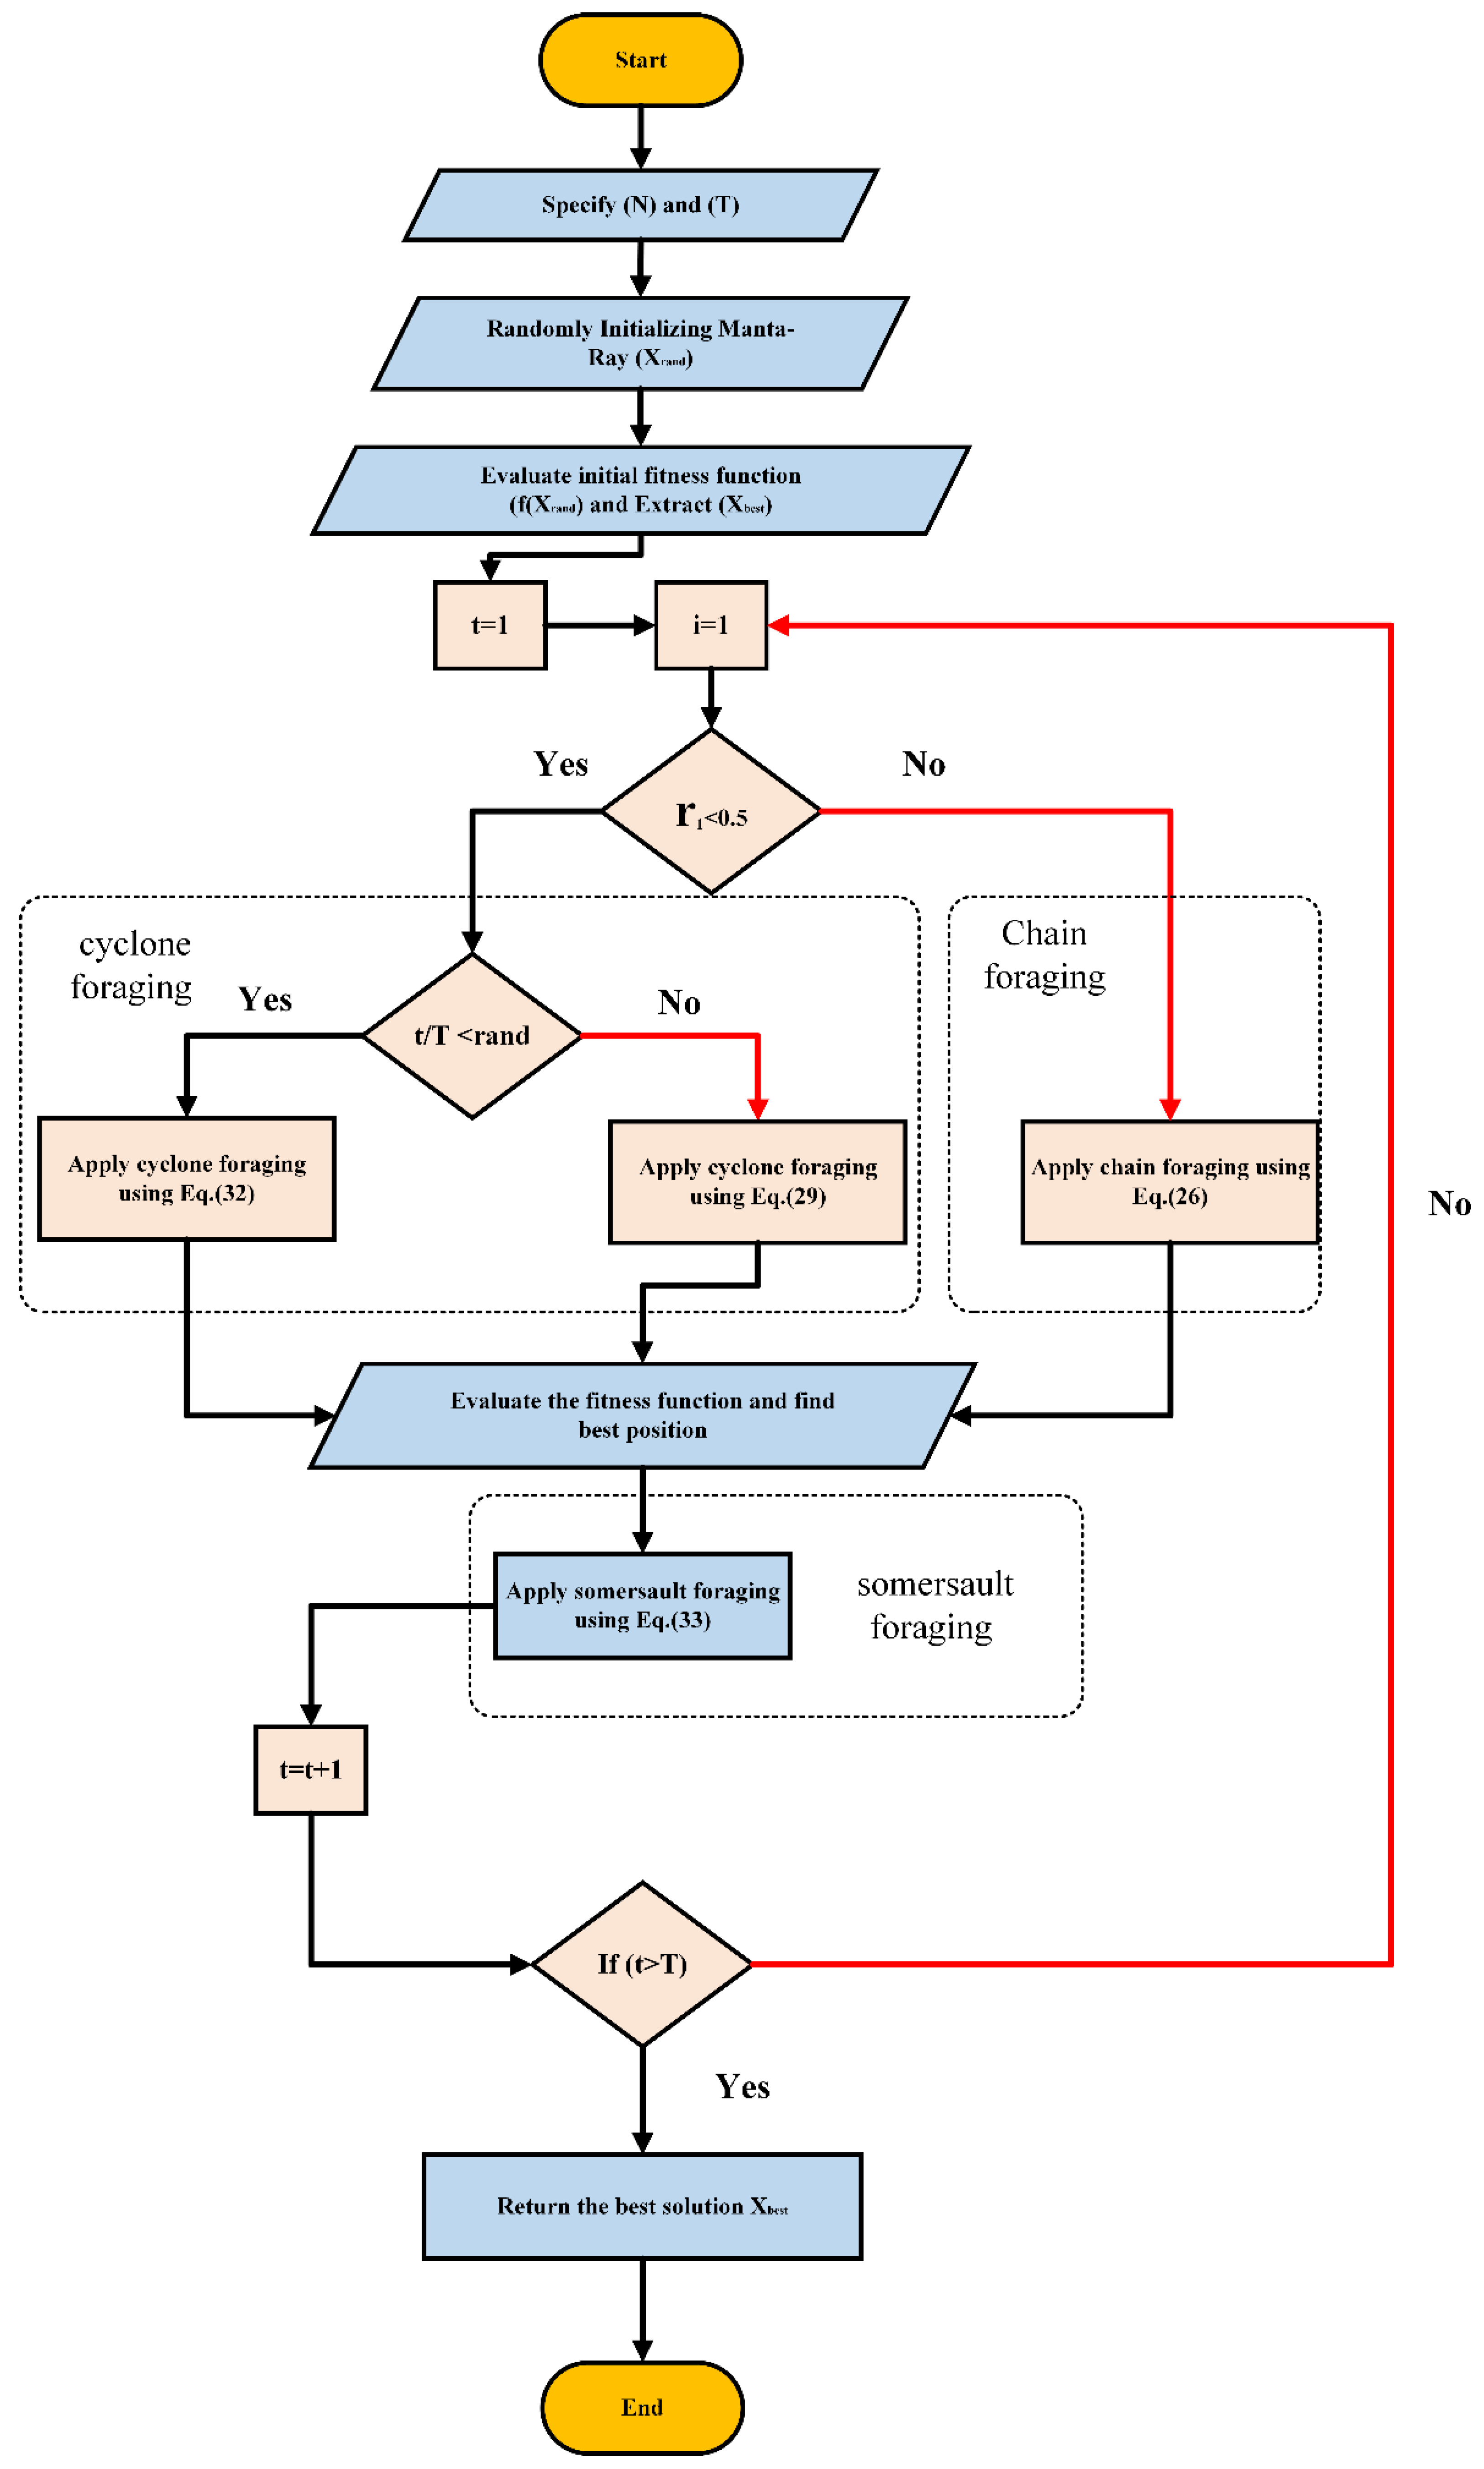
A novel meta-heuristic technique called MRFO is motivated by the smart and strategic behavior of manta rays (MRs) when they are looking for prey. It has already been demonstrated that using this approach to solve engineering challenges yields remarkably positive outcomes. Chain foraging, cyclone foraging, and somersault foraging are the three processes that the MRFO mimics in the MR eating technique, as depicted in Figure 7 [67,68,69].
Step 1: chain foraging
MRs move in a foraging chain by swimming together to an area with more plankton. The other MRs track the first as it goes toward the meal, each moving in the same direction as the first. At every time point, an MR adjusts its place with the best option that is open to both it and the one in front of it. Equation (27) provides the mathematical formulation of this circumstance [68,69].
X i d t + 1 = X i d t + ( X b e s t d t X i d t )   r + α   i f   i = 1 X i d t + r X i 1 d t X i d t + α ( X b e s t d t X i d t )   e l s e
where X i d t and X b e s t d t are the place of the ith individual and the finest solution, respectively, in the t iteration. The random vector (r) ranges from [0–1]. The weighting coefficient (α) is presented in Equation (28).
α = 2 r log r 0.5
Step 2: cyclone foraging
Each MR in the second step tracks the one next to it while also pursuing the meal by spinning its body around. The scenario’s model is provided in Equation (29) [67].
X i t + 1 = X b e s t + r X i 1 t X i t + e b w cos 2 π ω X b e s t X i t Y i t + 1 = Y b e s t + r Y i 1 t Y i t + e b w sin 2 π ω Y b e s t Y i t
where ω is a random number ranging from [0,1]. If the motions made by MRs are enlarged in the d space, its model can be written as in Equation (30).
X i d t + 1 = ( X b e s t d t + ( X b e s t d t X i d t )   r + β   i f   i = 1 ( X b e s t d t + r X i 1 d t X i d t + β ( X b e s t d t X i d t )   e l s e  
where β denotes the weighting factor, as seen in Equation (31).
β = 2 e r 1 T t + 1 T   s i n 2 π r 1
In this case, T stands for the total number of iterations, and r1 is a random number between [0, 1]. At this point, the MRs leave the area and assume new places, aiding in the search method. Consequently, a thorough global investigation is carried out. The following is the plot’s mathematical formula [67,69].
X r a n d d = L b d + r U b d L b d
X i d t + 1 = ( X r a n d d t + ( X r a n d d t X i d t )   r + β   i f   i = 1 ( X r a n d d t + r X i 1 d t X i d t + β ( X r a n d d t X i d t )   e l s e
where X r a n d d is an arbitrary number in the search planetary. The L b d and U b d are the upper and lower limits of the dth dimension, respectively.
Step 3: somersault foraging
The third step is where the meal is noticed as the key element. Each MR now usually swims back and forth to the center, changing positions. As a result, each MR’s location is constantly changed to be at the ideal location. This group’s model is described in Equation (34).
X i d t + 1 = X i d t + S r 2   X b e s t d t r 3 X i d t
where S refers to the MR somersault factor value, and r2 and r3 are two randomly selected values between [0, 1]. Each MR can therefore go to any position between their current location and the search space. As a result, the change in individuals’ present positions becomes increasingly smaller as they eventually get closer to the ideal answer. The actions taken are shown in Figure 8.
(b) 
Application of MRFO
MRFO is applied on the machine side controllers of the PMSWG and DFIWG to fine-tune the PI controllers’ gains. This tuning is performed to improve the dynamic performance of the investigated systems during normal and abnormal conditions. The optimization of the systems under study (taking control cost (CC) into account) can be formally represented in Equation (35). Table 5 and Table 6 list the findings of controller gain calculations based on the MRFO approach. Furthermore, the other controller system gains used in grid-side controllers are presented in these tables. The objective function for CC that is employed is written as follows: Minimize F(x)
= 0 T W 1 P P * + W 2 ω m ω * m + W 3 Q s Q * s + W 4 V d c V * d c + W 5 C P C * P    
where W1, W2, W3, W4, and W5 are constants used for the estimation of the CS function, which is 4 × 10⁵ here. T denotes the average time and 100 and 6 are the number of iterations and agents, respectively.

4. Crowbar Control System for Improving FRT Capability

Faults on the grid have an adverse effect on the dynamic performance of WGs. These faults lead to generator speed-ups, oscillations in electromagnetic torque, overcurrents, overvoltages at the DC link, and reduction of the output P from the VSWG [25,30]. Power electronic converters are exposed to damage due to current limitations of the converters, and these converters are the highest cost of the system; thus, hardware and software solutions have been implemented by researchers to protect the VSWGs from all mentioned bad results. Reliability/security of supply, efficiency, cost, volume, protection, control of P and Q power electronics-enabling technology, and ride-through operation are the important issues for the converters used in WECS [70].
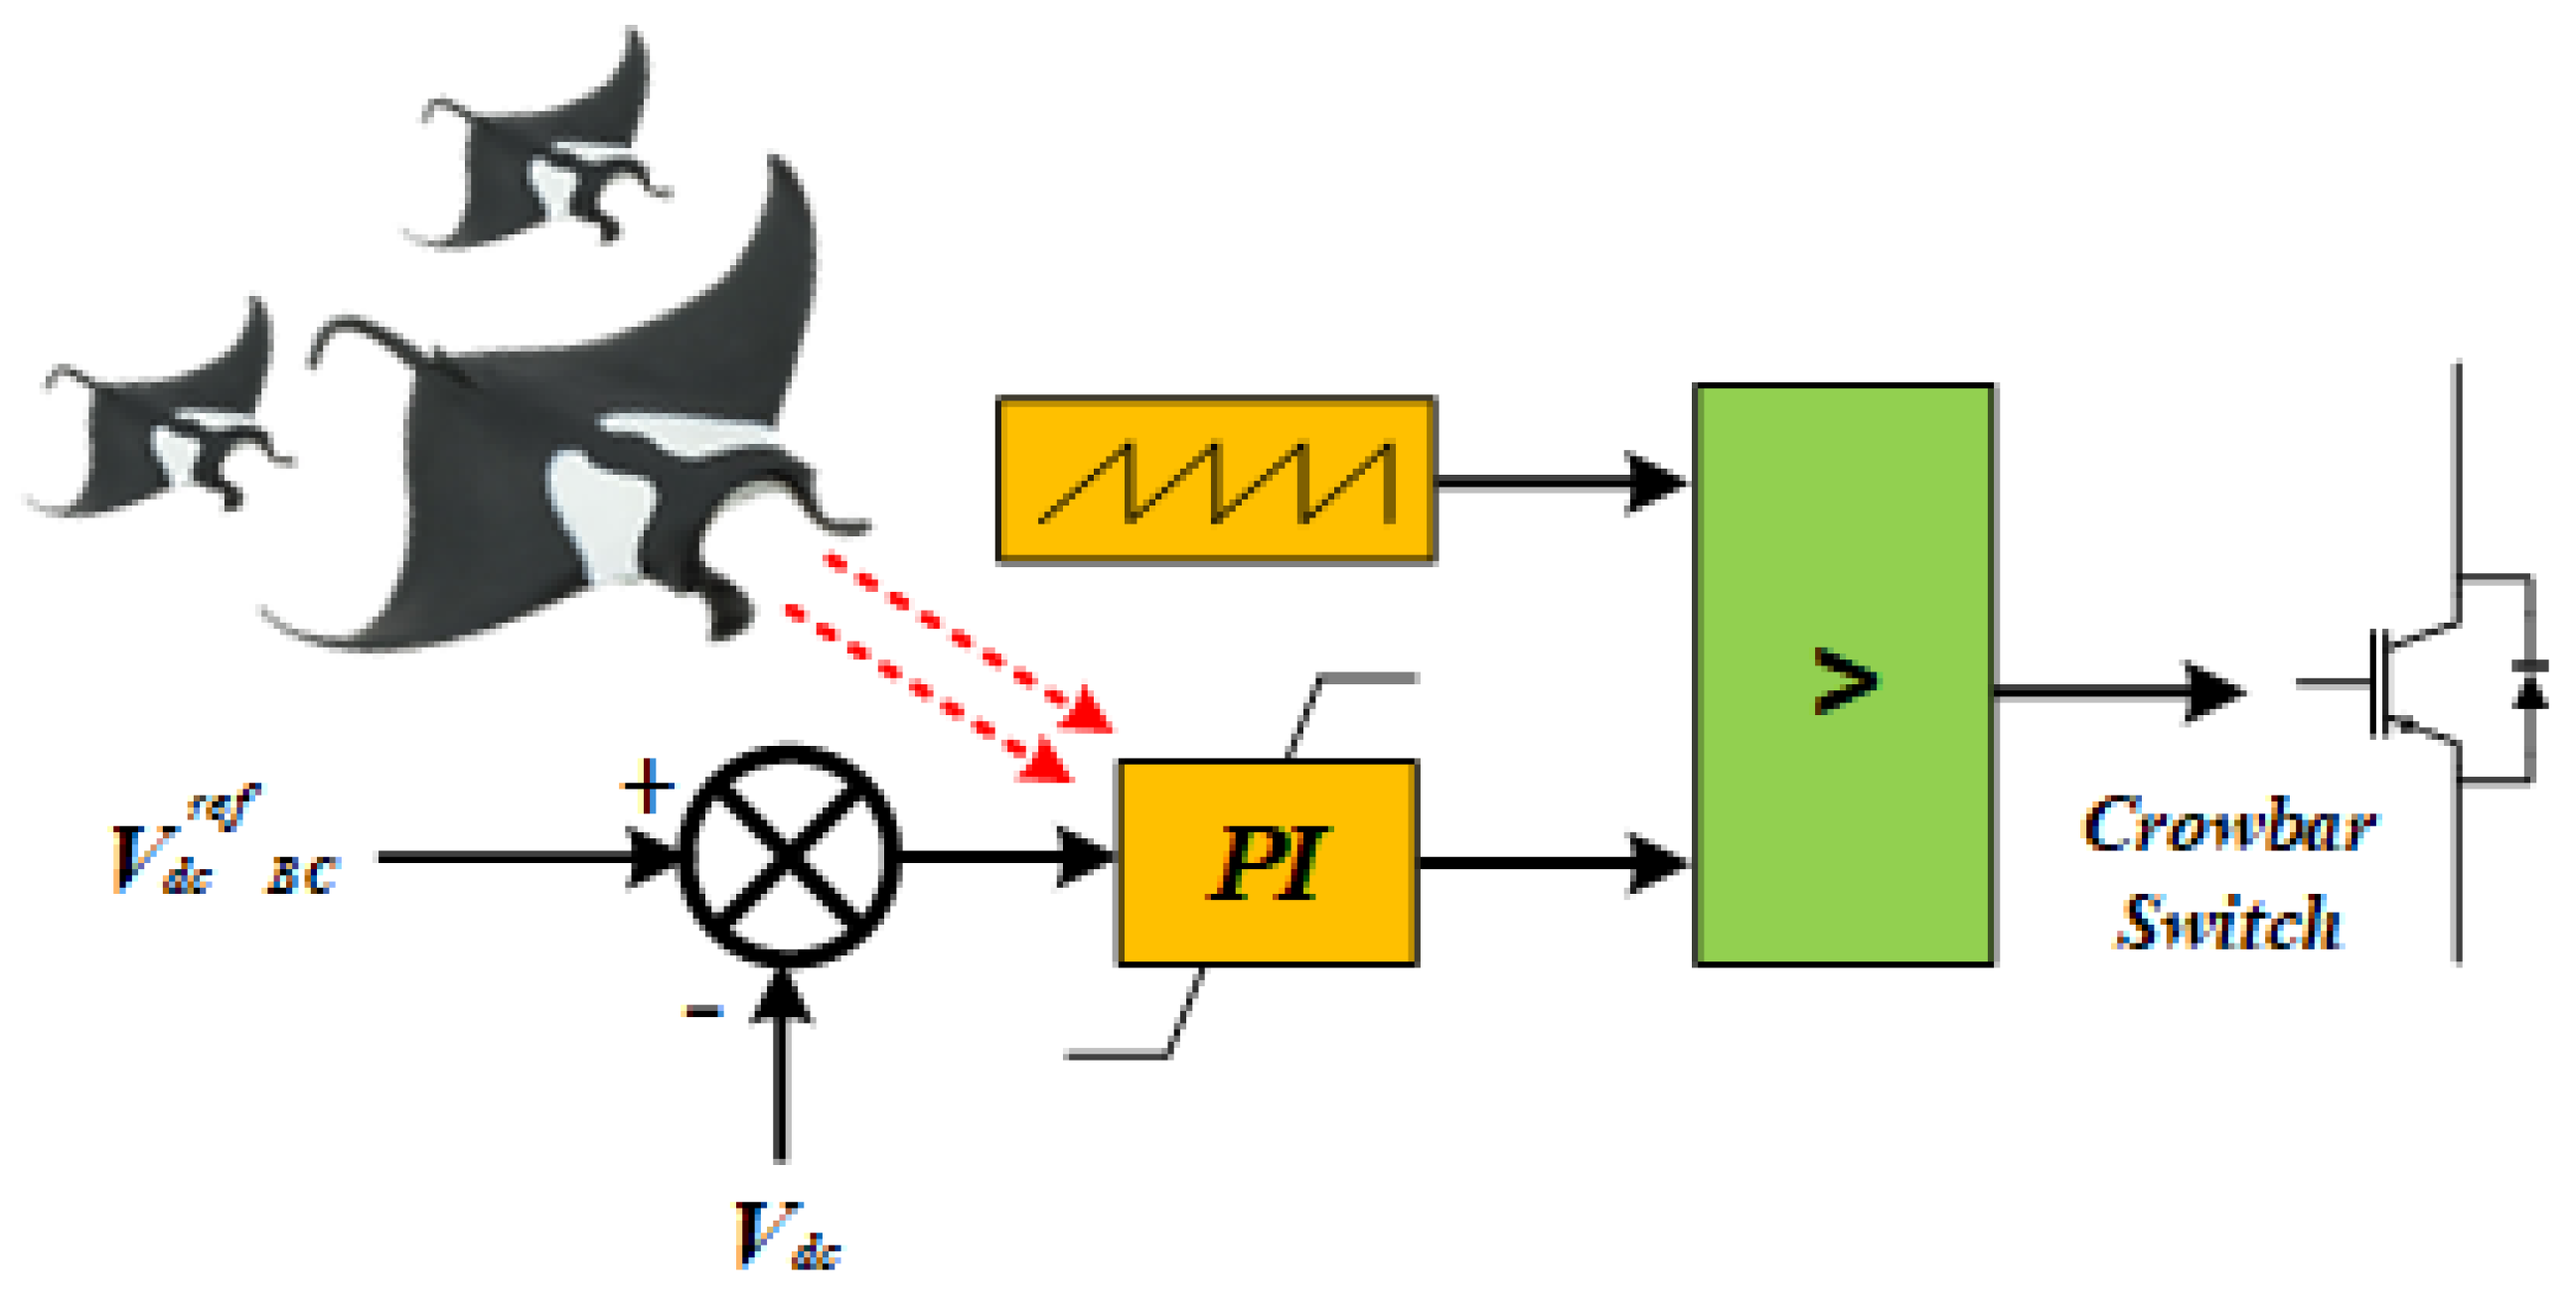
A braking chopper/crowbar is chosen as a hardware solution to successfully protect the DC capacitor from overvoltages by dissipating the surplus energy during abnormal conditions. It has been inserted with the PMSWG to enhance its dynamic performance during grid faults, as seen in Figure 4. It is only inserted during voltage sag [31]. An active crowbar is used to protect the RSC of the DFIWG and improve its dynamic behavior during grid faults, as depicted in Figure 5. Utilizing a crowbar allows the DFIWG to ride through the fault and continue the power supply, even during grid faults. The optimized values of Kp and Ki are 0.06993 for the PMSWG. The optimized values of Kp and Ki are 0.05417 for the DFIWG. The monitored and referenced values are the controller’s inputs, and the controller’s output determines how to operate the system while taking into account the sawtooth signal. The proposed control strategy of the crowbar for both investigated VSWGs is depicted in Figure 9. Hence, a comparison between different hardware protection apparatuses used for FRT enhancement based on cost is shown in Table 7 [29]. A comparison of FRT strategies of different crowbar protection circuits is shown in Table 8 [27].

5. Simulation Results and Discussion

Simulation for the investigated WGs is carried out by using MATLAB/Simulink to verify the aforementioned analysis and the effectiveness of proposed schemes which are PAC and OTC. Models’ solutions are tested on a detailed model and in MW class-based WECS. The point of common coupling (POCC) is a significant point in which a bolted fault occurs to evaluate FRT capability. To validate the simulation models, the crowbar parameters are listed in Table 9 [29] and the PMSWG and DFIWG data are listed in Table 10 [13,27]. Furthermore, the impact of the inertia of the dynamic systems is deliberated on in the Appendix A.

5.1. Impact of Wind Speed Variation under Regular Grid Conditions

The studied system is illustrated in Figure 4, where the wind speed profile is applied to two worst case scenarios. In the former, a lower wind speed is applied to verify the system in extracting MPPT, and in the other case, the system is exposed to wind gusts to verify the effectiveness of PAC, as depicted in Figure 10a. If the PA equals zero, this signifies MPPT realization; if it is bigger than zero, this means the WG does not operate at MPPT to prevent the WT from wind gusts that may cause a failure in the system components. Figure 10b,c show both λ and C p ,   where they quickly track the wind speed profile and achieve optimal values, respectively. C p   is   affected by the step change in wind speed that is due to changes in λ and the earliest operator change, according to Equation (4). Figure 10d depicts the PAC response where the PA increases to reach 2.9740. Figure 10e,f display the changes in both T e and ω r as a result of wind speed changes, respectively. Figure 10g depicts the injected P and Q to the grid as a result of wind speed changes. The Q is kept at zero because the system operates at unity power factor (UPF). Equations (1), (13), (14), and (15) give a strong explanation for T e , ω r , and the P and Q responses, respectively. Figure 10h depicts that the V D C is constant, indicating that all generated power is transferred into the grid. Oscillations that occur in the simulated parameters are very small and indicate the success of PAC and OTC in the presence of MRFO-PI controllers.

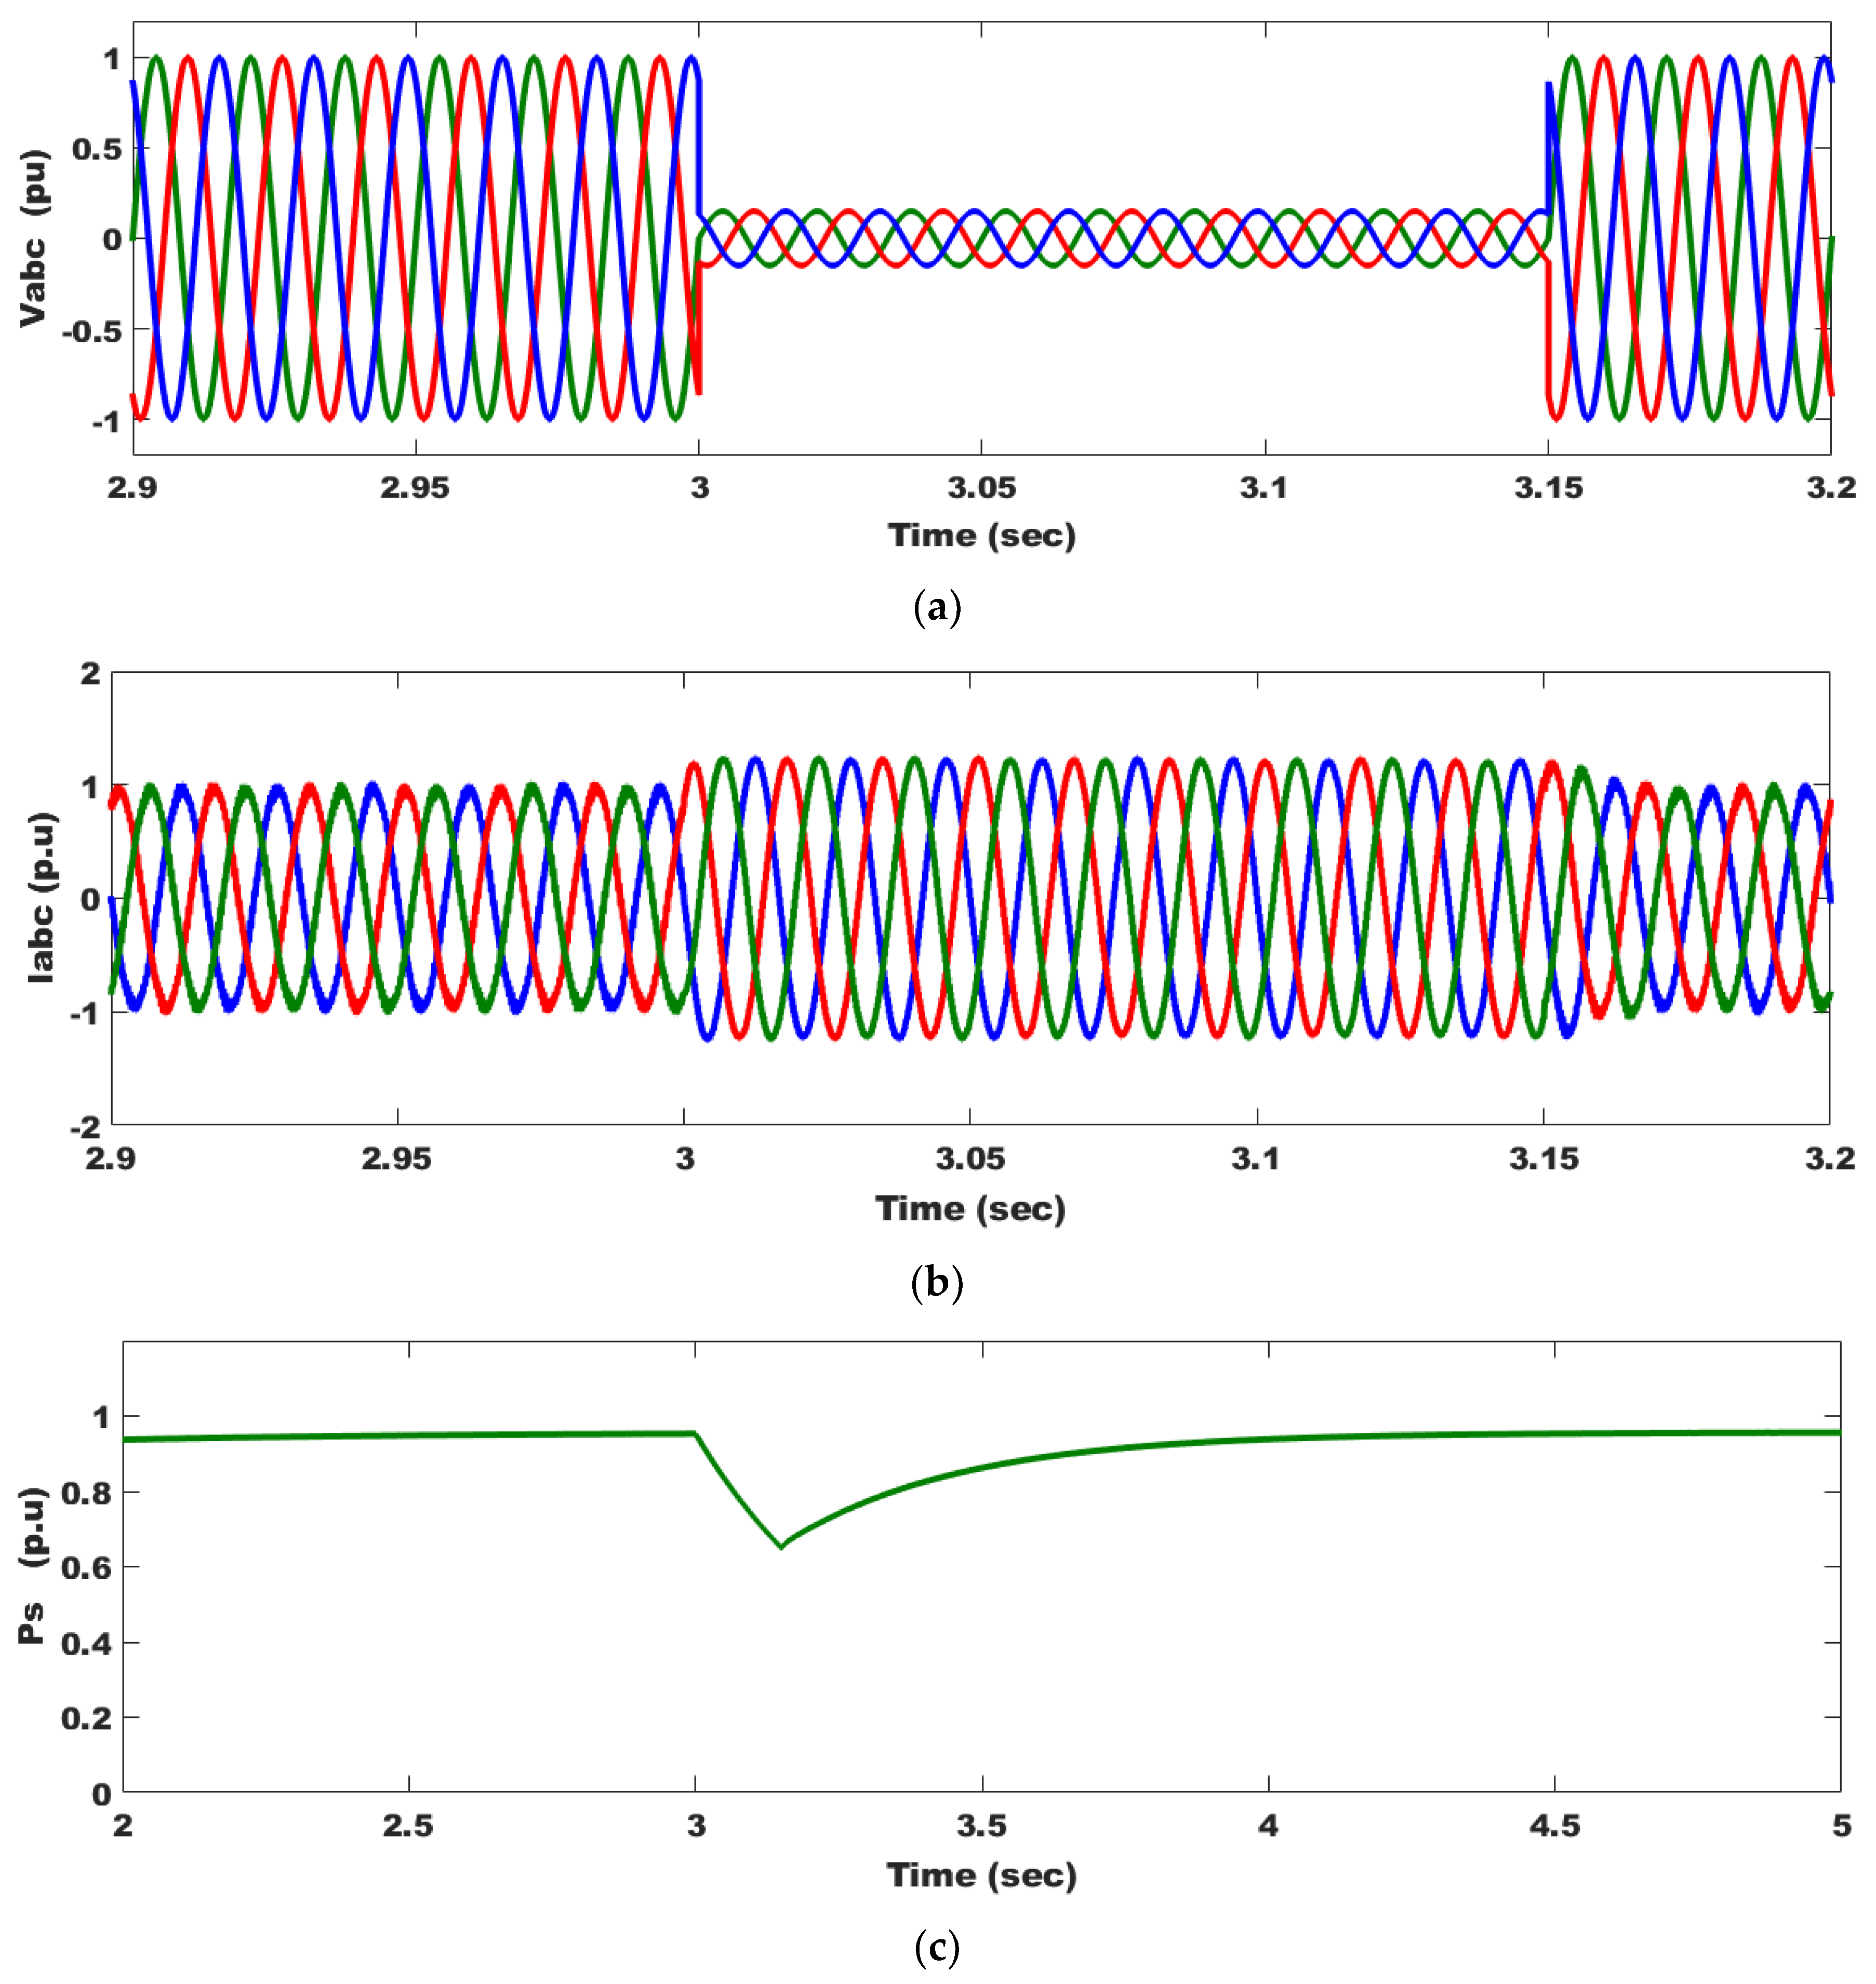
5.2. Realization of FRT under 85% Voltage Dip

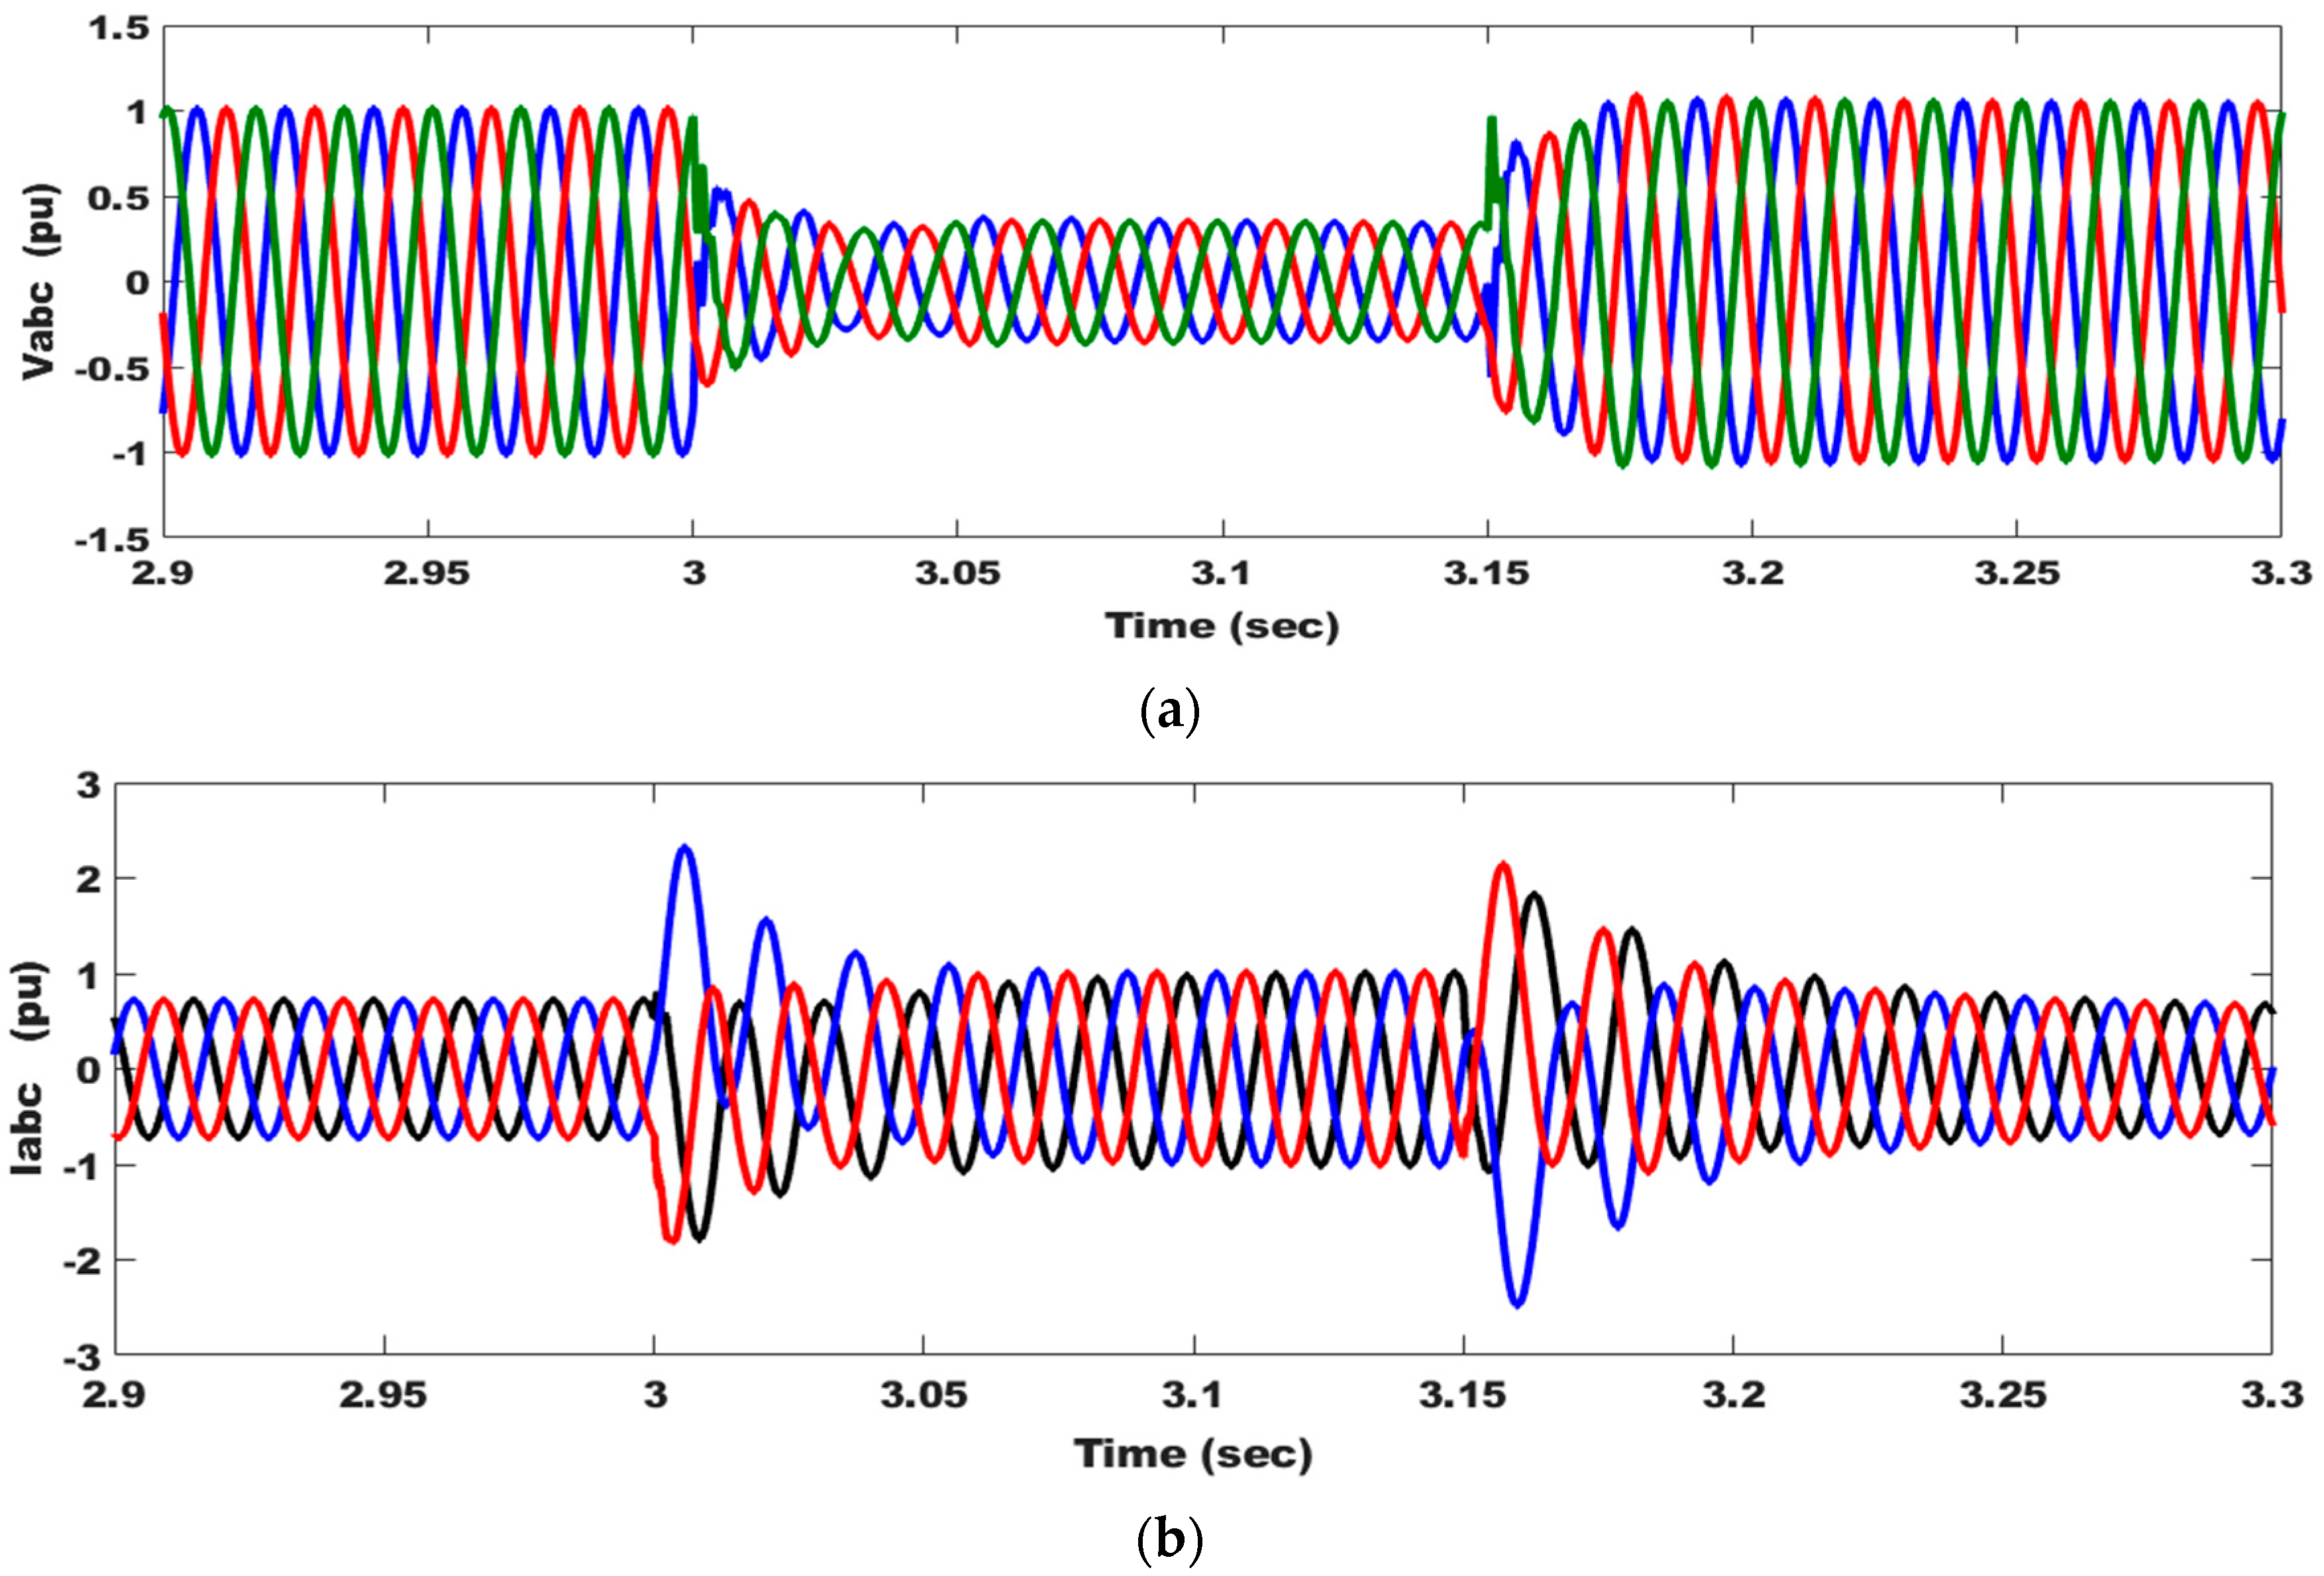
Transient response enhancement during and after clearing the fault becomes a crucial requirement for new grid codes. The fault is assumed to occur at 3 s and cleared at 3.15 s in the grid voltage, as seen in Figure 11a, and wind speed is constant at 12 m·s−1. During the fault period, both P and T e decrease, as seen in Figure 11c,f, respectively, but an increase occurs in I, Q, V D C , and ω r , as seen in Figure 11b,d,e,g, respectively, because of this voltage dip. The braking chopper gets rid of surplus power by dissipating it in the form of thermal power to keep V D C in the whole rated range. The proposed technique is successful in this issue where the overshoot of P, oscillations in ω r , and all parameters are damped. Injection of Q after clearing the fault and the PMSWG maintaining grid connection shows FRT capability realization.

5.3. Impact of Wind Speed Variation under Regular Grid Conditions

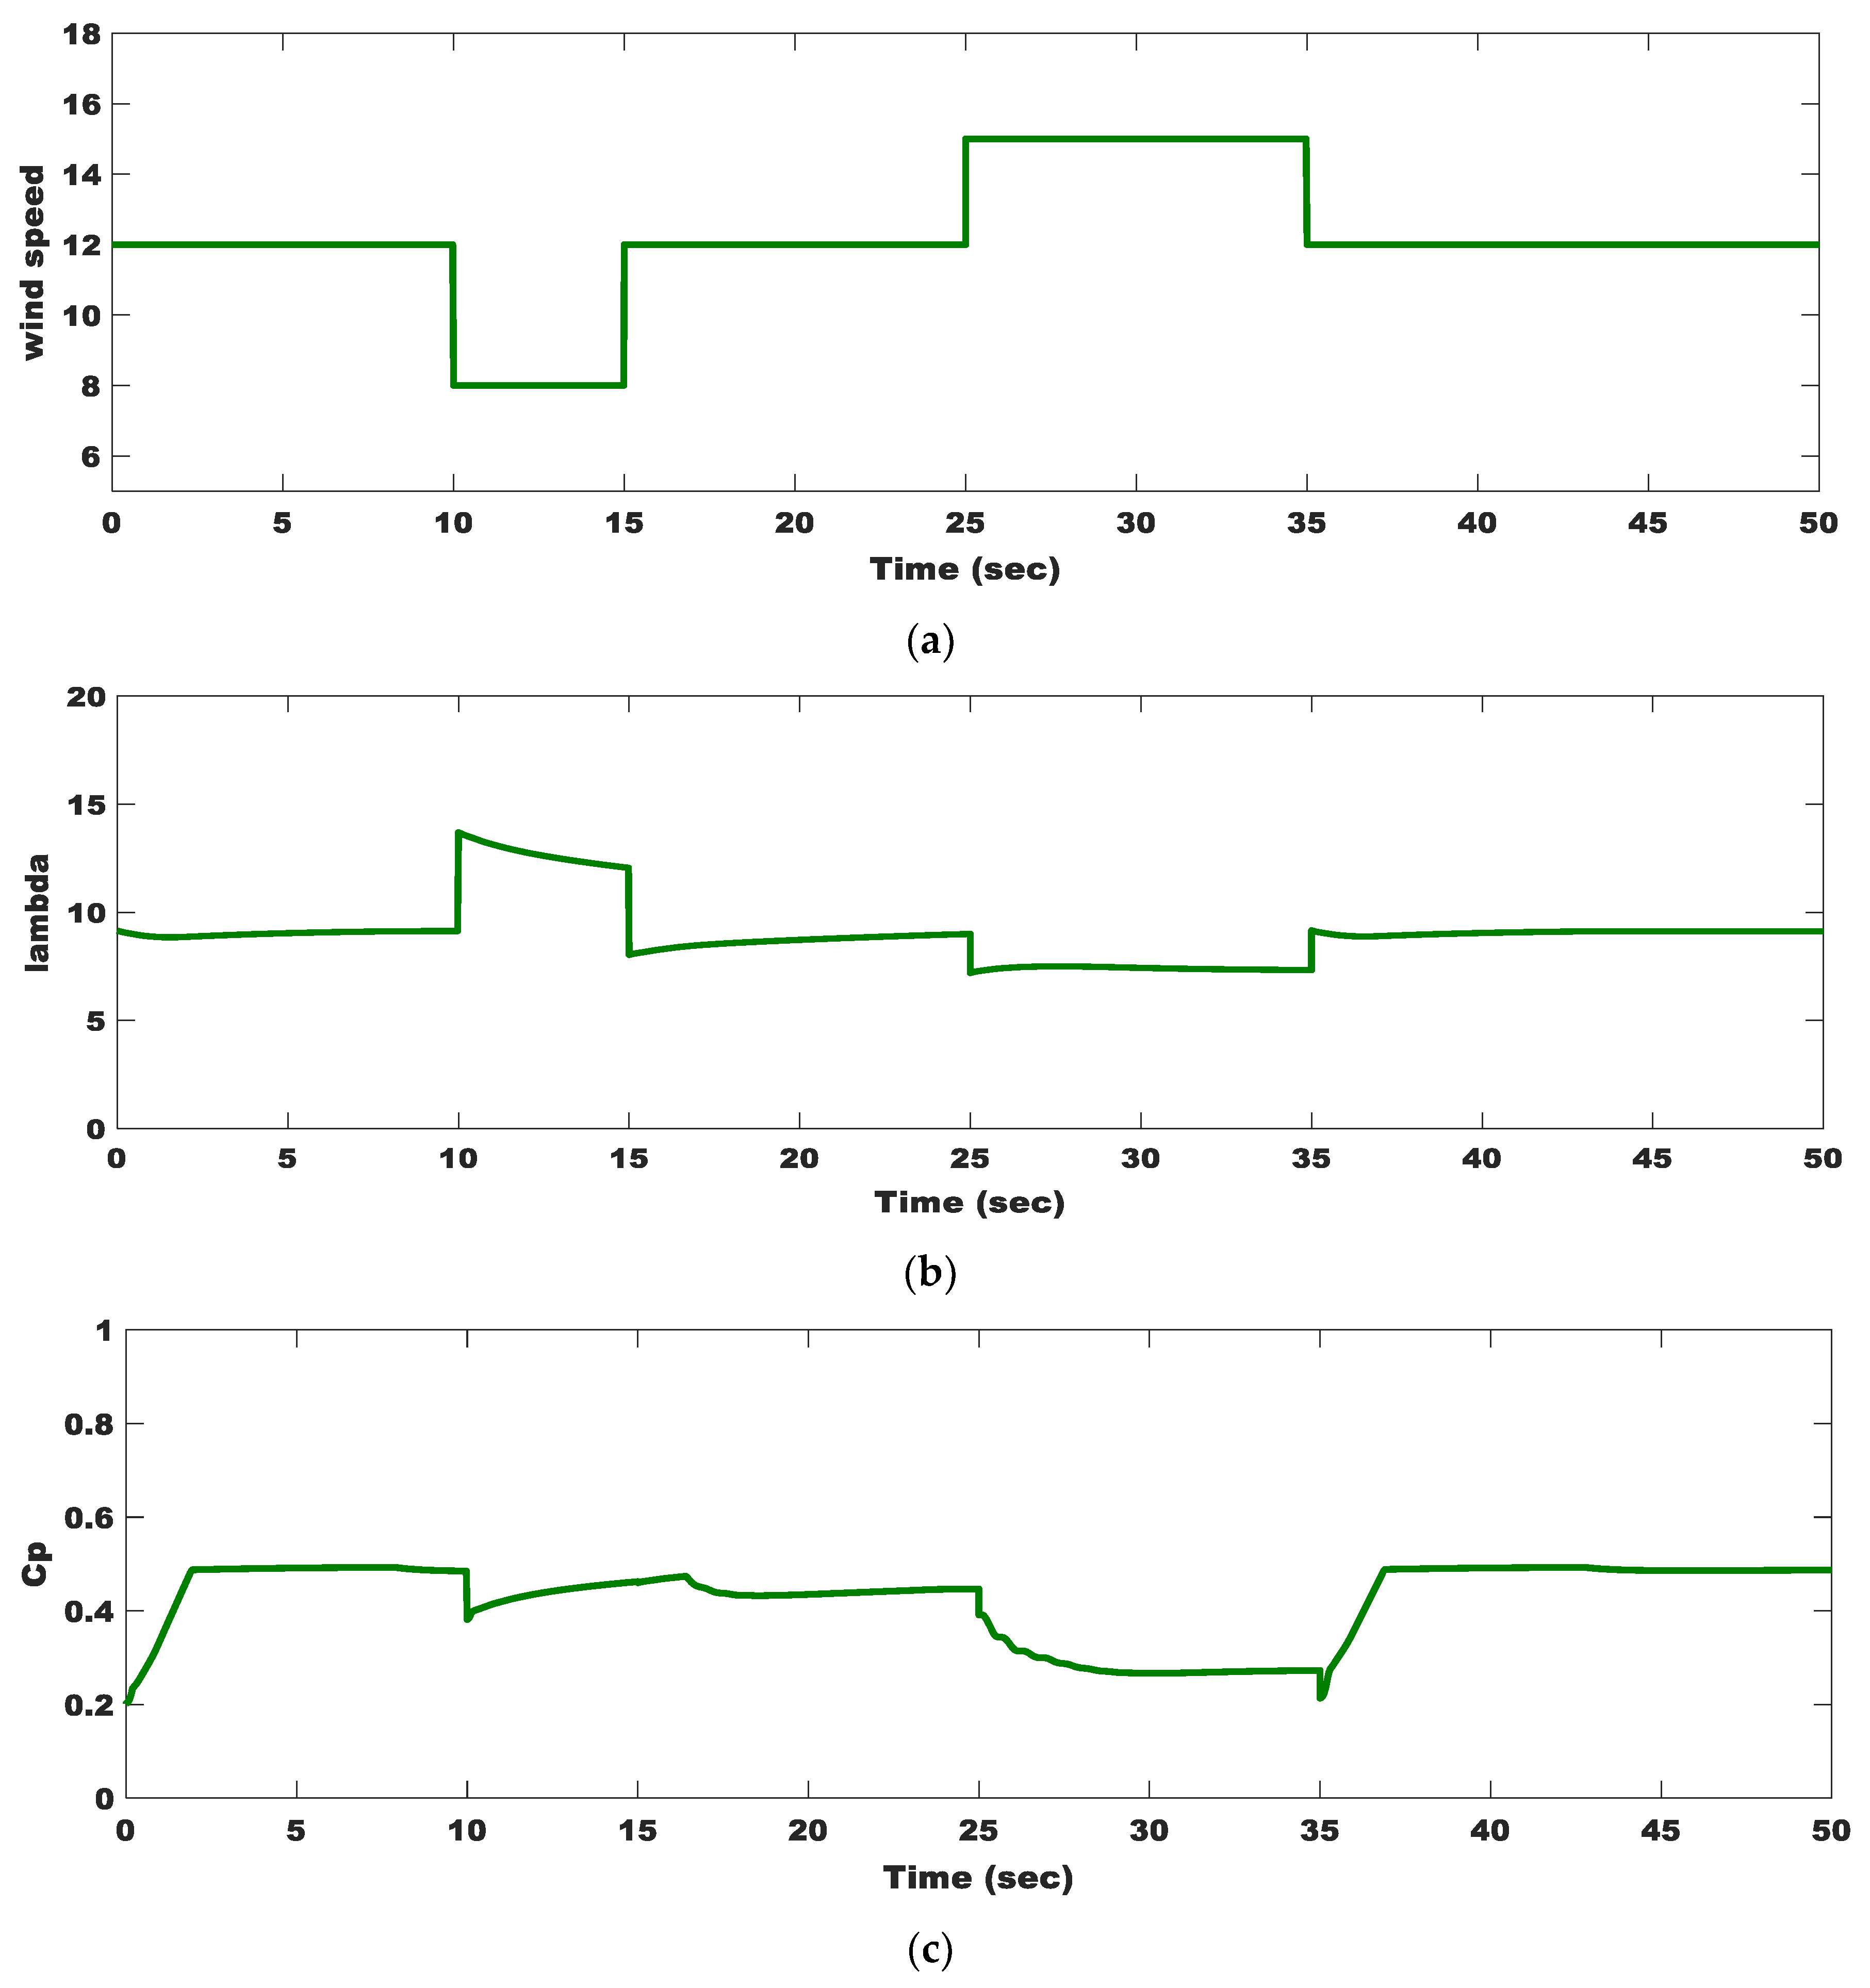
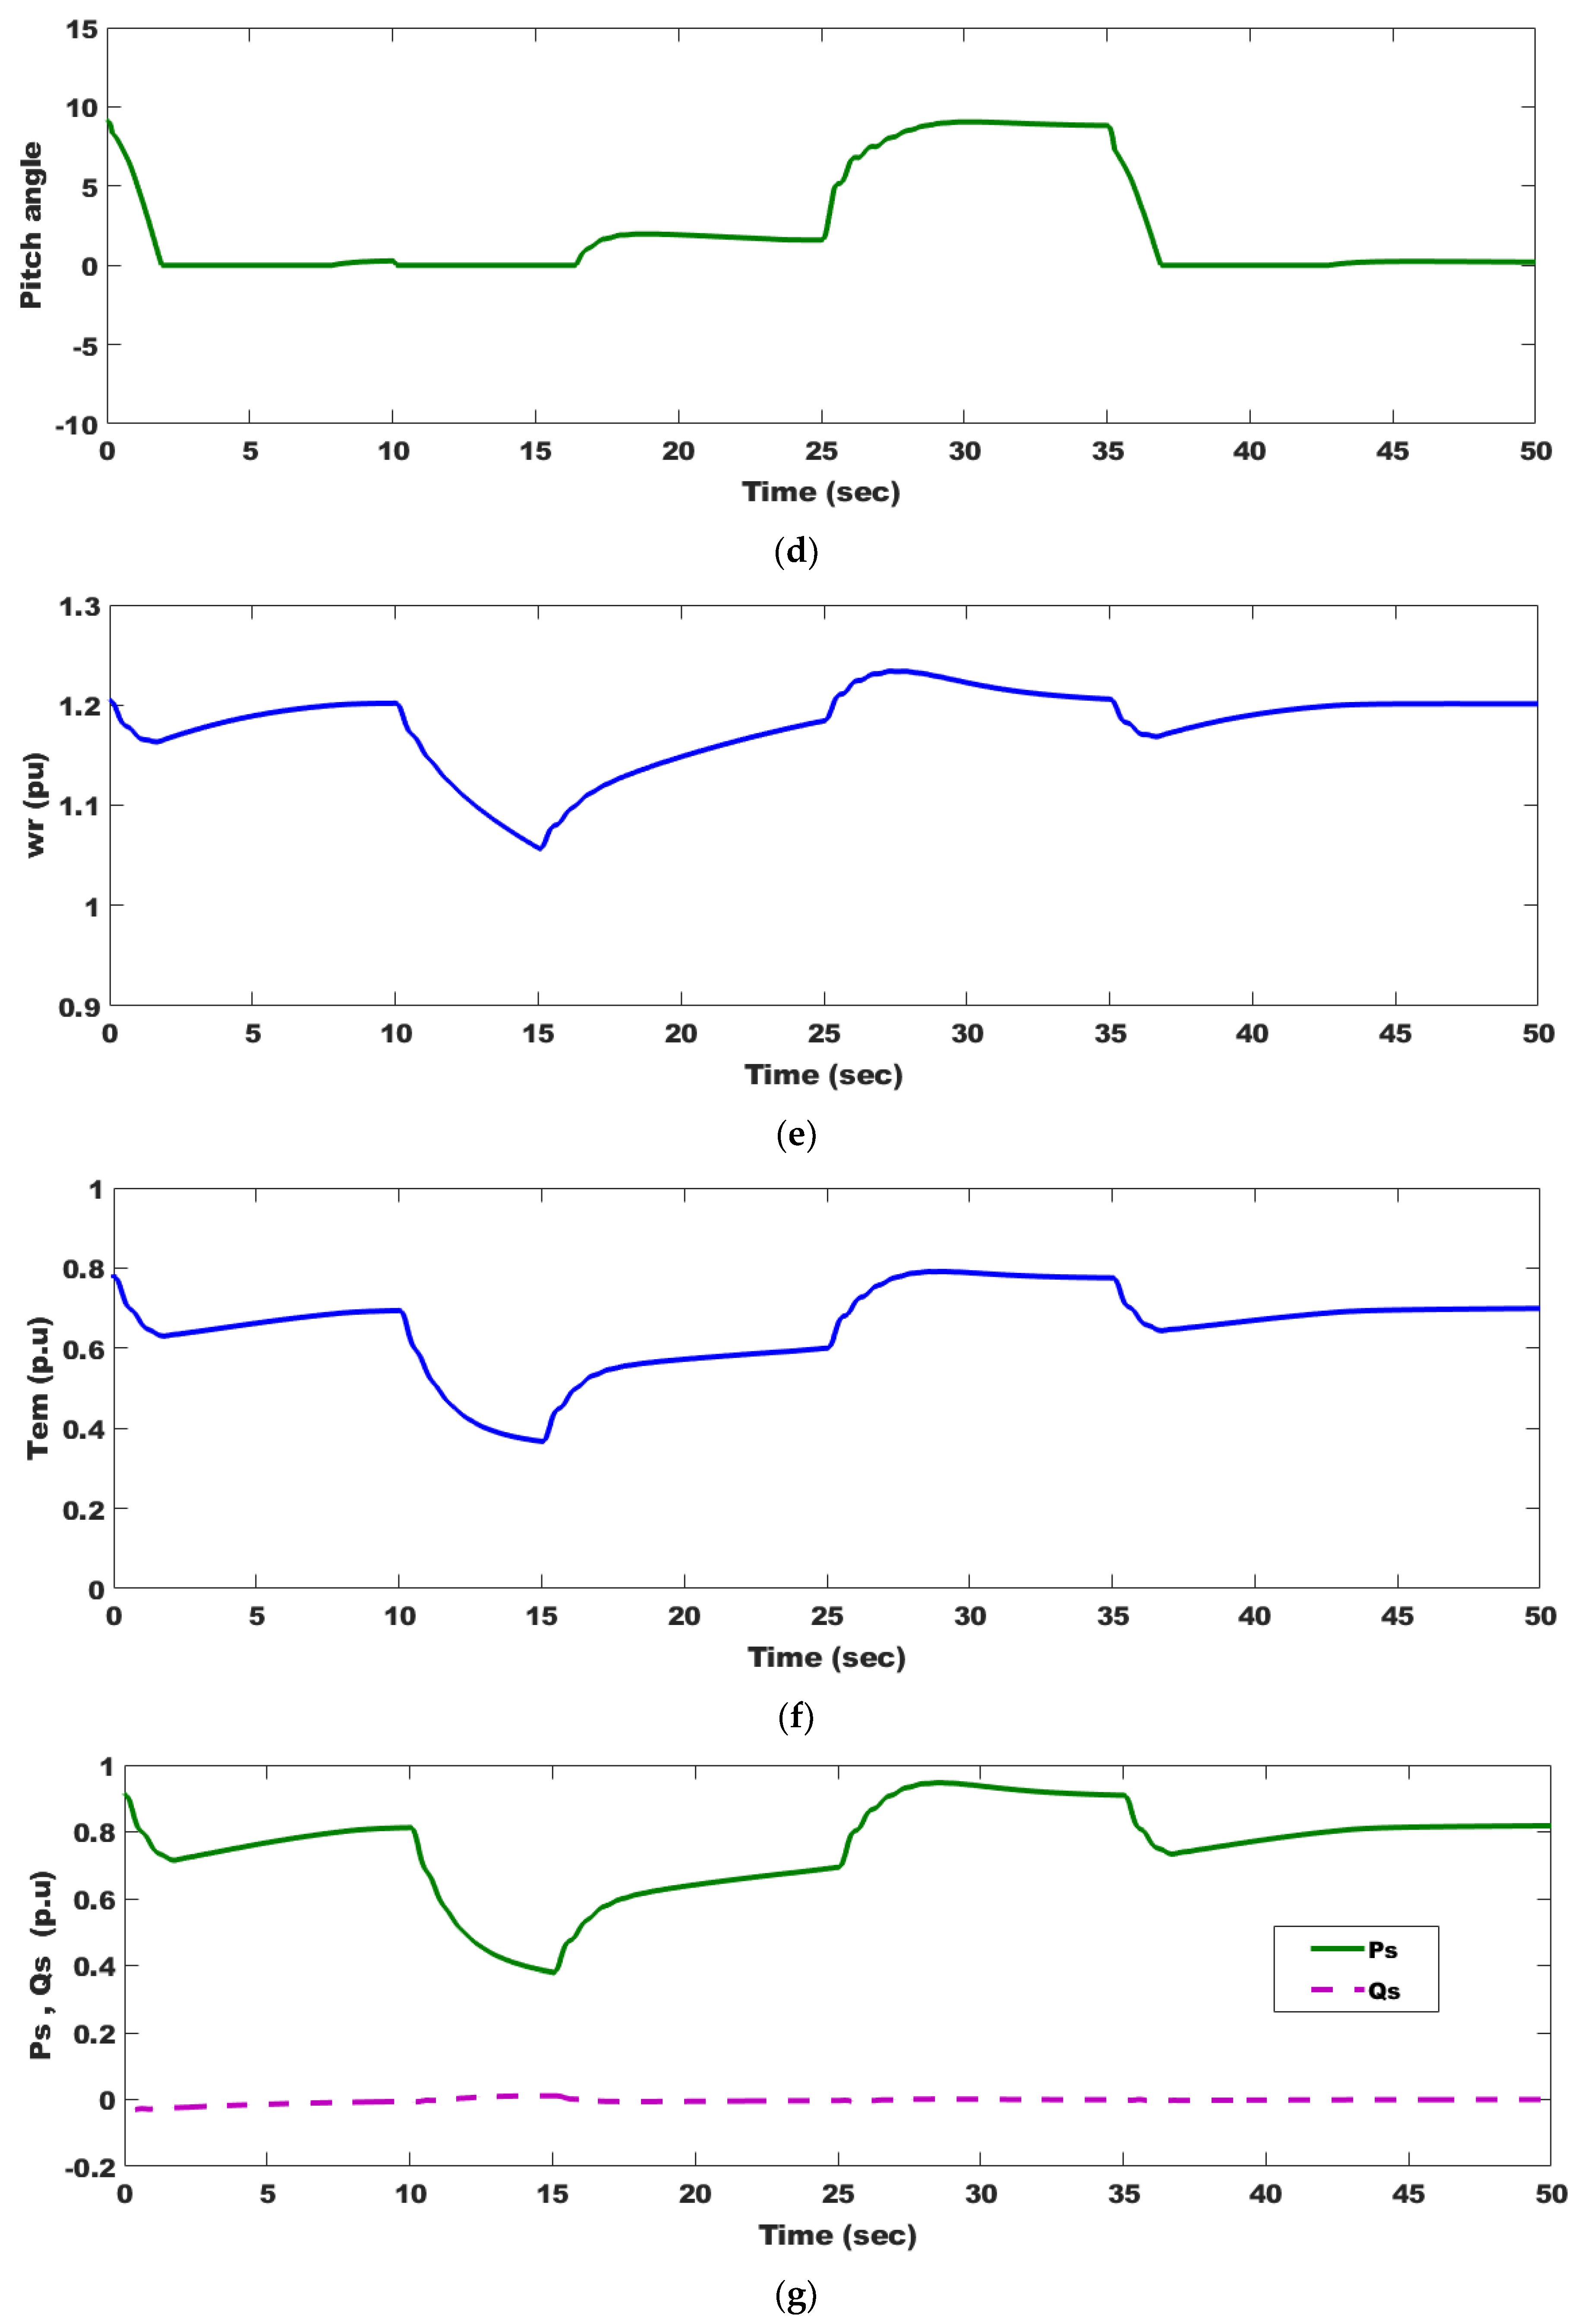
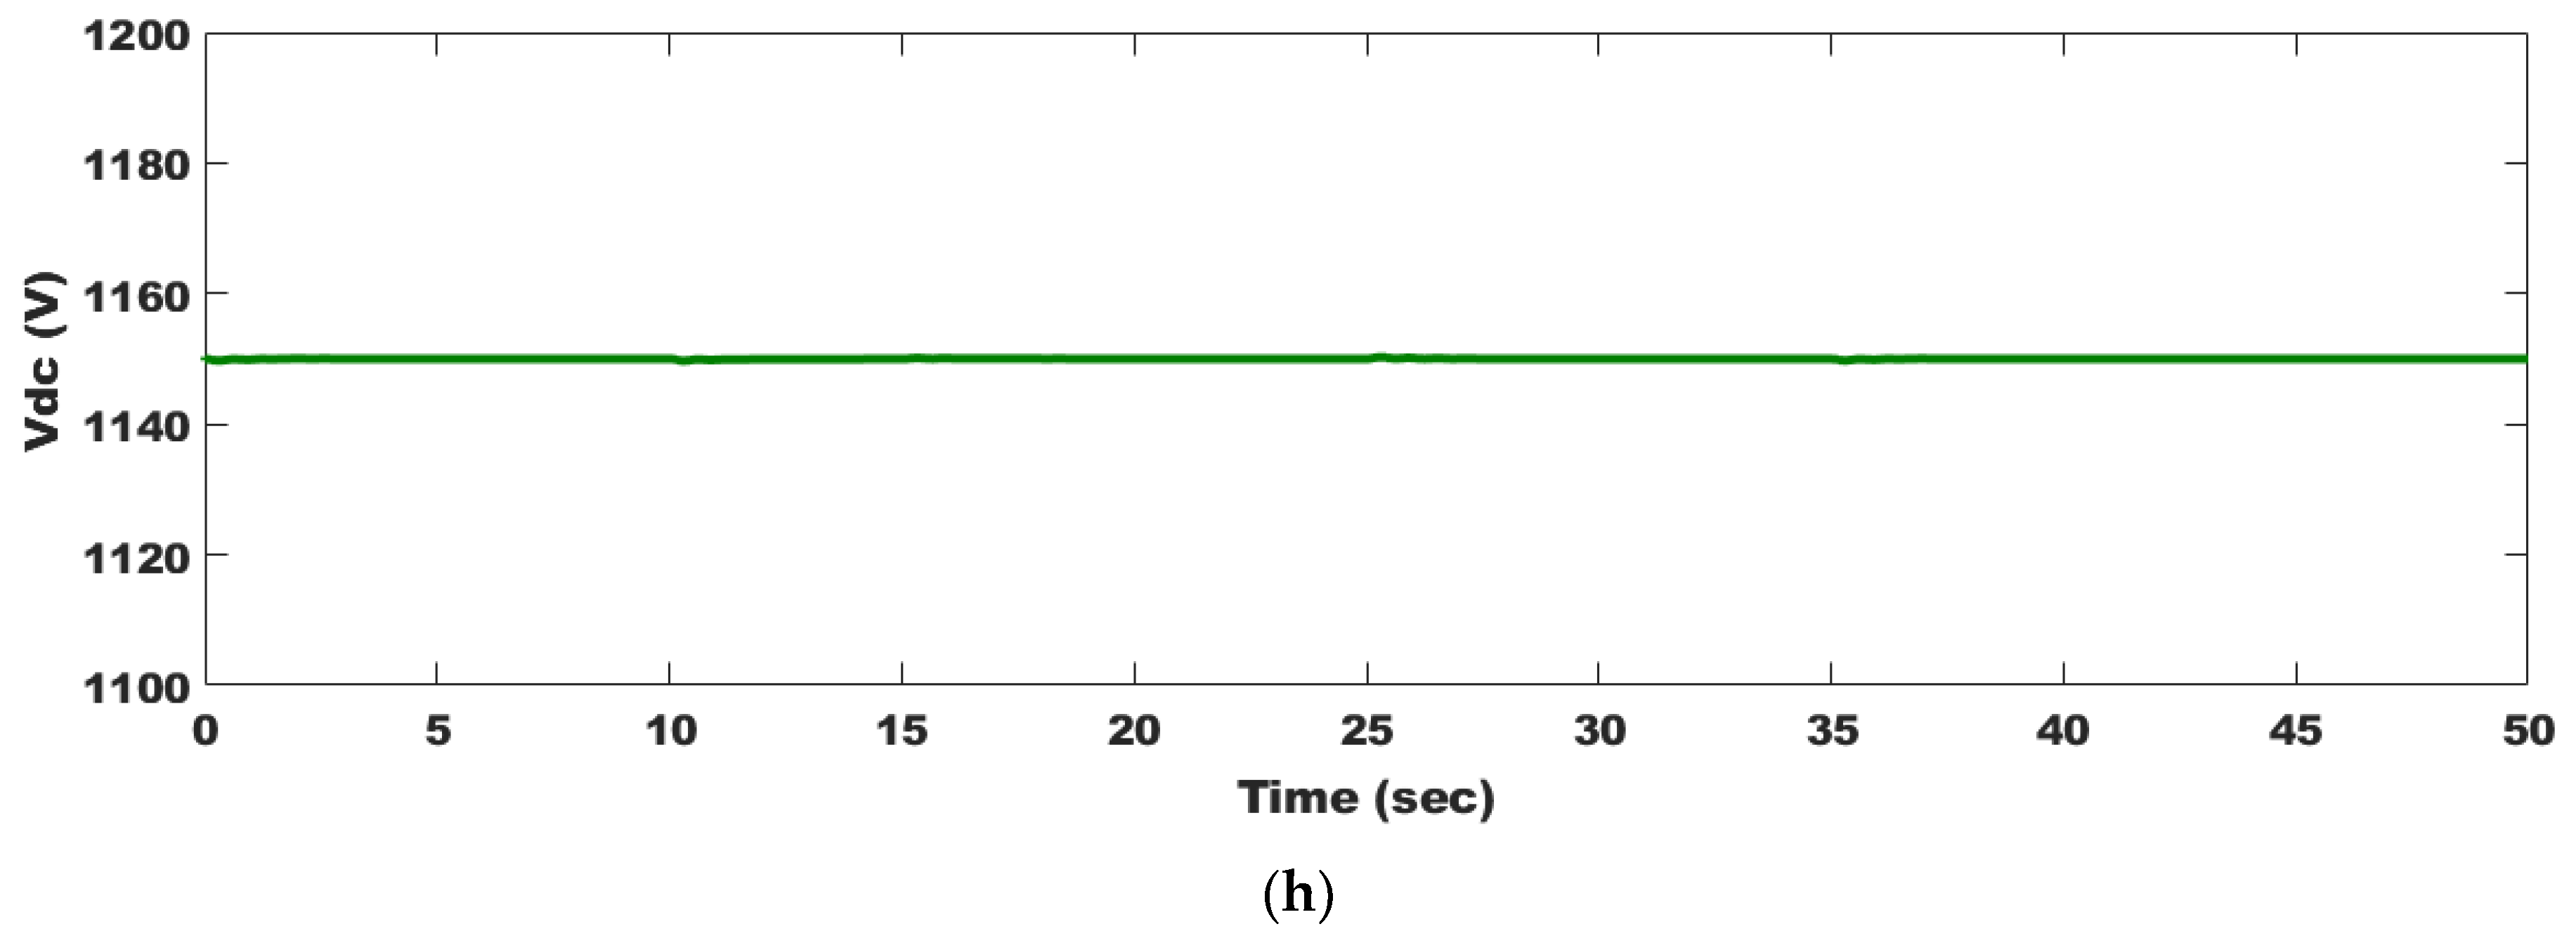
The investigated wind system is shown in Figure 5. Figure 12a shows the variations in the studied wind speed profile. Both λ and C p   are depicted in Figure 12b,c, respectively, and they quickly track the wind speed profile and achieve their desired values. In response to a step change in wind speed, C p   is impacted by λ . Figure 12d depicts the PAC response where the PA increases to reach 9.8740. The PAC successfully prevents the DFIWG from overwinding speeds by increasing PA from when PA is larger than zero. The parameters λ and C p   decrease to reduce output power until this gust disappears to keep the WT working. Figure 12e,f display the changes in both T e and ω r as a result of wind speed changes, respectively. P and Q are shown in Figure 12g as a function of changing wind speeds. Due to the UPF operation, Q is maintained at zero. The unchanging V D C in Figure 12h implies that all produced electricity is transmitted to the power grid. Very minor oscillations in the simulated parameters show the effectiveness of PAC and OTC in the presence of MRFO-PI controllers. The findings of the simulation indicate that the DFIWG has more variability than the PMSWG.

5.4. Realization of FRT at 85% Voltage Dip

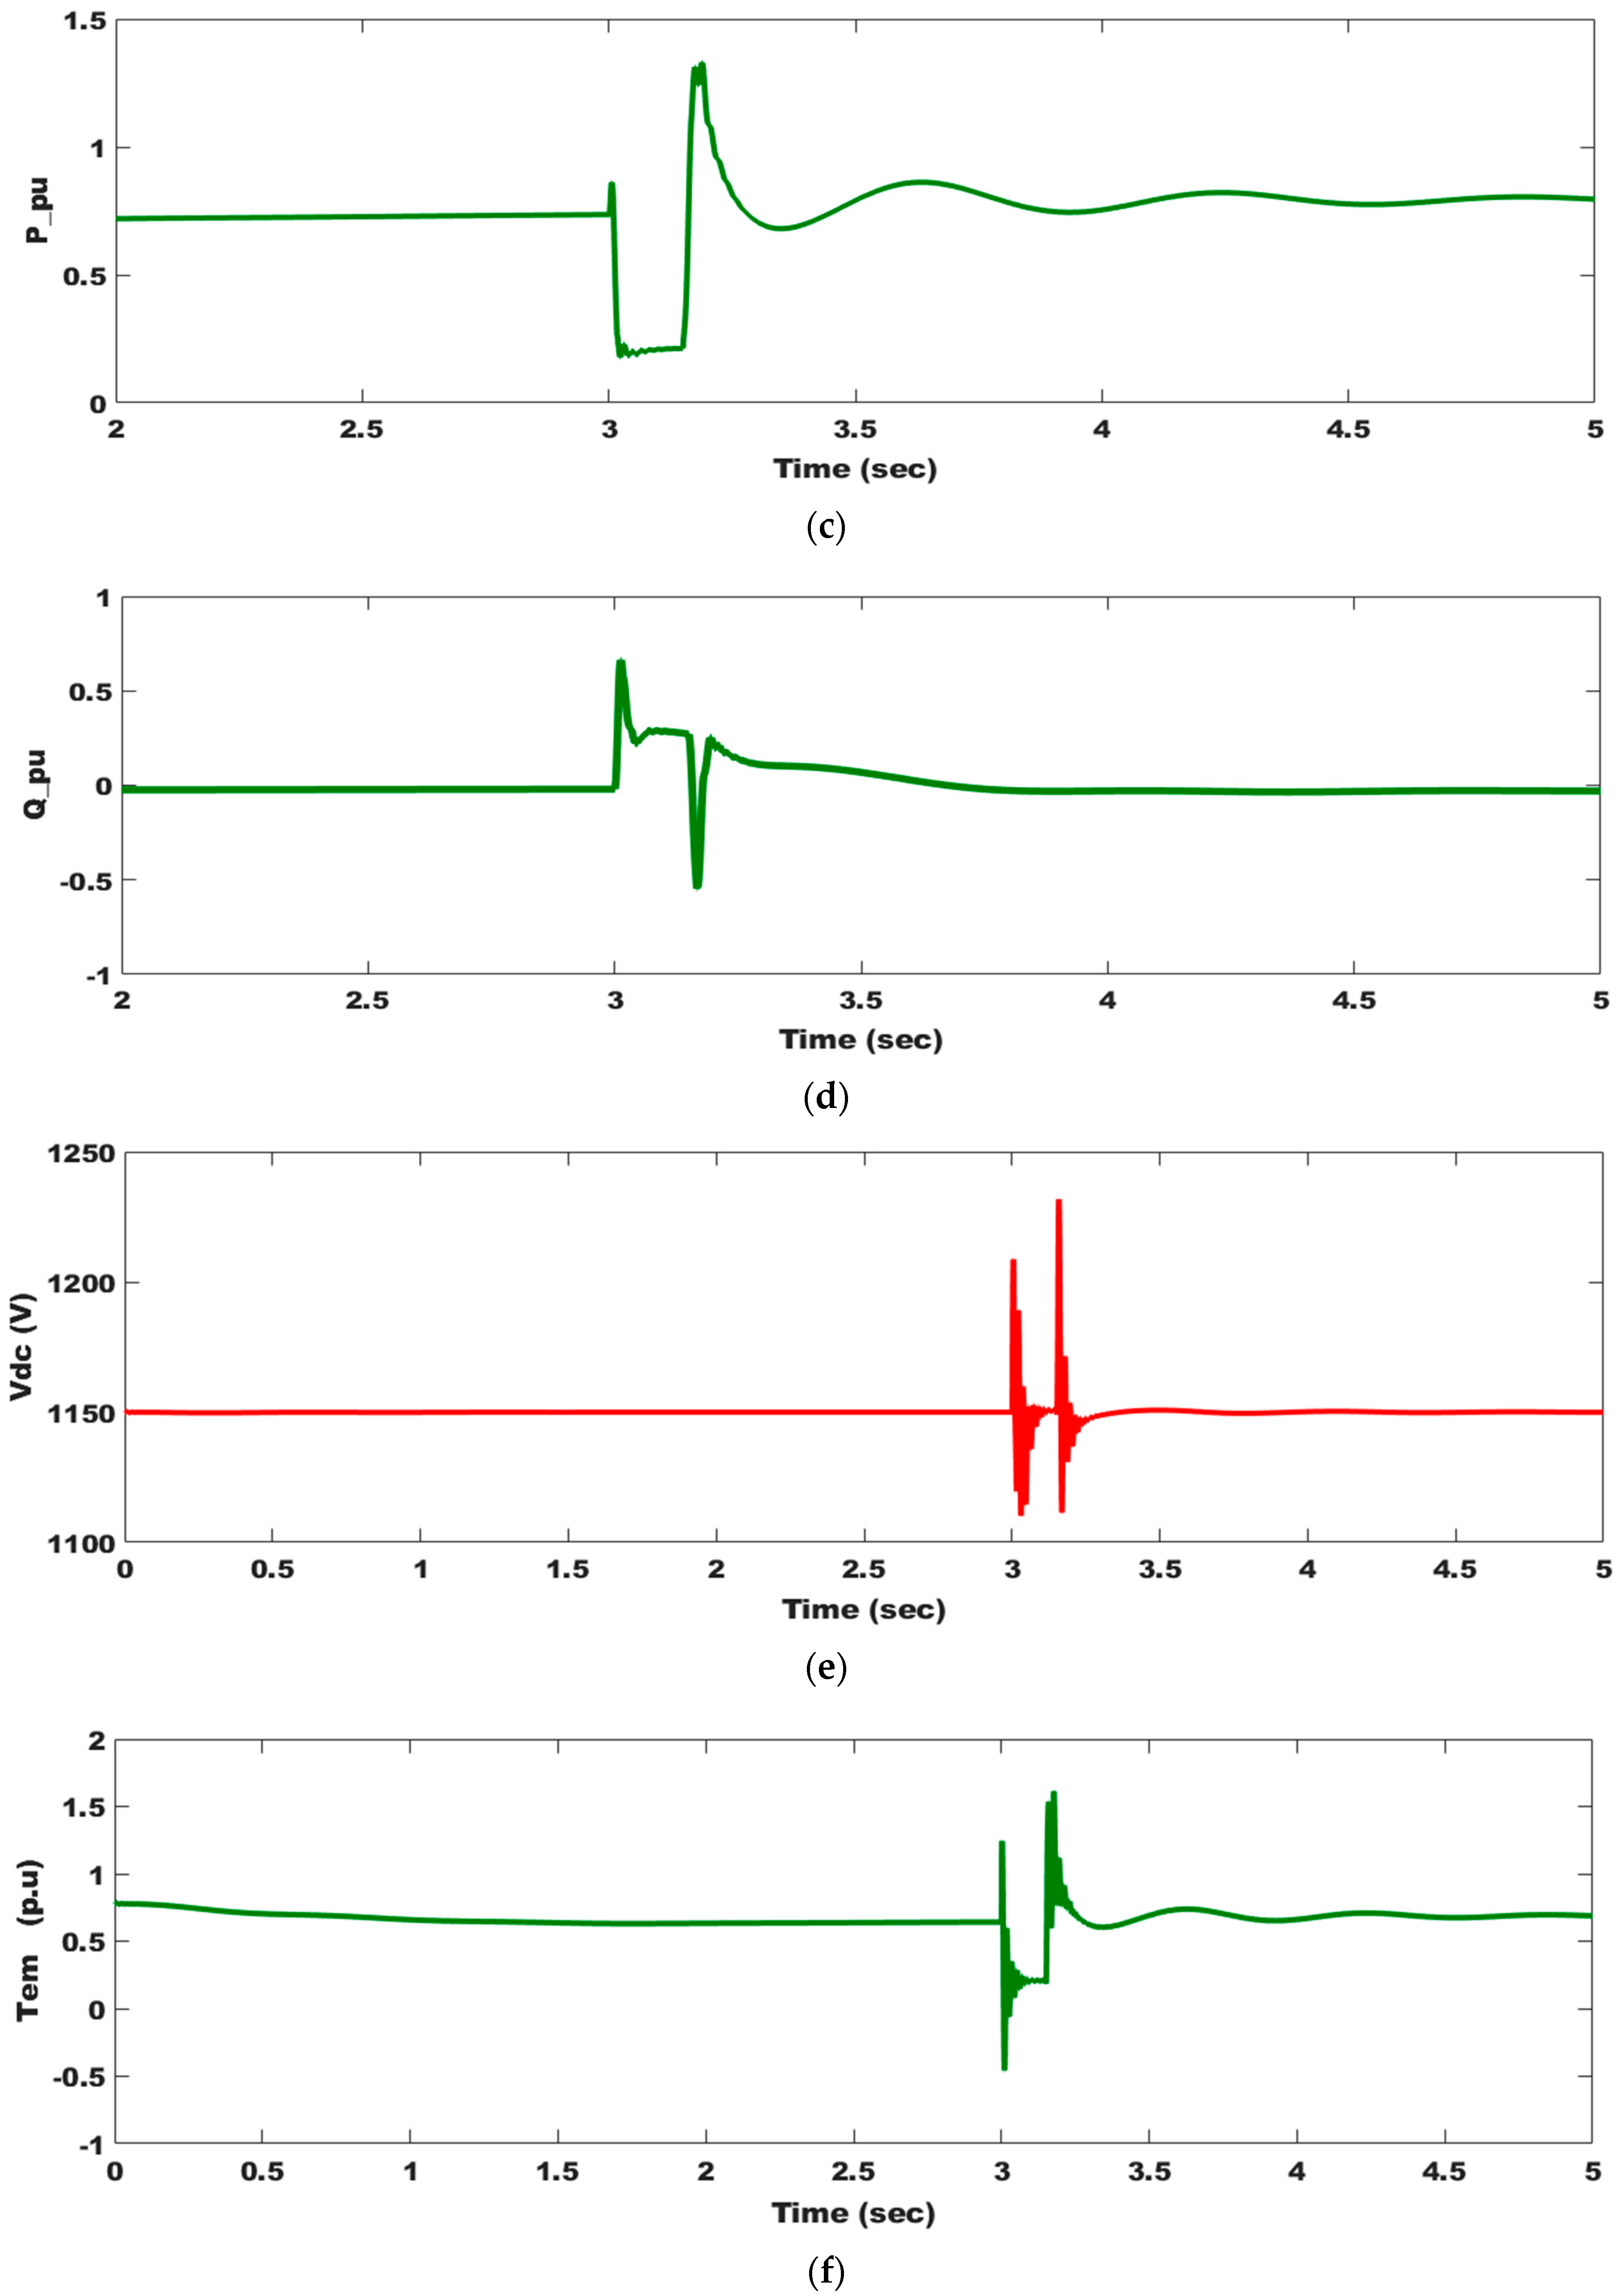
The performance of the DFIWG with a proposed active crowbar and optimized controllers under an 85% voltage dip on the grid, as seen in Figure 13a, is evaluated in this section. The duration of the fault period is assumed to be 150 ms, according to the worst case in new grid codes, to test the efficacy of the proposed schemes. During the fault, both P and T e decrease, as seen in Figure 13c,f, but an increase occurs in I, Q, V D C , and ω r , as seen in Figure 13b,d,e,g, respectively, because of the drop in the grid voltage. In order to keep V D C within the specified range, the braking chopper dissipates excess power as thermal energy, as seen in Figure 13e. The suggested method works well in this case, where all parameters, including oscillations in ω r and overshoot of P, are damped. When Q is injected after a fault has been repaired and the DFIWG is still tied to the grid, FRT capability is achieved. The observed simulated results show that the DFIWG continues to operate appropriately, even in the face of serious failures. All the studied systems’ parameter fluctuations for the cases under study are summarized and listed in Table 11.

6. Conclusions

We investigated the dynamic performances of the DFIWG and PMSWG with MRFO support during wind speed fluctuations (8–15 ) and an 85% grid voltage decrease while taking advantage of MPPT, PAC, and FRT capability. MRFO-based wind side controllers and a chopper controller was designed and implemented for the optimum performance of both the PMSWG and DFIWG. The DFIWG’s performance during regular grid and transient operation was significantly enhanced and the V D C was maintained below the permitted limits when using optimized controllers. Simulated results of the DFIWG’s system parameters showed that the system successfully operated at MPPT and PAC regions and realized an enhanced FRT capability. When the PMSWG operated with optimized controllers, its performance during normal grid and transient operation was greatly improved and the V D C was kept below its allowable limits. Simulated results of the PMSWG’s system parameters showed that the system successfully operated at MPPT and PAC regions and realized an enhanced FRT capability. With the proposed control schemes, the obtained results indicate that:
  • Both WGs are able to function in the PAC zone, have FRT capabilities, and have optimized controllers, all of which have a significant impact on how well they perform in the instances under study.
  • The FRT issues may be made easier with an appropriate choice of controller gains based on the WT design. Compared with the majority of current FRT methods for WTs, this may be a more affordable method without taking external circuitry into account.
  • Blocking of converters for the DFIWG was eliminated with the proposed technique, which is the main problem for DFIWGs.
  • The change in the parameters of the studied wind systems was evident due to the violent change in wind speed and three-phase fault. The change was smaller in the PMSWG in the case of wind speed because it contained more poles; the change was smaller in the case of the fault due to the direct connection of the DFIWG to the network. Table 11 summarizes all the events and changes in parameters.
  • The simulation results showed that the PMSWG was able to track the reference wind speed faster than the DFIWG, where the settling time for CP was found to be 0.784 s with the PMSWG compared with 1.248 s with the DFIWG.
  • The results showed that, with the prosed schemes, the V D C was below limits (1.02 under regular conditions and below 1.1 pu under faults).
  • A small oscillation in the PMSWG, compared with the DFIWG, reveals that it has more power-smoothing capability.
  • The simulation results showed the superiority of the PMSWG over the DFIWG, especially in the event of large disturbances due to the latter’s direct connection to the grid.

Author Contributions

Conceptualization, M.M.M.; methodology, M.M.M. and B.S.A.; software, M.M.M. and B.S.A.; validation, A.Y.A. and M.M.M.; formal analysis, B.S.A.; investigation, M.M.M. and N.A.N.A.; writing—original draft preparation, M.M.M.; writing—review and editing, M.M.M. and B.S.A.; visualization, N.A.N.A. and M.M.M.; supervision, A.Y.A. and M.M.M. All authors have read and agreed to the published version of the manuscript.

Funding

This research received no external funding.

Data Availability Statement

Not applicable.

Conflicts of Interest

The authors declare no conflict of interest.

List of Abbreviations

EPSs: Electrical power systemsIEA: International energy agency
RESs: Renewable energy sourcesPWM: Pulse-width modulation
WE: Wind energy WTs: Wind turbines
VSWGs: Variable-speed wind generatorsFRT: Fault ride-through
PMSWG: Permanent magnet synchronous wind generatordq: Direct quadrature
DFIWG: Doubly-fed induction wind generator BTB: Back-to-back
PIC: PI controllerPAC: Pitch angle control
MPPT: Maximum power point trackingRSC: Rotor side converter
OTC: Optimal torque controlWF: Wind farm
Q: Reactive powerP: Active power
MRFO: Manta ray foraging optimizer FCLs: Fault current limiters
FLC: Fuzzy logic controlSMC: Sliding mode control
CC: Control costMRs: Manta rays
FACTS: Flexible AC transmission systemsPSO: Particle swarm optimization
ANFIS: Adaptive neuro-fuzzy inference systemP&O: Perturb and observe
POCC: Point of common couplingGSS: Golden section search
INC: Incremental conductanceMPC: Model predictive controller

Appendix A

Influence of inertia on electromagnetic torque [51].
T e ± T m = f ω m + J ω . m
(−) and (+) signs represent acceleration and deceleration modes, respectively.
Acceleration mode ( ω / t > 0 )
T e T m = f ω m + J ω . m
In step change, t 0 is a very small value, so that
T e α J d ω m d t α J ω m t
Deceleration mode ( ω / t < 0 )
T e + T m = f ω m + J ω . m
Moreover,
T e α J d ω m d t α J ω m t
where ω = ω n e w ω o l d

References

  1. Ahmadi, A.; Nezhad, A.E.; Hredzak, B. Security-Constrained Unit Commitment in Presence of Lithium-Ion Battery Storage Units Using Information-Gap Decision Theory. IEEE Trans. Ind. Inform. 2019, 15, 148–157. [Google Scholar] [CrossRef]
  2. Chen, C.; Li, C.; Reniers, G.; Yang, F. Safety and security of oil and gas pipeline transportation: A systematic analysis of research trends and future needs using WoS. J. Clean. Prod. 2021, 279, 123583. [Google Scholar] [CrossRef]
  3. Groissböck, M.; Gusmão, A. Impact of renewable resource quality on security of supply with high shares of renewable energies. Appl. Energy 2020, 277, 115567. [Google Scholar] [CrossRef]
  4. Radzka, E.; Rymuza, K.; Michalak, A. Wind power as a renewable energy source. J. Ecol. Eng. 2019, 20, 167–171. [Google Scholar] [CrossRef]
  5. ANEEL. Annual Wind Energy Report 2020. 2020. Available online: http://abeeolica.org.br/wp-content/uploads/2021/06/PT_Boletim-Anual-de-Geracao_2020.pdf (accessed on 1 January 2020).
  6. Jensen, C.U.; Panduro, T.E.; Lundhede, T.H.; Nielsen, A.S.E.; Dalsgaard, M.; Thorsen, B.J. The impact of on-shore and off-shore wind turbine farms on property prices. Energy Policy 2018, 116, 50–59. [Google Scholar] [CrossRef]
  7. Pilpola, S.; Lund, P.D. Different flexibility options for better system integration of wind power. Energy Strateg. Rev. 2019, 26, 100368. [Google Scholar] [CrossRef]
  8. Holttinen, H. Wind integration: Experience, issues, and challenges. Wiley Interdiscip. Rev. Energy Environ. 2012, 1, 243–255. [Google Scholar] [CrossRef]
  9. Ahmed, S.D.; Al-Ismail, F.S.M.; Shafiullah, M.; Al-Sulaiman, F.A.; El-Amin, I.M. Grid Integration Challenges of Wind Energy: A Review. IEEE Access 2020, 8, 10857–10878. [Google Scholar] [CrossRef]
  10. Mahmoud, M.M.; Aly, M.M.; Salama, H.S.; Abdel-Rahim, A.M.M. Dynamic evaluation of optimization techniques–based proportional–integral controller for wind-driven permanent magnet synchronous generator. Wind Eng. 2021, 45, 696–709. [Google Scholar] [CrossRef]
  11. Xing, F.; Xu, Z.; Zhang, Z.; Dan, Y.; Zhu, Y. Resonance stability analysis of large-scale wind power bases with type-IV wind generators. Energies 2020, 13, 5220. [Google Scholar] [CrossRef]
  12. Majout, B.; El Alami, H.; Salime, H.; Laabidine, N.Z.; El Mourabit, Y.; Motahhir, S.; Bouderbala, M.; Karim, M.; Bossoufi, B. A Review on Popular Control Applications in Wind Energy Generator PMSG. Energy 2022, 15, 6238. [Google Scholar]
  13. Shehata, E.G. A comparative study of current control schemes for a direct-driven PMSG wind energy generation system. Electr. Power Syst. Res. 2017, 143, 197–205. [Google Scholar] [CrossRef]
  14. Xu, Y.; An, L.T.; Jia, X.P.; Jia, B.Z.; Maki, N. Optimization study of the main parameters of different types of wind turbine generators. Supercond. Sci. Technol. 2022, 35, 035007. [Google Scholar] [CrossRef]
  15. Kumar, D.; Chatterjee, K. A review of conventional and advanced MPPT algorithms for wind energy systems. Renew. Sustain. Energy Rev. 2016, 55, 957–970. [Google Scholar] [CrossRef]
  16. Buduma, P.; Vulisi, N.K.; Panda, G. Robust Control and Kalman MPPT for Grid-Assimilated Wind Energy Conversion System. IEEE Trans. Ind. Appl. 2021, 57, 1274–1284. [Google Scholar] [CrossRef]
  17. Xu, S.; Shao, R.; Cao, B.; Chang, L. Single-phase grid-connected PV system with golden section search-based MPPT algorithm. Chin. J. Electr. Eng. 2021, 7, 25–36. [Google Scholar] [CrossRef]
  18. Bayrak, G.; Ghaderi, D. An improved step-up converter with a developed real-time fuzzy-based MPPT controller for PV-based residential applications. Int. Trans. Electr. Energy Syst. 2019, 29, 12140. [Google Scholar] [CrossRef]
  19. Priyadarshi, N.; Padmanaban, S.; Holm-Nielsen, J.B.; Blaabjerg, F.; Bhaskar, M.S. An Experimental Estimation of Hybrid ANFIS-PSO-Based MPPT for PV Grid Integration under Fluctuating Sun Irradiance. IEEE Syst. J. 2020, 14, 1218–1229. [Google Scholar] [CrossRef]
  20. Dong, Z.; Li, Z.; Dong, Y.; Jiang, S.; Ding, Z. Fully-distributed deloading operation of DFIG-based wind farm for load sharing. IEEE Trans. Sustain. Energy 2021, 12, 430–440. [Google Scholar] [CrossRef]
  21. Okedu, K.E.; Barghash, H.F.A. Investigating Variable Speed Wind Turbine Transient Performance Considering Different Inverter Schemes and SDBR. Front. Energy Res. 2021, 8, 604338. [Google Scholar] [CrossRef]
  22. Marques, G.; Silva, F.A. Doubly Fed Induction Machine ? Modeling and Control for Wind Energy Generation [Book News]. IEEE Ind. Electron. Mag. 2015, 9, 54–55. [Google Scholar] [CrossRef]
  23. Mahmoud, M.M.; Aly, M.M.; Abdel-Rahim, A.M.M. Enhancing the dynamic performance of a wind-driven PMSG implementing different optimization techniques. SN Appl. Sci. 2020, 2, 684. [Google Scholar] [CrossRef] [Green Version]
  24. Mahmoud, M.M.; Ratib, M.K.; Aly, M.M.; Moamen, A.; Rahim, M.A. Effect of Grid Faults on Dominant Wind Generators for Electric Power System Integration: A Comparison and Assessment. Energy Syst. Res. 2021, 4, 70–78. [Google Scholar]
  25. Mahela, O.P.; Gupta, N.; Khosravy, M.; Patel, N. Comprehensive overview of low voltage ride through methods of grid integrated wind generator. IEEE Access 2019, 7, 99299–99326. [Google Scholar] [CrossRef]
  26. Mahmoud, M.M.; Hemeida, A.M.; Senjy, T.; Ewais, A.M. Fault Ride-Through Capability Enhancement for Grid-Connected Permanent Magnet Synchronous Generator Driven by Wind Turbines. In Proceedings of the IEEE Conference on Power Electronics and Renewable Energy, CPERE 2019, Aswan City, Egypt, 23–25 October 2019; pp. 567–572. [Google Scholar]
  27. Swain, S.; Ray, P.K. Short circuit fault analysis in a grid connected DFIG based wind energy system with active crowbar protection circuit for ridethrough capability and power quality improvement. Int. J. Electr. Power Energy Syst. 2017, 84, 64–75. [Google Scholar] [CrossRef]
  28. Mossa, M.A.; Abdelhamid, M.K.; Hassan, A.A.; Bianchi, N. Improving the Dynamic Performance of a Variable Speed DFIG for Energy Conversion Purposes Using an Effective Control System. Processes 2022, 10, 456. [Google Scholar] [CrossRef]
  29. El Moursi, M.S.; Zeineldin, H.H. A parallel capacitor control strategy for enhanced FRT capability of DFIG. IEEE Trans. Sustain. Energy 2014, 6, 303–312. [Google Scholar]
  30. Hiremath, R.; Moger, T. Comprehensive review on low voltage ride through capability of wind turbine generators. Int. Trans. Electr. Energy Syst. 2020, 30, 12524. [Google Scholar] [CrossRef]
  31. Mahmoud, M.M.; Mohamed Hemeida, A.; Abdel-Rahim, A.M.M. Behavior of PMSG Wind Turbines with Active Crowbar Protection under Faults. In Proceedings of the 2019 Innovations in Power and Advanced Computing Technologies, i-PACT 2019, Vellore, India, 22–23 March 2019; pp. 1–6. [Google Scholar]
  32. Mohammadi, J.; Afsharnia, S.; Vaez-Zadeh, S.; Farhangi, S. Improved fault ride through strategy for doubly fed induction generator based wind turbines under both symmetrical and asymmetrical grid faults. IET Renew. Power Gener. 2016, 10, 1114–1122. [Google Scholar] [CrossRef]
  33. Mahmoud, M.M.; Aly, M.M.; Salama, H.S.; Abdel-Rahim, A.M.M. An internal parallel capacitor control strategy for DC-link voltage stabilization of PMSG-based wind turbine under various fault conditions. Wind Eng. 2021, 46, 983–992. [Google Scholar] [CrossRef]
  34. Tohidi, S.; Behnam, M.I. A comprehensive review of low voltage ride through of doubly fed induction wind generators. Renew. Sustain. Energy Rev. 2016, 57, 412–419. [Google Scholar] [CrossRef]
  35. Angala Parameswari, G.; Habeebullah Sait, H. A comprehensive review of fault ride-through capability of wind turbines with grid-connected doubly fed induction generator. Int. Trans. Electr. Energy Syst. 2020, 30, 12395. [Google Scholar] [CrossRef]
  36. Zheng, Z.; Xie, Q.; Xiao, X.; Zhou, Y. Review of SMES and SFCL Based FRT Strategy for PMSG-Based Wind Turbine Generator. In Proceedings of the 2020 IEEE International Conference on Applied Superconductivity and Electromagnetic Devices, ASEMD 2020, Tianjin, China, 16–18 October 2020. [Google Scholar]
  37. Mahmoud, M.M.; Esmail, Y.M.; Atia, B.S.; Kamel, O.M.; Aboras, K.M.; Bajaj, M.; Sabir, S.; Bukhari, H.; Eutyche, D.; Wapet, M. Voltage Quality Enhancement of Low-Voltage Smart Distribution System Using Robust and Optimized DVR Controllers: Application of the Harris Hawks Algorithm. Int. Trans. Electr. Energy Syst. 2022, 2022, 18. [Google Scholar] [CrossRef]
  38. Tourou, P.; Sourkounis, C. Review of control strategies for DFIG-based wind turbines under unsymmetrical grid faults. In Proceedings of the 2014 9th International Conference on Ecological Vehicles and Renewable Energies, EVER 2014, Monte-Carlo, Monaco, 25–27 March 2014. [Google Scholar]
  39. Adetokun, B.B.; Muriithi, C.M. Impact of integrating large-scale DFIG-based wind energy conversion system on the voltage stability of weak national grids: A case study of the Nigerian power grid. Energy Rep. 2021, 7, 654–666. [Google Scholar] [CrossRef]
  40. Nasiri, M.; Mohammadi, R. Peak Current Limitation for Grid Side Inverter by Limited Active Power in PMSG-Based Wind Turbines During Different Grid Faults. IEEE Trans. Sustain. Energy 2017, 8, 3–12. [Google Scholar] [CrossRef]
  41. Gencer, A. Analysis and control of fault ride through capability improvement pmsg based on WECS using active crowbar system during different fault conditions. Elektron. Ir Elektrotechnika 2018, 24, 63–69. [Google Scholar] [CrossRef] [Green Version]
  42. Moghimian, M.M.; Radmehr, M.; Firouzi, M. Series Resonance Fault Current Limiter (SRFCL) with MOV for LVRT Enhancement in DFIG-Based Wind Farms. Electr. Power Compon. Syst. 2019, 47, 1814–1825. [Google Scholar] [CrossRef]
  43. Firouzi, M.; Nasiri, M.; Benbouzid, M.; Gharehpetian, G.B. Application of multi-step bridge-type fault current limiter for fault ride-through capability enhancement of permanent magnet synchronous generator-based wind turbines. Int. Trans. Electr. Energy Syst. 2020, 30, 12611. [Google Scholar] [CrossRef]
  44. Islam, M.R.; Hasan, J.; Shipon, M.R.R.; Sadi, M.A.H.; Abuhussein, A.; Roy, T.K. Neuro Fuzzy Logic Controlled Parallel Resonance Type Fault Current Limiter to Improve the Fault Ride through Capability of DFIG Based Wind Farm. IEEE Access 2020, 8, 115314–115334. [Google Scholar] [CrossRef]
  45. Sadi, M.A.H.; Abuhussein, A.; Shoeb, M.A. Transient Performance Improvement of Power Systems Using Fuzzy Logic Controlled Capacitive-Bridge Type Fault Current Limiter. IEEE Trans. Power Syst. 2021, 36, 323–335. [Google Scholar] [CrossRef]
  46. Shafiee, M.R.; Kartijkolaie, H.S.; Firouzi, M.; Mobayen, S.; Fekih, A. A Dynamic Multi-Cell FCL to Improve the Fault Ride through Capability of DFIG-Based Wind Farms. Energies 2020, 13, 6071. [Google Scholar] [CrossRef]
  47. Firouzi, M.; Nasiri, M.; Mobayen, S.; Gharehpetian, G.B. Sliding Mode Controller-Based BFCL for Fault Ride-Through Performance Enhancement of DFIG-Based Wind Turbines. Complexity 2020, 2020, 1259539. [Google Scholar] [CrossRef]
  48. Qais, M.H.; Hasanien, H.M.; Alghuwainem, S. A Grey Wolf Optimizer for Optimum Parameters of Multiple PI Controllers of a Grid-Connected PMSG Driven by Variable Speed Wind Turbine. IEEE Access 2018, 6, 44120–44128. [Google Scholar] [CrossRef]
  49. Ghany, A.A.; Shehata, E.G.; Elsayed, A.H.M.; Mohamed, Y.S.; Alhelou, H.H.; Siano, P.; Diab, A.A.Z. Novel switching frequency fcs-mpc of pmsg for grid-connected wind energy conversion system with coordinated low voltage ride through. Electron. 2021, 10, 492. [Google Scholar] [CrossRef]
  50. Majout, B.; Bossoufi, B.; Bouderbala, M.; Masud, M.; Al-Amri, J.F.; Taoussi, M.; El Mahfoud, M.; Motahhir, S.; Karim, M. Improvement of PMSG-Based Wind Energy Conversion System Using Developed Sliding Mode Control. Energies 2022, 15, 1625. [Google Scholar] [CrossRef]
  51. Mahmoud, M.M.; Aly, M.M.; Salama, H.S.; Abdel-Rahim, A.M.M. A combination of an OTC based MPPT and fuzzy logic current control for a wind-driven PMSG under variability of wind speed. Energy Syst. 2022, 13, 1075–1098. [Google Scholar] [CrossRef]
  52. Mahmoud, M.M. Improved current control loops in wind side converter with the support of wild horse optimizer for enhancing the dynamic performance of PMSG-based wind generation system. Int. J. Model. Simul. 2022, 1–15. [Google Scholar] [CrossRef]
  53. Metwally Mahmoud, M.; Salama, H.S.; Aly, M.M.; Abdel-Rahim, A.M.M. Design and implementation of FLC system for fault ride-through capability enhancement in PMSG-wind systems. Wind Eng. 2021, 45, 1361–1373. [Google Scholar] [CrossRef]
  54. Zhu, D.; Zou, X.; Zhou, S.; Dong, W.; Kang, Y.; Hu, J. Feedforward Current References Control for DFIG-Based Wind Turbine to Improve Transient Control Performance During Grid Faults. IEEE Trans. Energy Convers. 2018, 33, 670–681. [Google Scholar] [CrossRef]
  55. Mohammadi, J.; Vaez-Zadeh, S.; Ebrahimzadeh, E.; Blaabjerg, F. Combined control method for grid-side converter of doubly fed induction generatorbased wind energy conversion systems. IET Renew. Power Gener. 2018, 12, 943–952. [Google Scholar] [CrossRef]
  56. Nair, A.R.; Bhattarai, R.; Smith, M.; Kamalasadan, S. Parametrically Robust Identification Based Sensorless Control Approach for Doubly Fed Induction Generator. IEEE Trans. Ind. Appl. 2021, 57, 1024–1034. [Google Scholar] [CrossRef]
  57. Wadawa, B.; Errami, Y.; Obbadi, A.; Sahnoun, S. Robustification of the H∞ controller combined with fuzzy logic and PI&PID-Fd for hybrid control of Wind Energy Conversion System Connected to the Power Grid Based on DFIG. Energy Rep. 2021, 7, 7539–7571. [Google Scholar] [CrossRef]
  58. Chojaa, H.; Derouich, A.; Taoussi, M.; Chehaidia, S.E.; Zamzoum, O.; Mosaad, M.I.; Alhejji, A.; Yessef, M. Nonlinear Control Strategies for Enhancing the Performance of DFIG-Based WECS under a Real Wind Profile. Energies 2022, 15, 6650. [Google Scholar] [CrossRef]
  59. Shiravani, F.; Cortajarena, J.A.; Alkorta, P.; Barambones, O. Generalized Predictive Control Scheme for a Wind Turbine System. Sustainability 2022, 14, 8865. [Google Scholar] [CrossRef]
  60. Krause, P.C.; Wasynczuk, O.; Sudhoff, S.D. Analysis of Electric Machinery and Drive Systems; John Wiley & Sons: New York, NY, USA, 2002. [Google Scholar] [CrossRef]
  61. Nkosi, N.R.; Bansal, R.C.; Adefarati, T.; Naidoo, R.M.; Bansal, S.K. A review of small-signal stability analysis of DFIG-based wind power system. Int. J. Model. Simul. 2022, 1–18. [Google Scholar] [CrossRef]
  62. IRENA. Renewable Capacity Statistics 2020. 2020. Available online: https://www.irena.org/-/media/Files/IRENA/Agency/Publication/2020/Mar/IRENA_RE_Capacity_Statistics_2020.pdf (accessed on 1 January 2020).
  63. Chao, H.; Hu, B.; Xie, K.; Tai, H.M.; Yan, J.; Li, Y. A Sequential MCMC Model for Reliability Evaluation of Offshore Wind Farms Considering Severe Weather Conditions. IEEE Access 2019, 7, 132552–132562. [Google Scholar] [CrossRef]
  64. Qiu, Y.; Feng, Y.; Sun, J.; Zhang, W.; Infield, D. Applying thermophysics for wind turbine drivetrain fault diagnosis using SCADA data. IET Renew. Power Gener. 2016, 10, 661–668. [Google Scholar] [CrossRef] [Green Version]
  65. Xie, S.; Wang, X.; Qu, C.; Wang, X.; Guo, J. Impacts of different wind speed simulation methods on conditional reliability indices. Int. Trans. Electr. Energy Syst. 2013, 20, 1–6. [Google Scholar] [CrossRef]
  66. Li, H.; Chen, Z. Overview of different wind generator systems and their comparisons. IET Renew. Power Gener. 2008, 2, 123–138. [Google Scholar] [CrossRef] [Green Version]
  67. Kahraman, H.T.; Akbel, M.; Duman, S. Optimization of optimal power flow problem using multi-objective manta ray foraging optimizer. Appl. Soft Comput. 2022, 116, 108334. [Google Scholar] [CrossRef]
  68. Selem, S.I.; Hasanien, H.M.; El-Fergany, A.A. Parameters extraction of PEMFC’s model using manta rays foraging optimizer. Int. J. Energy Res. 2020, 44, 4629–4640. [Google Scholar] [CrossRef]
  69. Micev, M.; Ćalasan, M.; Ali, Z.M.; Hasanien, H.M.; Abdel Aleem, S.H.E. Optimal design of automatic voltage regulation controller using hybrid simulated annealing—Manta ray foraging optimization algorithm. Ain Shams Eng. J. 2021, 12, 641–657. [Google Scholar] [CrossRef]
  70. Yuan, L.; Meng, K.; Huang, J.; Yang Dong, Z.; Zhang, W.; Xie, X. Development of HVRT and LVRT control strategy for pmsg-based wind turbine generators y. Energies 2020, 13, 5442. [Google Scholar] [CrossRef]
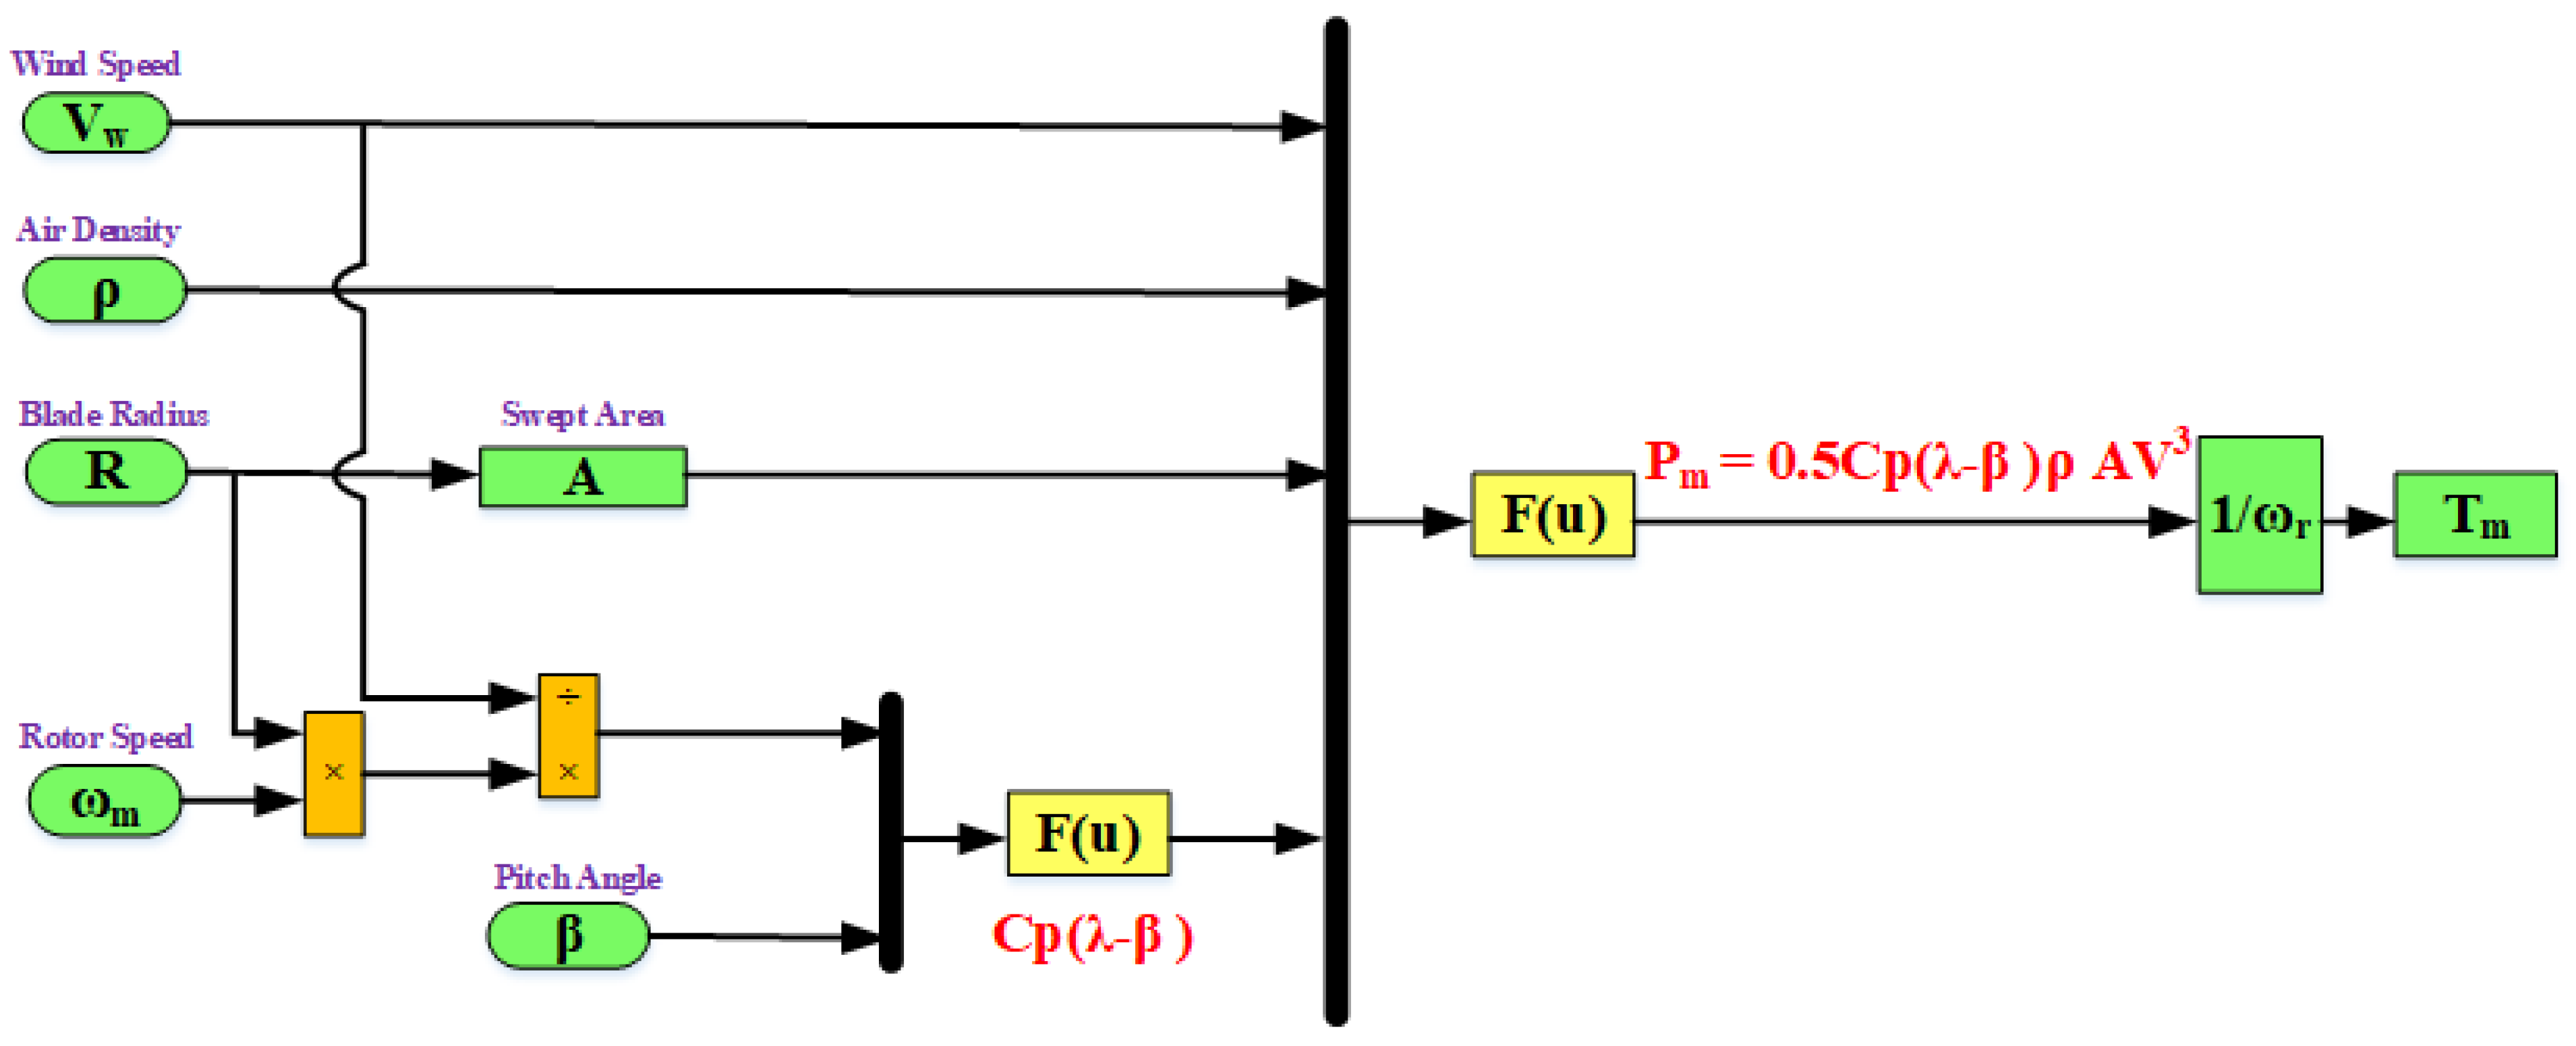
Figure 1. Modeling of a WT.
Processes 10 02723 g001
Figure 2. PAC system.
Processes 10 02723 g002
Figure 3. OTC method for MPPT operation.
Processes 10 02723 g003
Figure 4. PMSWG with its proposed control system.
Processes 10 02723 g004
Figure 5. DFIWG with its proposed control system.
Processes 10 02723 g005
Figure 6. Failure in WE system components.
Processes 10 02723 g006
Figure 7. MRFO strategy.
Processes 10 02723 g007
Figure 8. MRFO flowchart.
Processes 10 02723 g008
Figure 9. Control of crowbar system based on MRFO.
Processes 10 02723 g009
Figure 10. PMSWG system parameter responses as a result of wind speed changes: (a) wind speed profile; (b) tip speed ratio; (c) power coefficient; (d) pitch angle; (e) angular speed; (f) electromagnetic torque; (g) injected active and reactive power to the grid; and (h) DC-link capacitor voltage.
Processes 10 02723 g010aProcesses 10 02723 g010b
Figure 11. PMSG system parameter responses as a result of an 85% voltage dip: (a) system voltage; (b) system currents; (c) injected active power to the grid; (d) injected reactive power to the grid; (e) DC-link voltage; (f) electromagnetic torque; and (g) angular speed.
Processes 10 02723 g011aProcesses 10 02723 g011b
Figure 12. DFIWG system parameter responses as a result of wind speed changes: (a) wind speed profile; (b) tip speed ratio; (c) power coefficient; (d) pitch angle; (e) angular speed; (f) electromagnetic torque; (g) delivered active and reactive powers to the grid; and (h) DC-link voltage.
Processes 10 02723 g012aProcesses 10 02723 g012bProcesses 10 02723 g012c
Figure 13. DFIWG system parameter responses as a result of 85% voltage dip: (a) system voltage; (b) system current; (c) supplied active power to the grid; (d) supplied reactive power to the grid; (e) DC-link voltage; (f) electromagnetic torque; and (g) angular speed.
Processes 10 02723 g013aProcesses 10 02723 g013bProcesses 10 02723 g013c
Table 1. Comparison of the proposed work with previously published works on PMSWG.
Refs.PublisherYearDeveloped ControllersContribution of StudyRemarks
MSCGSCMPPTPACFRT
[13]Elsevier2017Three different control systems (PI, ISMC, and FCS-MPC) were provided, and their effectiveness was evaluated. Outcome: FCS-MPC was the fastest controller, whereas ISMC had the best performance.
[23]Springer2020A PSO, WOA, and GWO-based PI controller was given. GWO performed more smoothly and quickly than the other approaches that were being compared.
[48]IEEE2018The system was improved by figuring out the PI controller optimum gain values using the GWO, GA, and simplex methods. The GWO method was reported to have the best convergence to the minimal value, as well as the finest reaction to faults.
[49]MDPI2021The variable switching frequency issue in the traditional FCS-MPC was fixed by a unique MMPC, which also resulted in decreased THD in stator current and shorter simulation times. A coordinated LVRT was used under faults, and the MMPC operated smoothly and with a quick dynamic response.
[50]MDPI2022Adjusted the machine and GSC to follow the MPPT-established standard for wind speed and to address the chattering issue brought on by the traditional SMC. It was superior to five modern controllers under wind variations.
[51]Springer2022OTC along with an FLC was implemented to decrease installation costs and improve the system’s overall efficiency. FLC was superior to PI under two wind profiles.
[52]Taylor & Francis2022Optimized PI controller with WHO was presented. WHO was superior to the Ziglar–Nicolas method in terms of fast transient response and smooth operation.
[53]SAGE2021In addition to backing choppers, FLC was employed to enhance system performance in the event of three-phase faults. In terms of quick transient reaction and lag-free operation, FLC outperformed PI.
Current studyWith the MRFO-PI control of MSC and BC, the three issues are realized. This is the first study that considers the three issues. The optimized controller has a fast response and smooth operation
Table 2. Comparison of the proposed work with previously published works on DFIWG.
Refs.PublisherYearDeveloped ControllersContribution of StudyRemarks
RSCGSCMPPTPACFRT
[54]IEEE2018Applied feed-forward current control that reduced the transient current in the rotor circuit when a fault quickly occurred.
[55]IET-Wiely2018The overcurrents in the stator and rotor were decreased, and Q was quickly injected during voltage dips, using a combined vector and direct power controller.
[56]IEEE2021In order to mitigate (malfunctioning of sensors and parameter fluctuations) and assure acceptable performance during faults or wind speed conditions, a modified adaptive control architecture was added to the existing conventional vector control and was effective.
[47]Hindawi2020To improve system performance, a nonlinear SMC-based FCL was linked at the POCC. The results showed that SMC performs well with nonlinear dynamics and unanticipated voltage dip levels.
[46]MDPI2020The dynamic adaptive multi-cell FCL topology was coupled at the POCC, which significantly improved system performance and offered an adaptable voltage dip compensation mechanism depending on the level of voltage. Comparison assessment with the single-cell FCL verified the suggested scheme’s efficacy.
[57]Elsevier2021Performance comparisons between the FLC, H infinity (H∞), and PI controllers were conducted, and H∞ was shown to be the best. Mixed controllers, calledthe FL-H∞, and PI- andPID-filter derivative (Fd)-H∞ gave better performance and resulted in decreasing harmonics.
[58]MDPI2022The precision of the three controllers (SM, PI, and advanced backstepping (AB)), which provided the lowest tracking error, was studied and assessed. The ABC’s benefits included target monitoring, current waveform compatibility, quick response times, and robustness.
[59]MDPI2022The MPC system was utilized to maximize the amount of wind energy extracted, even when the wind speed was erratic or the WT was uncertain, and it was more efficient than the PI type.
Current studyWith the MRFO-PI control of RSC and crowbar, the three issues were realized. This is the first study that considers the three vital issues. The optimized controller had a fast response and smooth operation.
Table 3. Top 5 WT manufacturers and technologies.
ManufacturerConceptRotor Diameter (m)Power Range (MW)
Vestas (Denmark)DFIG90–1202.0–2.2
PMSG105–1623.4–9.5
Siemens Gamesa (Spain)SCIG154–1676.0–8.0
DFIG120–1423.5–4.3
PMSG114–1452.1–4.5
Gold wind (China)PMSG-2.0–6.0
GE (USA)DFIG116–1582.0–5.0
PMSG1506.0
Enercon (Germany)WRSG82–1382.0–4.2
Table 4. Top 10 biggest WTs.
ManufacturerPower Rating (MW)Rotor Diameter (m)Drive TrainIEC Class
MHI Vestas9.5164Medium-speed gearedS
Siemens Gamesa8167Direct driveS (IB)
Gold wind6.7154PM direct driveI
Senvion6.15152High-speed gearedS
GE6150Direct driveIB
Ming Yang6140Medium-speed gearedIIB
Doosan5.5140High-speed gearedI
Hitachi5.2126–136Medium-speed gearedS
Nbjj5151High-speed gearedIIB
Adwen5135Low-speed gearedIA
Table 5. Data of converter controller for PMSWG.
TechniqueOptimized MSC Controller GainsGSC Controller Gains
GainValueGainValue
MRFOKp12.8971Kp30.83
Ki1199.7842Ki35
Kp22.8971Kp48
Ki2199.7842Ki4400
--Kp50.83
--Ki55
Table 6. Converter controller data for DFIWG.
TechniqueOptimized RSC Controller GainsGSC Gains
Voltage RegulatorTorque RegulatorVoltage RegulatorsVoltage RegulatorTorque RegulatorVoltage Regulators
MRFOKp = 7.9712Ki = 0.0319Kp = 2.7839Ki = 0.0937Kp = 0.2981Ki = 97.278Kp = 3Ki = 0.02Kp = 8Ki = 500Kp = 1.2Ki = 5
Table 7. Comparison of different hardware systems used for FRT enhancement based on cost.
Hardware Protection DevicePrice (US$)
Classical DVR67,229.99
Low-cost DVR36,778.79
STATCOM200,000.00
Conventional crowbar5.00–75.00
Active crowbar85.00
Table 8. Comparison of FRT strategies of different protection circuits for DFIWG.
Protection SchemeRotor Current Limit (pu)Status of RSC V D C Limit (pu) Remarks
Crowbar circuit with resistances only<2.4Blocked<1.25Useful for symmetrical faults only
Crowbar with DVR<2.0Partly maintained<1.25Useful for all fault types
Crowbar with chopper<2.4Blocked<1.25Useful for all fault types
Crowbar with R–L<2.4Partly maintained<1.25Useful for all fault types
ACB_P<2.0Partly maintained<1.08Useful for all fault types
Table 9. Crowbar resistance parameters.
Resistance1.5 Ω
Rated power12 kW
Maximum temperature150 °C
Thermal time constant4 min
Weight30 kg
Dimensions(750.330.150) mm
Table 10. Simulated WG data.
PMSWG ParametersValueDFIWG ParametersValue
Rated power1.5 MWRated power1.5 MW
Rated stator voltage575 VRated stator voltage575 V
Rated frequency60 HzRated frequency60 Hz
DC-link voltage1150 VDC-link voltage1150 V
Pole pairs 40Pole pairs3
Generator inductance in the d frame0.7 puStator resistance0.023 pu
Generator inductance in the q frame0.7 puRotor leakage inductance0.16 pu
Generator stator resistance0.01 puMutual inductance2.9 pu
A flux of the permanent magnets0.9 puStator leakage inductance0.18 pu
Line inductance0.3 puRotor resistance0.016 pu
Line resistance0.003 puInertia constant0.685 pu
Table 11. All investigated systems’ parameter changes for the scenarios under study.
Studied CasesParameters
DFIWGPMSWG
Wind speed scenario C p change (0.2 0.48)
V D C ripple (±14 V)
λ change (8.7 12.9)
P change (0.3 0.97)
T e change (0.3 0.8)
ω r change (1.03 1.24)
C p change (0.18 0.44)
V D C ripple (±9 V)
λ change (7 16)
P change (0.27 1.03)
T e change (0.28 0.93)
ω r change (0.72 1.19)
Voltage dip scenarioOvervoltage at V D C 1.0783 pu
P change ≈ (0.17 1.28)
T e change ≈ (−0.53 1.63)
ω r change ≈ (1.15 1.22)
Q change ≈ (−0.54 0.61)
I change (−2.27 2.27)
Overvoltage at V D C 1.0584 pu
P change ≈ (0.64 0.965)
T e change ≈ (0.889 0.894)
ω r change ≈ (1.087 1.095)
Q change ≈ (−0.001 0.005)
I change (−1.2  1.2)
Publisher’s Note: MDPI stays neutral with regard to jurisdictional claims in published maps and institutional affiliations.