Article

Interaction between Iron Fluoride and Molten FLiBe

Institute of High Temperature Electrochemistry, Ural Branch of Russian Academy of Sciences, 20 Akademicheskaya Street, 620066 Ekaterinburg, Russia
*
Author to whom correspondence should be addressed.
Processes 2022, 10(12), 2742; https://doi.org/10.3390/pr10122742
Submission received: 22 November 2022 / Revised: 10 December 2022 / Accepted: 13 December 2022 / Published: 19 December 2022

Abstract

:
The equilibrium potentials of iron in a LiF-BeF2-FeF2 melt were measured using the EMF method and were dependent upon the temperature and iron fluoride concentrations. The empirical equations for the isotherms and equilibrium polytherms of the iron fluoride concentration were obtained. The cathode polarization of iron fluoride in the molten mixture of lithium and beryllium fluoride was measured using the current switch off method from the stationary state. It was found that in the studied temperature and concentration ranges of iron fluoride in the LiF-BeF2 electrolyte, the valence state of iron in the melt is mainly +2. According to the experimental values of the equilibrium potentials of the iron electrode in the LiF-BeF2-FeF2 melt, the conditional standard potentials of iron were calculated relative to the fluoride reference electrode in the molten mixture of lithium and beryllium fluoride. The conditional standard values of the Gibbs energy change were calculated at the formation of iron difluoride from the element in the form of dilute solutions, as were the thermodynamic values (enthalpy and entropy) when iron difluoride was mixed with LiF-BeF2.

1. Introduction

Molten mixtures of alkali metal and beryllium fluoride may be successfully used, both as a fuel salt and as a coolant in molten salt nuclear reactors (MSRs) [1,2]. The coolant should be compatible with the construction materials of the heat exchangers and should have good heat exchange and hydrodynamic functions. Such materials are supposed to demonstrate low vapor pressure in a wide range of operating temperatures from 500 to 850 °C and do not interact with the fuel in cases of leakage [3,4,5,6,7]. Special attention should be paid to the corrosion resistance of construction materials in fluoride salts [8,9,10,11]. Research devoted to the search for materials resistant to fluoride melts is currently being studied [12,13,14]. Nickel, chromium, molybdenum, and other materials are chosen as components that enlarge the corrosion resistance of the construction materials in aggressive media. Iron is one of the main metals in the alloy composition. In the present research, we focused on the thermodynamic properties of FeF2 in the (0.66LiF–0.34BeF2) melt.
It is known that chromium, iron, and nickel in the composition of the construction alloys may be subjected to corrosion in FLiBe and FLiNaK salts [15,16,17,18,19,20]. The corrosion rate of these materials depends on the presence of different admixtures, such as oxides and hydroxide ions [21,22], HF [22], and metals fluorides (for instance, CrF3, NiF2, etc.) [21,22,23]. Thermodynamics calculations [24] demonstrate that small amounts of admixtures, such as NiF2, may oxidize both Cr and Fe, whereas FeF2 and CrF3 may cause selective corrosion of Cr [24]. The influence of these admixtures on the corrosion in molten fluorides was observed in papers [21,22,23].
The method of cyclic voltammetry was used in paper [25] to study the redox processes of iron and chromium in the molten mixture of lithium and beryllium fluoride. The authors found that anode and cathode peaks on voltammograms refer to the reactions of metallic chromium oxidation and dilute Cr2+ ions. The reduction of the dilute iron in the FLiBe salts proceeds analogously. The suggested number of electrons participating in the electrode reaction of each ion is equal to 2, which is testified in [26]. However, there is currently a lack of data to calculate thermodynamic data on the formation of iron fluoride in a molten mixture of lithium and beryllium fluoride.

2. Materials and Methods

2.1. Reagents Preparation

To prepare the initial salt mixtures, commercial chemically pure LiF and BeF2 salts (VEKTON Company, Saints Petersburg, Russia) were used. The salts were preliminarily dehydrated, under vacuum, with a continuous increase in temperature; then, were remelted in an argon atmosphere. The 0.66LiF–0.34BeF2 mixtures were prepared by alloying the corresponding portions of the individual salts.

2.2. Equilibrium Potentials Measurement

The equilibrium potentials of iron were measured in a galvanic cell:
Be(s)|(X) × (FeF2) − (1 − X) × (0.66LiF–0.34BeF2)|Fe(s),
where X is a mole fraction concentration of the iron fluoride in the melt.
The equilibrium potentials were measured relative to the dynamic reference electrode. The operation of dynamic electrodes implies a direct deposition in the studied melt on the inert substrate, after which, the electrode during approximately 5–30 s maintains the potential of the newly formed electrode. As a rule, this time is sufficient to conduct all measurements. There are literature data on the application of Li/Li+ and Ca/Ca2+ dynamic electrodes, which studied the processes in chloride melts based on LiCl and CaCl2 [27,28], as well as, on K/K+ and Be/Be2+ dynamic electrodes for melts containing KF and BeF2, respectively [29,30,31].
A schematic of the electrolytic cell used to measure the EMF of the element (1) is illustrated in Figure 1. Metallic electrodes were prepared from the iron of the ARMCO Pure Iron grade and beryllium was obtained by the electrolysis on the molybdenum electrode (1). A dynamic beryllium reference electrode was obtained by the cathode current pulse, under a galvanostatic regime, using an Autolab PGSTAT302N galvanostat–potentiostat and the FRA32M module. Molybdenum electrodes (1) and molybdenum current led (3) to the nickel (9) and iron (11) electrodes and were screened using alundum straws (2). Molybdenum end cup electrodes were screened from the melt with nitride boron tubes (10). The potentials were measured between the beryllium dynamic electrode and metallic iron electrode (11), which were in equilibrium with their ions in the (Fe2+) melt.
The melt temperature was controlled by the platinum–rhodium thermocouple. The desired temperature was maintained to an accuracy of ±1 °C using a thermoregulator Varta TP707 (research and manufacturing complex “VARTA” Ltd., Saints Petersburg, Russia).
The concentration of iron ions in the electrolyte was set by the anode dissolution of the metallic ions from the ARMCO Pure Iron grade (11). The amount of electricity (Q) that passed through was calculated based on the current–time dependence, whilst the reduction in the mass of the iron anode was calculated using the formula M = A∙Q, where A is the electrochemical equivalent at the change in the iron valency from 0 to 2 {A = 1.04 g/(A∙h)}; the anode current efficiency was equal to 100%. The concentration of the iron ions in the melt was determined using the inductively coupled plasma mass spectroscopy (ICP-MS). The compositions of the studied melts are presented in Table 1.
The EMF value was determined according to the straight line region of the time dependence of the potential drop at the cathode current pulse switch off. The galvanic element (1), EMF, was measured at each set concentration of iron ions and at different temperatures. The values of the potential, which remained constant during 15 s and within ±2 mV, were considered as set values of the equilibrium potential. The degree of oxidation of iron ions transferring to the solution was determined according to the inclination angle of the straight line part of the isotherms.

2.3. Mass Spectroscopy with Inductively Coupled Plasma

The concentration of the main components and admixtures in the prepared salt was detected using elemental analysis of the dissolved LiF–BeF2 salt samples. The analysis was performed by the method of mass-spectroscopy with the inductively coupled plasma (ICP) using a NexION 2000 device (PerkinElmer, Waltham, MA, USA).

3. Results and Discussion

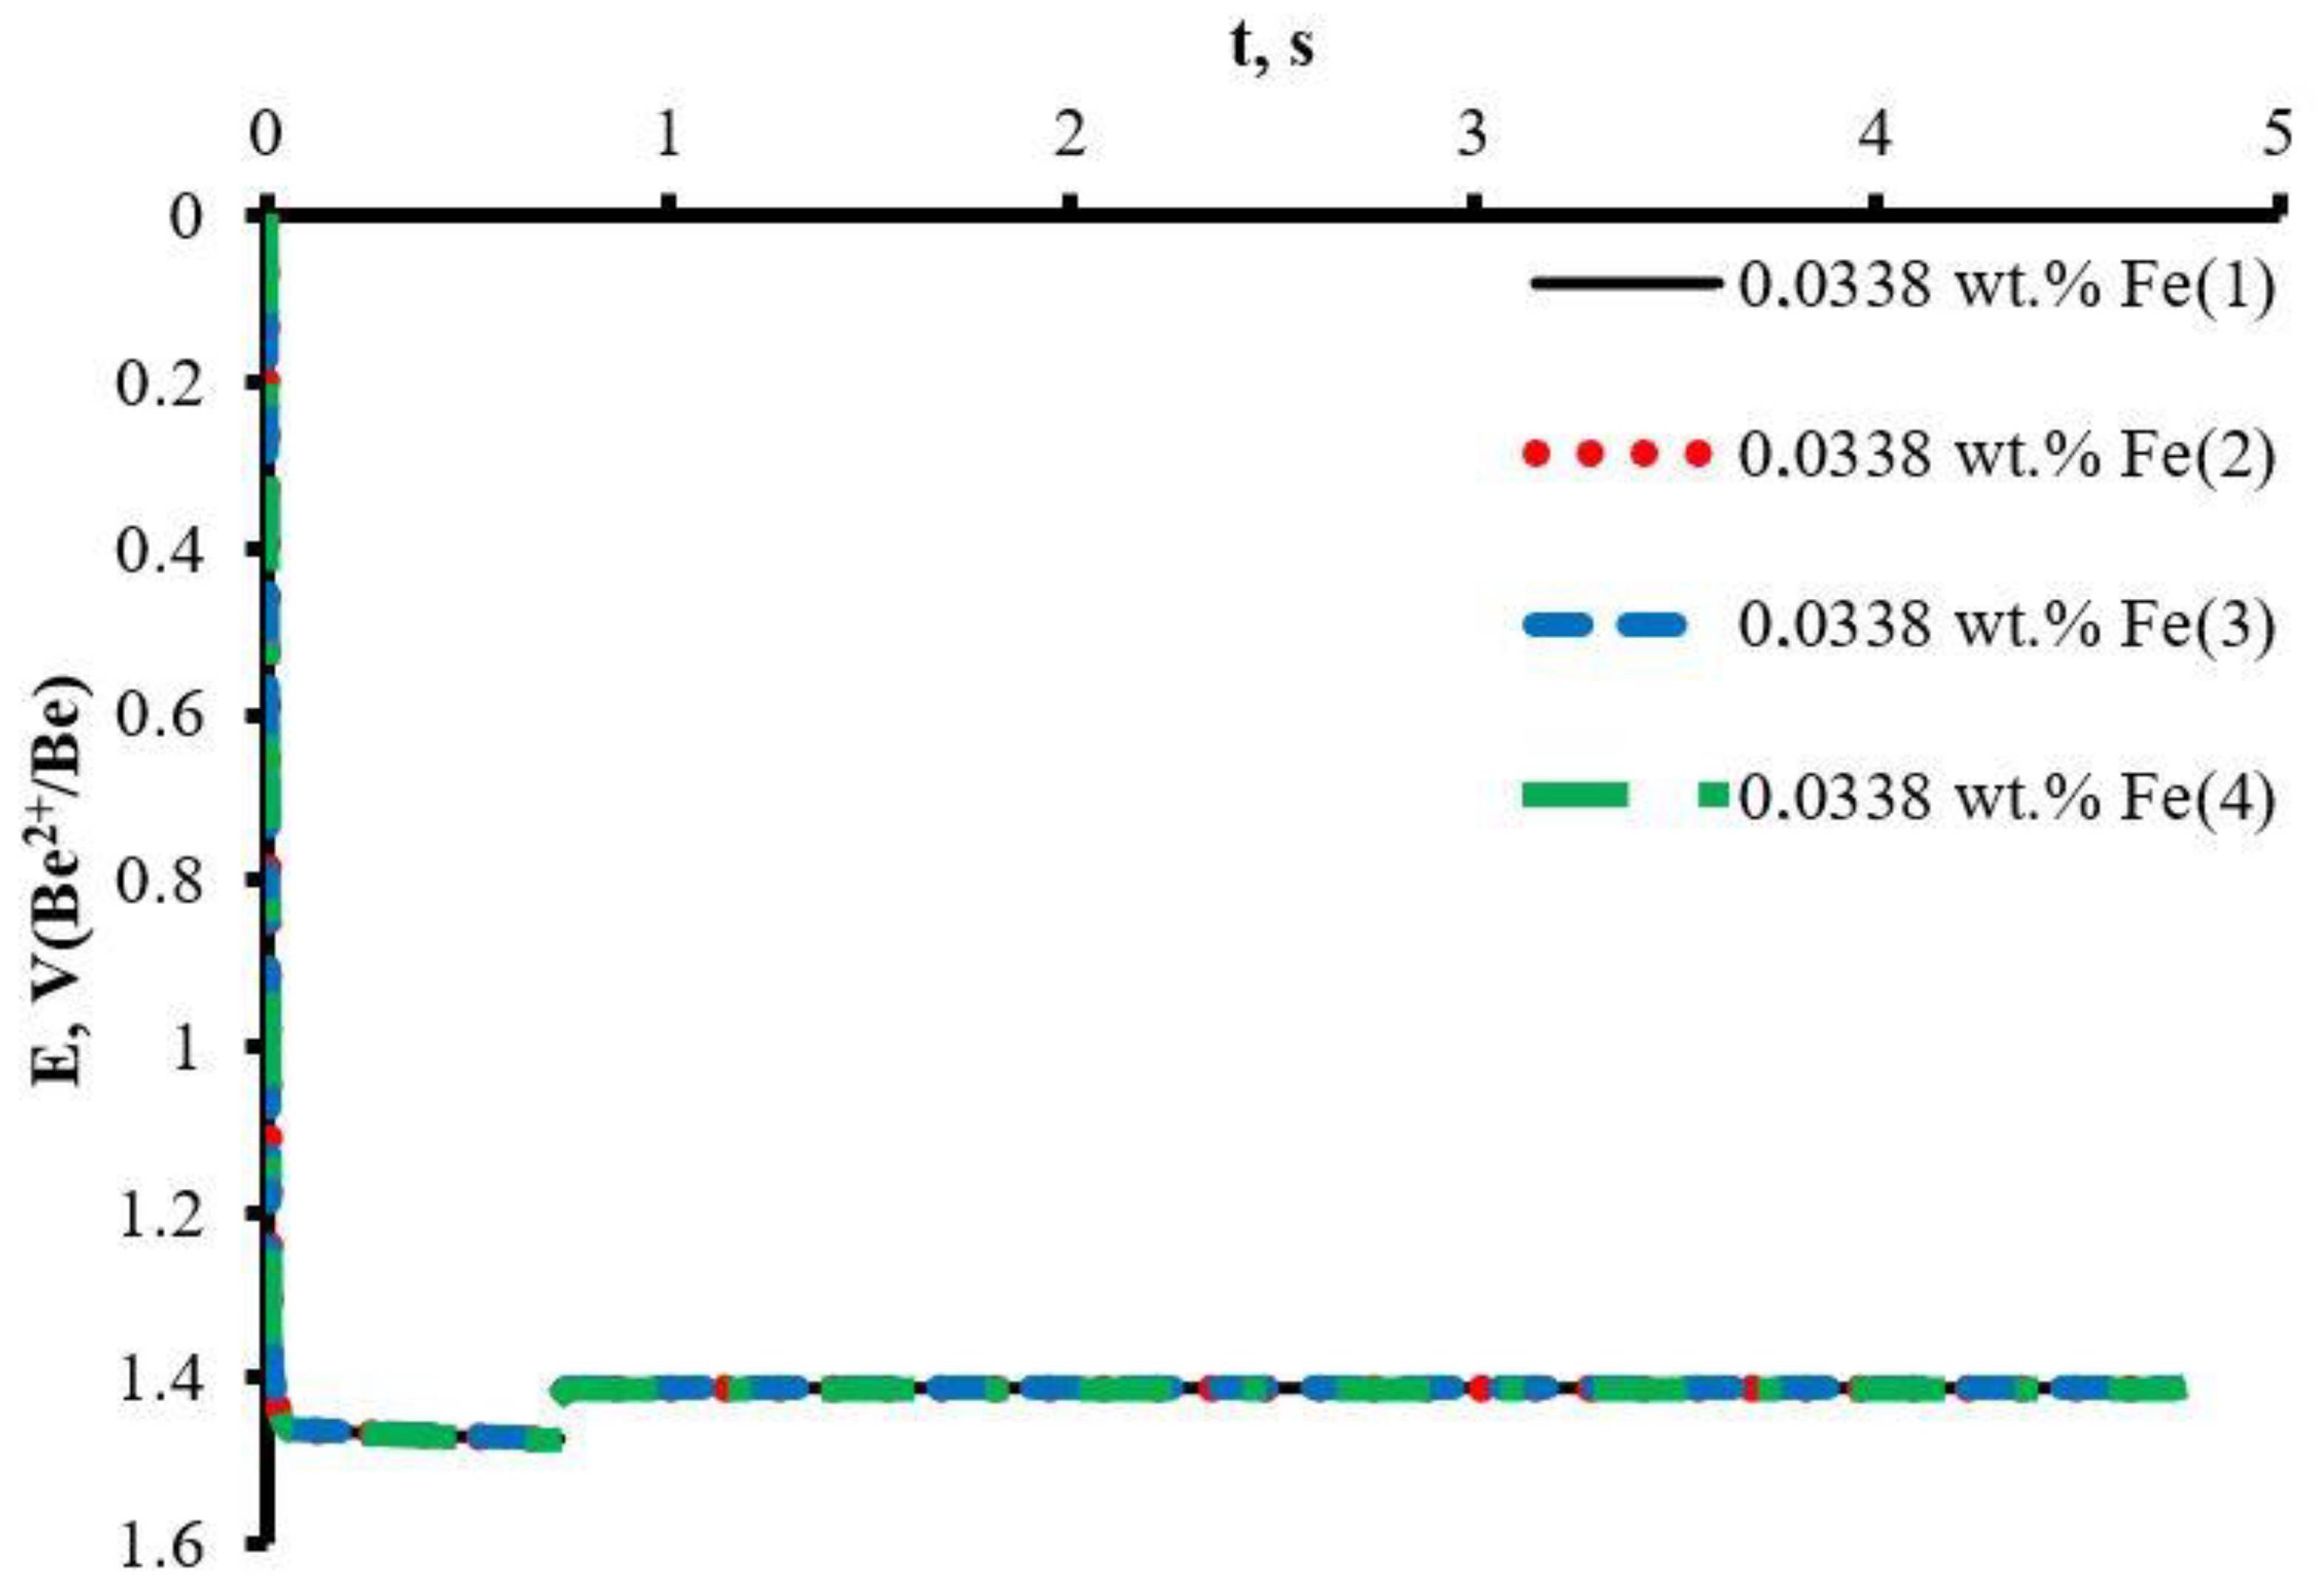
Each EMF measurement of the galvanic cell (1) was performed in four parallel processes with 15 min intervals between the two consequent potential recordings. Figure 2 illustrates the dependences of the measured iron electrode potential relative to the dynamic beryllium reference electrode in the 0.66LiF–0.34BeF2 melt, and with an Fe ion concentration equal to 0.0338 wt.% at 923 K. The dynamic beryllium electrode was formed by the deposition of metallic beryllium on the molybdenum electrode at a cathode current density of 0.1 A/cm2. The region in the time interval between 0 and 0.72 s, for the Fe(1)–Fe(4) curves, in Figure 2 corresponds to the stationary potential of the beryllium electroreduction. Then, at t = 0.73 s the polarization current was switched off. The potential plateau, which corresponds to the difference between the potentials in metallic beryllium (formed on the molybdenum substrate) and an iron electrode immersed into the 0.66LiF–0.34BeF2 melt, illustrates that the Fe ion concentration equals to 0.0338 wt.% for the time dependence of the potential.
As seen from the obtained dependencies illustrated in Figure 2, the EFM of the galvanic element (1), measured relative to the dynamic beryllium reference electrode during 4.5 s, remains constant. This time is sufficient to clearly record the equilibrium potential of the iron electrode, relative to the beryllium electrode in this melt. The values, measured within a temperature range of 923–1023 K and at Fe ion concentrations between 0.0031 and 0.0992 wt.% in the 0.66LiF–0.34BeF2 melt, are presented in Table 2.
The data reported in Table 2 illustrates the high stability of the dynamic beryllium electrode; therefore, it may be used as a reference electrode in the 0.66LiF–0.34BeF2 melt. The arithmetical average of four independent measurements was considered as the value of the equilibrium iron potential for each temperature and concentration.
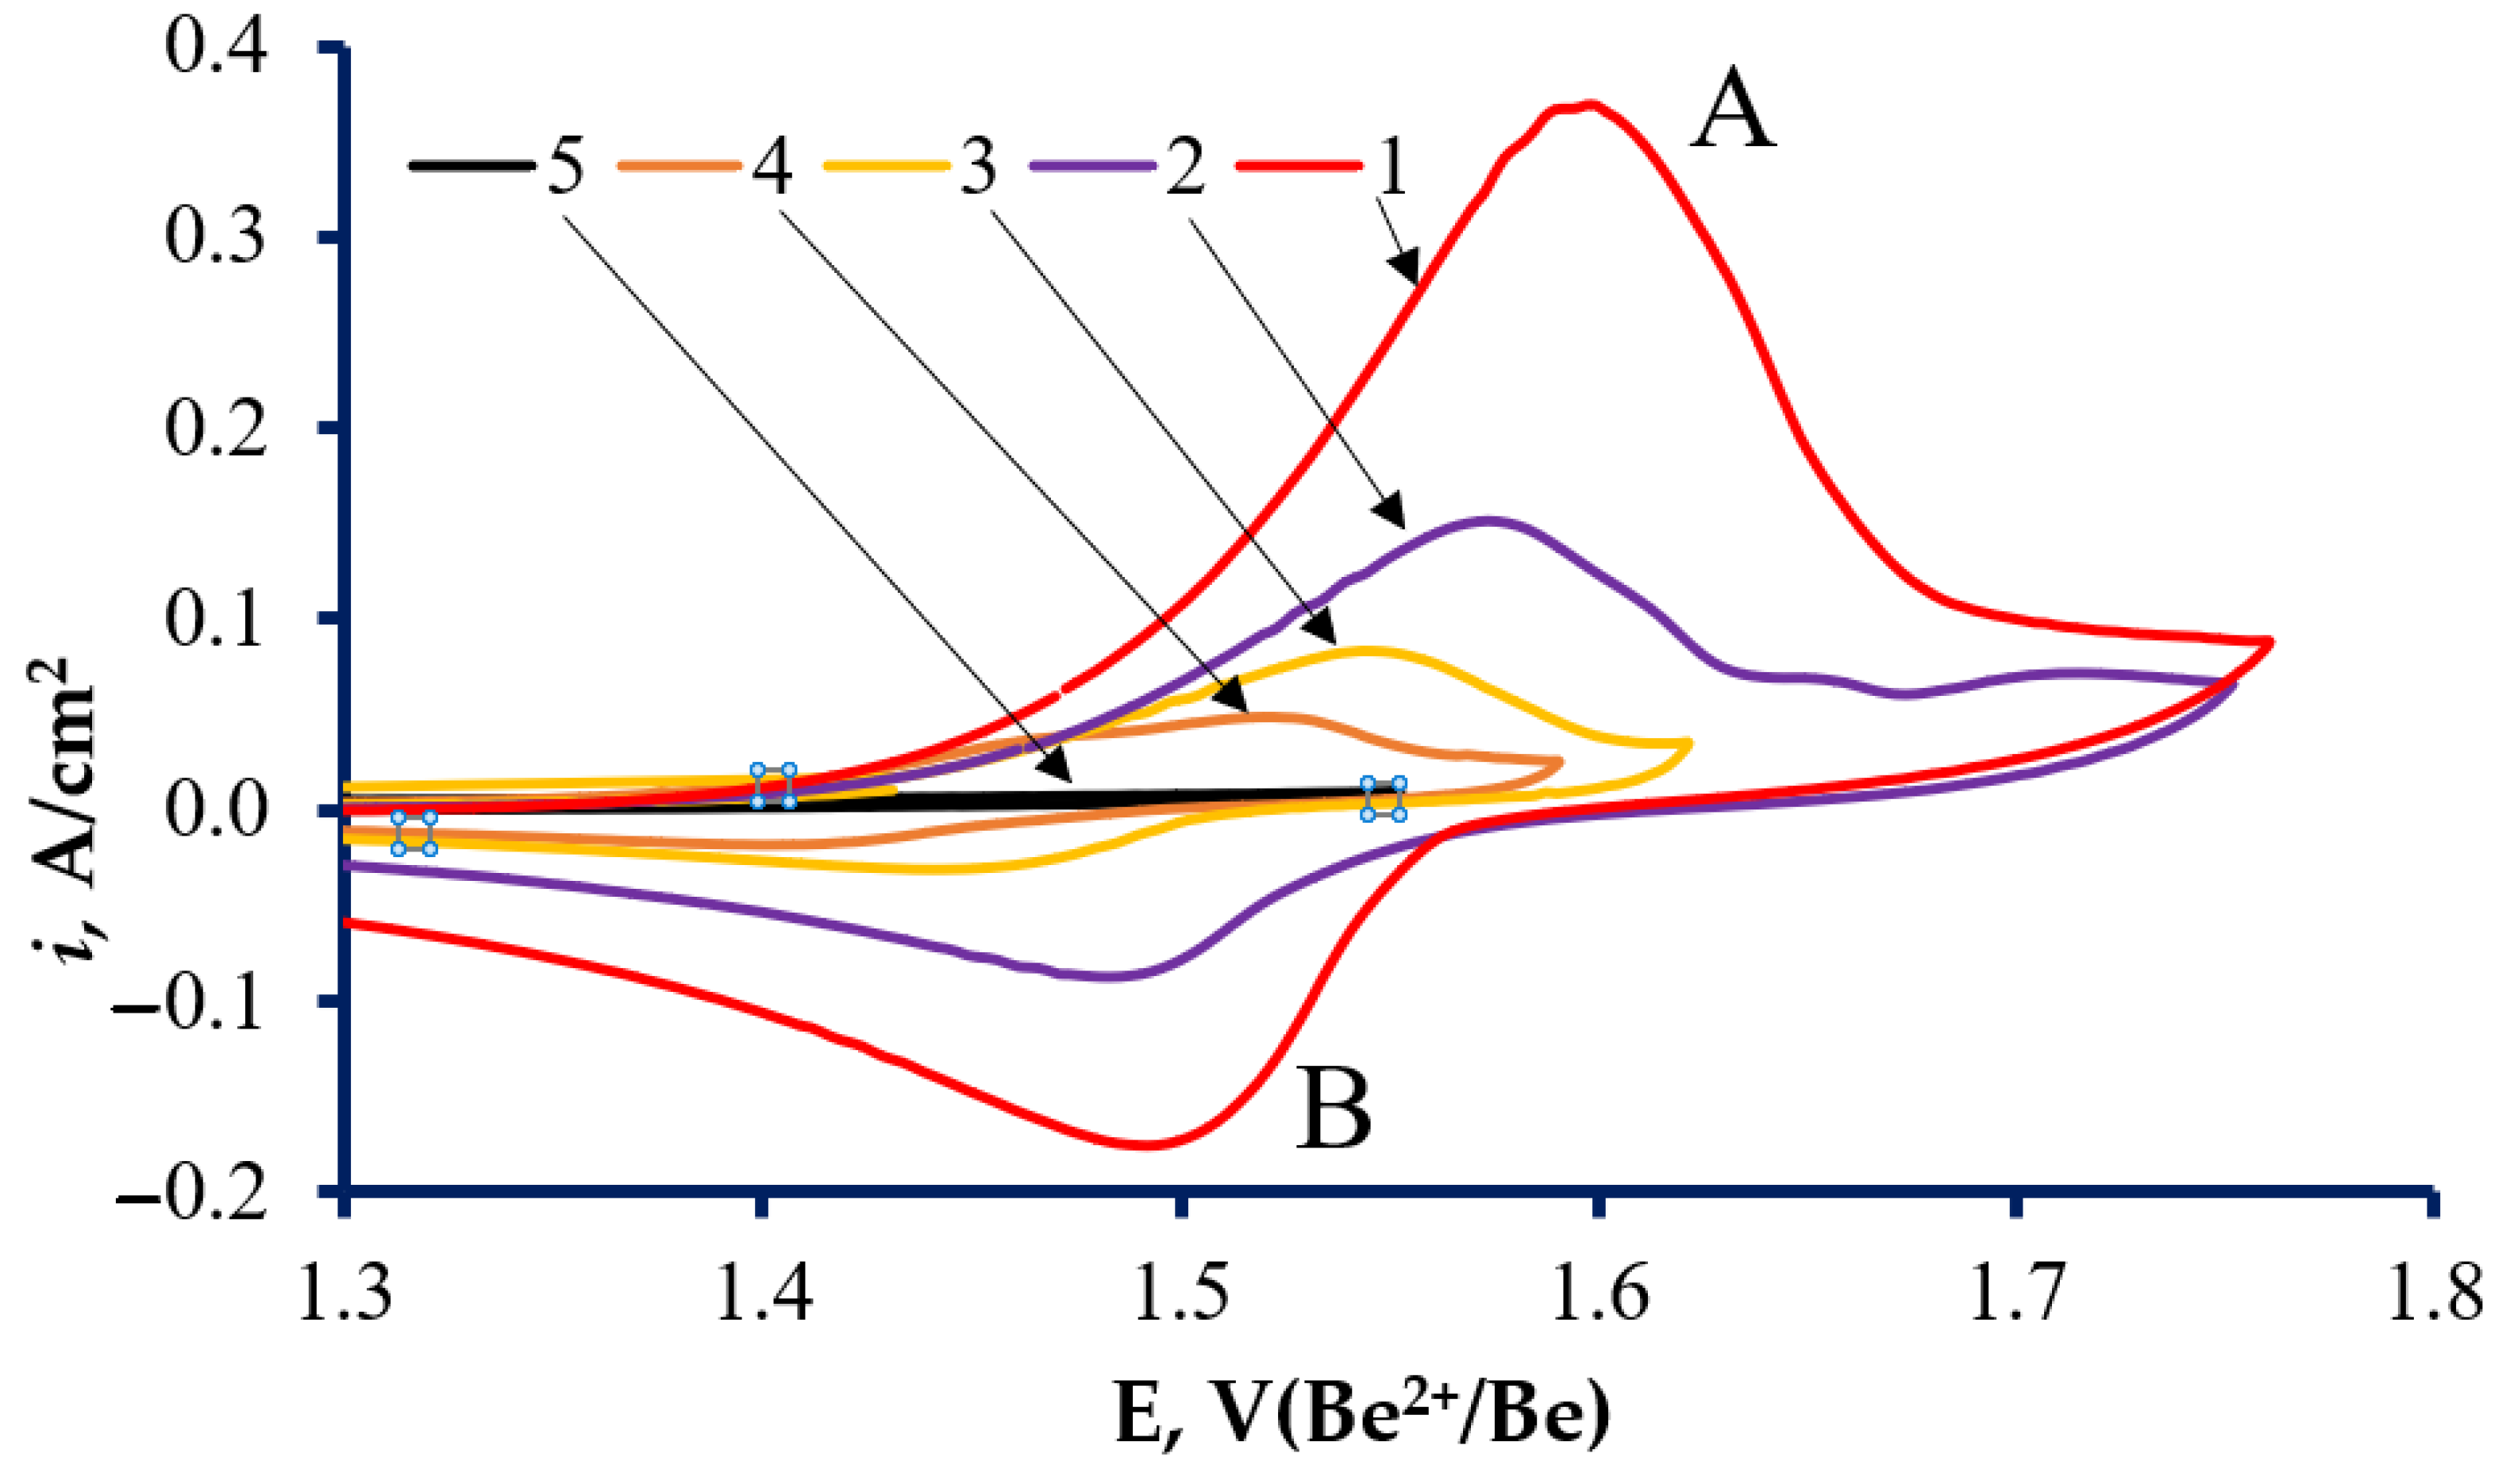
Figure 3 illustrates cyclic voltammograms, recorded on the molybdenum working electrode in the 0.66LiF–0.34BeF2 melt, with different concentrations of iron ions at a temperature of 923 K and a potential sweep rate of 0.1 V/s. The current density increases as the potential shifts to the cathode region, which results in the formation of peak (B) and is associated with a reduction in iron ions in the molybdenum substrate. As the concentration of iron ions increases, the amplitude of peak (B) increases. Peak A, which corresponds to the dissolution of Fe deposited on the molybdenum substrate, was recorded in the anode region. Due to the fact that along the whole studied concentration range, only one peak associated with a reduction in iron ions from the electrolyte was recorded, we may assume that, under such conditions, iron in the melt has only one valence state.
The values of the equilibrium EMF for the galvanic cell (1) were obtained within the concentration range for potential-determining ions of 0.0031–0.0992 wt.% and at temperatures ranging from 923 to 1023 K. To facilitate the analysis of the results, the values of the equilibrium potentials were recalculated relative to the F2/F couple of the galvanic element [32]:
Fe(s)|(X) × (FeF2) − (1 − X) × (0.66LiF–0.34BeF2)|F2 (gas)
The measurement results are presented as graphic dependencies of the iron equilibrium potentials for several concentrations of iron fluoride (curves 3–6), and polytherms of conditional standard iron potentials (curves 1, 2) (Figure 4).
Experimental values for the iron equilibrium potentials change linearly with the temperature over the whole studied interval. An increase in the concentration of iron fluoride results in the shift of potential to the region of positive values. It is shown that the change in the conditional standard potential agrees with previous data [32].
Considering the fact that one form of iron cation prevails in the melt, we chose a standard state to express the concentration dependencies of the cation’s activity and the equilibrium electrode potentials of the galvanic element (2) [33]. Considering the fact that the molar fraction concentration of the fluorine ions is equal to the unity, we may conditionally assume that the fluorine ions’ activity is also equal to the unity, and is independent of the temperature. Numerical expressions of the iron ions activities in the 0.66LiF–0.34BeF2 melt may be calculated via the measured, and are related to the F2/F fluoride electrode iron potentials, which are reversible to their ions:
E F e n + F e 0 = E F e n + F e 0 0 + R T n F l n a F e n + a F e 0  
where   E F e n + F e 0 is the equilibrium potential (2), V,
E F e n + F e 0 0 is the standard electrode potential of the F e n + F e 0 couple, V,
R is the gas constant, 8.31 J/(mol·K),
F is the Faraday number, 96,485 Ku mol −1,
T is the temperature, K,
a F e n + is the activity of the iron cations of any similar valency.
The concentrations of the potential-determining ions in the melt volume are even:
C F e n + = a F e n + / γ F e n + .
where γ F e n + is the activity coefficient of cations of on valency,
C F e n + is the concentration of cations of one valency, mol/cm3.
In the dilute salt melts, where the activity coefficients of the potential-determining ions are constant at the transfer from the activities to the molar fraction concentrations, the dependence of the iron electrode potentials on the iron fluoride in the melt, relative to the fluorine electrode at PF2 = 1 atm, may be expressed as follows:
E F e n + F e 0 = E F e n + F e 0 * + R T n F l n C F e n +  
where   E F e n + F e 0 * is a conditional standard electrode potential of the system F e n + F e 0 .
E F e n + F e 0 * = E F e n + F e 0 0 + R T n F l n γ F e n +  
The equation is true at such molar fraction concentrations of the potential-determining ions, at which, their activity coefficients remain constant.
Based on the polytherms illustrated in Figure 4, for temperatures of 923, 973, and 1023 K, we calculated the equations of the isotherms of the iron equilibrium potentials. Table 3 illustrates the coefficients of the straight line equations E F e n + F e 0 = a + b l n C F e n + , where a = E F e n + F e 0 * ; b = R T n F . According to the inclination of the straight line isotherms motion, the degree of the iron oxidation is constant along the whole studied concentration range.
The average oxidation degree for the iron ions was calculated according to the angular coefficients of the equilibrium isotherms (n) and illustrated that in the studied melt, within the studied interval of concentrations and temperatures, the iron is primarily in a two-valency state.
The cathode polarization of iron, at a temperature of 923 K, was measured in the 0.66LiF–0.34BeF2 melt with iron fluoride concentrations of 0.0338, 0.0651, and 0.0992 wt.%, which were formed in the melt by the anode dissolution of metallic iron.
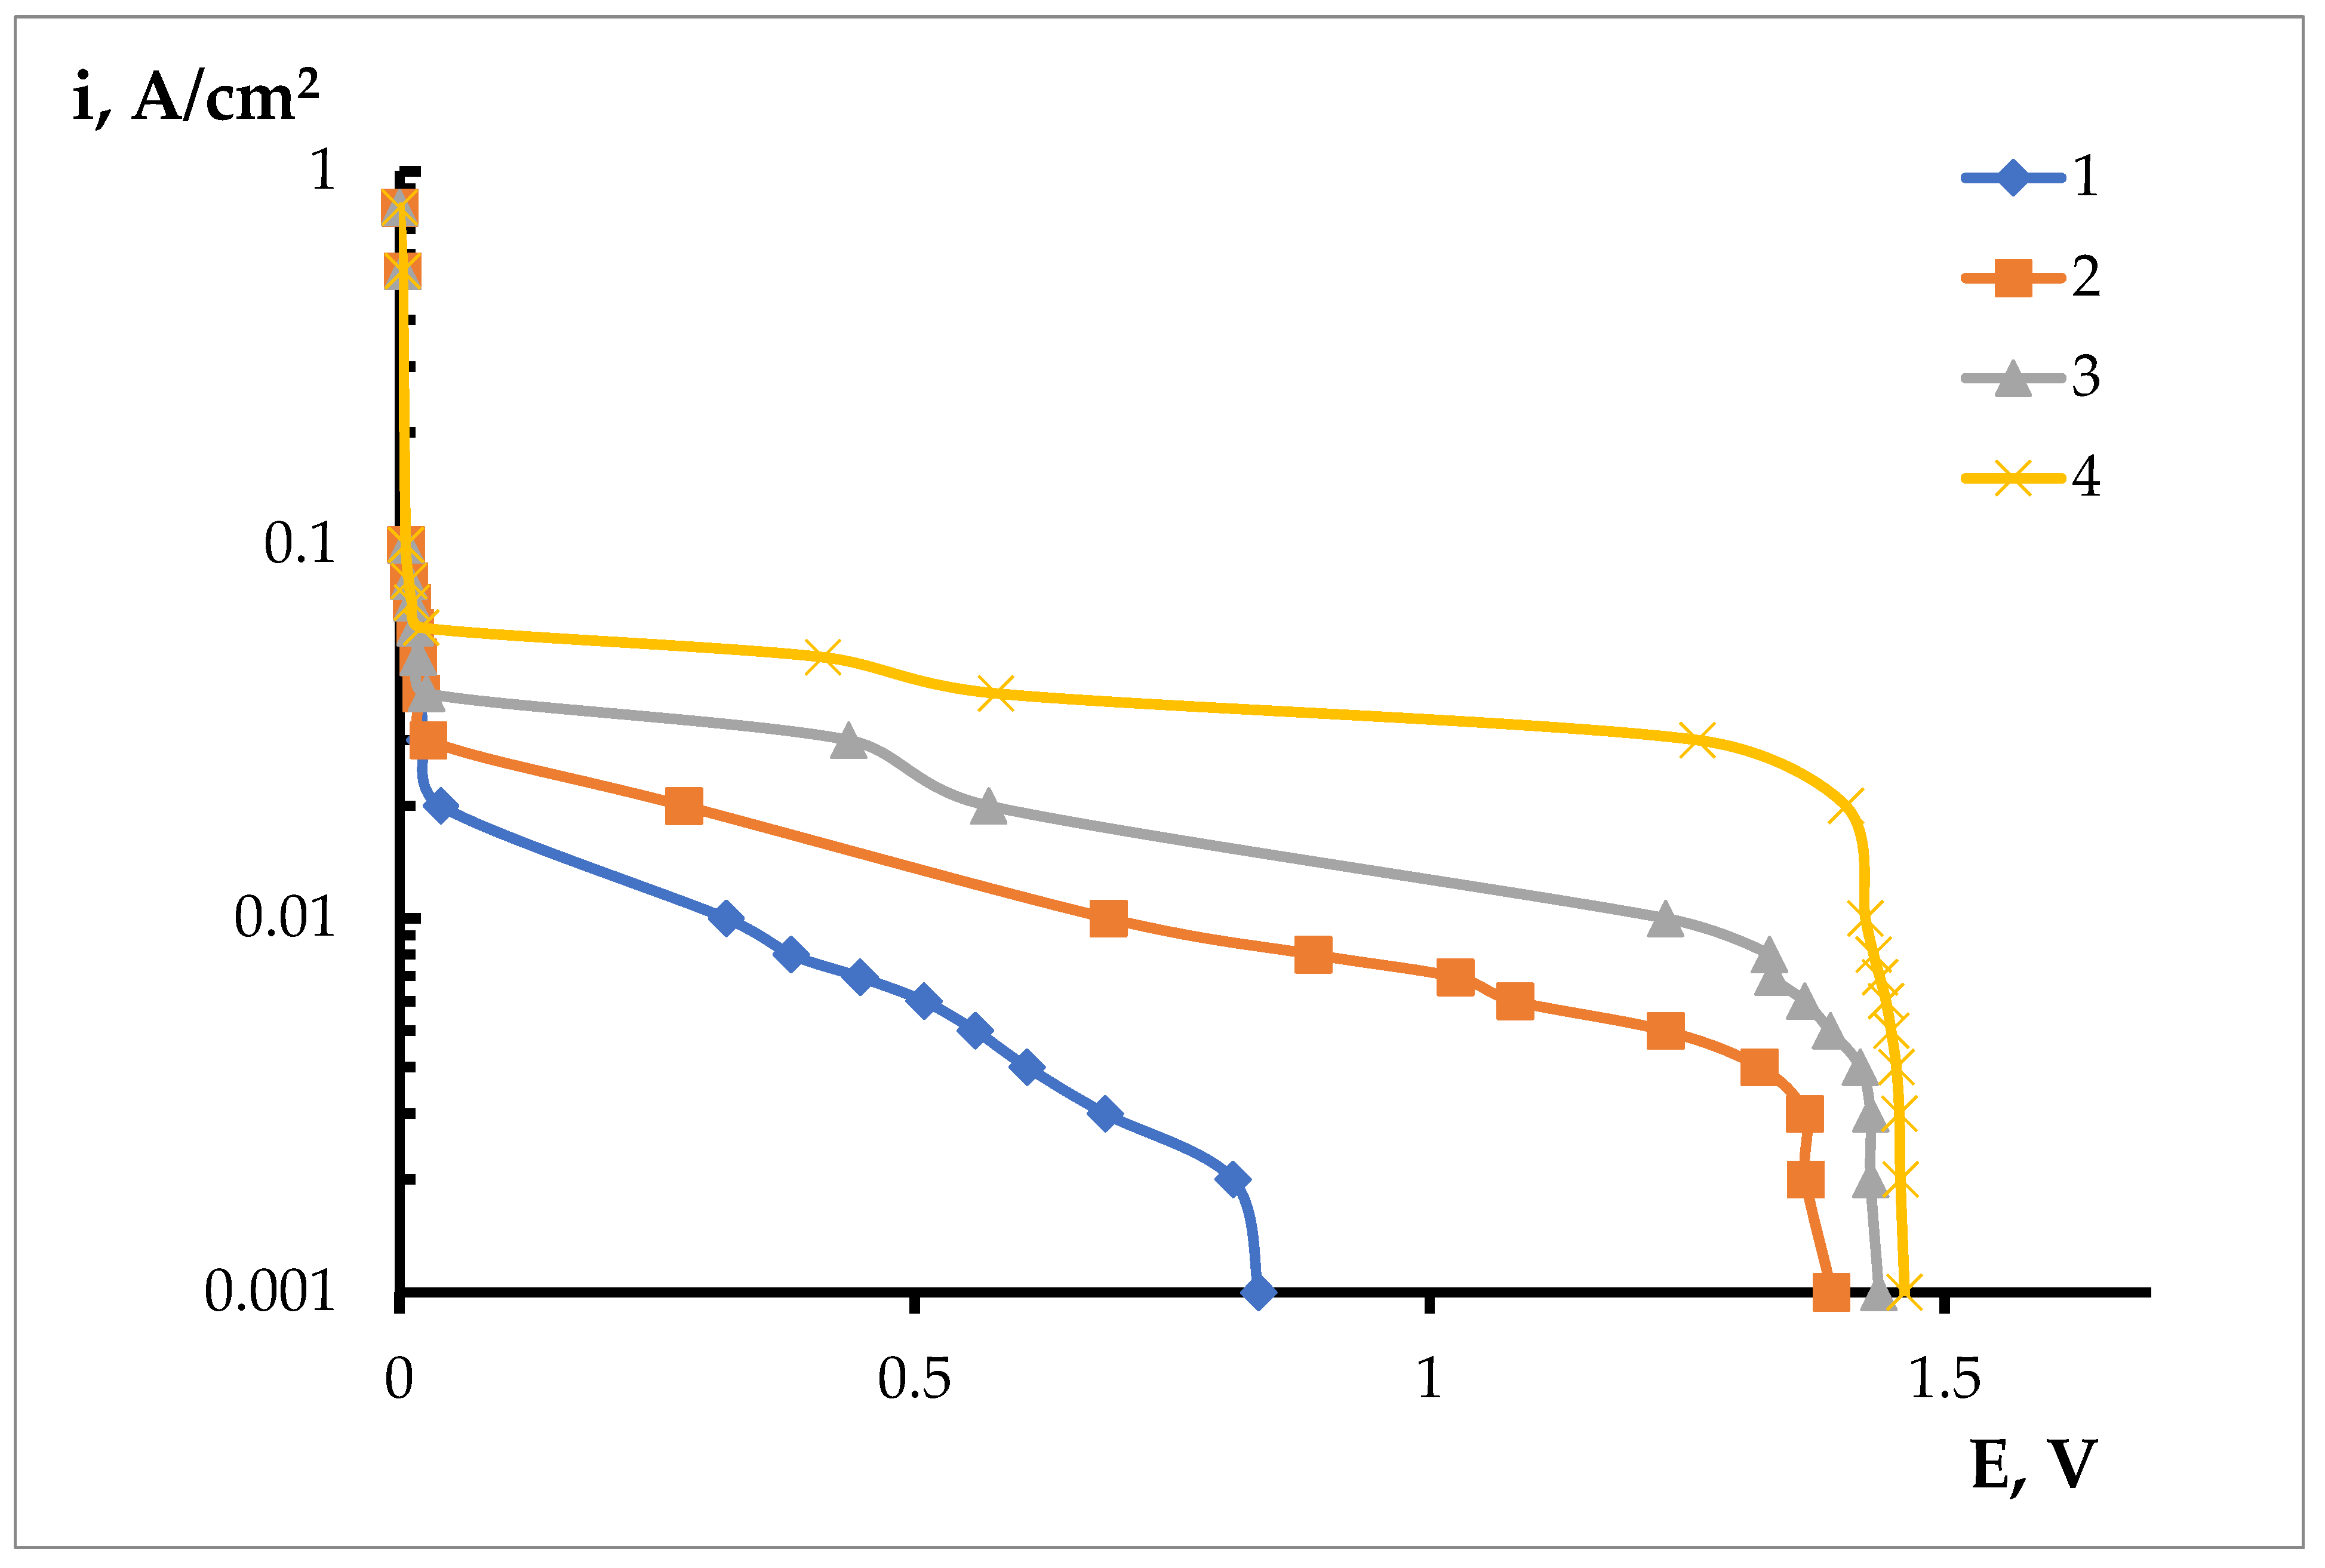
Figure 5 illustrates the measurement results of the iron electrode cathode polarization, at a temperature of 923 K, in the 0.66LiF–0.34BeF2 melt, relative to the dynamic beryllium reference electrode [31].
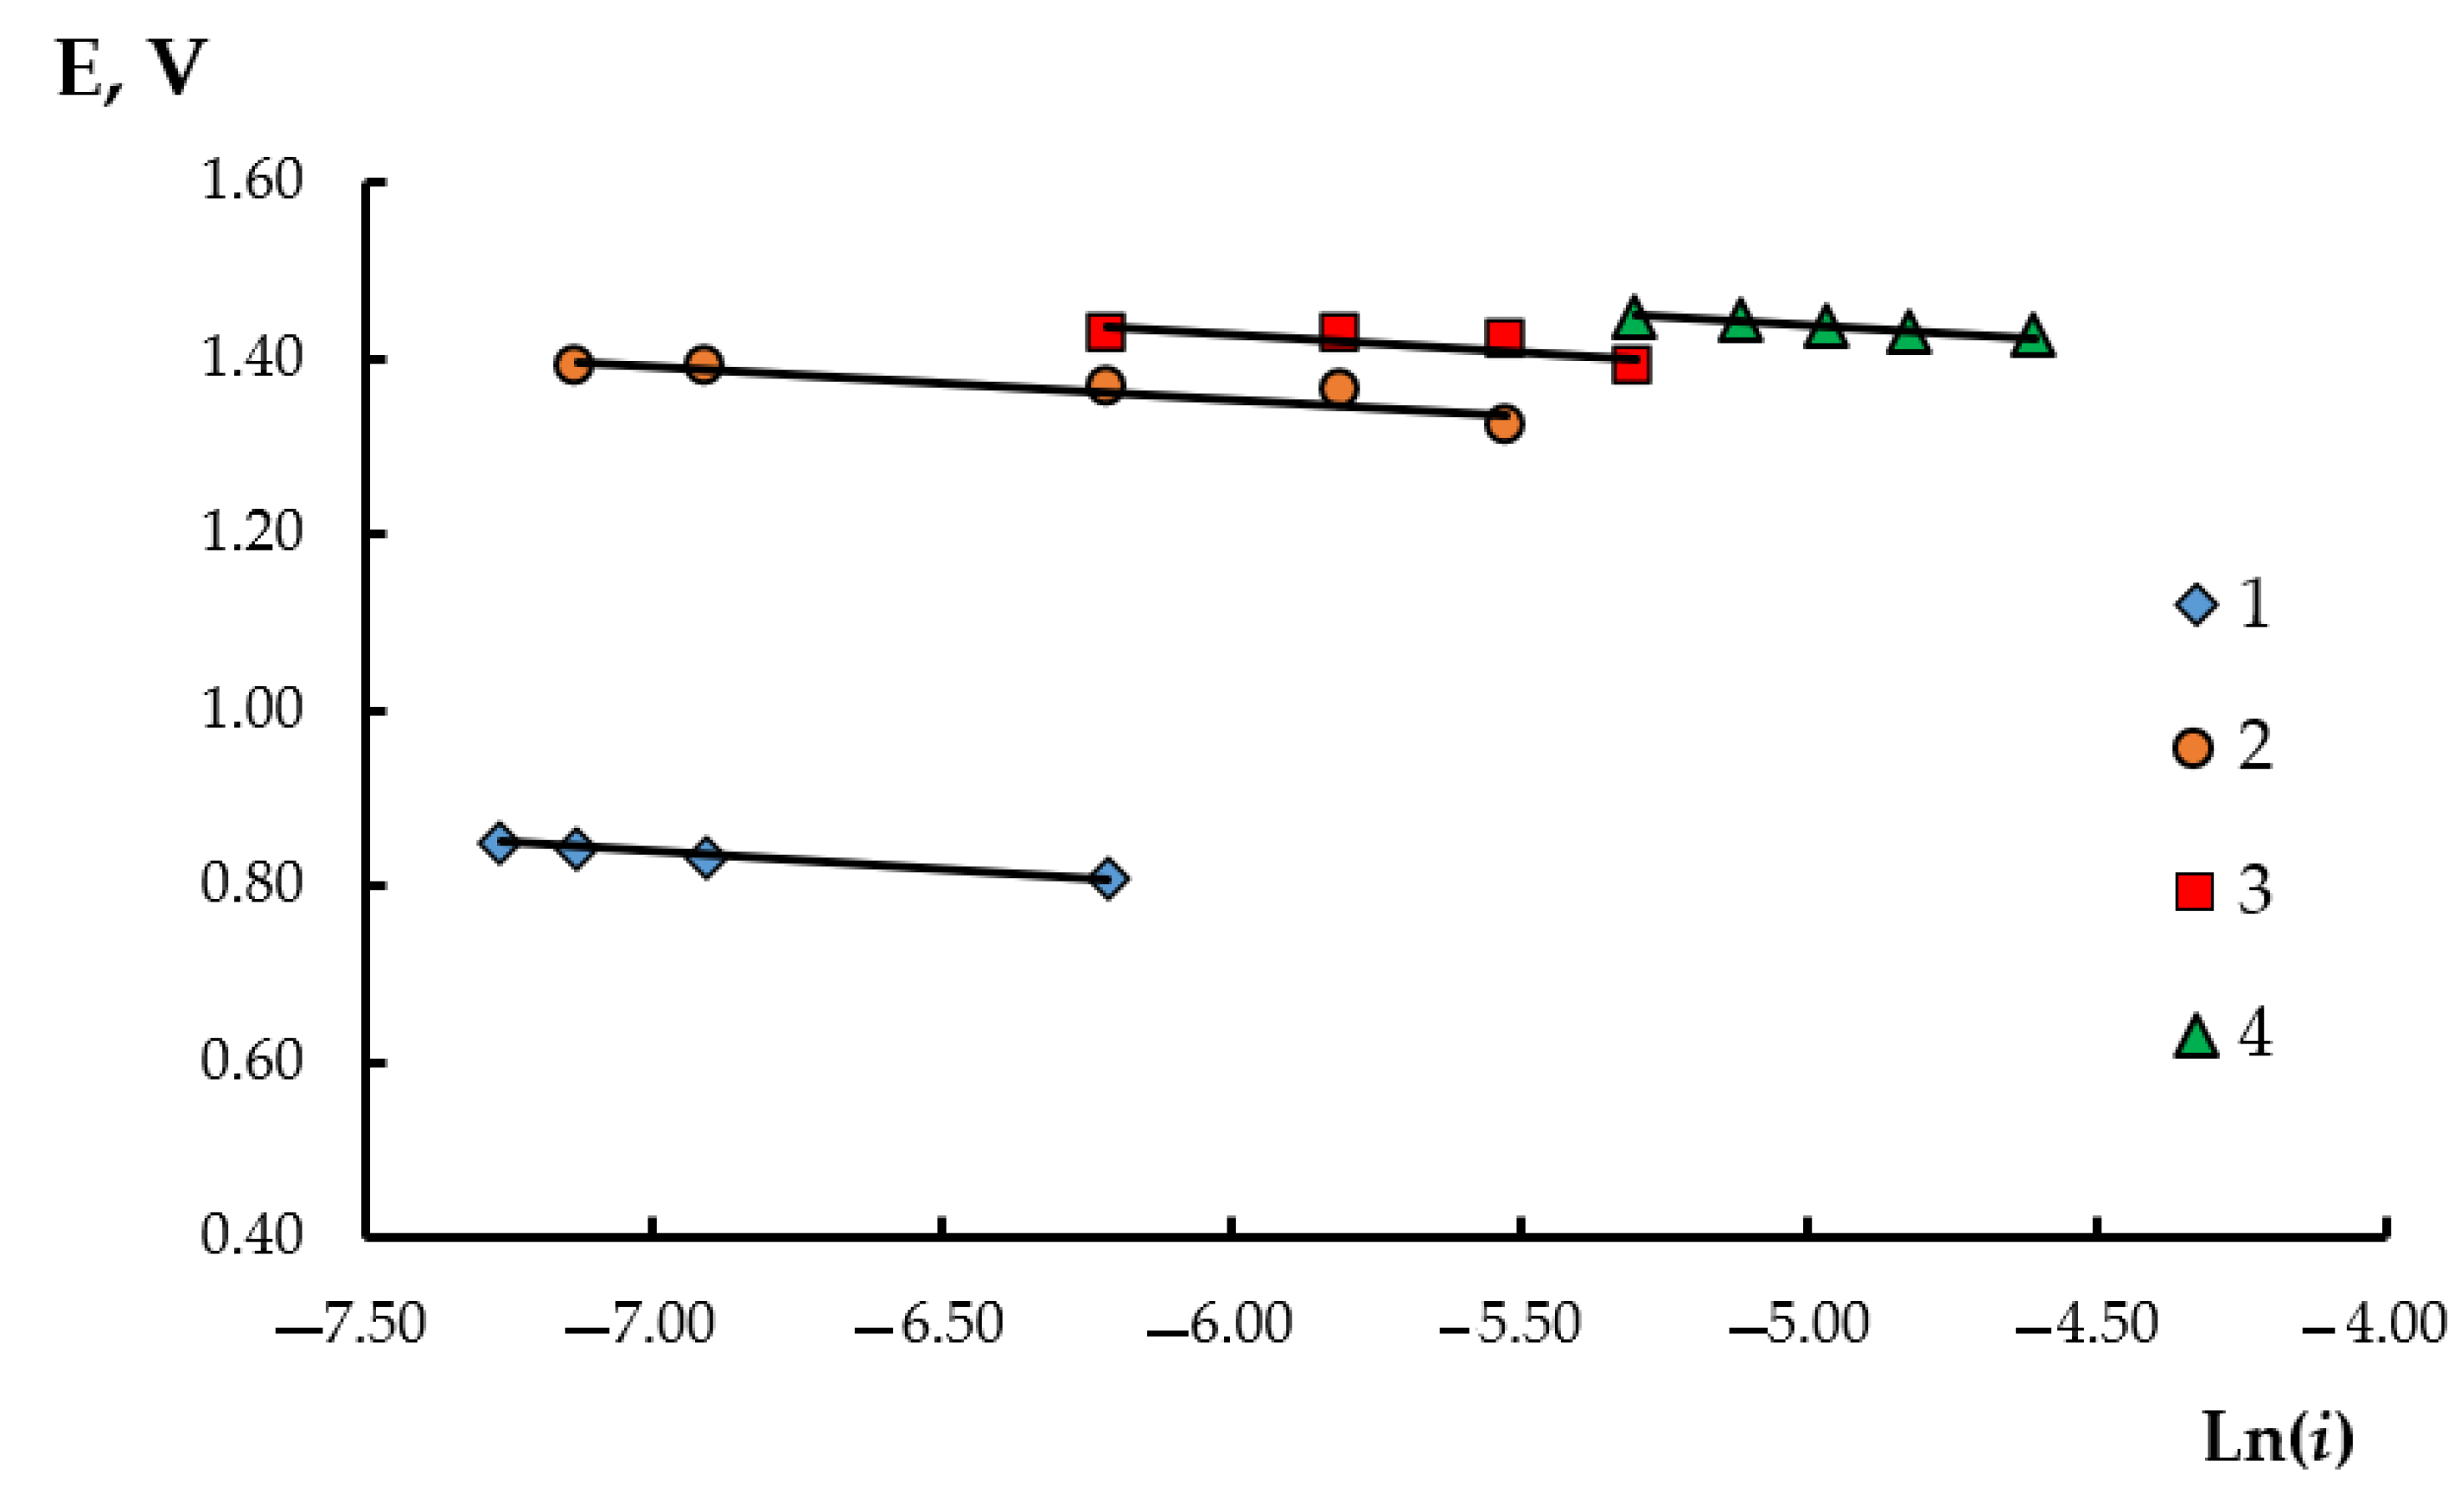
A general tendency of the iron ions cathode polarization was that it changes at the increase in the potential determining component, which is similar to that observed for soluble compounds in fluoride systems. The potential shifts smoothly to the region of negative values at the initial regions of the polarization curves. The potential shifts abruptly to the region of more electronegative values, up to the potential of metallic beryllium extraction, when definite cathode current densities are reached–for instance, 0.002 A/cm2 for an iron concentration of 0.0031 wt.% (Figure 5, curve 1), and 0.02 A/cm2 for an iron concentration of 0.0992 wt.% (Figure 5, curve 4). The process of iron deposition is assumed to proceed under a diffusion regime at small current densities and potential shifts. Under these conditions, for all studied iron concentrations, there was a directly-proportional dependence of the potential on the current density logarithm (Figure 6).
Table 4 illustrates coefficients of the straight line equations: E = a + b l n i , where b =   R T n F . The number of electrons participating during the cathode process for iron fluoride was evaluated according to the angular coefficient: b =   R T n F     (Table 4).
Table 4 illustrates that, within the studied range of iron concentrations in the melt, the number of electrons participating in the electrode reaction is close to two. This testifies that, under such conditions, the electroreduction of the iron ions (II) takes place and is accompanied by the formation of metallic iron on the solid substrate, according to the reaction:
Fe2+ + 2e → Fe0
Due to the fact that iron in the melt has one valency form; then, Equation (5) may be used to determine the conditional standard potential. The temperature dependence of the standard iron potential is illustrated by the following equation:
E* = −3.3866 + 5.0 × 10⁻⁴ × T, R2 = 0.996
where R2 is the determination mechanism.
The EMF of the galvanic element (2) corresponds to the reaction of the iron difluoride formation from simple substances in this melt:
Fe(s) + F2(g) = FeF2(l,melt).
Therefore, a partial change in the Gibbs energy at the formation of iron difluoride, according to reaction (9), is equal to:
ΔG*(l,melt) = −nFE* = −654.200 + 0.100 × T, R2 = 0.99
where ΔG*(l,melt) is the partial change in the Gibbs energy from the iron difluoride formation from simple substances in this melt, kJ/mol, n is the number of electrons, and F is the Faraday constant.
The first member of Equation (10) is the enthalpy of the formation of iron difluoride from the elements in the form of a dilute solution (ΔH = −654.2 kJ/mol), and the standard enthalpy of the reaction (ΔS*) is the co-multiplier before the temperature in the second member of Equation (10). The temperature dependence of the ΔG0FeF2(l) standard value of the Gibbs energy change for the formation of pure iron fluoride (II) in the overcooled state is known from the literature data [33]:
ΔG0FeF2 (l) = −741.377 + 0.145 × T, R2 = 0.99
Using dependencies (10) and (11), we may find the temperature dependence of the conditional standard value of the ΔG*(mix) Gibbs energy change, which occurs at the mixing of liquid iron fluoride (II) and the molten mixture of lithium and beryllium fluoride:
ΔG*(mix) = 87.210 − 0.045 × T, R2 = 0.98
The thermodynamic values of iron fluoride (II) formation in the (0.66LiF–0.34BeF2) melt are provided in Table 5.
The enthalpy of mixing iron fluoride (II) has small positive values; therefore, liquid iron fluoride dissolves in the molten mixture of lithium and beryllium fluoride with heat absorption. A conditional standard value of the enthalpy variation has a positive value at the mixing of the liquid FeF2 with the molten (0.66LiF–0.34BeF2) mixture, whilst the entropy compound has a negative value. The formation of the dilute iron fluoride solutions with the molten mixture of lithium and beryllium fluoride is accompanied by small alterations of the salt system from Raoult’s law.

4. Conclusions

The behavior of iron fluoride in the LiF-BeF2-FeF2 melt was studied between a temperature range of 923 and 1073 K, and at an extensive concentration range of potential-determining ions, using the current switch off method and the equilibrium potentials measurement. Based on the measurement of the Fe equilibrium potentials in the LiF-BeF2 melt, the stability of the dynamic beryllium reference electrode was verified under the experimental conditions. Hence, why a dynamic beryllium electrode was chosen for the potentiometric analysis of the fluoride-beryllate melts. The cathode polarization of iron fluoride was measured in the molten mixture of lithium and beryllium fluoride. It was found that, in the studied temperature range, iron fluoride has mainly a +2 valence state. The conditional standard potentials of iron are determined. The thermodynamic parameters of iron difluoride formation in the LiF-BeF2 melt from elemental substances were calculated. The values of ΔG*(l,melt) were −561.5, −557.1, and −551.5 kJ/mol at temperatures of 923, 953, and 1073 K, respectively. The changes in the partial Gibbs energy when mixing iron difluoride and LiF-BeF2 were calculated. The values of ΔG*(mix) were 46.0, 43.2, and 41.5 kJ/mol at temperatures of 923, 953, and 1073 K, respectively.

Author Contributions

Conceptualization, P.A.A. and Y.P.Z.; methodology, S.P.A. and A.R.M.; software, A.R.M.; validation, P.A.A.; formal analysis, P.A.A.; investigation, S.P.A.; resources, P.A.A.; data curation, A.R.M.; writing—original draft preparation, P.A.A. and S.P.A.; writing—review and editing, P.A.A. and S.P.A.; visualization, S.P.A.; supervision, P.A.A. and Y.P.Z.; project administration, P.A.A. and Y.P.Z.; funding acquisition, Y.P.Z. All authors have read and agreed to the published version of the manuscript.

Funding

This research received no external funding.

Data Availability Statement

Not applicable.

Acknowledgments

The studies were performed using the equipment of the Shared Access Centre «Composition of Compounds» IHTE UB RAS.

Conflicts of Interest

The authors declare no conflict of interest.

References

  1. Beneš, O.; Konings, R.J.M. Thermodynamic properties and phase diagrams of fluoride salts for nuclear applications. J. Fluor. Chem. 2009, 130, 22–29. [Google Scholar] [CrossRef]
  2. Zaikov, Y.P.; Khokhlov, V.A.; Afonichkin, V.K.; Volkov, S.V.; Omelchuk, A.A. Nekotoriye problemy khimii zhidkosolevykh yadernykh reactorov novogo pokoleniya (Some problems of chemistry of new generation molten salt reactors). In Proceedings of the XVI Russian Conference on Physical Chemistry and Electrochemistry of Molten and Solid Electrolytes (with International Participation), Ekaterinburg, Russia, 16–20 September 2013; pp. 87–88. [Google Scholar]
  3. Bromley, B.P. Initial Exploratory Reactor Physics Assessment of Nonconventional Fuel Concepts for Very Compact Small Modular Reactors Using Hydroxides as Coolants and/or Moderators. Nucl. Technol. 2022, 208, 160–191. [Google Scholar] [CrossRef]
  4. Ignatiev, V.V.; Abalin, S.S.; Gurov, M.Y.; Zakirov, R.Y.; Konakov, S.A.; Merzlyakov, A.V.; Surenkov, A.I.; Feynberg, O.S. Reactor with Circulating Fuel Based on Molten Metal Fluorides for Np, Am, Cm Incineration. Sov. At. Energy 2021, 129, 122–126. [Google Scholar] [CrossRef]
  5. Ignat’ev, V.V.; Subbotin, S.A.; Feinberg, O.S. Accident Resistance of Molten-Salt Nuclear Reactor. Sov. At. Energy 2018, 124, 371–378. [Google Scholar] [CrossRef]
  6. Lizin, A.A.; Ponomarev, L.I.; Tomilin, S.V. Vybor nesyshey soli dly zhidkosolevogo reactora s bystrym spectrum neitronov (Selection of the bearing salt for molten salt reactor with fast neutron spectra. Vopr. At. Nauk. Tech. Seriya Materialoved. Noviye Mater. 2016, 3, 80–99. [Google Scholar]
  7. Consiglio, A.N.; Carotti, F.; Liu, E.; Williams, H.; Scarlat, R.O. Design and operation of a molten salt electrochemical cell. MethodsX 2022, 9, 101626. [Google Scholar] [CrossRef]
  8. Ponomarev, L.I.; Seregin, M.B.; Parshin, A.P.; Mel’nikov, S.A.; Mikhalichenko, A.A.L.; Zagorets, L.P.; Manuilov, R.N.; Rzheutskii, A.A. Fuel Salt for the Molten-Salt Reactor. Energy 2013, 115, 5–10. [Google Scholar] [CrossRef]
  9. Nikitina, E.V.; Karfidov, E.A.; Zaikov, Y.P. Corrosion of advanced metal materials in fluoride melts for liquid salt reactors. Russ. Met. 2021, 1, 21–45. [Google Scholar]
  10. Surenkov, A.I.; Ignat’ev, V.V.; Abalin, S.S.; Konakov, S.A.; Uglov, V.S. Corrosion Resistance and Mechanical Stability of Nickel Alloys in Molten-Salt Nuclear Reactors. Energy 2018, 124, 43–49. [Google Scholar] [CrossRef]
  11. Sandhi, K.K.; Szpunar, J. Analysis of Corrosion of Hastelloy-N, Alloy X750, SS316 and SS304 in Molten Salt High-Temperature Environment. Energies 2021, 14, 543. [Google Scholar] [CrossRef]
  12. Karfidov, E.A.; Nikitina, E.V. Corrosion Electrochemical Behavior of Nickel in Molten Lithium and Potassium Chlorides Containing Additives of Substances of Various Chemical Origins. Russ. Met. 2022, 978–983. [Google Scholar] [CrossRef]
  13. Keiser, J.R.; Singh, P.M.; Lance, M.J.; Meyer, H.M.; Myhre, K.G.; Lowe, T.M.; Sulejmanovic, D.; Cakmak, E.; Cox, V.A.; Hawkins, C.S.; et al. Interaction of beryllium with 316H stainless steel in molten Li2BeF4 (FLiBe). J. Nucl. Mater. 2022, 565, 153698. [Google Scholar] [CrossRef]
  14. Raiman, S.S.; Kurley, J.M.; Sulejmanovic, D.; Willoughby, A.; Nelson, S.; Mao, K.; Parish, C.M.; Greenwood, M.S.; Pint, B.A. Corrosion of 316H stainless steel in flowing FLiNaK salt. J. Nucl. Mater. 2022, 561, 153551. [Google Scholar] [CrossRef]
  15. Olson, L.C.; Ambrosek, J.; Sridharan, K.; Anderson, M.H.; Allen, A.R. Materials corrosion in molten LiF–NaF–KF salt. J. Fluor. Chem. 2009, 130, 67–73. [Google Scholar] [CrossRef]
  16. Zhang, G.; Kelleher, B.; He, H.; Cao, G.; Anderson, A.; Allen, T.; Sridharan, K. High-temperature corrosion of UNS N10003 in molten Li2BeF4 (FLiBe) salt. Corrosion 2015, 71, 1257–1266. [Google Scholar] [CrossRef]
  17. Karfidov, E.A.; Zaikov, Y.P.; Nikitina, E.V.; Seliverstov, K.E.; Dub, A.V. High-Temperature Passivation of the Surface of Candidate Materials for MSR by Adding Oxygen Ions to FLiNaK Salt. Materials 2022, 15, 5174. [Google Scholar] [CrossRef]
  18. Wang, Y.; Liu, H.; Yu, G.; Hou, J.; Zeng, C. Electrochemical study of the corrosion of a Ni-based alloy GH3535 in molten (Li, Na, K) F at 700 °C. J. Fluor. Chem. 2015, 178, 14–22. [Google Scholar] [CrossRef]
  19. Kondo, M.; Nagasaka, T.; Xu, Q.; Muroga, T.; Sagara, A.; Noda, N.; Ninomiya, D.; Nagura, M.; Suzuki, A.; Terai, T.; et al. Corrosion characteristics of reduced activation ferritic steel, JLF-1 (8.92Cr–2W) in molten salts Flibe and Flinak. Fusion Eng. Des. 2009, 84, 1081–1085. [Google Scholar] [CrossRef] [Green Version]
  20. Koger, J.W. Chromium Depletion and Void Formation in Fe—Ni—Cr Alloys during Molten Salt Corrosion and Related Processes. In Book Advances in Corrosion Science and Technology; Fontana, M.G., Staehle, R.W., Eds.; Springer: Boston, MA, USA, 1974; Volume 4, pp. 245–318. [Google Scholar]
  21. Wang, Y.L.; Wang, Q.; Liu, H.J.; Zeng, C.L. Effects of the oxidants H2O and CrF3 on the corrosion of pure metals in molten (Li, Na, K) F. Corros. Sci 2016, 103, 268–282. [Google Scholar] [CrossRef]
  22. Kondo, M.; Nagasaka, T.; Tsisar, V.; Sagara, A.; Muroga, T.; Watanabe, T.; Oshima, T.; Yokoyama, Y.; Miyamoto, H.; Nakamura, E.; et al. Corrosion of reduced activation ferritic martensitic steel JLF-1 in purified Flinak at static and flowing conditions. Fusion Eng. Des. 2010, 85, 1430–1436. [Google Scholar] [CrossRef]
  23. Pavlik, V.; Kontrik, M.; Boča, M. Corrosion behavior of Incoloy 800H/HT in the fluoride molten salt FLiNaK + MF x (MF x = CrF3, FeF2, FeF3 and NiF2). N. J. Chem. 2015, 39, 9841–9847. [Google Scholar] [CrossRef]
  24. Guo, S.; Shay, N.; Wang, Y.; Zhou, W.; Zhang, J. Measurement of europium (III)/europium (II) couple in fluoride molten salt for redox control in a molten salt reactor concept. J. Nucl. Mater. 2017, 496, 197–206. [Google Scholar] [CrossRef]
  25. Doniger, W.H.; Sridharan, K. Application of voltammetry for quantitative analysis of chromium in molten 2LiF-BeF2 (FLiBe) salt. J. Electroanal. Chem. 2019, 838, 73–81. [Google Scholar] [CrossRef]
  26. Blood, C.M. Solubility and Stability of Structural Metal Difluorides in Molten Fluoride Mixtures; Oak Ridge National Laboratory: Oak Ridge, TN, USA, 1964; No. ORNL-TM-760.
  27. Cho, S.K.; Lee, S.-K.; Choi, E.-Y.; Hur, J.-M. The evaluation of polarized dynamic reference electrode (p-Dyn RE) for LiCl-1 wt% Li2O molten salt at 650 °C: Li+/Li p-Dyn RE versus O2/O2- p-Dyn RE. J. Electrochem. Soc. 2016, 163, E308–E312. [Google Scholar] [CrossRef]
  28. Suzdaltsev, A.V.; Khramov, A.P.; Zaikov, Y.P.; Pankratov, A.A.; Vovkotrub, E.G.; Antonov, B.D. Reduction of the solid A12O3 at the electrolysis of the CaC12 based melt. J. Electrochem. Soc. 2017, 164, H5183–H5188. [Google Scholar] [CrossRef] [Green Version]
  29. Duran-Klie, G.; Rodrigues, D.; Delpech, S. Dynamic Reference Electrode Development for Redox Potential Measurements in Fluoride Molten Salt at High Temperature. Electrochim. Acta 2016, 195, 19. [Google Scholar] [CrossRef] [Green Version]
  30. Keiser, J.R.; Devan, J.H.; Manning, D.L. The Corrosion Resistance of Type 316 Stainless Steel to Li2BeF4; Oak Ridge National Laboratory: Oak Ridge, TN, USA, 1977; ORNL/TM-5782.
  31. Afonichkin, V.K.; Bovet, A.L.; Ignatiev, V.V.; Panov, A.V.; Subbotin, V.G.; Surenkov, A.I.; Toropov, A.D.; Zherebtsov, A.L. Dynamic reference electrode for investigation of fluoride melts containing beryllium difluoride. J. Fluor. Chem. 2009, 130, 83–88. [Google Scholar] [CrossRef]
  32. Baes, C.F., Jr. The Chemistry and Thermodynamics of Molten-Salt-Reactor Fluoride Solutions; Oak Ridge National Laboratory: Oak Ridge, TN, USA, 1966.
  33. Wicks, C.E.; Block, F. Thermodynamic Properties of 65 Elements: Their Oxides, Halides, Carbides and Nitrides; Bureau of Mines: Pittsburgh, AR, USA, 1961; p. 239.
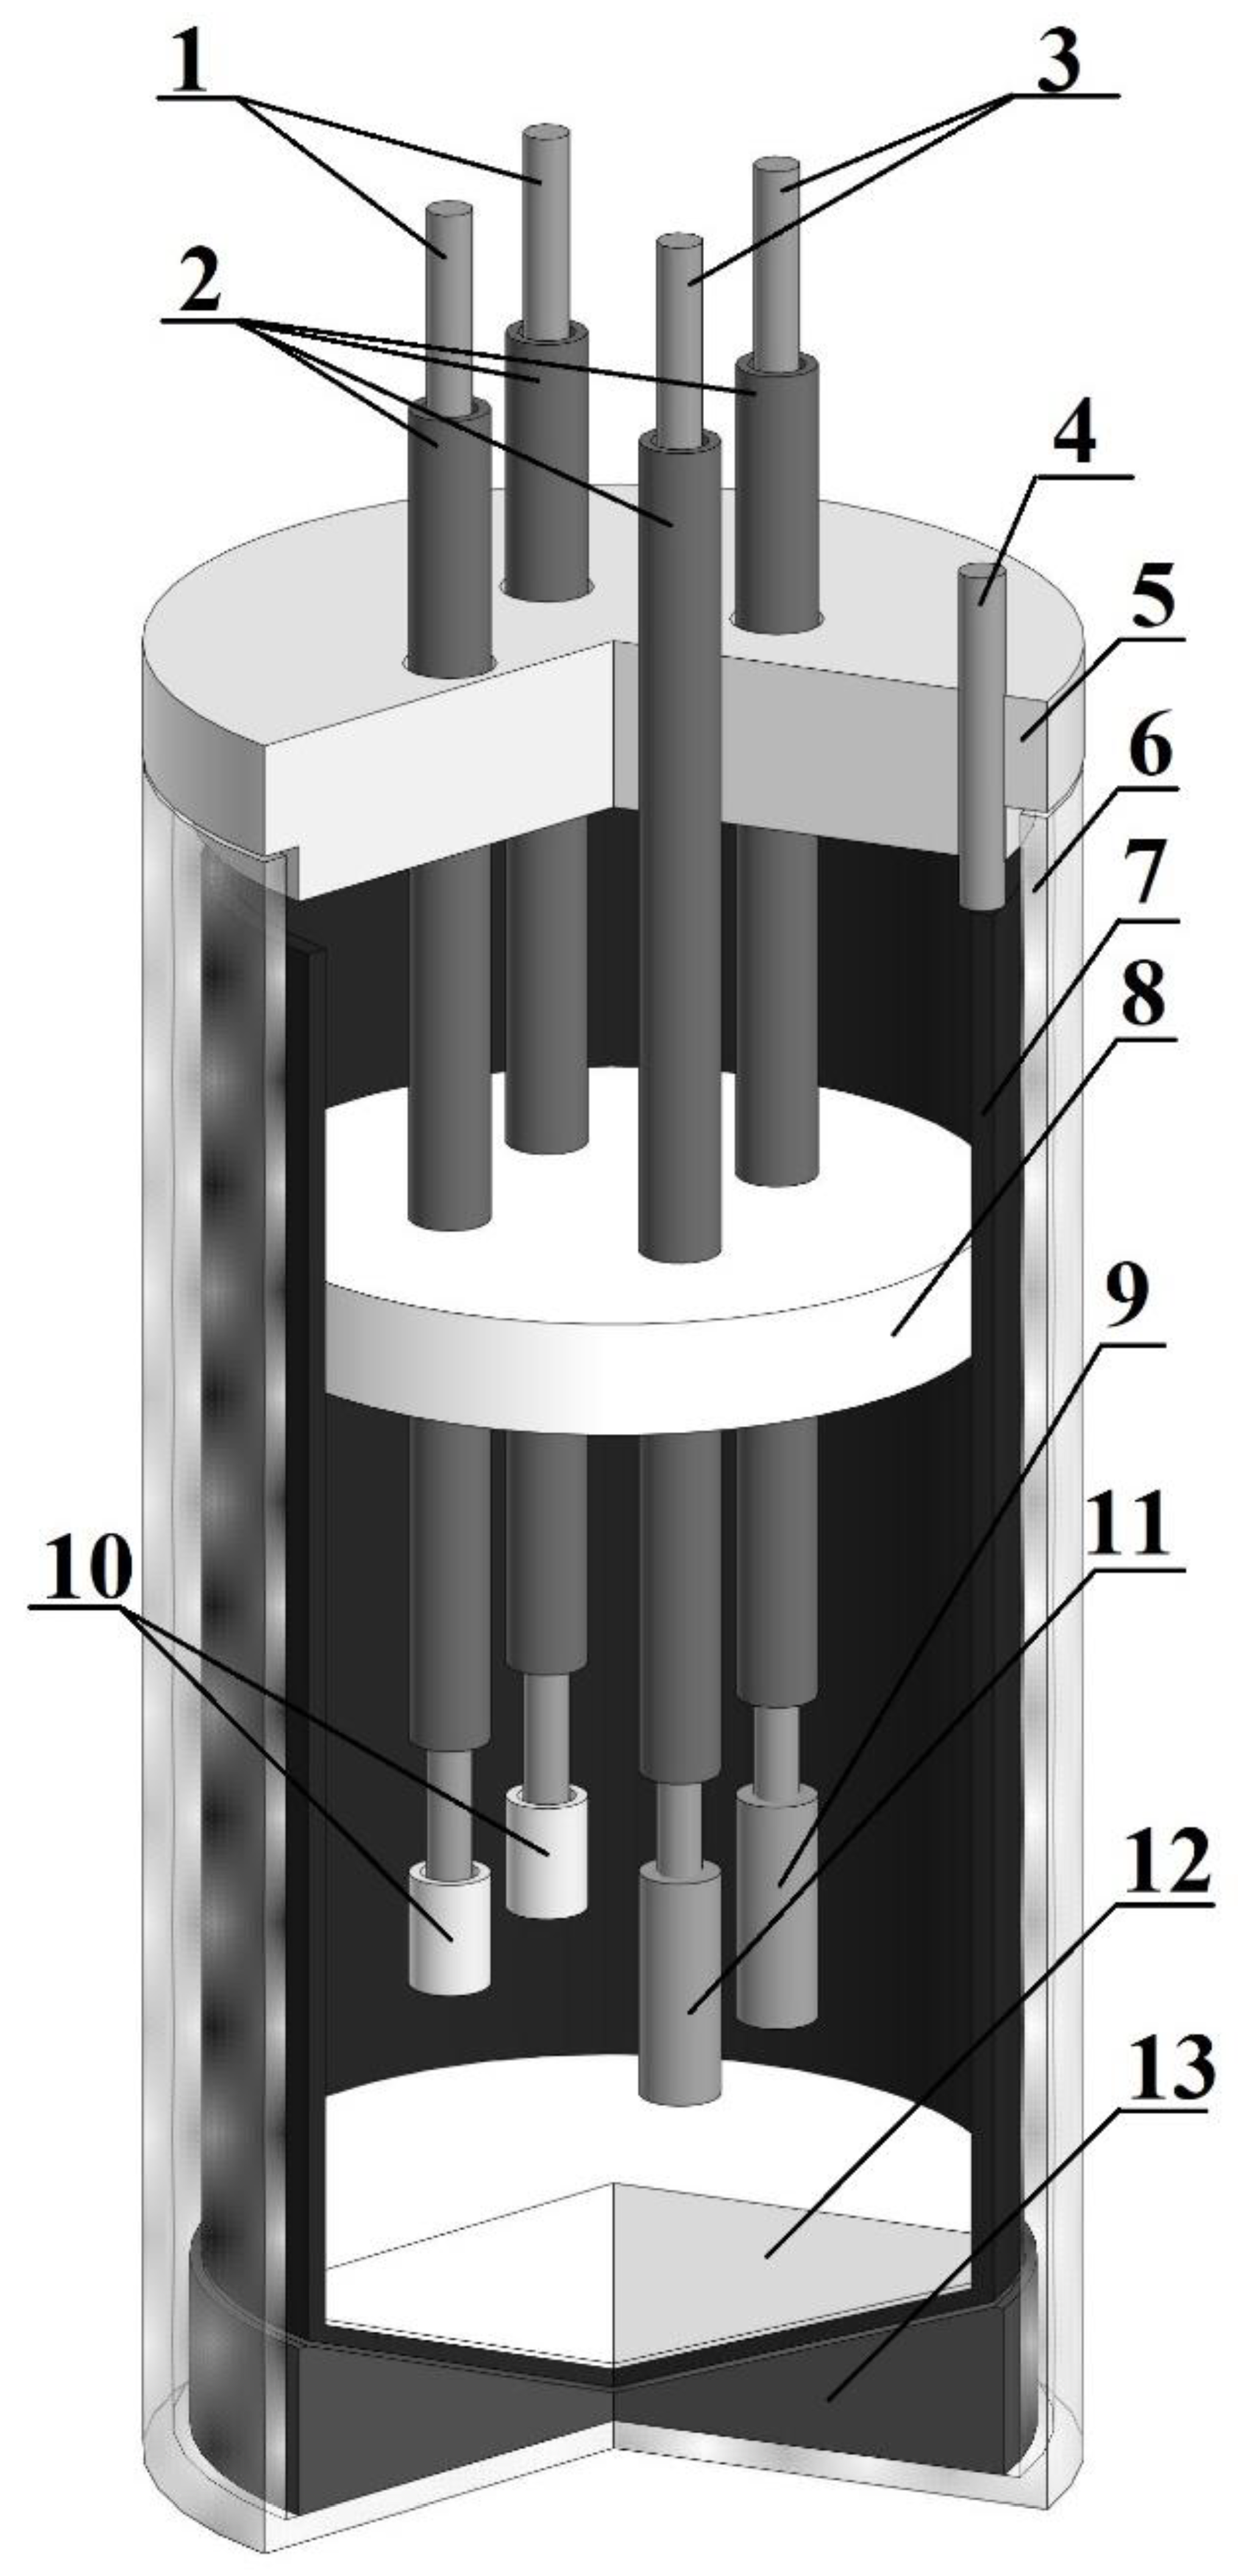
Figure 1. Schematic of the electrochemical cell. 1—molybdenum electrodes; 2—alundum straw; 3—molybdenum current lead; 4—nickel current lead; 5—fluoroplastic cover; 6—quartz retort; 7—glassy carbon ampule; 8—heat-resistant boron nitride screen; 9—nickel electrode; 10—nitride-boron isolator; 11—iron electrode; 12—melt; 13—graphite platform.
Processes 10 02742 g001
Figure 2. Time–potential dependence in the 0.66LiF–0.34BeF2 melt. Concentration of Fe was 0.0338 wt.%, T = 923 K; the time between the measurements was 15 min.
Processes 10 02742 g002
Figure 3. Cyclic voltammograms in the 0.66LiF–0.34BeF2–FeF2 melt at T = 923 K and iron concentrations, wt.%: 1—0.0992; 2—0.0651; 3—0.0551; 4—0.0338; 5—0.0031.
Processes 10 02742 g003
Figure 4. Temperature dependence of electrode potentials of iron in the LiF–BeF2 melt. The values of conditional standard potentials of iron: 1—present paper; 2—[32]. Equilibrium potentials at iron concentrations in the melt, wt.%: 3—0.0338; 4—0.0559; 5—0.0651; 6—0.0992.
Processes 10 02742 g004
Figure 5. Cathode polarization of iron electrodes relative to the beryllium reference electrodes at a temperature of 923 K in the 0.66LiF–0.34BeF2 melt. The iron concentration, wt.%: 1—0.0031; 2—0.0338; 3—0.0651; 4—0.0992.
Processes 10 02742 g005
Figure 6. Straight line regions of iron electrode polarization in the 0.66LiF–0.34BeF2 melt, wt.%: 1—0.0031; 2—0.0338; 3—0.0651; 4—0.0992.
Processes 10 02742 g006
Table 1. Elemental analysis of the studied melts.
Concentration, wt.%
LiBeFeCrNiMoAlB
113.83919.24940.00310.00030.00080.00020.00210.0006
213.83859.21830.03380.00020.0004<0.00010.00220.0004
313.83459.19760.05590.00010.0006<0.00010.00210.0001
413.83569.18710.06510.00020.0008<0.00010.00270.0005
513.83879.15340.09920.00030.0005<0.00010.00240.0006
Table 2. Equilibrium potentials of the Fe electrode.
T, KEMF (1), V
CFe = 0.0031 wt.%
EMF (1), V
CFe = 0.0338 wt.%
EMF (1), V
CFe = 0.0559 wt.%
EMF (1), V
CFe = 0.0651 wt.%
EMF (1), V
CFe = 0.0992 wt.%
9230.8371.3941.4121.4221.441
0.8381.3951.4121.4211.439
0.8361.3941.4151.4191.441
0.8371.3961.4121.4221.442
9730.7851.3661.3861.3951.415
0.7861.3641.3851.3941.416
0.7851.3661.3861.3951.415
0.7841.3651.3861.3951.413
10230.7381.3401.3641.3731.391
0.7391.3411.3631.3741.392
0.7361.3401.3641.3721.391
0.7381.3421.3651.3741.391
Table 3. Coefficients of isotherms and the degree of iron oxidation in the 0.66LiF–0.34BeF2 melt.
T, K−a, Vb, VR2n
9232.9530.04060.991.96
9732.9310.04210.991.99
10232.9050.04400.992.00
Table 4. Coefficients of equations for the straight line regions of polarization curves and the number of electrons are calculated according to the angular coefficient at 923 K.
Concentration Fe, wt.% R T n F , B R2N
10.00310.03890.992.04
20.03380.03730.822.13
30.06510.03830.682.08
40.09920.03700.992.15
Table 5. Thermodynamic values of iron fluoride (II) formation in the (0.66LiF–0.34BeF2) melt at 923 K.
T, KΔG*(l,melt), kJ/molΔH(l,melt), kJ/molΔS*(l,melt), J/(mol·K)ΔG*(mix), kJ/molΔH(mix), kJ/molΔS*(mix), J/(mol·K)
923−561.5−654.210046.087.21−45
973−557.1−654.210043.287.21−45
1023−551.5−654.210041.587.21−45
Publisher’s Note: MDPI stays neutral with regard to jurisdictional claims in published maps and institutional affiliations.