Article

Impact of Cross-Flow and Membrane Plate Filtrations under Winery-Scale Conditions on Phenolic Composition, Chromatic Characteristics and Sensory Profile of Different Red Wines

by
Mariana Rosária
1,
Miguel Oliveira
2,
Ana C. Correia
1 and
António M. Jordão
1,3,4,*
1
Agrarian Higher School, Food Industries Department, Polytechnic Institute of Viseu, 3500-606 Viseu, Portugal
2
Silgueiros Cooperative Winery, 3500-538 Silgueiros, Portugal
3
Chemistry Research Centre of Vila Real (CQ-VR), 5000-801 Vila Real, Portugal
4
Postgraduate Program in Agronomy—Midwestern Parana State University, Guarapuava 3010, Paraná, Brazil
*
Author to whom correspondence should be addressed.
Processes 2022, 10(2), 284; https://doi.org/10.3390/pr10020284
Submission received: 12 January 2022 / Revised: 28 January 2022 / Accepted: 28 January 2022 / Published: 31 January 2022

Abstract

:
Cross-flow microfiltration and membrane plate filtration are the main filtration processes used in wineries. However, the inherent compositional variability of red wines could affect the impact of these two filtration techniques on the final wine quality. Thus, this work aims to study, under winery-scale conditions, the impact of these two filtration processes on the turbidity level, phenolic composition, chromatic characteristics and sensory profile of red wine. For this purpose, three different Portuguese red wines with different initial phenolic contents were used. In this context, several methodologies were used to quantify the total phenolic composition, chromatic characteristics, individual anthocyanins and proanthocyanidins before and after filtration. The sensory profiles of the different red wines were also considered. The results indicated that each filtration process produced a substantial reduction in turbidity values and, consequently, an increase in wine clarification. In addition, the data obtained also indicated that both filtration techniques reduced the phenolic content of the different red wines that were studied. However, the impact of these two filtration options on wine characteristics (phenolic composition and sensory profile) was heterogenous, without a clear trend of differentiation between the wines depending on the type of filtration. Thus, this research points out evidence that the impact of the two filtration techniques that were studied is very dependent on the initial wine composition.

1. Introduction

The use of filtration as a means of wine clarification dates back to ancient times. After alcoholic and malolactic fermentations, crude wine is a complex medium presenting a turbid aspect that is not generally accepted by the consumer. Moreover, the presence of cloudiness or deposits in wines has always been perceived by consumers as a defect or undesirable trait of the final product [1]. Heat and cold stabilization are often used to speed up clarification. However, wine producers may also choose to filter their wines to achieve a greater level of clarity or to ensure microbiological stability after packaging. In filtration, suspended solids are separated from the liquid by interposing a porous medium into the fluid flow, through which the liquid can pass but solids and microorganisms (or at least some of them) are retained. Two different filtration modes can be used: dead-end filtration or cross-flow microfiltration. In the first filtration technique, wine particles are entrapped within the porous medium and the wine to be filtered circulates perpendicularly to the filtration medium, while in cross-flow microfiltration, the wine circulates tangentially to the filtering medium [2]. In recent years, this second filtration technique has become an increasingly common post-fermentation process in the wine industry, while membrane plate filtration is a conventional technique that is also used in wineries, which is relatively easy to perform and has low capital costs. According to El Rayess et al. [3], cross-flow microfiltration technology offers additional advantages compared to conventional processes, such as the elimination of the use of filter aids and its associated environmental problems and the combination of clarification, microbial stabilization and sterile filtration in one single continuous and automated operation. Thus, in recent years, the cross-flow microfiltration approach to wine filtration has become a very interesting alternative to conventional filtration processes.
The majority of previous works regarding conventional and cross-flow microfiltration in oenology have focused on the physical parameters of filtration and how they influence flux, fouling and filter performance [4,5,6]. In addition, the majority of the research studies, especially those using cross-flow microfiltration, were conducted in a small-scale investigation.
Buffon et al. [7] reported that, at a semi-industrial scale, no significant changes in color or phenolic profile were produced by the use of cross-flow microfiltration for white and red wines. Nevertheless, it was not clear for these authors whether slight changes in phenolic compound concentration were great enough to be detected sensorially, especially for red wines. In previous studies of white wines, no significant difference was found in aroma intensity or in astringency and body before and after filtration [8,9]. In addition, triangle tests that were conducted by several authors [10,11] on microfiltered Pinotage and membrane-filtered Cabernet Sauvignon wines identified a significant difference between filtered and unfiltered wines. Buffon et al. [7] proposed that cross-flow microfiltration has a stabilizing effect on the sensory profile of white and red California-blend wines. In addition, Martínez-Lapuente et al. [12] reported that cross-flow microfiltration produced a higher retention of polysaccharides and proanthocyanidins in red wines, and Palacios et al. [13] described that cross-flow microfiltration produces an important retention of the colloidal compounds responsible for the color of Sherry wines that is higher than conventional techniques, including membrane plate filtration. McRae et al. [14] compared the effect of cross-flow microfiltration and lenticular filtration on wine sensory and colloidal properties using several commercial red wines. These authors concluded that commonly applied commercial filtration practices do not affect wine color and have a minimal effect on the sensory profiles of red wines. Similar trends for white wines have also been previously described by other authors [8]. Therefore, it is clear that, despite advances made to improve the technological aspects of filtration processes, the inherent compositional variability of wine still affects these processes and has a respective impact on wine composition and sensory profile.
Thus, the present research aims to increase the knowledge of the impact of the main two filtration processes used in wineries, cross-flow microfiltration and membrane plate filtration, on red wine composition and sensory profile. For this purpose, three red wines produced from different grape varieties and with different initial phenolic contents were used. This study was carried out under winery-scale conditions, which makes this research even more relevant and of practical interest to winemakers, allowing them to have more data about the potential impact of different filtration techniques on red wine quality.

2. Materials and Methods

2.1. Red Wines

Three different red wines made from several Portuguese Vitis vinifera grape varieties were used in this experiment: a varietal wine produced from the Touriga Nacional grape variety, produced in 2018; a blended wine comprising four different grape varieties (Touriga Nacional, Tinta Roriz, Alfrocheiro and Jaen), produced in 2018; and a blended wine comprising two different grapes varieties (Baga and Tinta Pinheira), produced in 2019.
All grapes that were used were harvested in September and in a healthy condition at the technological stage of ripeness for both vintages from vineyards located in the Dão appellation of origin (Northern Portugal). All three of the red wines were elaborated at the Silgueiros Cooperative winery (Viseu, Portugal) following standard red wine-making technology with a maceration time of 7 days at 24 ± 2 °C. The sulfitation of the grapes (50 mg/L of SO2) was followed by alcoholic fermentation, which was carried out for all three red wines at an industrial scale via the use of closed stainless steel tanks (36,000 L) and a standard Saccharomyces cerevisiae yeast strain (Fermol Cru, AEB Group, Brescia, Italy), and the inoculation at 20 g/hL. After alcoholic and malolactic fermentation, the wines were kept in the stainless steel tanks under controlled conditions (temperature ±18 °C) and regularly analyzed for the free SO2 level. The two red wines produced in 2018 were submitted to contact with French medium toasted oak wood chips (2 g/L), with an average particle size of 8 mm, for 3 months. For the red wine produced in 2019, no contact with oak wood chips occurred. Prior to filtration, all red wines were clarified using commercial isinglass (30 mL/hL) as the fining agent, provided by AEB Bioquímica Portuguesa S.A. (Viseu, Portugal).

2.2. Winery-Scale Filtration Conditions

Each red wine that was tested was filtered under winery-scale conditions using two different filtration techniques, cross-flow microfiltration and membrane plate filtration, using industrial filtration equipment. The cross-flow microfiltration experiments were performed using industrial tangential flow filtration equipment from Permeare (Milan, Italy), model PWmn 8DC Smart System, equipped with eight filtration modules each with a length of 0.29 m, an internal diameter of 30.15 mm and a mean pore diameter of 0.45 μm. The working pressure used was 0.15 bars and the working flow was 4700 L/h. The wine filtration process was carried out at 18 °C. For the membrane plate filtration experiments, industrial plate filtration equipment from Della Toffola (Signoressa di Trevignano, Italy), model A6, with 49 plates of 400 × 400 mm was used, containing membranes produced from cellulose material and perlite with high purity and a mean pore diameter of 1.5 μm (reference 700 L) from AEB Bioquímica Portuguesa (Viseu, Portugal). The working pressure used was 1.5 bars and the working flow was 4700 L/h. The wine filtration process was also carried out at 18 °C. After filtration, all membranes from the two sets of filtration equipment were washed according to the manufactures’ recommendations. Thus, for cross-flow microfiltration, membranes were washed with water at 48 °C for 30 min and at 20 °C for 20 min, followed by a regeneration step with NaOH (pH 11) at 48 °C for 30 min. For the plate filtration, membranes were washed using a chlorinated alkaline solution (Idrosan, AEB Group, Brescia, Italy) at 20 °C for 20 min.
Before each filtration experiment, the integrity of the membranes was checked by measuring their permeability with water at 20 °C. Each filtration experiment consisted of a continuous filtration session, while samples of the filtrate stream were taken after half of the total amount of wine to be treated (18,000 L) had been filtered. For this, a total of 5 L of each trial were immediately bottled in 0.750 L dark bottles with cork closures. Immediately after the manual filling and before applying the cork closure, nitrogen was added to remove oxygen from the bottle headspace (5 mL). All wine samples were maintained at 18 °C in the dark until analysis.

2.3. General Wine Physicochemical Characterization

The general red wine physicochemical characterization (reducing substances, alcohol content, pH, total and volatile acidity, malic and lactic acid and free sulfur dioxide) was performed using a FTIR WineScan® (Foss Analytics, Hilleroed, Denmark), which had been previously calibrated. All analyses were performed in triplicate.

2.4. Global Phenolic Parameters

Several total phenolic parameters were analyzed for the different red wines that were submitted to the two filtration techniques studied. Total polyphenolic content was determined according to the methodology of Ribéreau-Gayon et al. [15], while non-flavonoid and flavonoid phenols were determined using the improved method described by Kramling and Singleton [16]. Briefly, the quantification of non-flavonoid phenols was based on the determination of the phenolic content before and after the precipitation of flavonoids through reaction with formaldehyde under specific conditions (low pH, low room temperature and darkness). After 72 h, a dilution with distilled water (1:10) was carried out and the absorbance was read at 280 nm on a UV-Vis spectrophotometer (model UV-1900i, Shimatzu, Duisburg, Germany). Flavonoid phenols were calculated by subtracting the non-flavonoid phenols from the total phenols. The results obtained were expressed as gallic acid equivalents by means of calibration curves with standard gallic acid (Extrasynthese, Genay, France). The total pigments, total and colored anthocyanins and polymeric pigments were quantified according to the methodology of Somers and Evans [17]. For the total and colored anthocyanins, the results were expressed as malvidin 3-monoglucoside equivalents by means of calibration curves with the standard of this individual monomeric anthocyanin (Extrasynthese, Genay, France). The total tannins were quantified according to the Bate–Smith assay, which is based on proanthocyanidin depolymerization through the breakdown of their intra-flavonol bonds in an acidic heat medium [18].
The tanning power was quantified following the methodology developed by De Freitas and Mateus [19]. This method included a 1:50 dilution with a hydroalcoholic solution (12% v/v and pH 3.2 at 20 °C) followed by a reading (d0) on a turbidimeter (Lovibond, model TB 211 IR, Dortmund, Germany). Then, 8 mL of the previous dilution and 300 μL of BSA (bovine serum albumin) were added to a tube and, after agitation and 45 min in the dark, a second reading was carried out on the turbidimeter (d1). The final value (NTU/mL) was calculated as tanning power = (d1 − d0)/0.08. All measurements were performed in triplicate.

2.5. Turbidity and Chromatic Characteristics

The turbidity of the red wines was measured with a Lovibond TB 211 IR nephelometer (Dortmund, Germany), calibrated using formazine standard solutions. The color intensity at 420, 520 and 620 nm and color hue were evaluated following the methodology described by the OIV [20]. In addition, by means of the CIELab method and using a UV-Vis spectrophotometer (model UV-1900i, Shimatzu, Duisburg, Germany), chromatic characteristics (scanned from a range of 380–770 nm) were also determined by the calculation of several chromatic parameters, according to OIV [20] method: L* (%) (lightness), a* (redness), b* (yellowness) and chroma (C* = ((a*)2 + (b*)2)1/2). To distinguish the color more accurately, the color difference was also calculated using the following formula: (ΔE = ((ΔL*)2+(Δa*)2+(Δb*)2)1/2). All measurements were performed in triplicate.

2.6. Fractionation of Proanthocyanidins According to Their Degree of Polymerization

A method described by Sun et al. [21] was used to fractionate the red wine proanthocyanidins according to their degree of polymerization: catechins (monomers), oligomeric (degree of polymerization ranging from 2 to 12) and polymeric (degree of polymerization > 12) fractions using a C18 Sep-Pack column. Each red wine sample was passed through two preconditioned neutral Sep-Pack cartridges that were connected in series. To eliminate phenolic acids, a 4 mL dealcoholized medium was adjusted to a pH of 7.0 and then passed through the two connected Sep-Pack cartridges that were preconditioned with 10 mL of water and adjusted to a pH of 7.0. After drying the column with N2, the elution was first carried out with 25 mL ethyl acetate to elute the catechins and oligomeric proanthocyanidins, and then the polymeric fraction was eluted with 10 mL methanol. Regarding the separation of the monomeric from the oligomeric fractions, both fractions were completely evaporated under a vacuum at 25 °C, dissolved in distilled water and then redeposited onto the same connected cartridges that were preconditioned with distilled water. After drying the cartridges with N2, the catechins and oligomeric proanthocyanidins were eluted sequentially with 25 mL diethyl ether (catechins fraction) and, finally, with 10 mL methanol (oligomeric fraction). For each fraction obtained in the previous manner, the flavanols were quantified by the modified vanillin assay described by Sun et al. [22]. Therefore, the vanillin reaction with the catechin fraction was carried out in a 30 °C water bath for 15 min and the measurement of absorbance was performed at 500 nm at the same temperature. Finally, for the oligomeric and polymeric fractions, both the vanillin reaction and the measurement of absorbance at 500 nm were performed at room temperature and the maximum absorbance was taken as the measured value. All analyses were performed in triplicate.

2.7. Individual Monomeric Anthocyanins Analysis

For the analysis of the individual monomeric anthocyanins that were grouped into three main groups (monoglucosides, acetylglucosides and coumarylglucosides), the equipment used was a high-performance liquid chromatography (HPLC) Dionex Ultimate 3000 Chromatographic System (Sunnyvale, CA, USA), equipped with a quaternary pump, model LPG-3400 A, an autosampler, model ACC-3000, a thermostatted column compartment (adjusted to 25 °C) and a multiple Wavelength Detector MWD-300. The column (250 × 4.6 mm, particle size 5 μm) was a C18 Acclaim 120 (Dionex), protected by a guard column of the same material. The solvents were (A) 40% (v/v) formic acid, (B) pure acetonitrile and (C) bi-distilled water. The individual anthocyanins were analyzed by HPLC using the method originally described by Dallas and Laureano [23]. Thus, the initial conditions were 25% (A), 10% (B) and 65% (C), followed by a linear gradient from 10 to 30% (B) and 65 to 45% (C) for 40 min, with a flow rate of 0.7 mL/min. The injection volume was 40 μL. Detection was made at 520 nm and a Chromeleon software program, version 6.8 (Dionex, Sunnyvale, CA, USA), was used. The individual anthocyanins were quantified using a calibration curve that was obtained with diverse standard solutions containing different concentrations of malvidin 3-monoglucoside (Extrasynthese, Genay, France). The chromatographic peaks of the anthocyanins were identified according to reference data previously described by Dallas and Laureano [23]. All measurements were performed in triplicate.

2.8. Sensory Evaluation

The red wines (filtered and unfiltered) were bottled and tasted 3 months after the filtration process by seven expert judges (six men and one woman aged between 40 and 60 years old and with over 15 years of wine tasting experience). Measures of 25 mL from each red wine sample were presented to the panel at 20–22 °C, in tasting glasses and marked with three-digit numbers. All expert judges had been previously selected and trained to assess the sensorial attributes of wines produced in the Dão appellation of origin. During this training period and under the supervision of the panel leader, several sessions were carried out in order to train the judges regarding the meaning of each attribute and to achieve reliable intensity ratings. According to Parr et al. [24], wine experts have a higher recognition memory than wine novices, as well as superior perceptual skills that are unaffected by verbal interference.
The sensorial attributes used were grouped in the following way: color (“red” and “brown”); aroma (“fruity”, “floral”, “vanilla”, “spice”, “toasted”, “coconut” and “balance”); taste (“body”, “bitterness”, “astringency”, “persistence” and “balance”); and overall appreciation. The experts scored each sensory attribute on a scale from 1 to 5 (1 = “absence”; 2 = “little intensity”; 3 = “moderate intensity”; 4 = “intense”; 5 = “high intensity”), according to their sensory knowledge and training. Aroma balance, taste balance and overall appreciation were also scored on a scale from 1 to 5 (1 = “bad”; 2 = “pleasant”; 3 = “good”; 4 = “very good”; 5 = “excellent”).

2.9. Statistical Analysis

The data are presented as mean ± standard deviation. The turbidity, phenolic, chromatic and sensory parameter data were statistically tested by the analysis of variance (ANOVA, one-way). The Tukey test (p < 0.05) was applied to the data to determine significant differences between the red wines. A principal component analysis (PCA) was also used to analyze the data and to study the relationships between the red wines submitted to different filtration techniques and their phenolic composition, chromatic properties and sensory characteristics. All analyses were performed using SPSS software, version 26.0 (SPSS Inc., Chicago, IL, USA).

3. Results and Discussion

3.1. General Physicochemical Composition

The data in Table 1 provide the contents found for the general physicochemical composition of the three control wines (before filtration treatment) that were used in the experimental work. It is evident that the red wines used in this study showed acceptable physicochemical standards, showing a low volatile acidity (ranging from 0.24 to 0.38 g/L acetic acid) and an adequate SO2 free values (30 mg/L). It should be noted that malolactic fermentation was developed in all red wines to reach a malic acid content ranging between 0.10 and 0.20 g/L. In addition, all wines showed similar pH (ranging from 3.61 to 3.64) and total acidity (ranging from 5.20 to 5.40 g/L tartaric acid) values. Finally, all three wines that were studied showed low levels of reducing substances, namely residual sugars (ranging from 1.9 to 3.0 g/L). It can therefore be considered that the general physicochemical characteristics showed by the three wines that were studied allow us to assume that they were in stability conditions that were good enough to be submitted to the different filtration techniques.

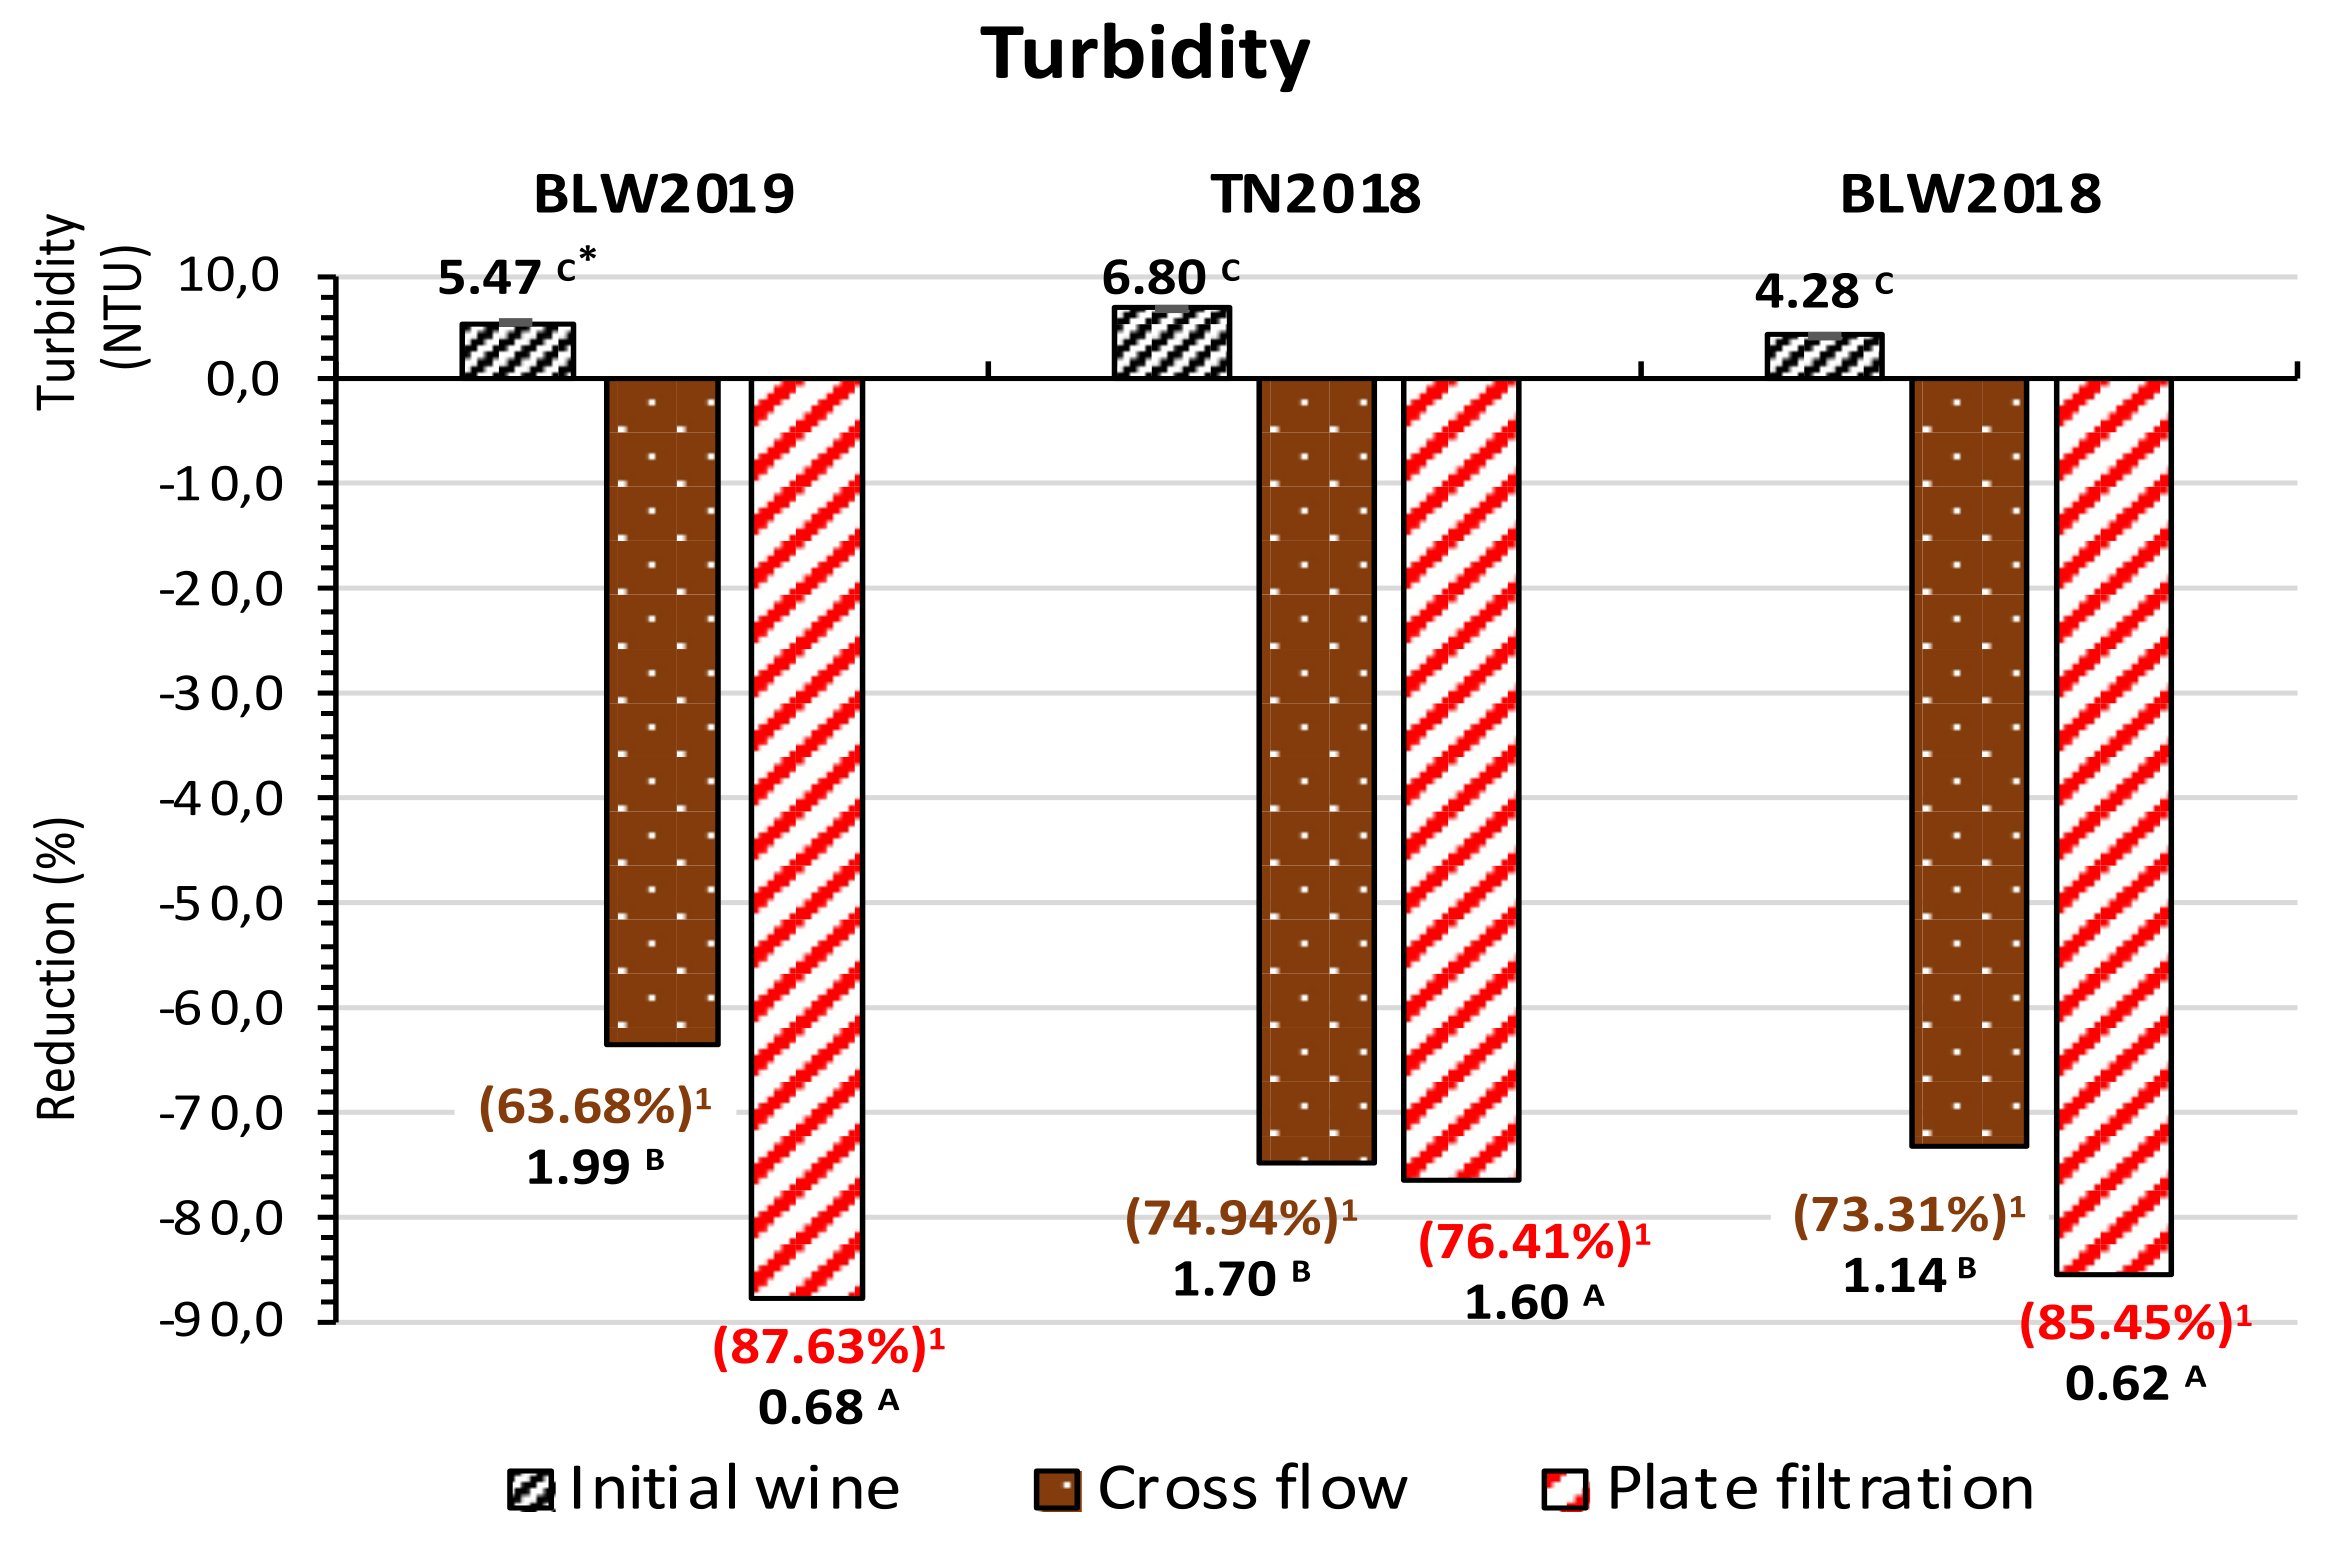
3.2. Turbidity Measurement

The quality of clarification should be understood as the extent of the removal of the solid phase from a suspension and is directly related to the turbidity of the filtrate. The data in Figure 1 provide the turbidity value changes in the red wines that were submitted to the different filtration techniques. In general, both of the filtration techniques produced a substantial decrease in turbidity values for all red wines studied. A decrease of between 63.6 and 73.3% was detected for the red wines submitted to the cross-flow microfiltration and a decrease of between 76.4 and 87.6% was detected for the red wines submitted to the plate membrane filtration. Therefore, for each red wine, significantly higher turbidity decreases were produced by using membrane plate filtration, even though this filter was used with a higher pore diameter (1.5 µm) than the cross-flow microfiltration (0.45 µm). However, it should be taken into account that the pressure used in the winery for the membrane plate filtration (1.5 bars) was much higher than that used for the cross-flow microfiltration, which could explain these differences between the wines that were submitted to the two different filtration techniques. This tendency confirms the results previously reported for white wines by Prodanov et al. [25], where only a minor colloidal compound decrease (up to 5.5%) was obtained for wines submitted to cross-flow microfiltration. Previously, when comparing the impact of different fining agents (gelatin and egg albumin) and cross-flow microfiltration on wine clarity, Oberholster et al. [10] reported that this last option had the largest effect. Other authors reported that cross-flow microfiltration induced the largest wine clarification compared to other filtration techniques [13,26]. Nevertheless, in our work and independently of the filtration process, in general, all filtered red wines showed turbidity values lower than 2.0 NTU (ranging between 0.62 and 1.99 NTU), which correspond to an adequate clarification level [15].

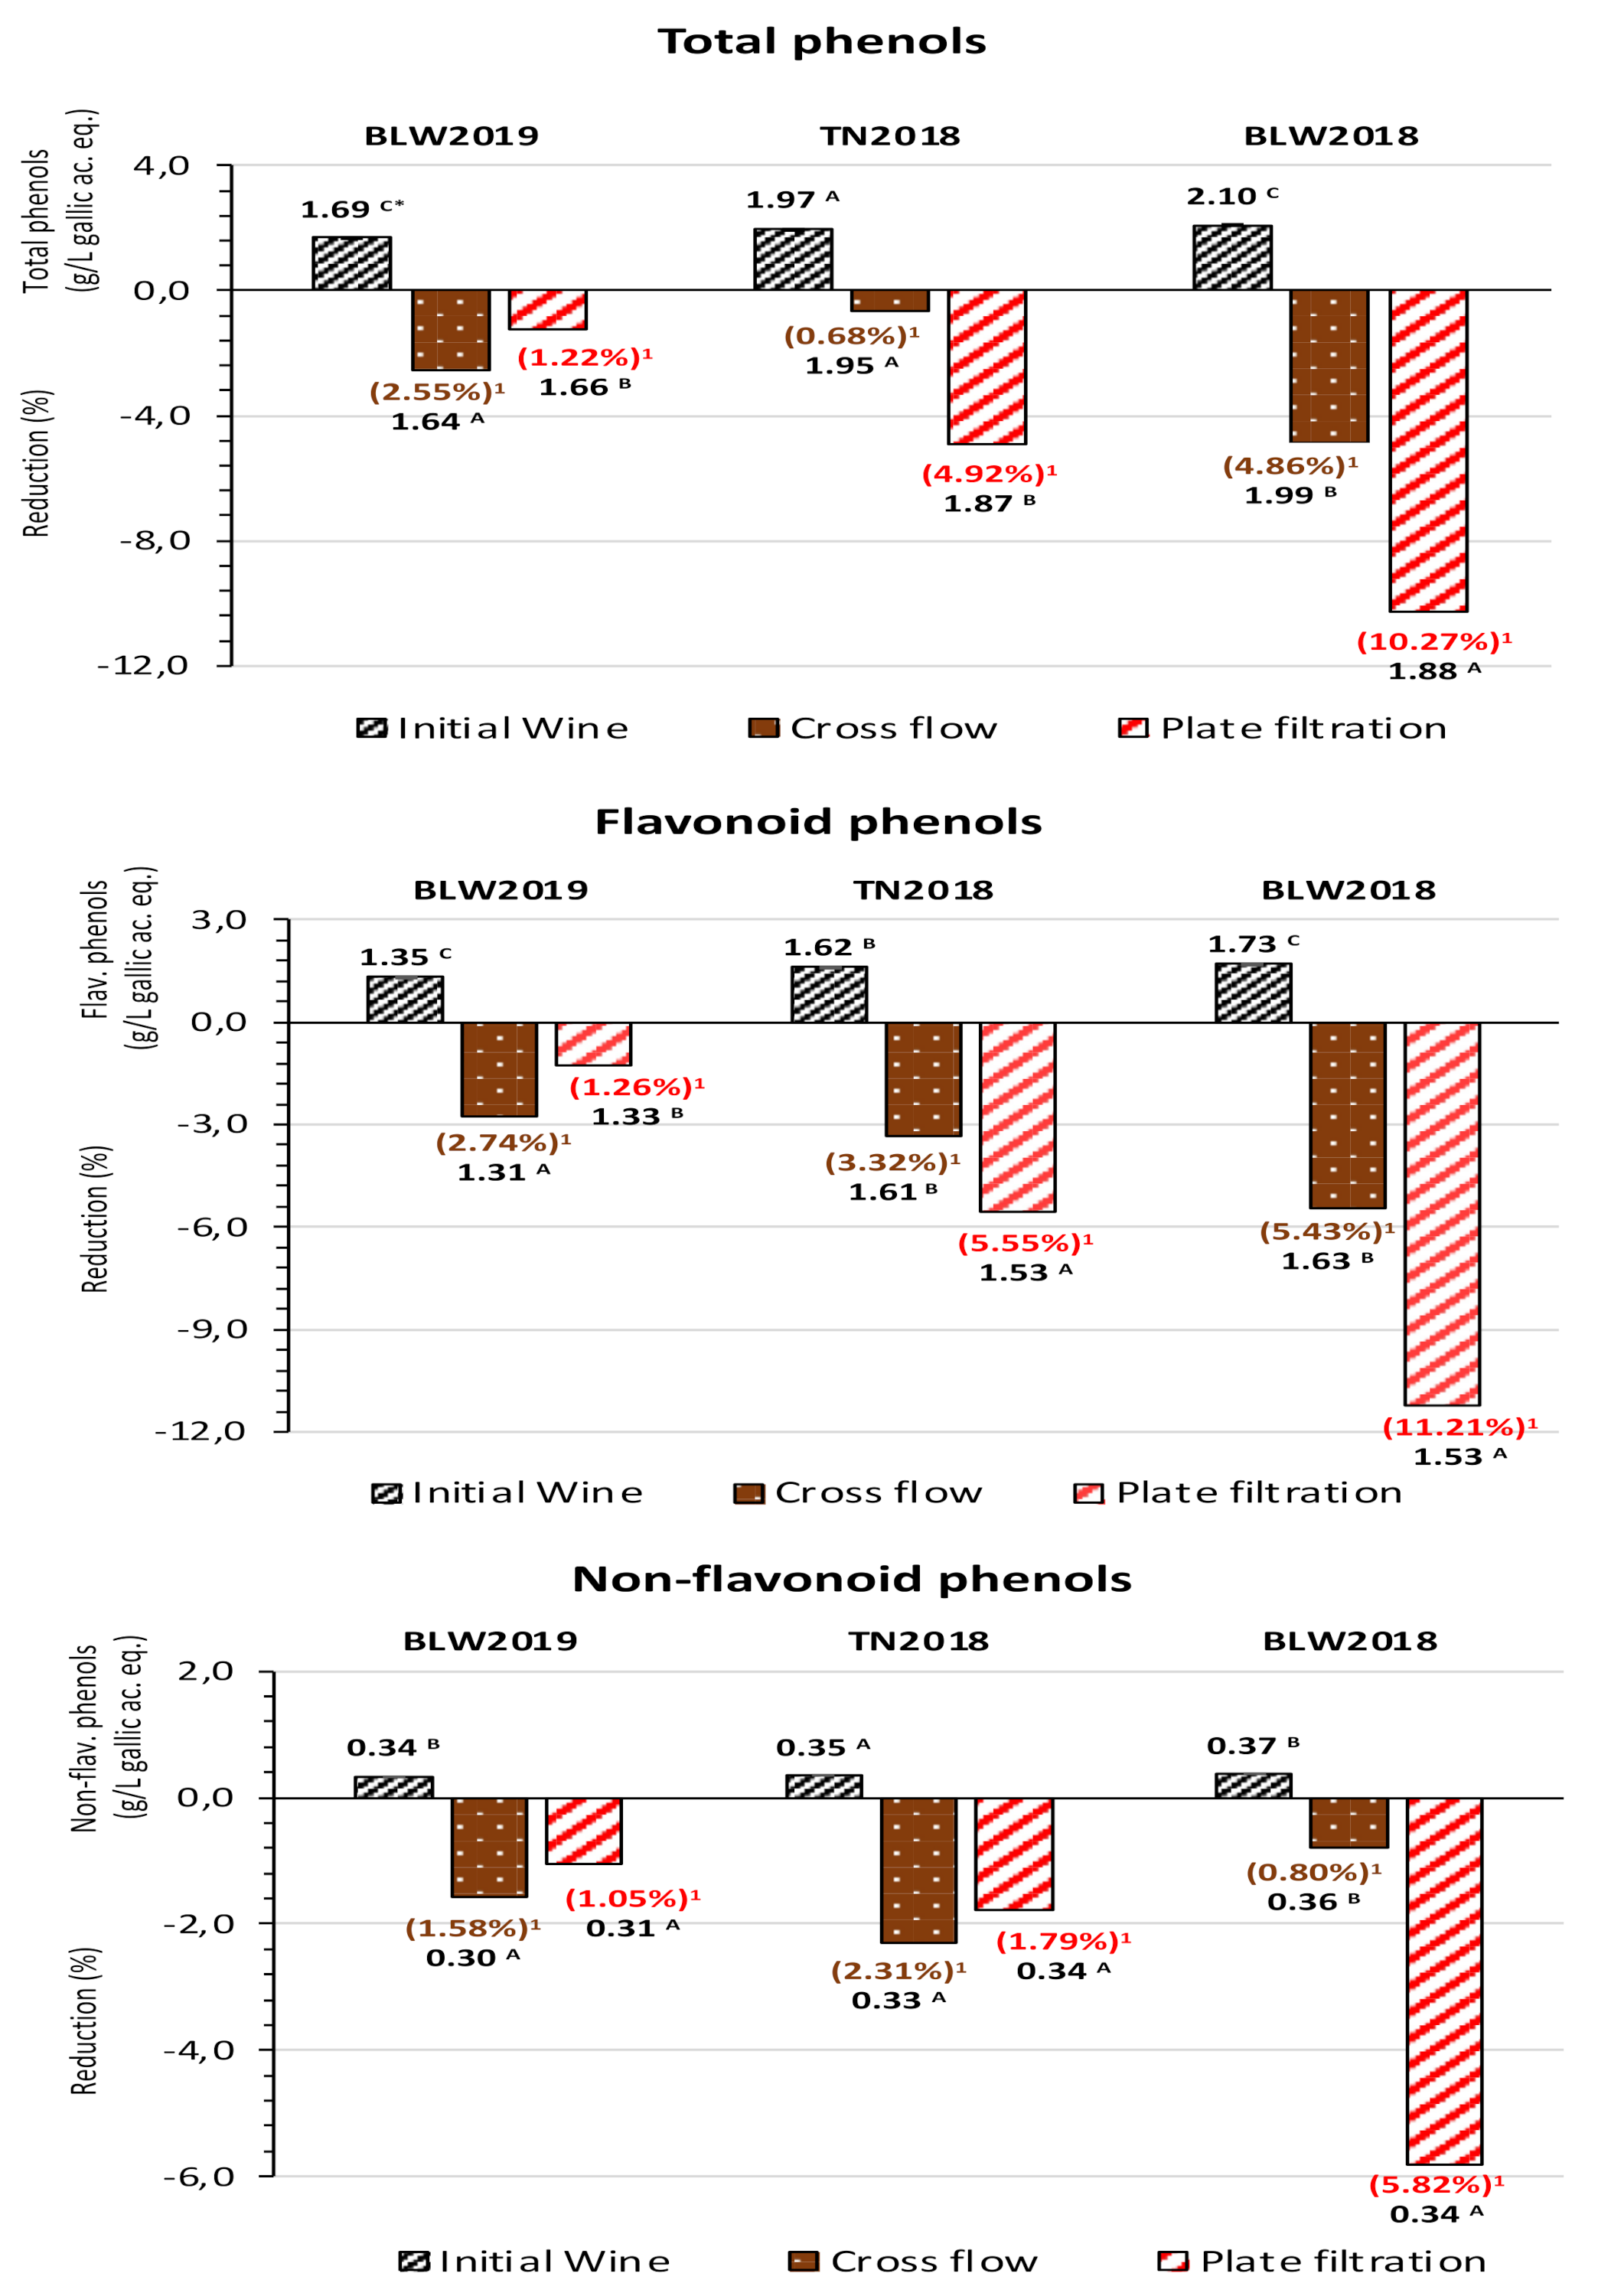
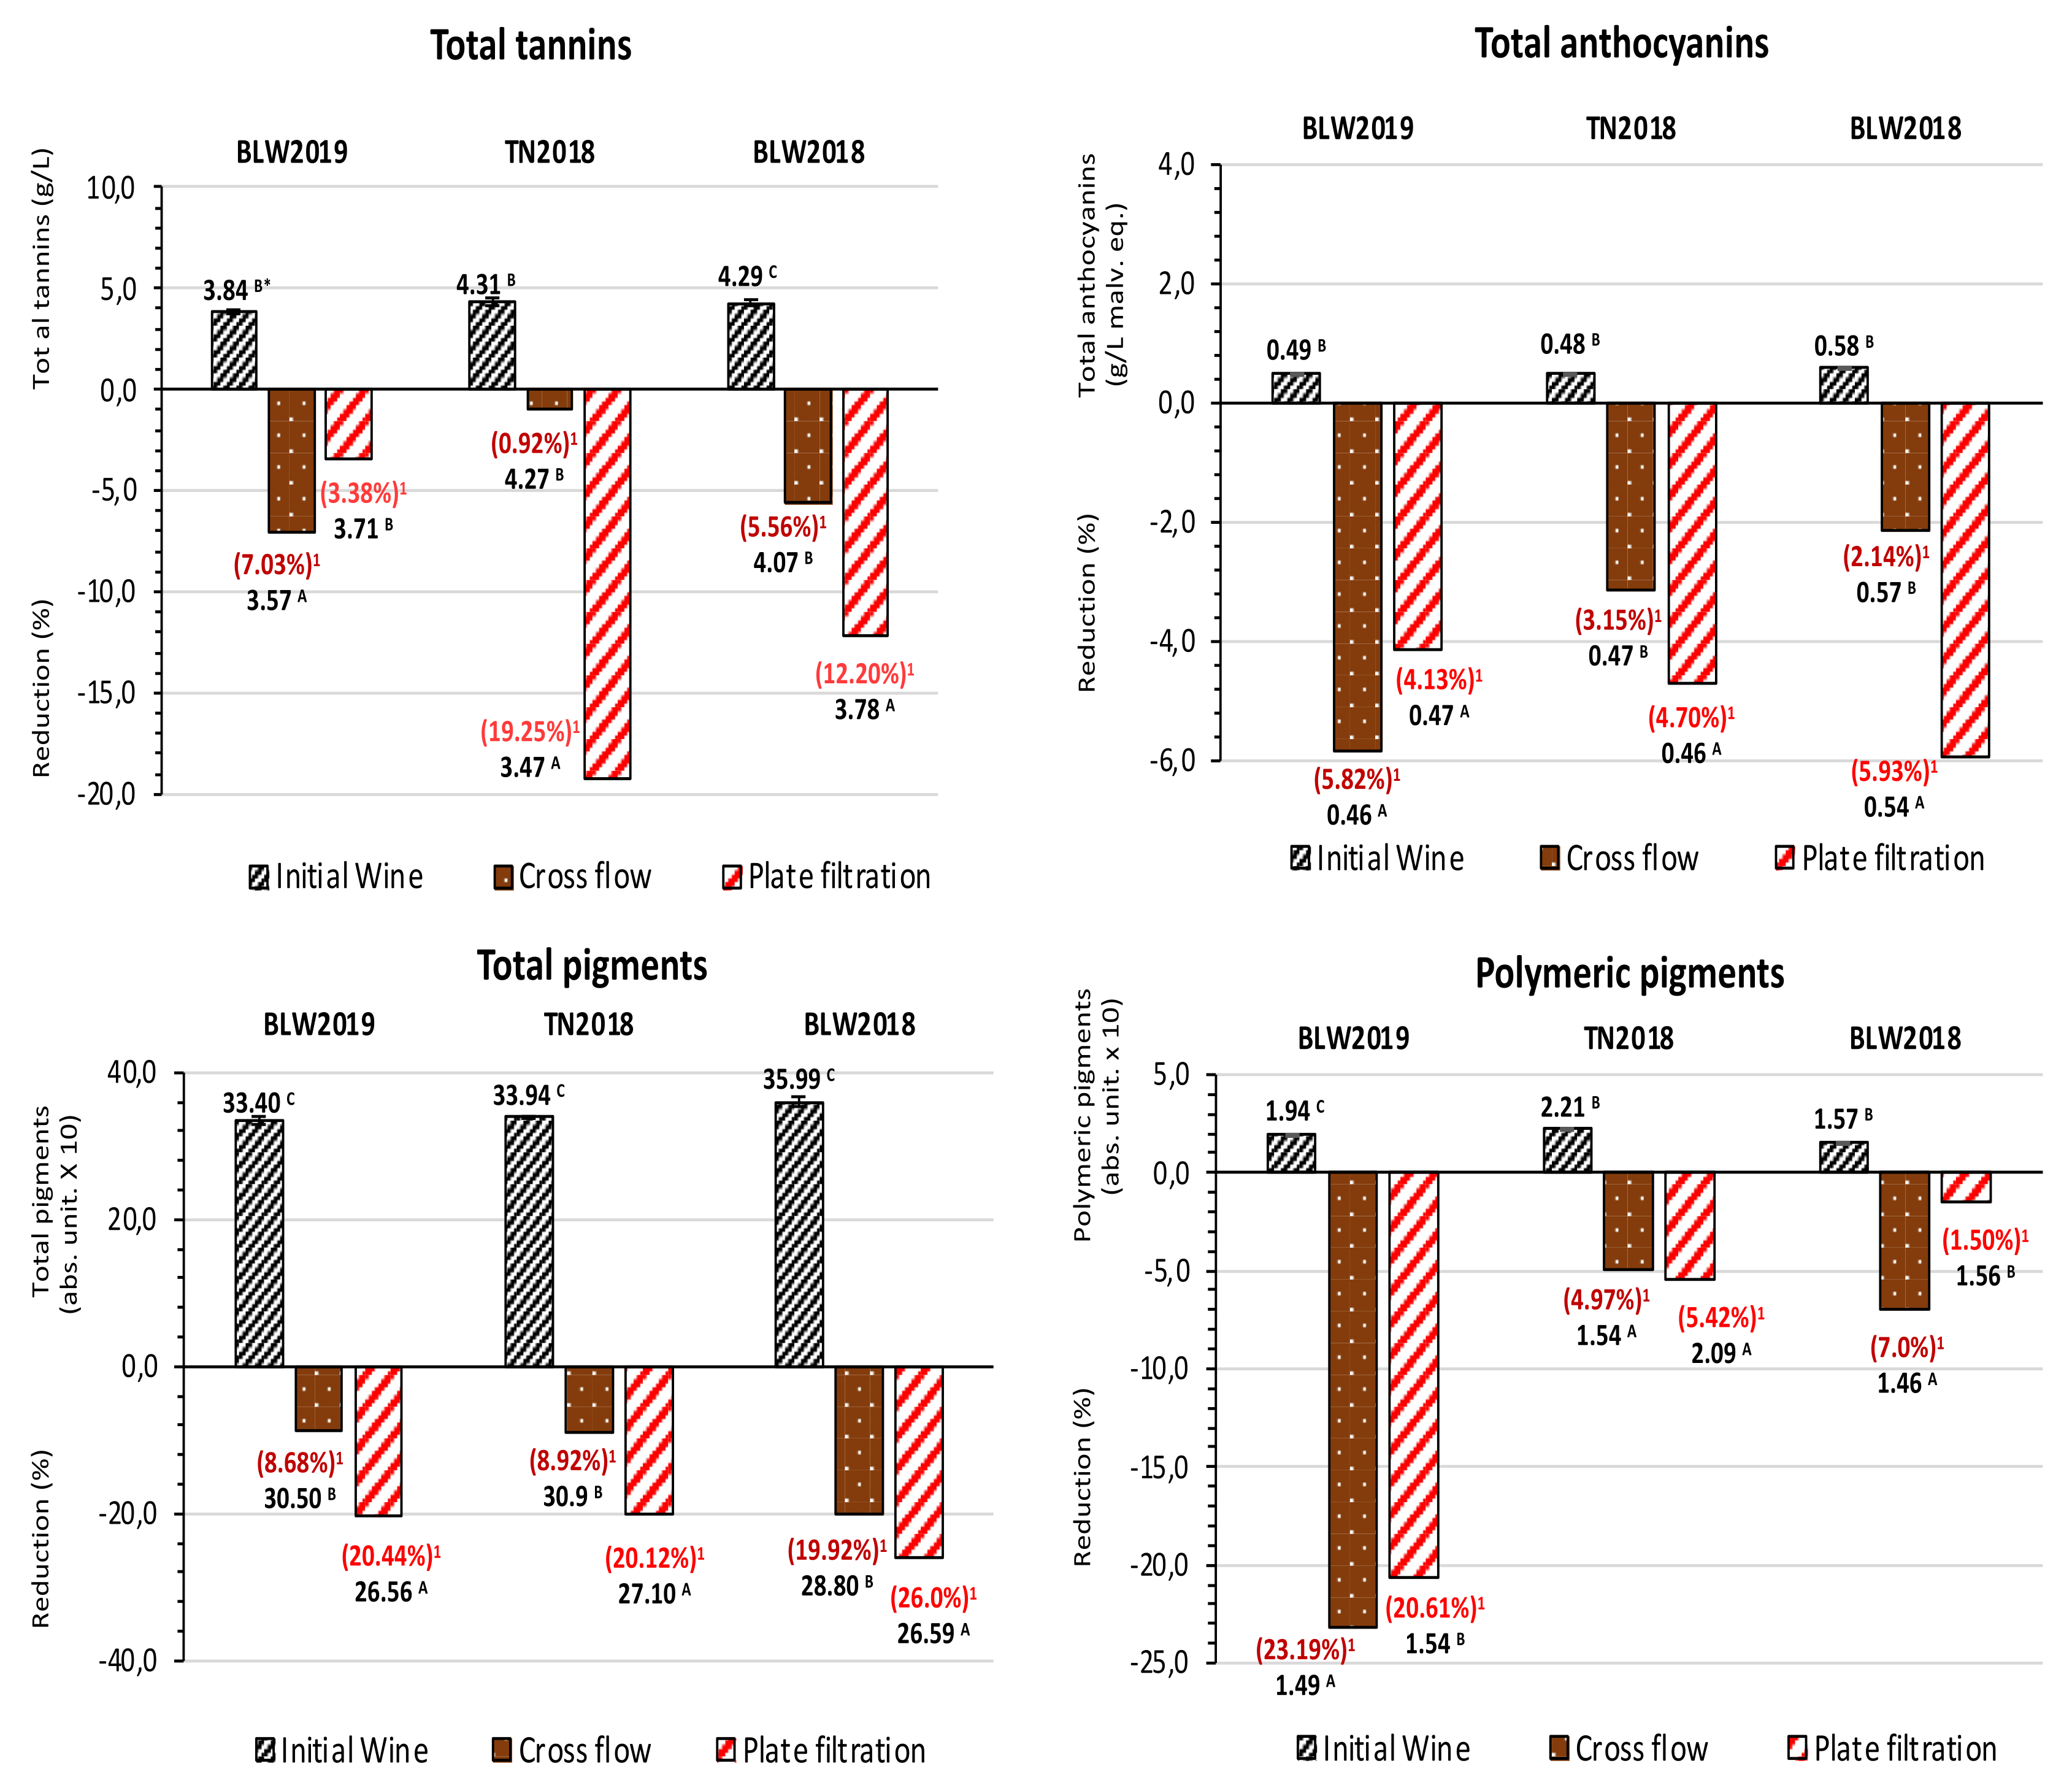
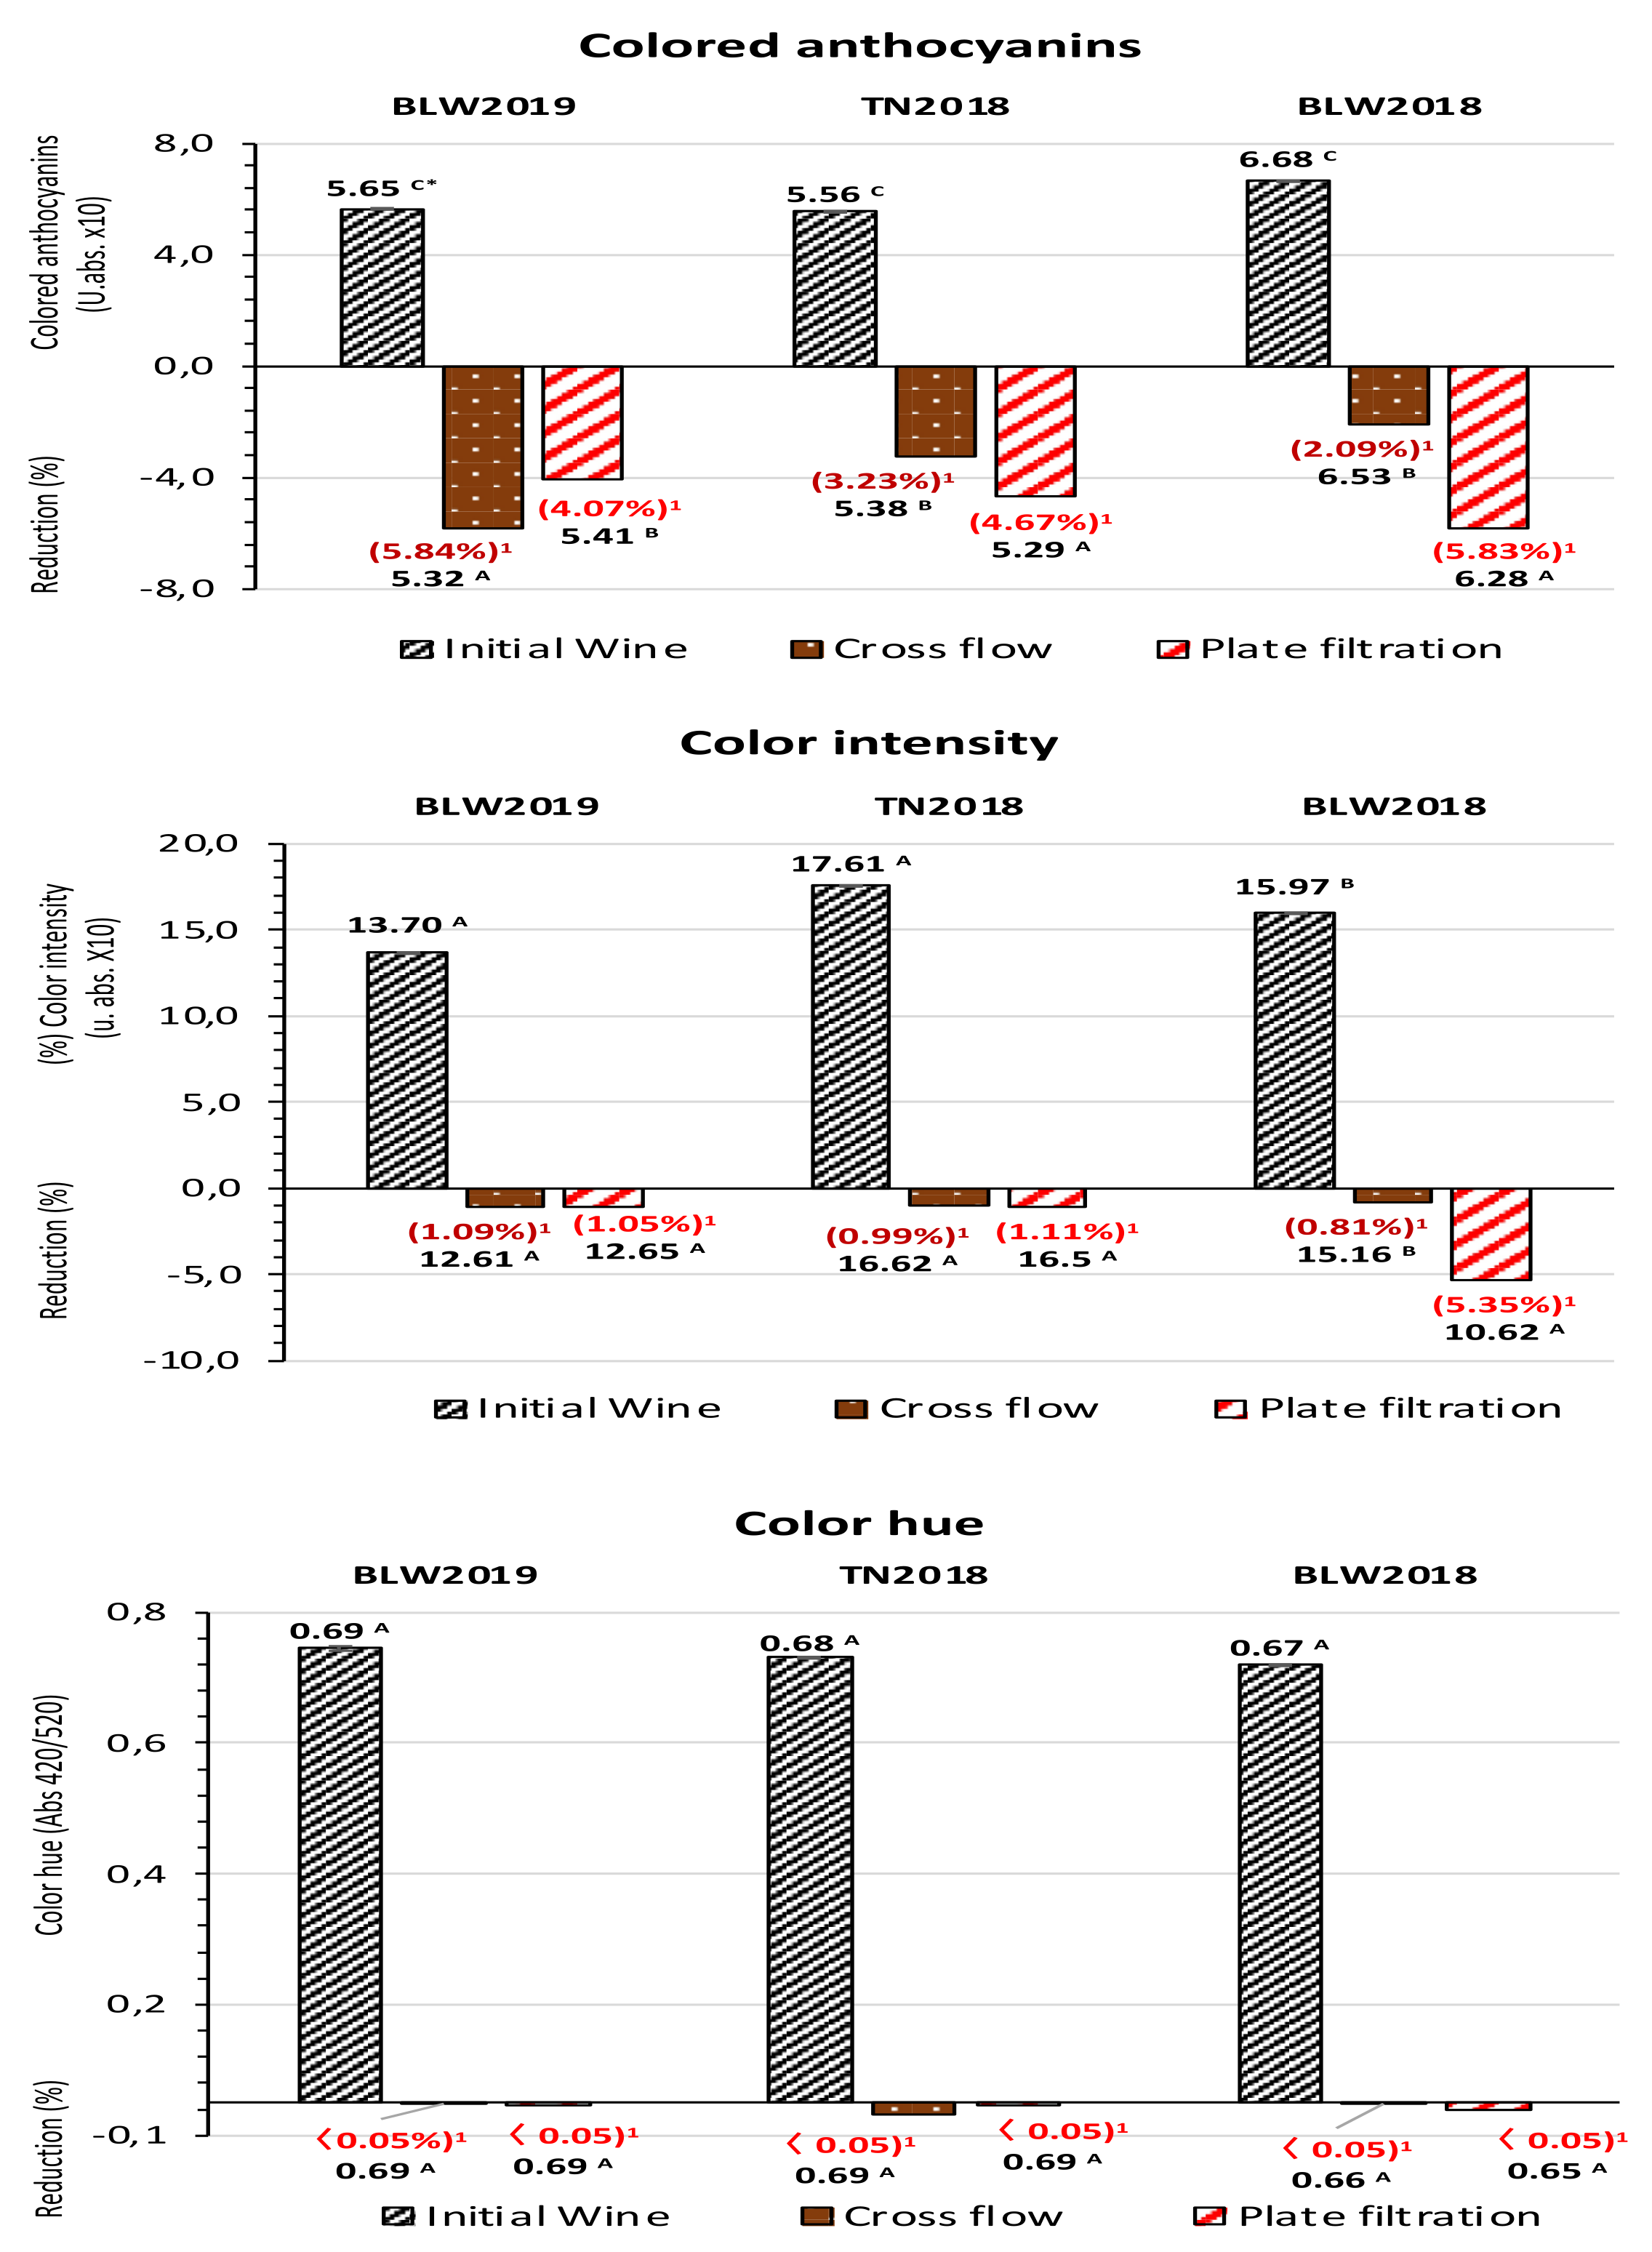
3.3. Changes on General Phenolic Composition and Color Parameters

The quality of clarification should also consider the retention of the different chemical compounds of the clarified wine, particularly the phenolic composition and also the changes in chromatic characteristics. In this context, the changes in the general phenolic parameters that were detected in the red wines submitted to the different filtration conditions are shown in Figure 2. Membrane plate filtration produced a significant higher retention of the phenolic compounds for both red wines with the higher initial phenolic compositions (TN2018 and BLW2018 wines), which affected the total phenols and flavonoid phenols content (Figure 2). In this sense, the TN2018 and BLW2018 wines submitted to membrane plate filtration showed a decrease in total phenols of between 4.9 and 10.3%, while for flavonoid phenols, the decrease varied from 5.5 to 11.2%, respectively. On the contrary, these wines showed a lower decrease in the total phenols (between 0.6 and 4.8%) and flavonoid phenols (between 3.3 and 5.4%) when submitted to cross-flow microfiltration. Nevertheless, the BLW2019 wine submitted to cross-flow microfiltration showed the opposite tendency, i.e., a slightly higher phenolic retention was produced by the use of cross-flow microfiltration (the filtration technique that presented the membrane with the lowest pore diameter, 0.45 µm), where the values showed a decrease of 2.5, 1.5 and 2.7%, respectively, for total phenols, non-flavonoid and flavonoid phenols (Figure 2). However, the impact detected by the use of the two filtration techniques on the BLW2019 wine, in general, was not as high compared to the differences detected for the remaining two wines that had higher initial phenolic contents, especially for flavonoid and non-flavonoid phenols. Finally, the highest reduction was produced by the use of cross-flow microfiltration for the BLW2019 and TN2018 wines, specifically for non-flavonoid phenols. In that case, the values decreased between 1.5 and 2.3%, while for the same wines submitted to membrane plate filtration, the values decreased between 1.0 and 1.7%.
However, the most significant retention of non-flavonoid phenols was detected for the BLW2018 wine when submitted to membrane plate filtration (a reduction of 5.8%). It is important to note that this filter was made up of membranes with higher pore dimensions (1.5 µm) than the membranes of the cross-flow microfiltration equipment (0.45 µm).
Thus, considering the results obtained, it is clear that the impact of the two filtration technologies on wine phenolic composition was diverse, varying according to the initial phenolic content of the wines that were used. For the wine with the highest phenolic content (BLW2018), membrane plate filtration induced the more significant impact on the reduction in the general phenolic parameters that were analyzed (a reduction of between 5.8 and 11.2%). According to Peri et al. [8], the impact of wine filtration is probably strongly dependent on the membrane material and filtration conditions, namely the initial amount of suspended solids and also the grape varieties used. In addition, several groups of wine compounds, such as polysaccharides and polyphenols, are usually the main compounds that are responsible for fouling in wine clarification with membranes [27]. According to El Rayess et al. [28], phenolic compounds have a much more important affinity for membranes than the polysaccharides and there are both quantitative and qualitative differences between the different membrane materials. Previously, Czekaj et al. [29] reported different performances during filtration for two wines that had initial similar turbidity values but diverse polyphenol concentrations. In fact, according to several authors [29,30], an increase in the polyphenol concentration of wine leads to a decrease in membrane permeability and, thus, an increase in membrane fouling. Cameira-dos-Santos et al. [31] studied wine cross-flow microfiltration and concluded that macerated wine is more foulant, probably due to the higher levels of polysaccharides and polyphenols. However, they also suggested that differences in membrane fouling behavior between the wine samples are not only related to their initial polyphenol and polysaccharide concentrations, but also to the composition and structures of the foulant molecules.
Figure 3 shows the data obtained for the impact of the two filtration techniques studied on the total tannins, anthocyanins, pigments and polymeric pigments.
For the total tannins, the BLW2018 and TN2018 wines submitted to membrane plate filtration showed significantly higher decreases, although this filter had membranes with a larger diameter (1.5 µm), which varied between 12.2 and 19.2%, respectively, while for the BLW2019 wine, the decrease was only significant when submitted to a cross-flow microfiltration (a reduction of 7.0%). With regard to the total anthocyanins, in general, all wines showed a decrease in these pigments independent of the filtration technique that was used. The reduction ranged from 2.1 to 5.9%, but it is clear that the impact of filtration depended on the technique used and, namely, the wine composition. Thus, while for the BLW2018 and TN2018 wines, membrane plate filtration induced a more significant decrease, for the BLW2019 wine, a slight reduction in total anthocyanins occurred, especially when using the cross-flow microfiltration (a reduction of 5.8%). This last result is in agreement with other authors [10], where cross-flow microfiltration induced the highest anthocyanin decrease. On the other hand, Arriagada-Carrazona et al. [11] reported a decrease of 4.8% for tannins, 2.4% for anthocyanins and 10% for total phenols for Cabernet Sauvignon wine submitted to membrane plate filtration. According to these authors, this decrease was attributed to the absorption of the different phenolic compounds in the membrane filter.
In terms of the total pigments, all wines submitted to cross-flow microfiltration showed a smaller decrease (a reduction of between 8.0 and 19.9%) compared to the remaining wines submitted to membrane plate filtration (a reduction of between 20.1 and 26.5%), although the first filtration technique had membranes with smaller pore diameters (0.45 µm). However, independent of the filtration technique, both technologies induced a significant reduction in total pigments in all red wines studied. Finally, with respect to the polymeric pigments, both filtration techniques only induced a strong significant reduction in values for the BLW2019 wine. The reduction in these pigments ranged from 20.6% (membrane plate filtration) to 23.1% (cross-flow microfiltration). These pigments essentially result from the reactions between anthocyanins and flavanols (either directly or meditated by aldehydes), and also from the reactions of A-type vitisins with other wine components, giving origin to polymeric pigments with different colors (ranging from yellow to turquoise blue) and playing an important role in the long-term color stability of red wines [32,33].
The results from our work seem to indicate a lesser retention through filtration in the two older wines (TN2018 and BLW2018) compared to the younger wine (BLW2019), where the retention of these compounds was much higher. This fact can be explained by the existence of stronger bonds between anthocyanins and other nucleophilic molecules that are established over the time of wine aging, compared to the bonds existing in younger wines, which are essentially bonds between anthocyanins and tannins. According to Cameira-dos-Santos et al. [34], condensation between anthocyanins and nucleophilic molecules, other than tannins, takes place over the course of wine aging, although the new wine pigments reported may also arise from the degradation of intermediate tannin–anthocyanin complexes.
The results for the colored anthocyanins, color intensity and color hue from the three red wines submitted to cross-flow and membrane plate filtrations are shown in Figure 4.
Regarding the colored anthocyanins, the results obtained generally followed the same trend as already observed for the total anthocyanins (Figure 3). Nevertheless, these results were only slightly reflected in the color intensity changes. However, except for the BLW2018 wine filtered by membrane plate filtration with a color intensity reduction of 5.3%, the drop in wine color intensity after filtration was not statistically different (a reduction not exceeding 1.1%). Different tendencies were reported by other authors. Salazar et al. [35] reported a decrease in color intensity after filtration but with little effect on the reduction in phenolic compounds when using different cross-flow microfiltration membranes, especially the use of a hybrid process comprising column adsorption and cross-flow microfiltration. In addition, according to other authors, cross-flow microfiltration produces a significant retention of the colloidal compounds responsible for the color of red wines, which is higher than conventional techniques [7,10,13]. Finally, in terms of color hue, no significant changes were detected in any of the red wines as a result of the two different filtration techniques studied.
With regard to the chromatic characteristics of the wines, we obtained a generally minor difference in the different coordinates using the CIELab coordinates (Table 2).
Thus, for the three wines, the L* coordinate (lightness) showed a slight increase in value after filtration, while the a* coordinate (which essentially represents the red color) showed a general decrease in value that was induced by the wine filtration, which was more evident for the wines submitted to membrane plate filtration.
The increase in the lightness values of all filtered wines followed the same trend obtained for the turbidity. In fact, a reduction in wine turbidity induced an increase in wine clarification and, consequently, higher lightness values could be quantified. On the other hand, the results for the a* coordinate also confirm the data already shown for the colored anthocyanins and especially for color intensity (Figure 4).
For the b* values (which represents the yellow/blue color), no significant differences between unfiltered and filtered wines were detected in the BLW2019 wine, which supported the results obtained for color hue. However, for the TN2018 and BLW2018 wines, an increase in b* value for both filtered wines was detected. This result could be explained by the eventual oxidation of these wines during both types of filtration, which was not detected by the increase in color hue results shown in Figure 4. In fact, it is well known that the use of CIELab coordinates is more sensitive to subtle changes in wine chemistry and that they are a more accurate representation of wine color. For coordinate c*, the values remained practically constant between filtered and unfiltered wines, independent of the filtration technique used. However, the TN2018 wine was an exception because when this wine was submitted to membrane plate filtration, it showed significantly lower values compared to the remaining wines (unfiltered and filtered by cross-flow microfiltration).
Finally, the values obtained for the total color difference (∆E) between the unfiltered and filtered wines showed that, in all cases, ∆E values were less than 3 CIELab units (values ranging from 0.46 to 2.35 CIELab units, Table 2) and that all chromatic modifications were potentially not detectable by human eyes [36]. According to Martinez-Lapuente et al. [12], the different grape varieties that are used and the previous winemaking options are the main variables responsible for the diverse impacts of different clarification techniques on wine quality. Thus, these points could help us to explain the diversity of the results obtained in our work with respect to color changes in the three different red wines studied.

3.4. Changes in Monomeric Anthocyanins

With respect to the impact of the two different filtration techniques on monomeric anthocyanins, in general, there was a decrease in anthocyanin values in the filtrated wines compared to the unfiltered wines (Table 3). Specifically for the 3-monoglucosides group, the two different filtration technologies studied did not induce different decreases in the content of this anthocyanin group for the BLW2018 and BLW2019 wines. For these two wines, anthocyanin reduction varied between 4.7 and 5.0% for the BLW2018 wine and between 7.6 and 8.9% for the BLW19 wine. However, for the TN2018 wine, the use of membrane plate filtration induced a significant decrease in the 3-monoglucoside group (a reduction of 25.9%) compared to the same wine submitted to cross-flow microfiltration (a reduction of 6.5%). For the 3-acetylglucosides group, membrane plate filtration induced a significantly higher reduction for the BLW2018 wine (a decrease of 16.1%). However, for the remaining two wines (TN2018 and BLW2019 wines), both filtration techniques showed similar impacts on the retention of the 3-acetylglucosides group. Finally, for the 3-coumaryglucosides group, a clearer impact of the two filtration techniques was only detected for the BLW2019 wine. Thus, the wine submitted to cross-flow microfiltration showed a significantly higher reduction (a decrease of 19.7%) compared to the wine submitted to membrane plate filtration (a decrease of 1.1%).
Previously, Gonçalves et al. [37] reported a higher retention coefficient for coumaroyl derivates compared to the other anthocyanin forms. In addition, Vieira et al. [38] reported the impact of different filtration membranes according to their textural surface properties on anthocyanin pigment retention. Thus, in ethanolic jussara extracts, these authors described different selective retentions between different cyanidin forms (3-rutinoside and 3-glucoside). Consequently, it appears that there is a selectivity in the retention of some forms of anthocyanins during the filtration process. This trend was also demonstrated previously by Cameira-dos-Santos et al. [31], where they detected a high content of malvidin derivative forms in the fouling material analyzed after to submitting a red wine to cross-flow microfiltration.

3.5. Changes in Tanning Power and Fractions of Proanthocyanidins

Table 4 shows the impact of the two different filtration techniques on the tanning power of the three red wines studied. Tannicity refers to the expression of the astringency perception of a wine; namely, the capacity that some phenolic compounds, such as tannins, have to interact with salivary proteins, thereby influencing the astringent character of the wine in taste. All three red wines used in this work showed a tendency for a reduction in tannicity values after the filtration process. This decrease was particularly significant for the two wines with the highest initial tanning power values (TN2018 and BLW2018 wines) when submitted to membrane plate filtration. For these wines, a decrease of between 10.7 and 27.2% was detected compared to the respective unfiltered wines. For the BLW2019 wine, the opposite tendency was found, i.e., the highest tanning power reduction was detected for the wine when summitted to cross-flow microfiltration. These results follow the same tendency detected for the different fractions of proanthocyanidins, also shown in Table 4. Thus, the highest significant proanthocyanidin content decrease was detected for the TN2018 and BLW2018 wines submitted to membrane plate filtration for all proanthocyanidin fractions. In these wines, the highest percentage decrease compared to the unfiltered wines was detected for the monomeric fraction, where the reductions varied between 30 and 31%. This fraction is fundamentally composed of (+)-catechins and (-)-epicatechins, one of the main compounds responsible for the astringency sensation [39]. For these two wines, the oligomeric fraction decreased between 12 and 14%, while for the polymeric fraction a decrease of between 3.6 and 5.3% was detected compared to the unfiltered wines. Finally, for the BLW2019 wine, the decrease in the different fractions of proanthocyanidins occurred fundamentally in the wine submitted to cross-flow microfiltration. The decrease ranged between 8.0 (for the polymeric fraction) and 15.4% (for the monomeric fraction). This tendency followed the same tendency that was also detected for the tanning power. According to Oberholster et al. [40], the decrease in proanthocyanidin content could result in a reduction in the overall astringency of the wine.
Martinez-Lapuente et al. [12] reported that cross-flow microfiltration showed the most significant effect on the reduction in proanthocyanidin content for different varieties of red wines made from Tempranillo, Graciano and Garnacha grapes. In that case, according to these authors, this could be due to the use of a membrane with a non-adequate polarity. For Vernhet and Moutounet [41], membrane polarity has a strong impact on polyphenol deposition (the amounts, nature of the deposited molecules and reversibility of the deposit), while polysaccharide deposition is not influenced by membrane polarity. Similarly, several authors found that the degree of the polymerization of the proanthocyanidins, besides their composition, affects the interaction between proteins and tannins and, consequently, affects the wine filtration [42,43]. As well as chain length, the nature of the flavanol subunits of the condensed tannins may be important in determining the interactions with proteins [44] and their involvement in the fouling filter material during the cross-flow microfiltration and membrane plate filtration. In addition, it is important to note that there are also complex polymerization and depolymerization reactions during wine aging and their incorporation into larger polymeric phenols or pigments is mediated by several oak wood phenolic compounds that are extracted [10,45]. These reactions could occur especially in older wines, as well as precipitation, which could help to explain the different impacts of the two filtration techniques, particularly between the two wines produced in 2018 (TN2018 and BLW2018) and the wine produced in 2019 (BLW2019). The wines produced in 2018 showed the most remarkable decrease in proantohcyanidin content after filtration, especially with membrane plate filtration.

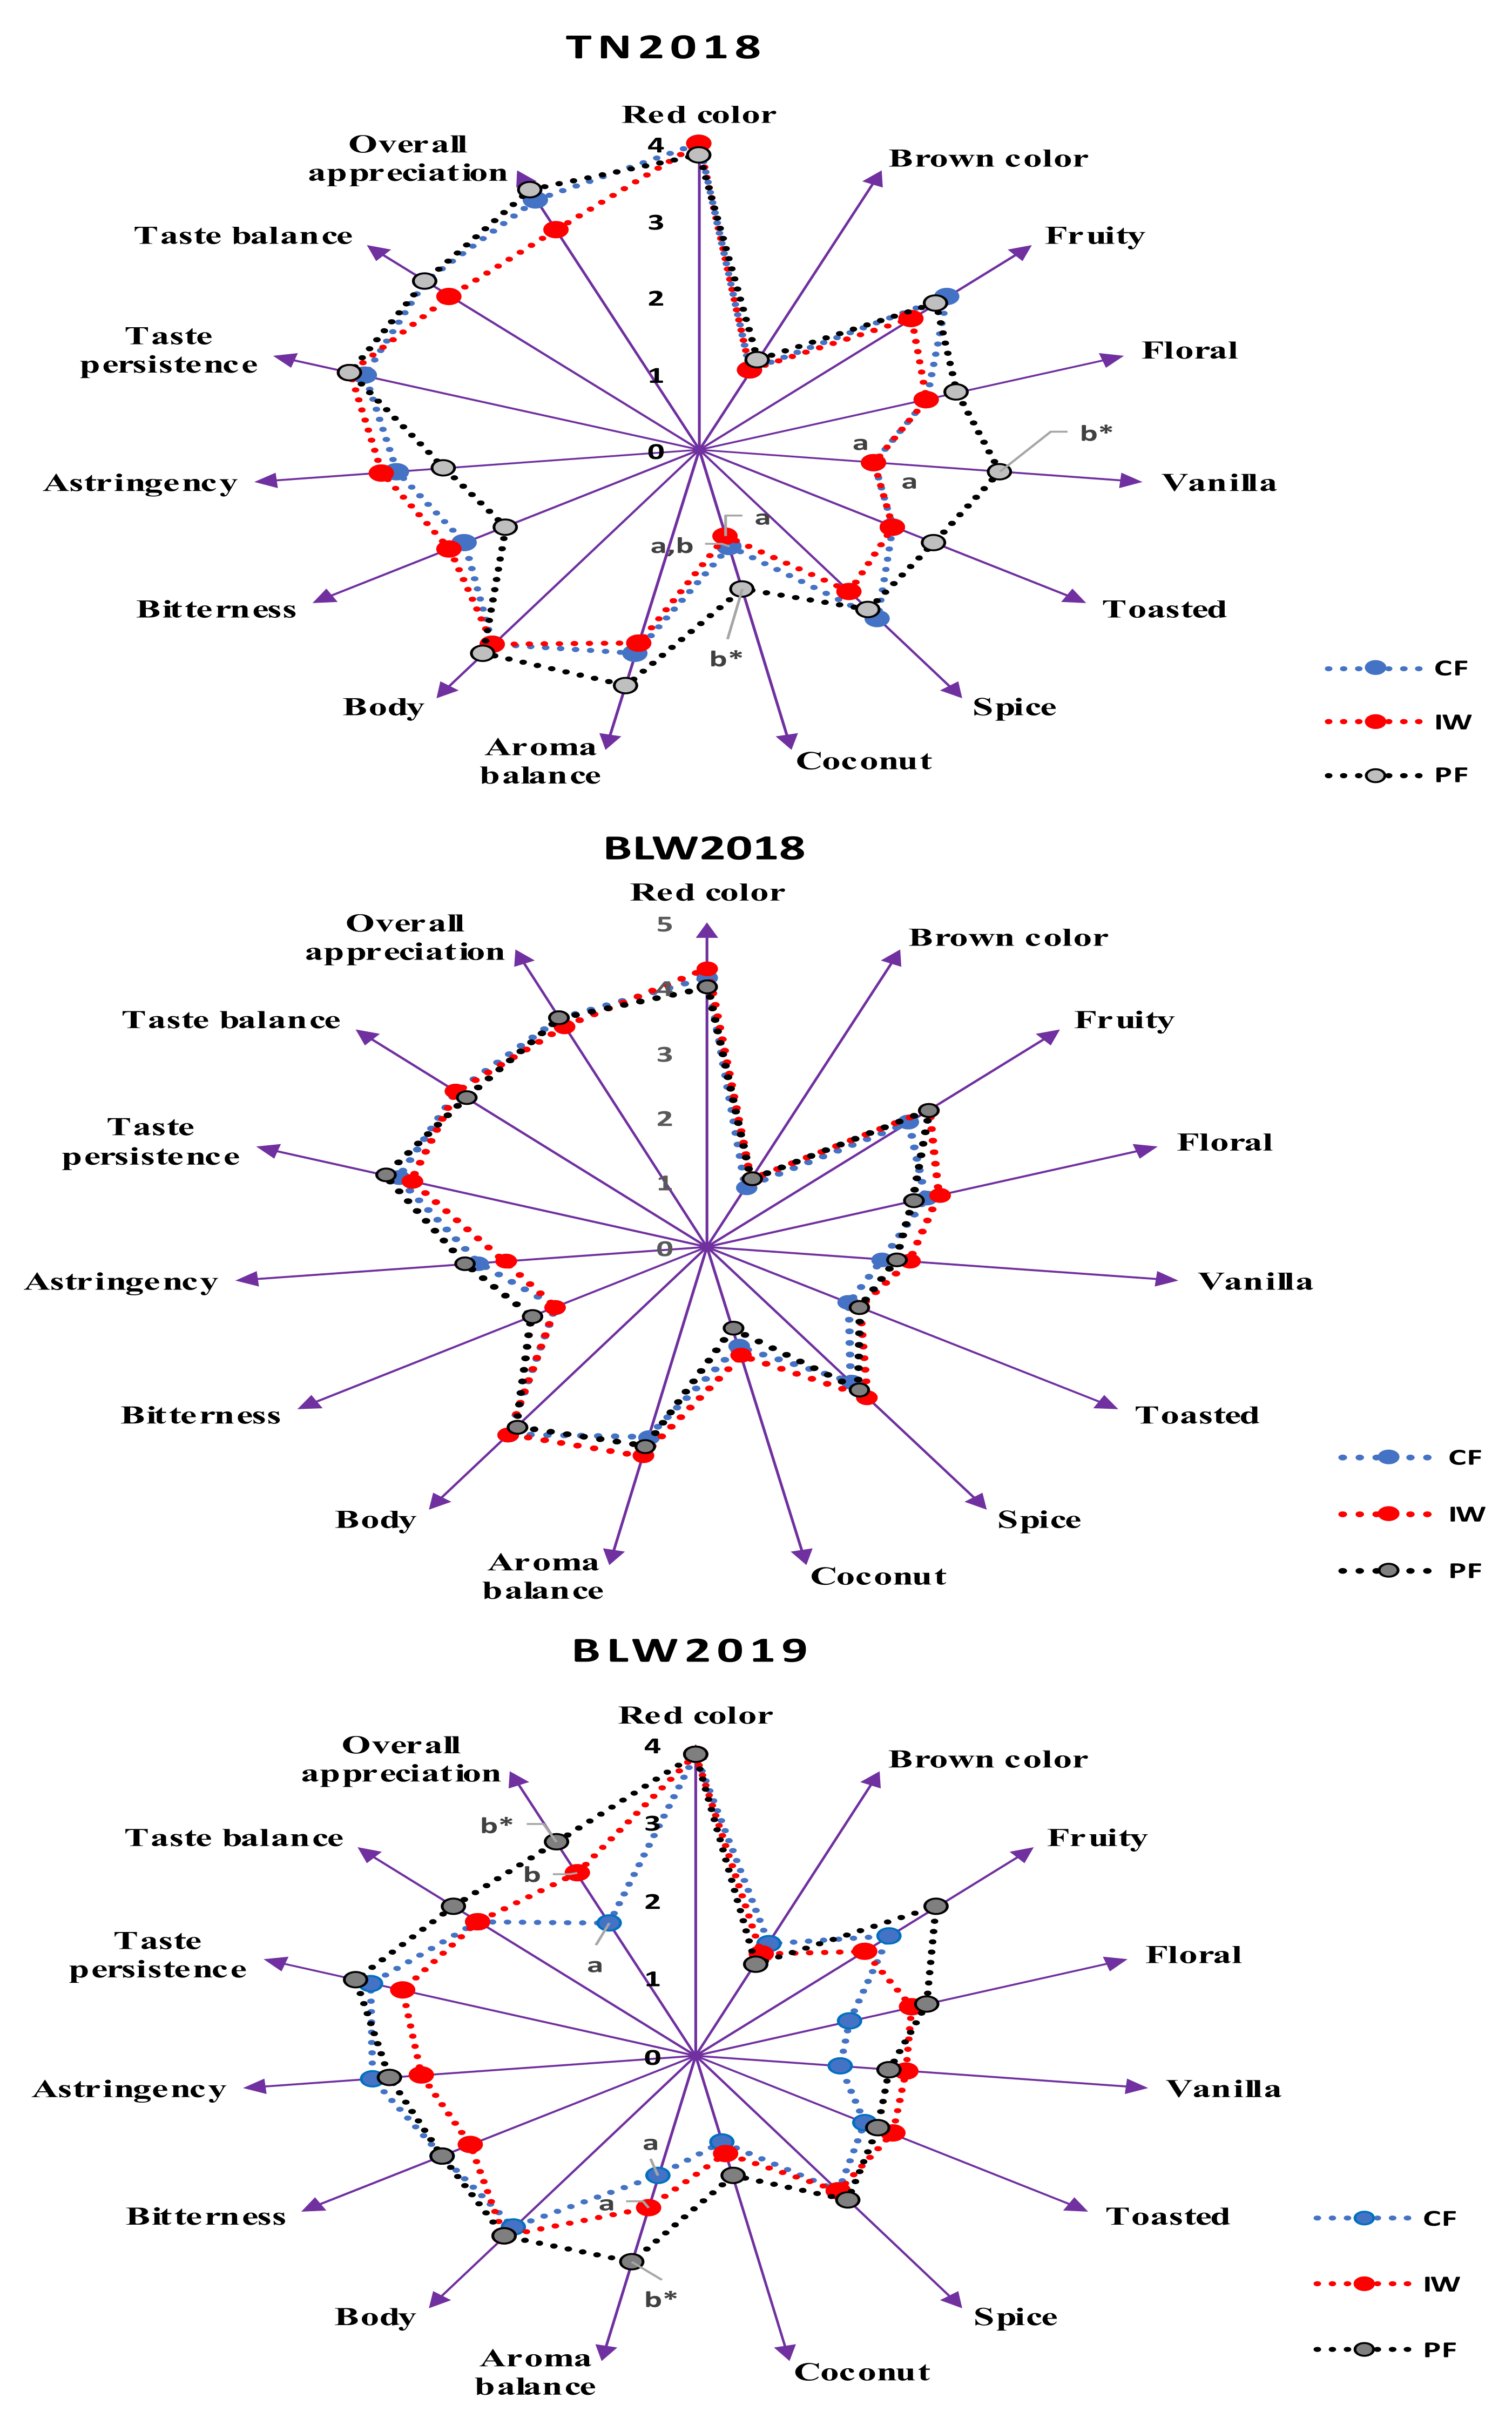
3.6. Sensory Evaluation

Figure 5 shows the spider diagrams obtained from the sensory analysis of the different red wines submitted to the two filtration techniques. The two filtration techniques studied were induced to obtain different results for the red wines used. Thus, for the TN2018 wine, the most marked sensory differences were related to two aromas (“vanilla” and “coconut”) and two taste descriptors (“bitterness” and “astringency”). It is important to note that this wine had previous contact with oak wood chips, therefore the two aromatic descriptors most related to oak wood showed the greater score variation. The results show that wine submitted to membrane plate filtration maintained the more noticeable aromatic character of oak wood. In addition, the results obtained for the “astringency” and “bitterness” show that wine filtered by membrane plate filtration had the lowest scores, however, without a statistical difference. This result followed a similar tendency to that already observed for the tanning power (Table 4). For the remaining descriptors and for the overall appreciation, the two filtration techniques did not induce a clear differentiation between the TN2018 wines.
The scores obtained for the BLW2018 wines were very similar, including those for the unfiltered wine. In fact, the two different filtration techniques did not affect the sensory profile of these wines. Finally, for the BLW2019 wines, the significant sensory differences were related to the “aroma balance” and “overall appreciation” descriptors. In those cases, the wine submitted to membrane plate filtration and the unfiltered wine showed significantly higher scores compared to the same wine submitted to the cross-flow microfiltration.
The results obtained indicate that the impact of the two types of filtrations on the sensory characteristics of the wines was heterogeneous, with no clear trend of differentiation between the wines depending on the type of filtration process. Thus, the data obtained in this research point out that the initial characteristics of the wines could play an important role in the impact of the type of filter used. In fact, several works reported different conclusions about the impact of filtration techniques on the sensory profile of wine. While several authors [8,9,13,26] reported that filtration, including cross-flow microfiltration, did not induce significant differences in aroma intensity, astringency, body or color of the wines, other researchers [12] reported that cross-flow microfiltration produced a higher retention of proanthocyanidins in red wines, which reduced the body and astringency. Oberholster et al. [10] reported only a slightly higher perception of astringency for the control wine compared to the same wine submitted to different clarification techniques, including cross flow-microfiltration. However, Prodanov et al. [25] described the opposite tendency for white wines. According to these authors, the most relevant impact of cross-flow microfiltration is in sensory properties, namely producing a noticeable decrease in the global aroma quality and intensity, which is expressed mainly with loss of fruitiness. In addition, other authors reported results where wines presented significant changes in color and phenolic profile after filtration [7]. However, it was not clear whether changes in phenolic compound concentration were great enough to be detected sensorially, especially for red wines. Finally, it is important to note that winemakers usually expend significant efforts to maximize the majority of sensory characteristics (aroma and taste) especially influenced by the clarification techniques.

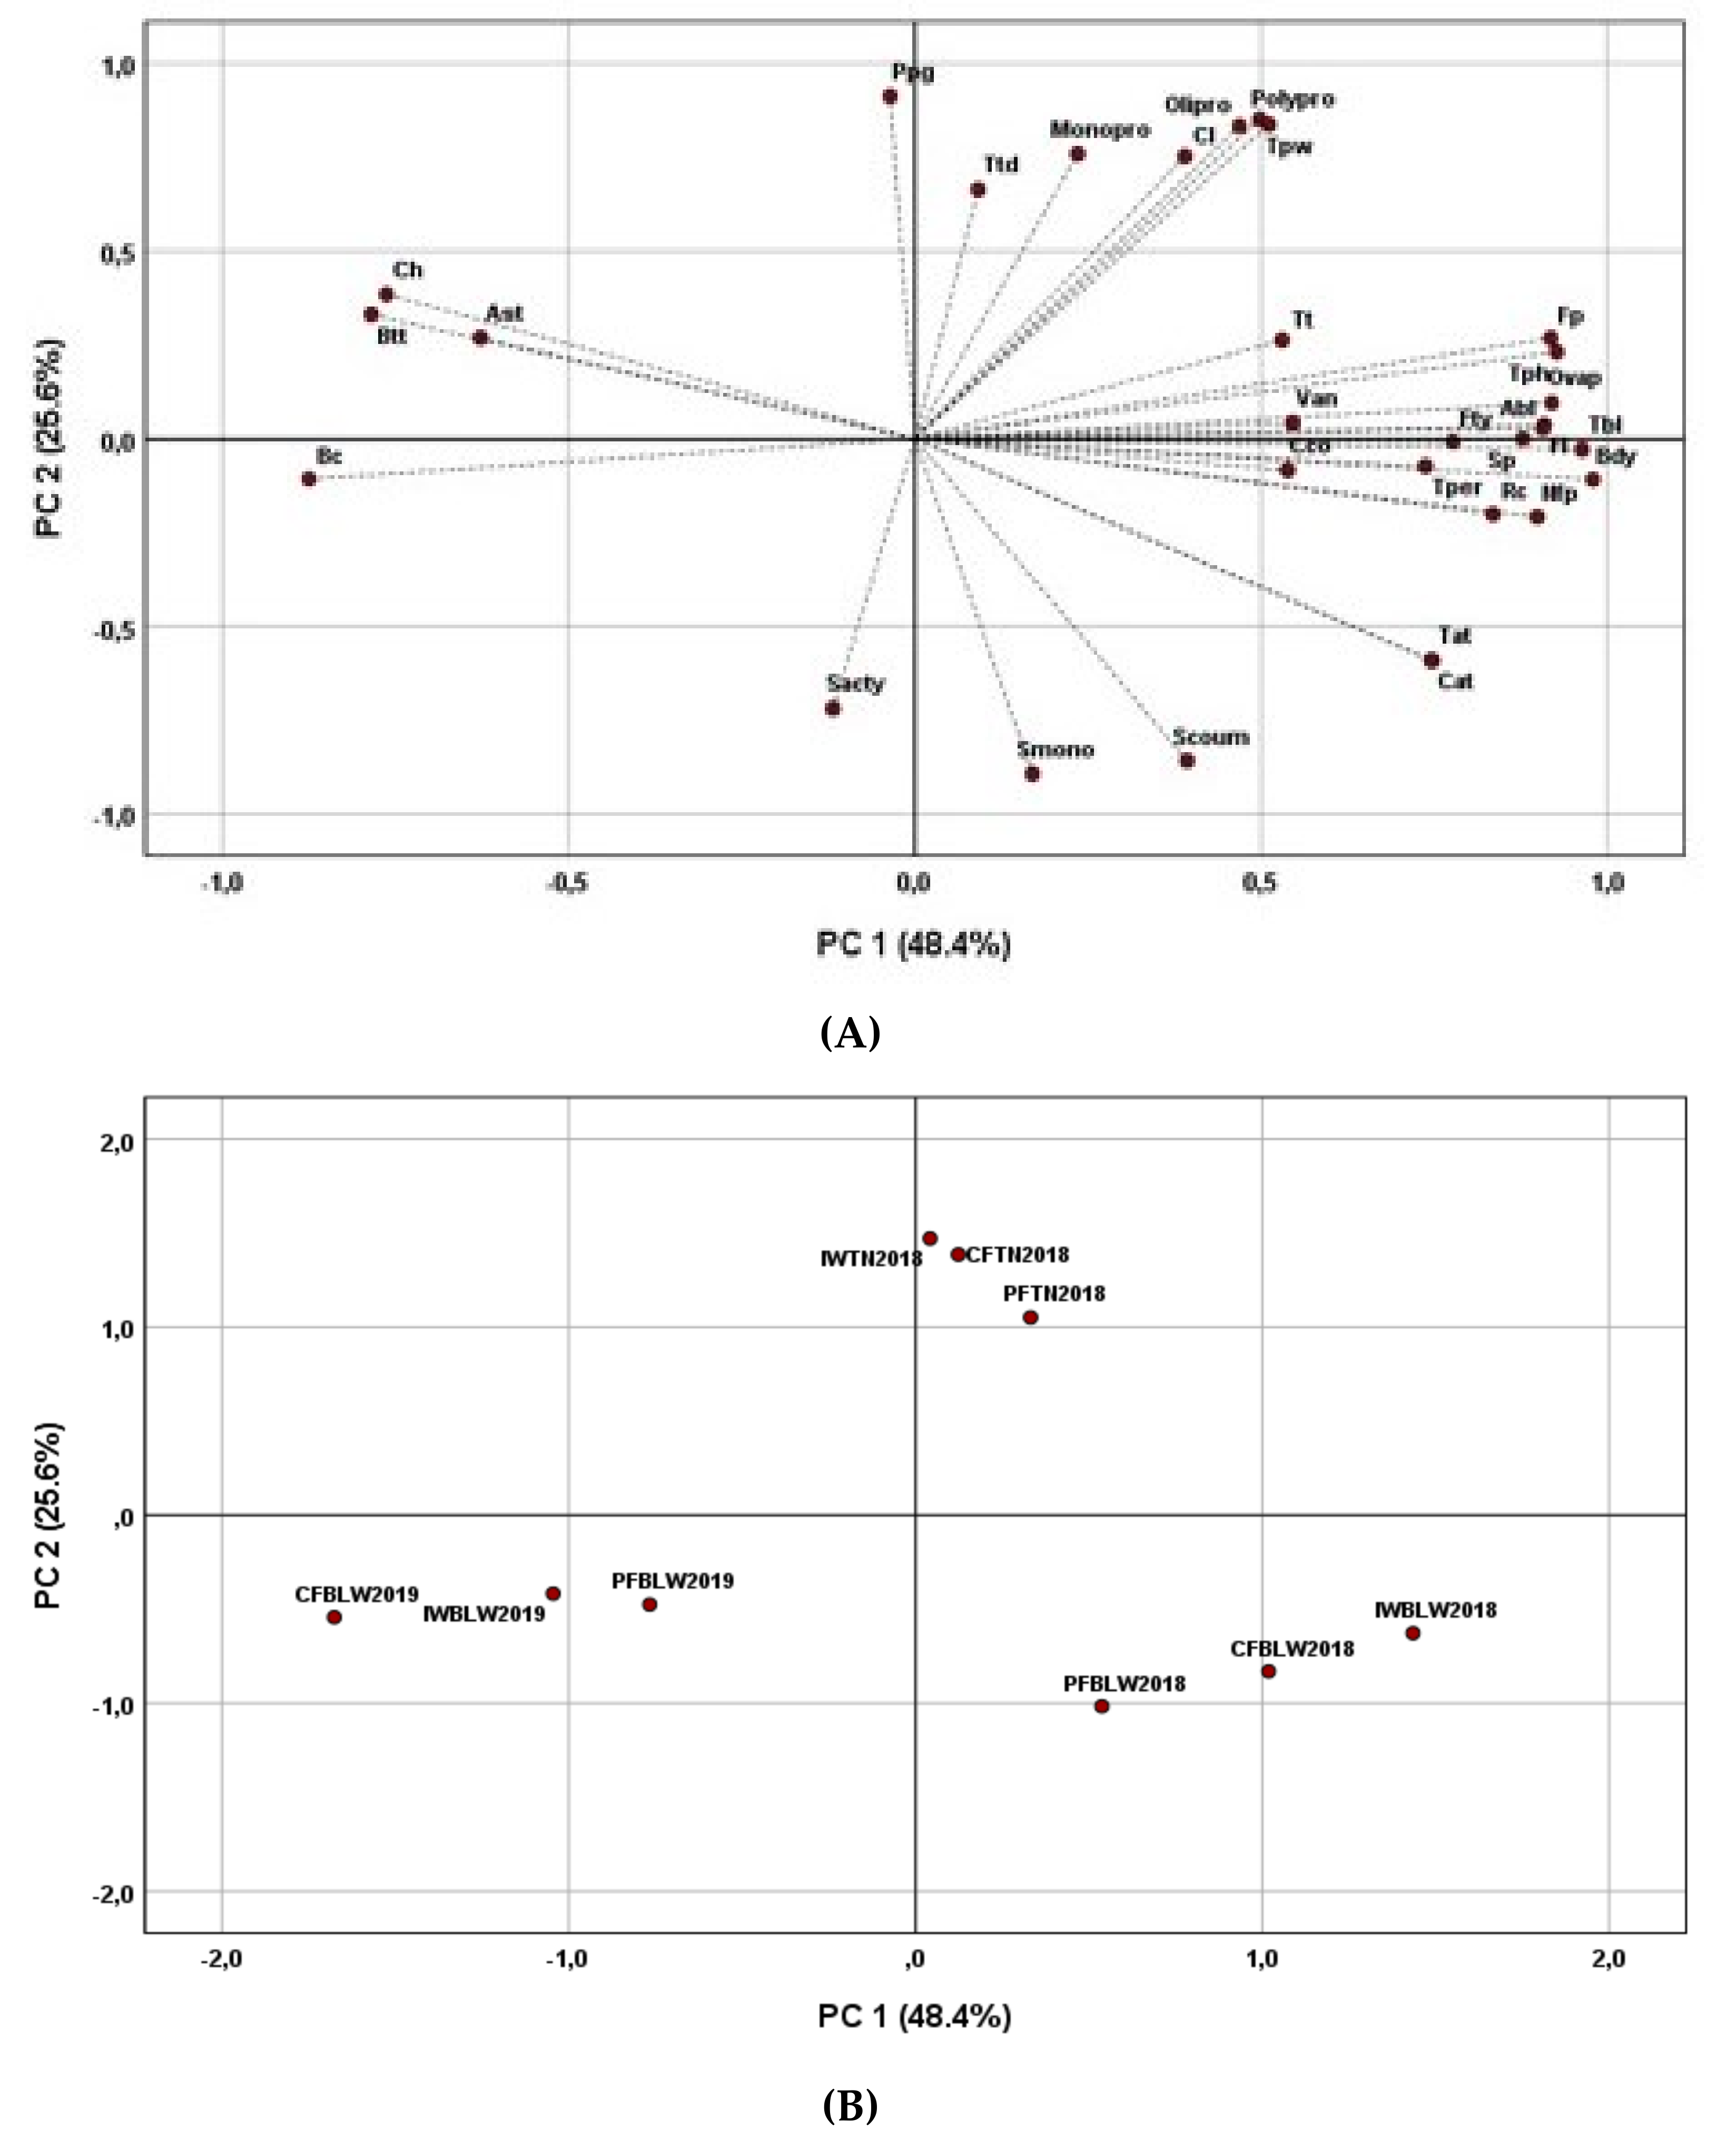
3.7. Principal Components Analysis Applied to Wine Phenolic and Sensory Characterization

To better understand the relationship between the use of different filtration techniques, chemical composition (global phenolic parameters, chromatic characteristics, monomeric anthocyanins and fractions of proanthocyanidins) and the sensorial attributes of the red wines studied, a principal component analysis (PCA) was performed. The PCA was carried out to obtain a reduced number of the linear combinations of variables that explain the great variability in the data. Thus, a PCA was calculated on 31 initial variables from the chemical and sensory parameters. The corresponding loading plots that established the relative importance of each variable are shown in Figure 6.
The PCA showed that the first two principal components (PCs) explained 74.0% of the total variance. The projections of the analyzed variables in the PCs were the weighted sum of the original variables and are shown in Figure 6A. The first PC (PC1, 48.4% of the variance) was positively correlated with all initial variables, except for three sensory attributes (“brown color”, “bitterness” and “astringent”) and the color hue. The second PC (PC2, 25.6% of the variance) was positively correlated with several phenolic parameters (polymeric pigments, color intensity, tanning power and different fractions of proanthocyanidins) and the “toasted” sensory descriptor. However, this second PC was negatively correlated with the total anthocyanins, colored anthocyanins and different groups of monomeric anthocyanins.
Figure 6B presents a spatial distribution of the red wines submitted to the two filtration processes (cross-flow microfiltration and membrane plate filtration) and of the control wines (unfiltered wines) in relation to the different parameters that were considered. After a cluster analysis, three different groups were formed. One group comprised red wines produced from the Touriga Nacional variety (TN2018). These wines were positively related to polymeric pigments, color intensity and different fractions of proanthocyanidins. Another group comprised the blended wines from 2019 (BLW2019). In that case, the wines were positively related with the “brown color”, “bitterness” and “astringent” sensory descriptors and also with color hue. Finally, a third group comprised the blended wines from 2018 (BLW2018), which were positively related to the total anthocyanins, colored anthocyanins and different groups of monomeric anthocyanins. All of these results demonstrate that the two types of filtration studied did not induce a clear differentiation between the wines in terms of their composition and sensory profile. The type of wine, in terms of the grape varieties used, was the determining factor in the differentiation between the three red wines studied.

4. Conclusions

Wine producers expend significant efforts during wine production to manage the impacts and costs of filtration. These efforts are not currently based on an understanding of the underlying compositional parameters of each wine, but rather on a standardized approach.
This research points out evidence that the impact of the two filtration techniques studied (cross-flow microfiltration and membrane plate filtration) under winery-scale conditions on wine characteristics are very dependent on the initial wine composition and not only on the filtration process itself. In fact, the results obtained indicate that the impact of the two filtration technologies was heterogenous for several of the phenolic parameters and chromatic characteristics studied, with no clear trend of differentiation between wines according to the type of filtration to which they were subjected. A similar tendency was also obtained for the sensory profiles of the different wines. In that case, the impact of filtration was only significant for very few aroma descriptors and only for two of the three wines studied. However, the results obtained during this research clearly show that both filtration techniques produced a substantial reduction in turbidity values and, consequently, an increase in wine clarification.
Finally, it can be concluded that the outcomes of our study could be of practical interest to winemakers, allowing them to make better use of different filtration techniques and to have a perspective as to how different red wines can change when submitted to filtration, especially when using the techniques studied.
Phenolic parameters: Tph, total phenols; Nfp, no flavonoid phenols; Fp, flavonoid phenols; Tt, total tannins; Tat, total anthocyanins; Ppg, polymeric pigments; Cat, colored anthocyanins; CI, color intensity; Ch, color hue; Smono, ∑ monoglucoside; Sacty, ∑ acetylglucoside; Scoum, ∑ coumarylglucoside; Tpw, tanning power; Monopro, monomeric proanthocyanidins; Olipro, oligomeric proanthocyanidins; Polypro, polymeric proanthocyanidins.
Sensory parameters: Rc, red color; Bc, brown color; Fty, fruity; Fl, floral; Van, vanilla; Ttd, toasted; Sp, spice; Cco, coconut; Abl, aroma balance; Bdy, body; Btt, bitterness; Ast, astringency; Tper, taste persistence; Tbl, taste balance; Ovap, overall appreciation.
Wines codes: IWTN2018, unfiltered wine produced from Touriga Nacional grape variety in 2018; CFTN2018, wine filtered by cross-flow microfiltration produced from Touriga Nacional grape variety in 2018; PFTN2018, wine filtered by plate filtration produced from Touriga Nacional grape variety in 2018; IWBLW2018, unfiltered wine produced from a blend containing Touriga Nacional, Tinta Roriz, Alfrocheiro and Jaen grape varieties in 2018; CFBLW2018, wine filtered by cross-flow microfiltration produced from a blend containing Touriga Nacional, Tinta Roriz, Alfrocheiro and Jaen grape varieties in 2018; PFBLW2018, wine filtered by plate filtration produced from a blend containing Touriga Nacional, Tinta Roriz, Alfrocheiro and Jaen grape varieties in 2018; IWBLW2019, unfiltered wine produced from a blend containing Baga and Tinta Pinheira grape varieties in 2019; CFBLW2019, wine filtered by cross-flow microfiltration produced from a blend containing Baga and Tinta Pinheira grape varieties in 2019; PFBLW2019, wine filtered by plate filtration produced from a blend containing Baga and Tinta Pinheira grape varieties in 2019.

Author Contributions

Conceptualization, M.O. and A.M.J.; methodology, M.O., A.C.C. and A.M.J.; validation, M.O.; A.C.C. and A.M.J.; formal analysis, M.R., A.C.C. and A.M.J.; investigation, M.O. and A.M.J.; resources, M.O. and A.M.J.; writing—original draft preparation, M.R., A.C.C. and A.M.J.; supervision and writing—review and editing, A.M.J.; project administration, M.O. and A.M.J.; funding acquisition, A.M.J. All authors have read and agreed to the published version of the manuscript.

Funding

Partial financial support from the Chemistry Center of Vila Real by FCT-UIDB/00616/2020.

Data Availability Statement

Not applicable.

Acknowledgments

The authors would like to thank the Silgueiros Cooperative Winery (Viseu, Portugal) for the use of their facilities in the winery-scale filtration essays and the Chemistry Center of Vila Real (FCT-UIDB/00616/2020) for the partial financial support of this work.

Conflicts of Interest

The authors declare no conflict of interest.

References

  1. El Rayess, Y.; Mietton-Peuchot, M. Membrane technologies in wine industry: An Overview. Crit. Rev. Food Sci. Nutr. 2016, 56, 2005–2020. [Google Scholar] [CrossRef] [PubMed]
  2. Vernhet, A. Red wine clarification and stabilization. In Red Wine Technology, 1st ed.; Morata, A., Ed.; Elsevier Academic Press: London, UK, 2019; pp. 237–251. [Google Scholar]
  3. El Rayess, Y.; Manon, Y.; Jitariouk, N.; Albasi, C.; Mietton-Peuchot, M.; Devatine, A.; Fillaudeau, L. Wine clarification with rotating and vibrating Filtration (RVF): Investigation of the impact of membrane material, wine composition and operating conditions. J. Membr. Sci. 2016, 513, 227–244. [Google Scholar] [CrossRef] [Green Version]
  4. Czekaj, P.; Lopez, F.; Guell, C. Membrane fouling during microfiltration of fermented beverages. J. Membr. Sci. 2000, 166, 199–212. [Google Scholar] [CrossRef]
  5. Vernhet, A.; Cartalade, D.; Moutounet, M. Contribution to the understanding of fouling build-up during microfiltration of wines. J. Membr. Sci. 2003, 211, 357–370. [Google Scholar] [CrossRef]
  6. Ulbricht, M.; Ansorge, W.; Danielzik, I.; Koenig, M.; Schuster, O. Fouling in microfiltration of wine: The influence of the membrane polymer on adsorption of polyphenols and polysaccharides. Sep. Purif. Technol. 2009, 68, 335–342. [Google Scholar] [CrossRef]
  7. Buffon, P.; Heyman, H.; Block, D. Sensory and chemical effects of cross-flow filtration on white and red wines. Am. J. Enol. Vitic. 2014, 65, 305–314. [Google Scholar] [CrossRef]
  8. Peri, C.; Riva, M.; Decio, P. Cross-flow membrane filtration of wines—Comparison of performance of ultrafiltration, microfiltration, and intermediate cutoffs membranes. Am. J. Enol. Vitic. 1988, 39, 162–168. [Google Scholar]
  9. Sims, C.A.; Bates, R.P.; Johnson, R.P. Comparison of pre-fermentation and post-fermentation ultrafiltration on the characteristics of sulfited and nonsulfited white wines. Am. J. Enol. Vitic. 1990, 41, 182–185. [Google Scholar]
  10. Oberholster, A.; Carstens, L.M.; du Toit, W.J. Investigation of the effect of gelatine, egg albumin and cross-flow microfiltration on the phenolic composition of Pinotage wine. Food Chem. 2013, 138, 1275–1281. [Google Scholar] [CrossRef]
  11. Arriagada-Carrazana, J.P.; Saez-Navarrete, C.; Brodeu, E. Membrane filtration effects on aromatic and phenolic quality of Cabernet Sauvignon wines. J. Food Eng. 2005, 68, 363–368. [Google Scholar] [CrossRef]
  12. Martínez-Lapuente, L.; Guadalupe, Z.; Ayestarán, B. Effect of egg albumin fining, progressive clarification and cross-flow microfiltration on the polysaccharide and proanthocyanidin composition of red varietal wines. Food Res. Int. 2017, 96, 235–243. [Google Scholar] [CrossRef] [PubMed]
  13. Palacios, V.M.; Caro, I.; Pérez, L. Comparative study of crossflow microfiltration with conventional filtration of sherry wines. J. Food Eng. 2002, 54, 95–102. [Google Scholar] [CrossRef]
  14. McRae, J.M.; Mierczynska-Vasilev, A.; Soden, A.; Barker, A.M.; Day, M.P.; Smith, P.A. Effect of commercial-scale filtration on sensory and colloidal properties of red wines over 18 months bottle aging. Am. J. Enol. Vitic. 2017, 68, 263–274. [Google Scholar] [CrossRef]
  15. Ribéreau-Gayon, P.; Glories, Y.; Maujean, A.; Dubourdieu, D. Handbook of Enology: The Chemistry of Wine Stabilisation and Treatments, 2nd ed.; John Wiley & Sons Ltd.: Chichester, UK, 2006; p. 497. [Google Scholar]
  16. Kramling, T.E.; Singleton, V.L. An estimate of the non-flavonoid phenols in wines. Am. J. Enol. Vitic. 1969, 20, 86–92. [Google Scholar]
  17. Somers, T.C.; Evans, M.E. Spectral evaluation of young red wines: Anthocyanin equilibria, total phenolics, free and molecular SO2, chemical age. J. Sci. Food Agric. 1977, 28, 279–287. [Google Scholar] [CrossRef]
  18. Ribéreau Gayon, P.; Stonestreet, E. Le dosage des tannins du vin rouge et la détermination de leur structure. Chim. Anal. 1966, 48, 188–196. [Google Scholar]
  19. De Freitas, V.; Mateus, N. Structural features of procyanidin interactions with salivary proteins. J. Agric. Food Chem. 2001, 49, 940–945. [Google Scholar] [CrossRef] [PubMed]
  20. O.I.V. International Oenological Codex; O.I.V.: Paris, France, 2014. [Google Scholar]
  21. Sun, B.S.; Leandro, C.; Ricardo-da-Silva, J.M.; Spranger, I. Separation of grape and wine proanthocyanidins according to their degree of polymerization. J. Agric. Food Chem. 1998, 46, 1390–1396. [Google Scholar] [CrossRef]
  22. Sun, B.S.; Ricardo-da-Silva, J.M.; Spranger, I. Critical factors of vanillin assay for catechins and proanthocyanidins. J. Agric. Food Chem. 1998, 46, 4267–4274. [Google Scholar] [CrossRef]
  23. Dallas, C.; Laureano, O. Effects of pH, sulphur dioxide, alcohol content, temperature and storage time on colour composition of a young portuguese red table wine. J. Sci. Food Agric. 1994, 65, 477–485. [Google Scholar] [CrossRef]
  24. Parr, W.V.; Heatherbell, D.; White, K.G. Demystifying wine expertise: Olfactory threshold, perceptual skill, and semantic memory in expert and novice wine judges. Chem. Senses 2002, 27, 747–755. [Google Scholar] [CrossRef]
  25. Prodanov, M.P.; Aznar, M.; Cabellos, J.M.; Vacas, V.; López, F.; Hernández, M.T.; Estrella, M.I. Tangential-flow membrane clarification of Malvar (Vitis vinifera L.) wine: Incidence on chemical composition and sensorial expression. OENO One 2019, 53, 725–739. [Google Scholar] [CrossRef]
  26. Serrano, M.; Pontens, B.; Ribéreau-Gayon, P. Etude de différentes membranes de microfiltration tangentielle. Comparaison avec la filtration sur précouche de diatomées. OENO One 1992, 26, 97–116. [Google Scholar] [CrossRef]
  27. Vernhet, A.; Pellerin, M.P.; Belleville, J.; Planqueand, J.; Moutounet, M. Relative impact of major wine polysaccharides on the preformances of an organic microfiltration membrane. Am. J. Enol. Vitic. 1999, 50, 51–56. [Google Scholar]
  28. El Rayes, Y.; Albasi, C.; Bacchin, P.; Taillandier, P.; Raynal, J.; Mietton-Peuchot, M.; Devatine, A. Cross-flow microfiltration applied to oenology: A review. J. Membr. Sci. 2011, 382, 1–19. [Google Scholar] [CrossRef] [Green Version]
  29. Czekaj, P.; Lopez, F.; Guell, C. Membrane fouling by turbidity constituents of beer and wine: Characterization and prevention by means of infrasonic pulsing. J. Food Eng. 2001, 49, 25–36. [Google Scholar] [CrossRef]
  30. El Rayess, Y.; Albasi, C.; Bacchin, P.; Taillandier, P.; Mietton-Peuchot, M.; Devatine, A. Analysis of membrane fouling during cross-flow microfiltration of wine. Innov. Food Sci. Emerg. Technol. 2012, 16, 398–408. [Google Scholar] [CrossRef] [Green Version]
  31. Cameria-dos-Santos, P.J.; Cheynier, V.; Brillouet, J.-M.; Cadot, Y.; Escudier, J.L.; Roesink, H.D.V.; Moutonet, M. Cross-flow filtration of wines with polymeric: The influence of winemaking technology and back pulse on the fouling process. Prehrambeno Technol. Biotehnol. Rev. 1994, 32, 77–83. [Google Scholar]
  32. Monagas, M.; Bartolomé, B.; Gomez-Cordovés, C. Evolution of polyphenols in red wines from Vitis vinifera L. during aging in the bottle. Eur. Food Res. Technol. 2005, 220, 331–340. [Google Scholar] [CrossRef]
  33. Oliveira, J.; De Freitas, V.; Mateus, N. Polymeric pigments in red wines. In Book Red Wine Technology; Morata, A., Ed.; Elsevier Academic Press: London, UK, 2019; pp. 207–218. [Google Scholar]
  34. Cameria-dos-Santos, P.J.; Brillouet, J.-M.; Cheynier, V.; Moutounet, M. Detection and partial characterization of new anthocyanin-derived pigments in wine. J. Sci. Food Agric. 1996, 70, 204–208. [Google Scholar] [CrossRef]
  35. Salazar, F.N.; de Bruijn, J.P.F.; Seminarion, L.; Güell, C.; López, F. Improvement of wine crossflow microfiltration by a new hybrid process. J. Food Eng. 2007, 79, 1329–1336. [Google Scholar] [CrossRef]
  36. Martínez, J.A.; Melgosa, M.; Pérez, M.M.; Hita, E.; Negueruela, A.I. Visual and instrumental color evaluation in red wines. Food Sci. Technol. Int. 2001, 7, 439–444. [Google Scholar] [CrossRef]
  37. Gonçalves, F.; Rocha, S.M.; Coimbra, M.A. Study of the retention capacity of anthocyanins by wine polymeric material. Food Chem. 2012, 134, 957–963. [Google Scholar] [CrossRef] [PubMed]
  38. Vieira, G.S.; Moreira, F.K.V.; Matsumoto, R.L.S.; Michelon, M.; Filho, F.M.; Hibinger, M.D. Influence of nanofiltration membrane features on enrichment of Jussara ethanolic extract (Euterpe edulis) in anthocyanins. J. Food Eng. 2018, 226, 31–41. [Google Scholar] [CrossRef]
  39. González-Muñoz, B.; Garrido-Vargar, F.; Pavez, C.; Osorio, F.; Cheny, J.; Bordeu, E.; O’Brien, J.A.; Brossard, N. Wine astringency: More than just tannin-protein interactions. J. Sci. Food Agric. 2021; in press. [Google Scholar] [CrossRef] [PubMed]
  40. Oberholster, A.; Francis, I.; Lland, P.; Waters, E. Mouthfeel of wines made with and without pomace contact and added antohcyanins. Aust. J. Grape Wine Res. 2009, 15, 59–69. [Google Scholar] [CrossRef]
  41. Vernhet, A.; Moutounet, M. Fouling of organic microfiltration membranes by wine constituents: Importance, relative impact of wine polysaccharides and polyphenols and incidence of membrane properties. J. Membr. Sci. 2002, 201, 103–122. [Google Scholar] [CrossRef]
  42. Maury, C.; Sarni-Manchado, P.; Lefebvre, S.; Cheynier, V.; Moutounet, M. Influence of fining with different molecular weight gelatins on proanthocyanindin compostion and perception of wines. Am. J. Enol. Vitic. 2001, 52, 140–145. [Google Scholar]
  43. González-Neves, G.; Favre, G.; Gil, G. Effect of fining on the colour pigment composition of young red wines. Food Chem. 2014, 157, 385–392. [Google Scholar] [CrossRef]
  44. Maury, C.; Sarni-Manchado, P.; Lefebvre, S.; Cheynier, V.; Moutounet, M. Influence of fining with plant proteins proanthocyanidin compostion of red wines. Am. J. Enol. Vitic. 2003, 54, 105–111. [Google Scholar]
  45. Mateus, N.; Silva, A.M.S.; Vercauteren, J.; De Freitas, V. Occurrence of anthocyanin-derived pigments in red wine. J. Agric. Food Chem. 2011, 49, 4836–4840. [Google Scholar] [CrossRef] [PubMed]
Figure 1. The impact of the two different filtration techniques on the turbidity variation values for the three red wines studied. NTU, nephelometric turbidity units; TN2018, the red wine produced from the Touriga Nacional grape variety in 2018; BLW2018, the red wine produced from a blend containing Touriga Nacional, Tinta Roriz, Alfrocheiro and Jaen grape varieties in 2018; BLW2019, the red wine produced from a blend containing Baga and Tinta Pinheira grape varieties in 2019. 1 The percentage of reduction in relation to the unfiltered wine. * The average values with the same letter and for the same red wine are not significantly different (Tukey test, p < 0.05).
Processes 10 00284 g001
Figure 2. The impact of the two different filtration techniques on the total phenols, flavonoid and non-flavonoid phenols variation values for the three red wines studied. TN2018, the red wine produced from the Touriga Nacional grape variety in 2018; BLW2018, the red wine produced from a blend containing Touriga Nacional, Tinta Roriz, Alfrocheiro and Jaen grape varieties in 2018; BLW2019, the red wine produced from a blend containing Baga and Tinta Pinheira grape varieties in 2019. 1 The percentage of reduction in relation to the unfiltered wine. * The average values with the same letter and for the same red wine are not significantly different (Tukey test, p < 0.05).
Processes 10 00284 g002
Figure 3. The impact of the two different filtration techniques on the total tannin, anthocyanin, pigment and polymeric pigment variation values for the three red wines studied. TN2018, the red wine produced from the Touriga Nacional grape variety in 2018; BLW2018, the red wine produced from a blend containing Touriga Nacional, Tinta Roriz, Alfrocheiro and Jaen grape varieties in 2018; BLW2019, the red wine produced from a blend containing Baga and Tinta Pinheira grape varieties in 2019. 1 The percentage of reduction in relation to the unfiltered wine. * The average values with the same letter and for the same red wine are not significantly different (Tukey test, p < 0.05).
Processes 10 00284 g003
Figure 4. The impact of the two different filtration techniques on the colored anthocyanins, color intensity and color hue for the three red wines studied. TN2018, the red wine produced from the Touriga Nacional grape variety in 2018; BLW2018, the red wine produced from a blend containing Touriga Nacional, Tinta Roriz, Alfrocheiro and Jaen grape varieties in 2018; BLW2019, the red wine produced from a blend containing Baga and Tinta Pinheira grape varieties in 2019. 1 The percentage of reduction in relation to the unfiltered wine. * The average values with the same letter and for the same red wine are not significantly different (Tukey test, p < 0.05).
Processes 10 00284 g004
Figure 5. The impact of the two different filtration techniques on the sensorial profiles of the three red wines studied. TN2018, the red wine produced from the Touriga Nacional grape variety in 2018; BLW2018, the red wine produced from a blend containing Touriga Nacional, Tinta Roriz, Alfrocheiro and Jaen grape varieties in 2018; BLW2019, the red wine produced from a blend containing Baga and Tinta Pinheira grape varieties in 2019; IW, initial wine (unfiltered); CF, cross-flow microfiltration; PF, membrane plate filtration. * The sensory parameters where there are significant differences between the wines and in which values with the same letter are not significantly different (Tukey test, p < 0.05).
Processes 10 00284 g005
Figure 6. The principal component analysis (PCA; PC1 and PC2) for the different phenolic parameters and sensory attributes of the red wines submitted to cross-flow microfiltration and plate filtration: (A) the projection of sensorial attributes and phenolic parameters; (B) the projection of red wine samples.
Processes 10 00284 g006
Table 1. The initial general physicochemical characteristics of the red wines that were used in the experimental work.
ParametersRed Wines
TN2018BLW2018BLW2019
Alcohol content (%, v/v)13.5 (0.09)13.6 (0.1)12.3 (0.1)
pH3.61 (0.001)3.64 (0.01)3.63 (0.01)
Total acidity (g/L, tartaric acid)5.40 (0.01)5.20 (0.01)5.40 (0.04)
Volatile acidity (g/L, acetic acid)0.24 (0.01)0.33 (0.01)0.38 (0.02)
Malic acid (g/L)0.10 (0.01)0.20 (0.01)0.20 (0.02)
Lactic acid (g/L)1.80 (0.04)1.70 (0.01)2.20 (0.03)
Free sulfur dioxide (mg/L)30 (0.9)30 (1.3)30 (0.9)
Reducing substances (1) (g/L)2.8 (0.09)3.0 (0.1)1.9 (0.09)
The average values of the three replicates with the relative error in parentheses; (1) containing mainly residual sugar; TN2018, the red wine produced from the Touriga Nacional grape variety in 2018; BLW2018, the red wine produced from a blend containing Touriga Nacional, Tinta Roriz, Alfrocheiro and Jaen grape varieties in 2018; BLW2019, the red wine produced from a blend containing Baga and Tinta Pinheira grape varieties in 2019.
Table 2. The impact of the two different filtration techniques on chromatic characteristics using CIELab coordinates for the three red wines studied.
CIELab
Coordinates
Red Wines
TN2018BLW2018BLW2019
IWCFPFIWCFPFIWCFPF
L*60.24 a,* ± 0.0261.06 c ± 0.03
(1.36%) (1)
60.94 b ± 0.11
(1.16%) (1)
65.39 b ± 0.0363.06 a ± 0.04
(3.56%) (2)
65.74 c ± 0.09
(0.53%) (1)
69.29 a ± 0.3269.44 a ± 0.01
(0.21%) (1)
70.00 a ± 0.12
(1.02%) (1)
a*35.71 c ± 0.0434.94 b ± 0.01
(2.15%) (2)
34.37 a ± 0.08
(3.72%) (2)
32.09 a ± 0.0632.16 a ± 0.02
(0.21%) (1)
32.04 a ± 0.04
(0.28%) (2)
28.56 b ± 0.0428.94 c ± 0.01
(1.33%) (1)
27.91 a ± 0.03
(2.27%) (2)
b*2.64 a ± 0.013.06 b ± 0.03
(15.90%) (1)
3.00 b ± 0.04
(13.63%) (1)
3.25 a ± 0.033.51 b ± 0.03
(8.00%) (1)
3.43 b ± 0.02
(5.53%) (1)
4.24 a ± 0.144.17 a ± 0.02
(1.63%) (2)
4.22 a ± 0.05
(0.47%) (2)
c*35.80 c ± 0.4535.08 b ± 0.21
(2.01%) (2)
34.50 a ± 0.11
(3.63%) (2)
32.25 a ± 0.0232.36 a ± 0.01
(0.34%) (1)
32.22 a ± 0.03
(0.09%) (2)
28.88 b ± 0.0228.23 c ± 0.01
(2.25%) (1)
28.22 a ± 0.01
(2.28%) (2)
∆E-1.20 a ± 0.011.58 a ± 0.03-2.35 a ± 0.031.56 a ± 0.01-0.46 b ± 0.021.13 a ± 0.03
The average values of the three replicates ± standard deviation; (1) the percentage of increase in relation to the unfiltered wine; (2) the percentage of reduction in relation to the unfiltered wine; L* (%) (lightness); a* (from green to red); b* (from blue to yellow); c* (chroma); ∆E, total color difference; the values corresponding to ∆E were obtained taking as a reference each unfiltered wine as the control wine; TN2018, the red wine produced from the Touriga Nacional grape variety in 2018; BLW2018, the red wine produced from a blend containing Touriga Nacional, Tinta Roriz, Alfrocheiro and Jaen grape varieties in 2018; BLW2019, the red wine produced from a blend containing Baga and Tinta Pinheira grape varieties in 2019; IW, initial wine (unfiltered); CF, cross-flow microfiltration; PF, membrane plate filtration. * The average values with the same letters for each CIELab coordinate and for the same red wine are not significantly different (Tukey test, p < 0.05).
Table 3. The impact of the two different filtration techniques on the monomeric anthocyanin groups for the three red wines studied.
Monomeric Anthocyanin Group
(mg/L) (1)
Red Wines
TN2018BLW2018BLW2019
IWCFPFIWCFPFIWCFPF
∑ Monoglucoside212.9 b,* ± 3.9198.9 b ± 3.0
(6.5%) (2)
157.6 a ± 7.9
(25.9%)
322.0 b ± 5.0306.6 a ± 2.9
(4.7%)
305.7 a ± 6.7
(5.0%)
289.1 b ± 7.2263.2 a ± 3.1
(8.9%)
267.0 a ± 7.9
(7.6%)
∑ Acetylglucoside41.3 a ± 2.838.2 a ± 2.2
(7.5%)
37.0 a ± 3.6
(10.4%)
56.9 b ± 5.156.1 b ± 2.9
(1.4%)
47.7 a ± 3.2
(16.1%)
67.9 b ± 2.949.4 a ± 4.2
(27.2%)
50.6 a ± 2.7
(25.4%)
∑ Coumarylglucoside20.7 a ± 0.318.9 a ± 1.1
(8.6%)
20.1 a ± 1.4
(2.89%)
30.0 a ± 3.529.0 a ± 1.7
(3.3%)
30.0 a ± 3.2
(0%)
26.8 a ± 1.221.5 a ± 2.6
(19.7%)
26.5 a ± 3.9
(1.1%)
The average values of the three replicates ± standard deviation; (1) the monomeric anthocyanins group expressed as malvidin 3-monoglucoside equivalents; (2) the percentage of reduction in relation to the unfiltered wine; TN2018, the red wine produced from the Touriga Nacional grape variety in 2018; BLW2018, the red wine produced from a blend containing Touriga Nacional, Tinta Roriz, Alfrocheiro and Jaen grape varieties in 2018; BLW2019, the red wine produced from a blend containing Baga and Tinta Pinheira grape varieties in 2019; IW, initial wine (unfiltered); CF, cross-flow microfiltration; PF, membrane plate filtration; ∑ monoglucoside, the sum of delphinidin, cyanidin, petunidin, peonidin and malvidin; ∑ acetylglucoside, the sum of delphinidin, cyanidin, petunidin, peonidin and malvidin; ∑ coumarylglucoside, the sum of petunidin, peonidin and malvidin. * The average values with the same letters for each monomeric anthocyanin group and for the same red wine are not significantly different (Tukey test, p < 0.05).
Table 4. The impact of the two different filtration techniques on the tanning power and different fractions of proanthocyanidins for the three red wines studied.
ParametersRed Wines
TN2018BLW2018BLW2019
IWCFPFIWCFPFIWCFPF
Tanning power (NTU/mL)513.04 b,* ± 13.05494.02 b ± 3.56
(3.71%) (1)
460.87 a ± 4.56
(10.71%)
422.79 c ± 19.33369.27 b ± 0.97
(12.66%)
307.75 a ± 9.43
(27.21%)
319.79 b ± 6.34271.33 a ± 9.19
(13.15%)
307.83 b ± 9.56
(3.74%)
Fractions of Proanthocyanidins (mg/L)IWCFPFIWCFPFIWCFPF
Monomeric18.78 b ± 0.5016.95 b ± 0.46
(9.71%) (1)
12.83 a ± 1.14
(31.65%)
14.82 c ± 0.5113.17 b ± 0.30
(11.09%)
10.34 a ± 0.68
(30.21%)
13.33 b ± 0.5511.27 a ± 0.23
(15.41%)
12.39 b ± 0.15
(7.03%)
Oligomeric99.64 c ± 1.0893.80 b ± 1.73
(5.86%)
85.55 a ± 1.25
(14.14%)
83.05 b ± 2.6579.25 b ± 0.67
(4.58%)
72.65 a ± 1.22
(12.53%)
73.43 c ± 0.9066.29 a ± 0.53
(9.72%)
68.70 b ± 0.47
(6.45%)
Polymeric862.87 c ± 4.70839.29 b ± 1.27
(2.63%)
815.83 a ± 5.14
(5.36%)
721.17 c ± 2.48709.58 b ± 2.76
(1.61%)
695.08 a ± 3.68
(3.62%)
646.30 c ± 2.96594.33 a ± 3.61
(8.04%)
614.67 b ± 4.03
(4.89%)
The average values of the three replicates ± standard deviation; (1) the percentage of reduction in relation to the unfiltered wine; TN2018, the red wine produced from the Touriga Nacional grape variety in 2018; BLW2018, the red wine produced from a blend containing Touriga Nacional, Tinta Roriz, Alfrocheiro and Jaen grape varieties in 2018; BLW2019, the red wine produced from a blend containing Baga and Tinta Pinheira grape varieties in 2019; IW, initial wine (unfiltered); CF, cross-flow microfiltration; PF, membrane plate filtration. * The average values with the same letters for each parameter and for the same red wine are not significantly different (Tukey test, p < 0.05).
Publisher’s Note: MDPI stays neutral with regard to jurisdictional claims in published maps and institutional affiliations.

