Article

Study on Mechanical Properties of Cement-Improved Frozen Soil under Uniaxial Compression Based on Discrete Element Method

1
State Key Laboratory for Geomechanics and Deep Underground Engineering, School of Mechanics and Civil Engineering, China University of Mining & Technology, Xuzhou 221116, China
2
School of Management Engineering, Xuzhou University of Technology, Xuzhou 221018, China
*
Author to whom correspondence should be addressed.
Processes 2022, 10(2), 324; https://doi.org/10.3390/pr10020324
Submission received: 6 January 2022 / Revised: 25 January 2022 / Accepted: 2 February 2022 / Published: 8 February 2022
(This article belongs to the Special Issue Modeling and Optimization of Hybrid Energy Systems)

Abstract

:
Taking cement-improved frozen soil as the research object, this paper, based on uniaxial unconfined compressive tests of improved-frozen soil under the conditions of different cement contents (6%, 12%, 18%) and curing ages (7 d, 14 d, 28 d), analyzed the results and probed the relationship between the strength and elastic modulus of cement-improved frozen soil and cement content and curing age. In combination with laboratory test results, numerical simulations were set with the PFC3D group, building on the samples with 6% and 18% cement content at 14 days of curing, respectively, and the mesoscopic parameter values of the two different amounts were calibrated, which proved the simulation of cement with PFC3D reliable to improve frozen soil, and from the microscopic view, the crack development, stress field, and the particle displacement field of the two samples were analyzed. The result shows that the force is not evenly distributed in the samples; with the main force chain on the cement particles, an increase in particles can lessen the cracks, and the failure of the 6% sample is a tensile plastic failure and that of the 18% sample is a tensile shear failure.

1. Introduction

In underground engineering, using the freezing method to reinforce water-bearing and soft stratum is an effective method, but there are also security risks in the freezing method, such as the weak stability of stratum and the excessive deformation of soil body, so it is effective to freeze soil after improvement of its body. Research shows that soil–cement, formed by fully mixing cement and soil, is economical and convenient and possesses many means of soil-body improvement. After a soil body is mixed with cement, the cement’s strength is significantly improved [1] and the compressive and shear resistances are enhanced [2]. This method has been applied more and more in underground construction. Studies by Croft [3], Meng et al. [4], and Wang et al. [5] showed that cement has a cementing effect on soil. Tang et al. [6], Huang et al. [7], and Wang et al. [8] adopted an unconfined compression testing method and believed that the influencing factors of soil–cement strength mainly depended on the cement content and the approximate linear relationship between the cement content and the compressive strength. Liang et al. [9] believed that soil–cement exhibits the characteristics of brittle failure when the cement incorporation ratio is greater than 7%, but when the cement content is lower than 15%, the compressive strength has little to do with the cement incorporation ratio. Suksun Horpibulsuk et al. [10] found that the strength of soil–cement is related to the water–cement ratio. Niu et al. [11] carried out a series of triaxial tests on improved frozen loess in the context of research on cement-improved frozen soil. Yin et al. [12] used sulpoaluminate cement (SAC) and ordinary Portland cement (OPC) to improve frozen soil. Through unconfined compressive strength tests, it was pointed out that, under the same conditions, the time for sulphoaluminate cement to reach an early strength is faster than that of ordinary Portland cement. Chai et al. [13,14] tried to use cement and other additives to improve frozen soil, and found that cement effectively improved the strength. Ma et al. [15] tested the frozen soil strength of improved silty clay at different ages using different cement mixing amounts through laboratory experiments, and obtained the uniaxial compressive strength and elastic modulus of frozen soil. Research on the strength of cement-improved frozen soil has focused on the exploration of stress–strain curves through laboratory tests and the method is limited. The strength of soil is often affected by its meso-structure; therefore, analysis of the macroscopic mechanical behavior of soil alone cannot accurately explain the mechanical nature of soil strength changes after improvement.
Soil is discontinuous and presents anisotropic mechanical properties microcosmically. Therefore, it is necessary to use the discrete element method to study the mechanical properties of soil under different external loads. The discrete element method is a numerical calculation that views a study object as a collection of scattered objects. It was first proposed by Cundall [16], and was then improved together with Stack [17]. Scholars in various fields have studied and verified the reliability of discrete element generation based on this theory. Boke et al. [18] established a micromechanical model containing bound water, free water, and particles using particle flow software to reproduce the mechanical characteristics of soil and rock. Vardoulakis et al. [19] studied the formation and thickness of shear bands of granular materials in a plane strain state using a discrete element particle flow mode. The method has been widely used in the study of soil bodies. Li et al. [20] established a 3D model for analyses, according to the actual particle gradation, using PFC3D particle flow software. Li Ning et al. [21] established a 2D model of sand with PFC software and found that the stress–strain curve was in good agreement with the actual test results. Based on the existing triaxial test results of soil, Liu et al. [22] calibrated the model parameters in combination with the particle flow hypothesis, and determined macroscopic mechanical properties consistent with the test results. Therefore, it is credible to use PFC to simulate soil as granular particles.
Although a series of achievements in the field of geotechnical research has been made using the discrete element particle flow method, there are few literature reports on the study of frozen soil and improved frozen soil. Based on the macrocosmic parameter of the uniaxial unconfined compressive tests on cement-improved frozen soil, with PFC3D 5.0 particle flow software, the stress–strain characteristic curves of cement-improved frozen soil was simulated, and the crack, displacement field, stress field, and destruction form of the samples were analyzed and studied.

2. Experimental Analysis on Uniaxial Compressive Strength of Cement-Modified Frozen Soil

2.1. The Preparation of Test Samples and the Experiment

This experiment tested the basic geotechnical parameters of a sample soil of grey silty clay, the physical parameters of which, such as water content, density, plastic liquid limit, etc., are shown in Table 1.
Based on the combined test method, the soil sample was also tested for its grain composition, as shown in Table 2.
Aiming to determine the relationship between the strength of cement-improved frozen soil and the amount of cement content, this experiment considered the main factors of cement content amount and specimen curing ages, which were, respectively, 6%, 12%, 18%, and 7 d, 14 d, and 28 d. Twenty-seven groups of samples were tested under the condition of 40% water content at a temperature of −10 °C. To compare the strength of cement-improved frozen soil with the strength curves and the failure modes, a comparative test of uniaxial compression was conducted between the remolded soil specimens under the condition of 40% water content at a freezing temperature of −10 °C and the soil specimens with 18% cement content and curing ages of 7 d, 14 d, and 28 d.
Measuring 61.8 mm in diameter and 125 mm in height, the prepared cylindrical soil samples were placed in a cryogenic incubator for 48 h, until they match the specified curing ages suitable for the uniaxial compression tests, which applied a loading mode of strain rate control at a ratio of 1.67 × 10⁻⁴/s.

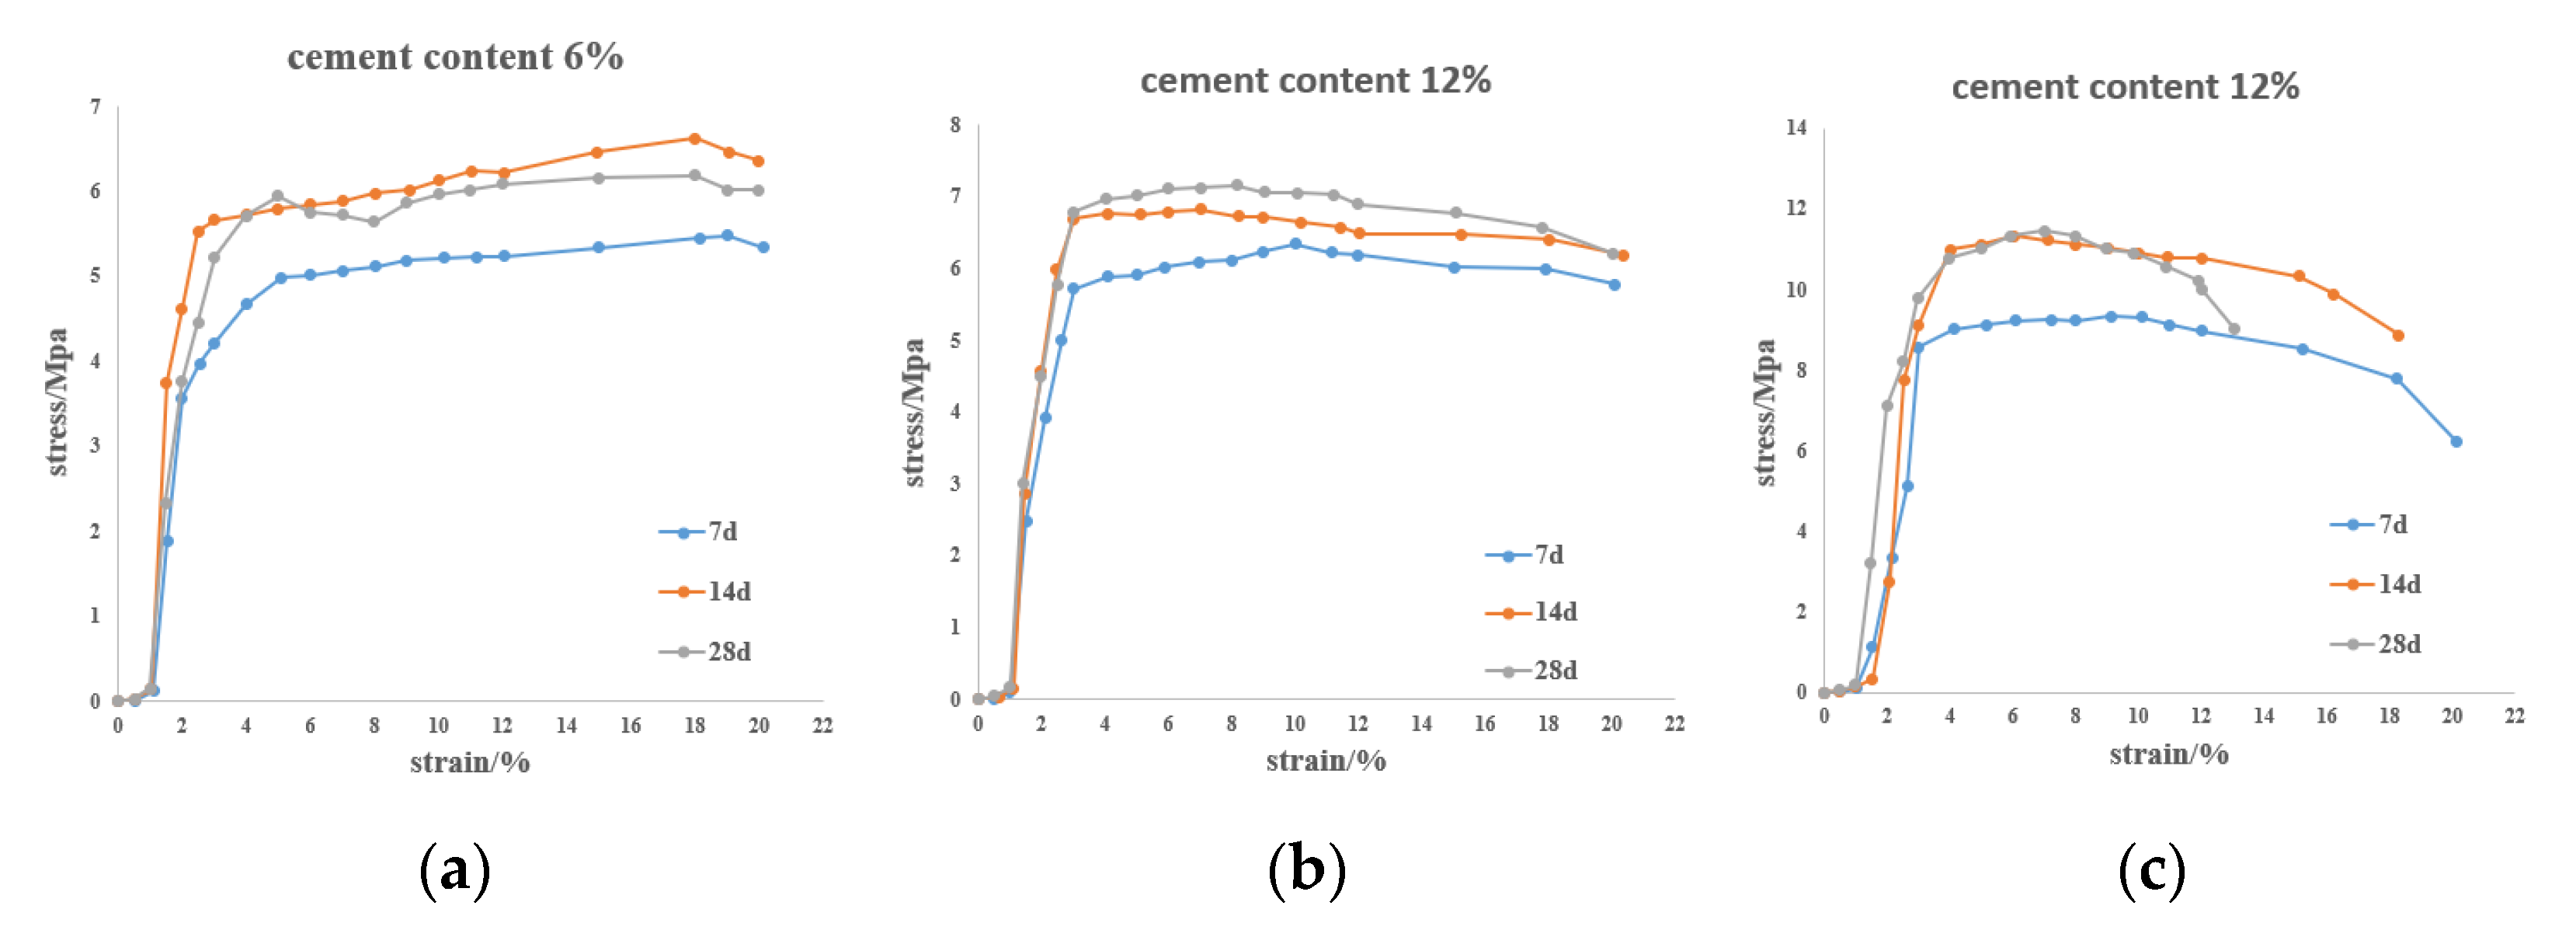
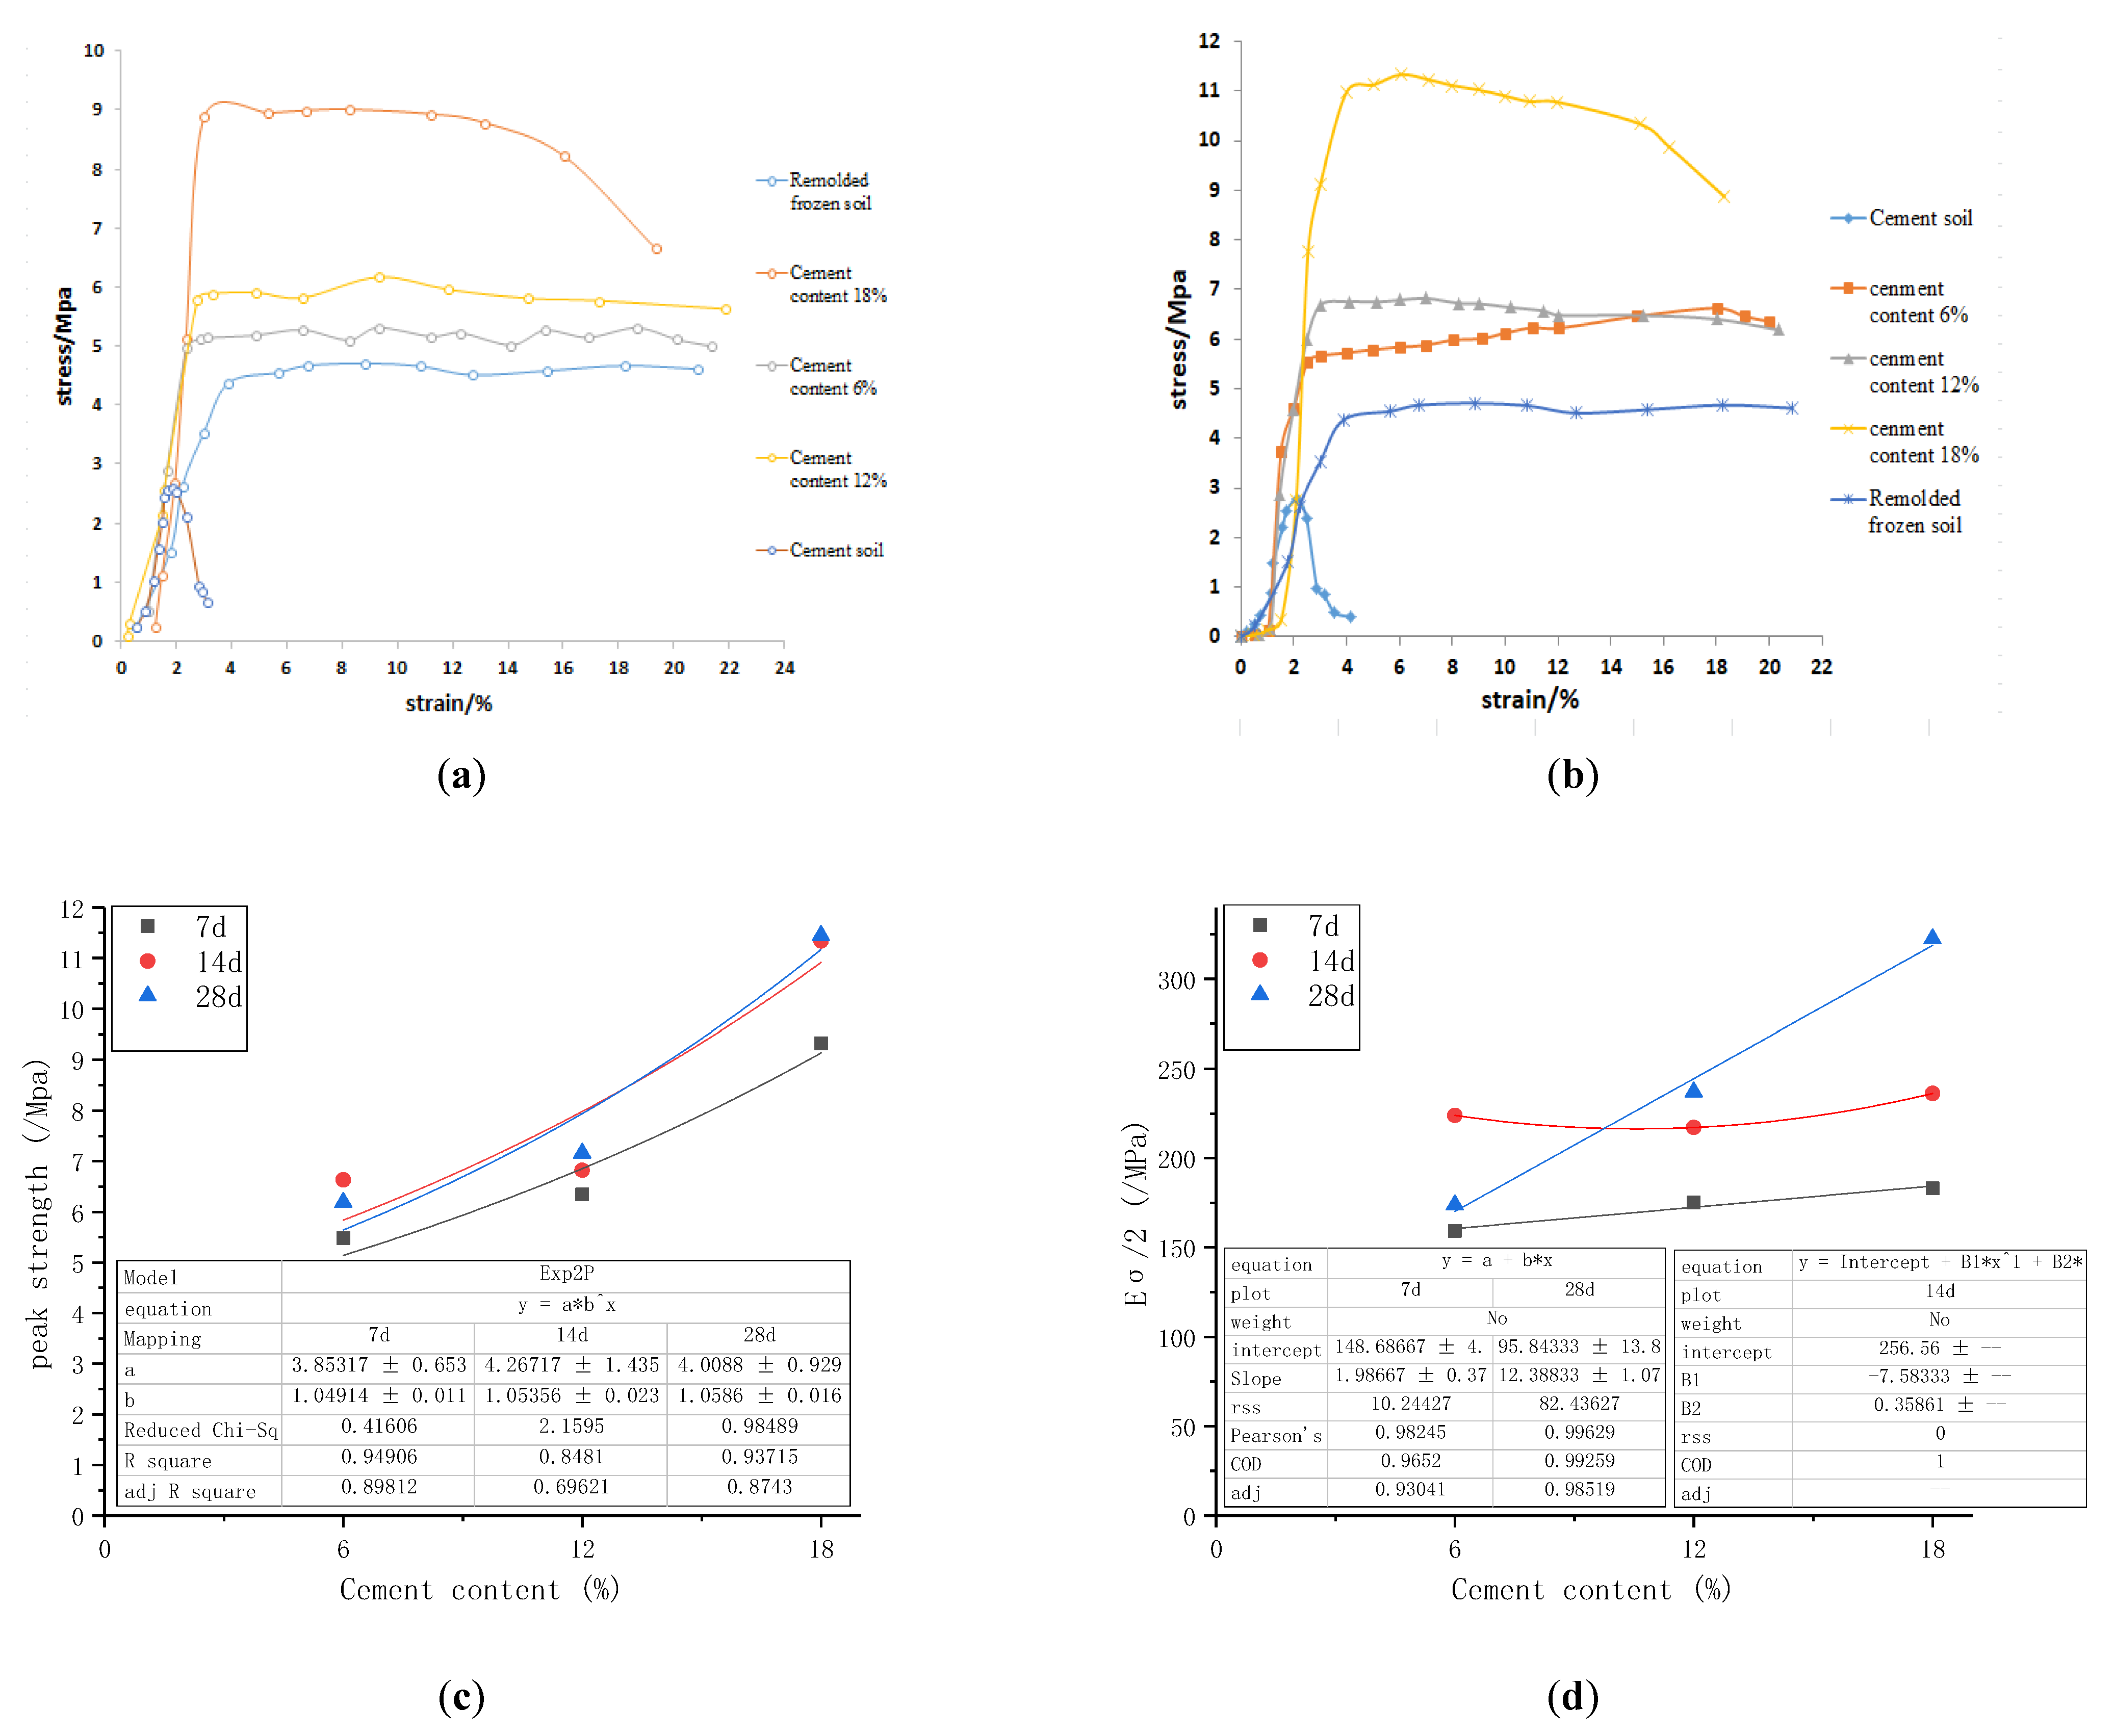
2.2. Experimental Results and Analyses

Table 3 shows the results of the uniaxial compression test on the remolded frozen soil specimens.
Table 4 shows the results of the uniaxial compression test on the cement soil specimens.
The elastic modulus at one-half of peak strength was compared and analyzed in this paper. The experimental results of the cement-modified frozen soil are shown in Table 5.
Figure 1 shows the stress–strain curves of the modified frozen soil.
As indicated in Figure 1, the stress–strain curves of the cement-modified frozen soils took on different forms due to the increasing amount of cement content. The samples with 6% cement content showed distinct features of strain hardening; samples with 12% cement content showed the feature of slight strain softening, with the conspicuous features of strain softening and brittle break; the samples with 18% cement content showed that the longer curing ages led to a faster rate of stress decline and a shorter process from peak strain to breaking strain. From the perspective of elastic modulus, the Eσ/2 of the soil sample with 6% cement content was not much different from that of the soil sample with 12% cement content, but the elastic modulus of the soil sample with 18% cement content dramatically increased with prolonged curing ages, which was attributed to the fact that the samples with 6% and 12% cement content contained free water undergoing no chemical reactions, despite their hydration, and that the samples with 18% cement content involved adequate chemical reactions between the cement and water before the formation of flocculent particle aggregation with a high intensity.
Based on our comparative analyses of the stress–strain curves between the remolded frozen soil, the cement soil, and the modified frozen soil of 7 d and 14 d maintenance periods, the peak intensity was arranged in the following sequence: cement soil < remolded frozen soil < 6% cement-modified frozen soil < 12% cement-modified frozen soil < 18% cement-modified frozen soil. In terms of the curve characteristics, there are similarities between the cement soil and brittle materials of low intensity. These also exist with the 6% and 12% modified frozen cement soil and the remolded frozen soil. The 18% modified frozen cement soil shows the greatest intensity. The increasing cement content resulted in a decreasing breaking strain for the tested samples. In terms of the elastic modulus, the cement soil surpassed the remolded frozen soil. As shown in Figure 2a,b, the amount of cement content and the cementation of ice particles have different effects on the increase in intensity in frozen soil. The adding of cement–soil mainly contributes to an increase in peak intensity and elastic modulus, while the cementation of ice particles enables the sample soil to bear a greater bending moment and shear force under the conditions of loads. Origin software was used process the data and draw the scatter diagrams. The curve form of the scatter diagram was obtained using the command [quick analysis] with Origin software. Then, the menu command [analysis] [fitting] were selected in the graphics window and the corresponding fitting formula was selected. The overall fitting results were good. As shown in Figure 2c,d, there exists a clear exponential relationship between the amount of cement content and the peak intensity. That is, given the same amount of cement content, the longer the curing age is, the stronger the intensity of the cement-modified frozen soil is. There is a similar linear relationship between the amount of cement content and the elastic modulus of the modified frozen soil, which means that a longer curing age results in a greater elastic modulus with the same amount of cement content.
Figure 3 shows the impacts of curing age on peak intensity and the elastic modulus of frozen soil samples. As is shown in Figure 3a, despite the increase in curing age, there is little change in the peak intensity of the cement-modified frozen soil samples if they contain the same amount of cement content. Based on Figure 3b, there is little difference in the intensity and elastic modulus of the 7 d and 14 d modified frozen soil samples with different amounts of cement content. A longer curing age results in clearer differences in peak intensity and elastic modulus. There is a logarithmic relationship between the curing age and the elastic modulus, which indicates that a greater amount of cement content leads to more obvious logarithmic relations.
Figure 4 shows the failure modes of soil specimens. The study on the failure modes of specimens is instructive to the adjustment of mesoscopic parameters. As indicated by the different failure modes in the figure above: (1) the destruction of cement soil is obviously brittle failure with clear penetrating cracks, which display single development from top to bottom, vertical development along the longitudinal section from top to bottom, very big angles, and no visible dilatancy fissures; (2) the remolded frozen soil shows obvious plastic deformation. Visible dilatancy fissures are observed in the soil samples, but no cracks are seen. (3) The failure of cement-modified frozen soil has the characteristics of plastic dilatancy deformation and brittle failure. There are different angles of cracks in the cement-modified frozen soil samples of different curing ages. Easier brittle failures and reduced plastic deformations result from the smaller angles of the penetrating cracks in the failure modes and the longer curing ages of soil specimens. This conclusion is of great value for the subsequent adjustment of mesoscopic parameters.

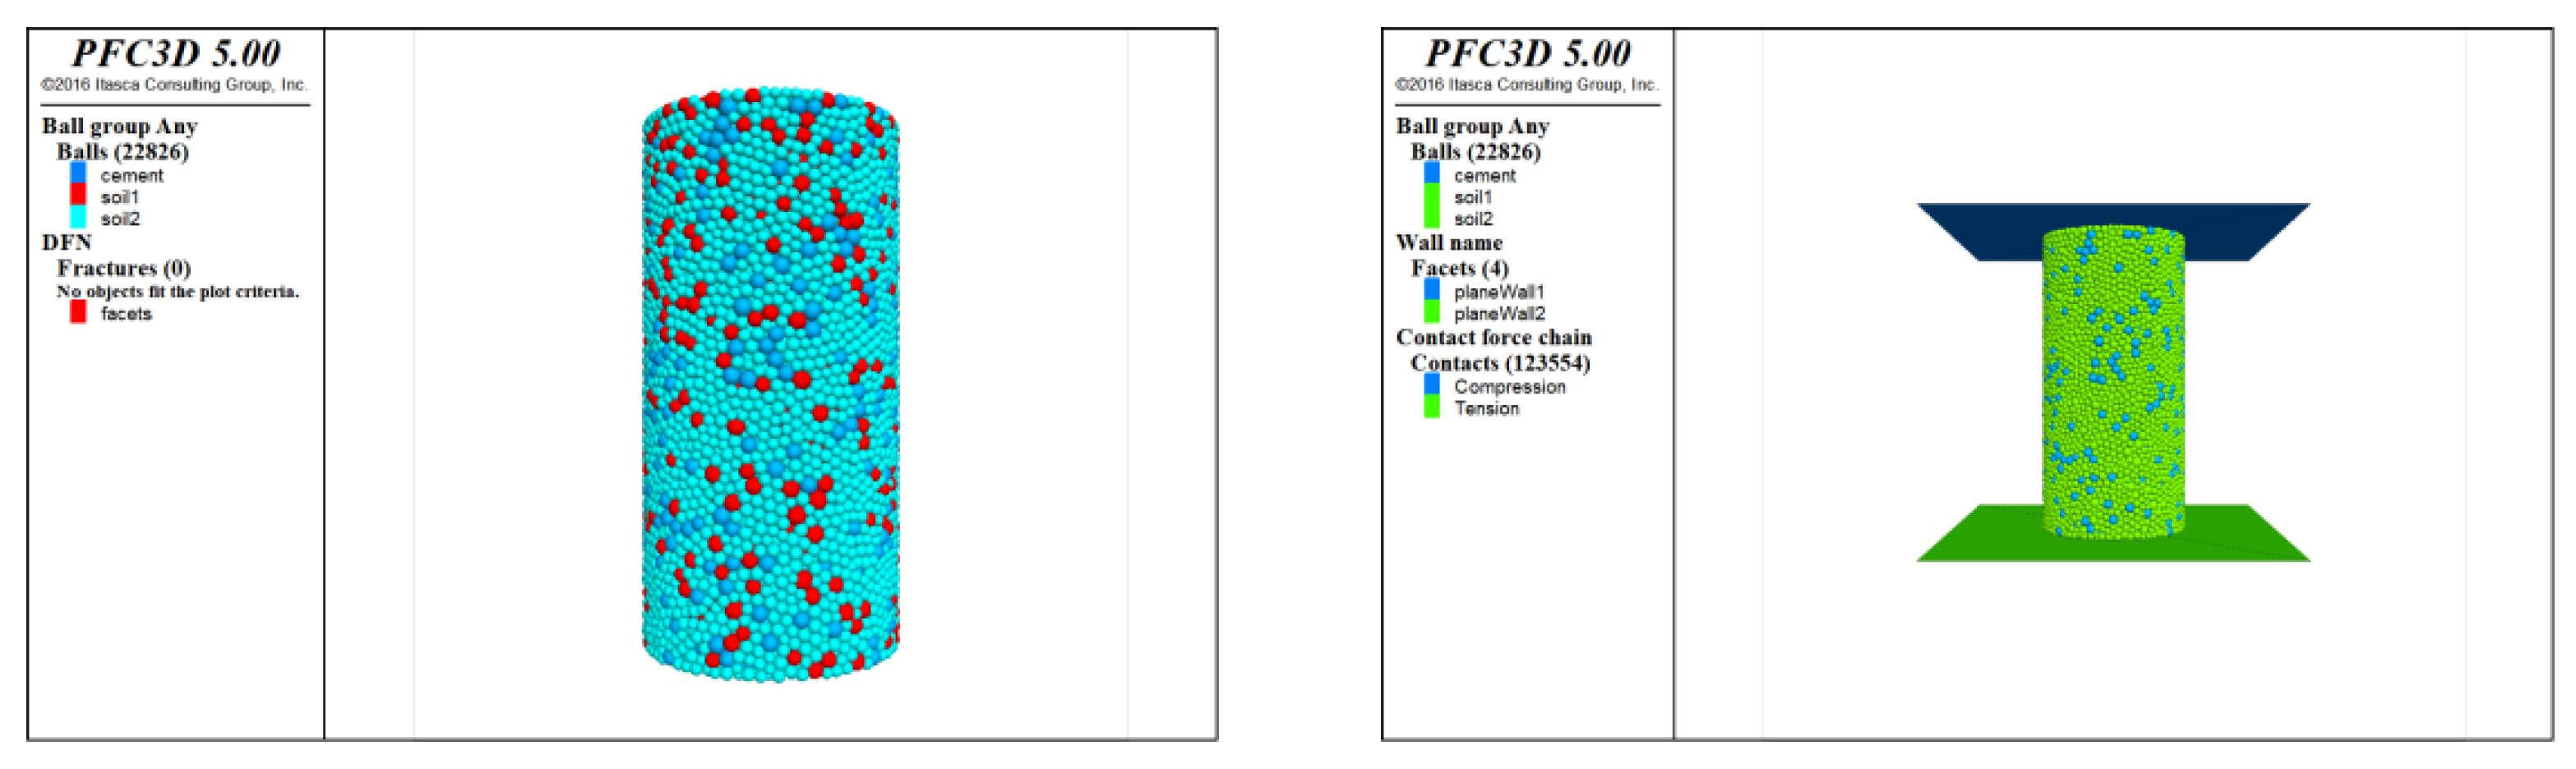
3. PFC3D Particle Flow Numerical Simulation

In PFC3D, a suitable contact model needs to be selected to reflect the mechanical properties of actual working conditions. The basic contact models of particle discrete elements are: the linear model, contact model, sliding model, and bonding model. This paper uses the parallel bonding model, in which a set of springs with constant stiffness are evenly distributed on a circular or rectangular contact surface with the indirect contact of the particles as the center. The parallel bonding model allows sliding between particles, the force direction of which is divided into normal and tangential directions. If the force in any direction exceeds the given strength of the parallel bond, bond failure occurs at the contact. If the maximum tensile stress exceeds the set normal strength or the maximum shear stress exceeds the set tangential strength, parallel bonding of the contact point no longer exists, as shown in Figure 5 and Figure 6.

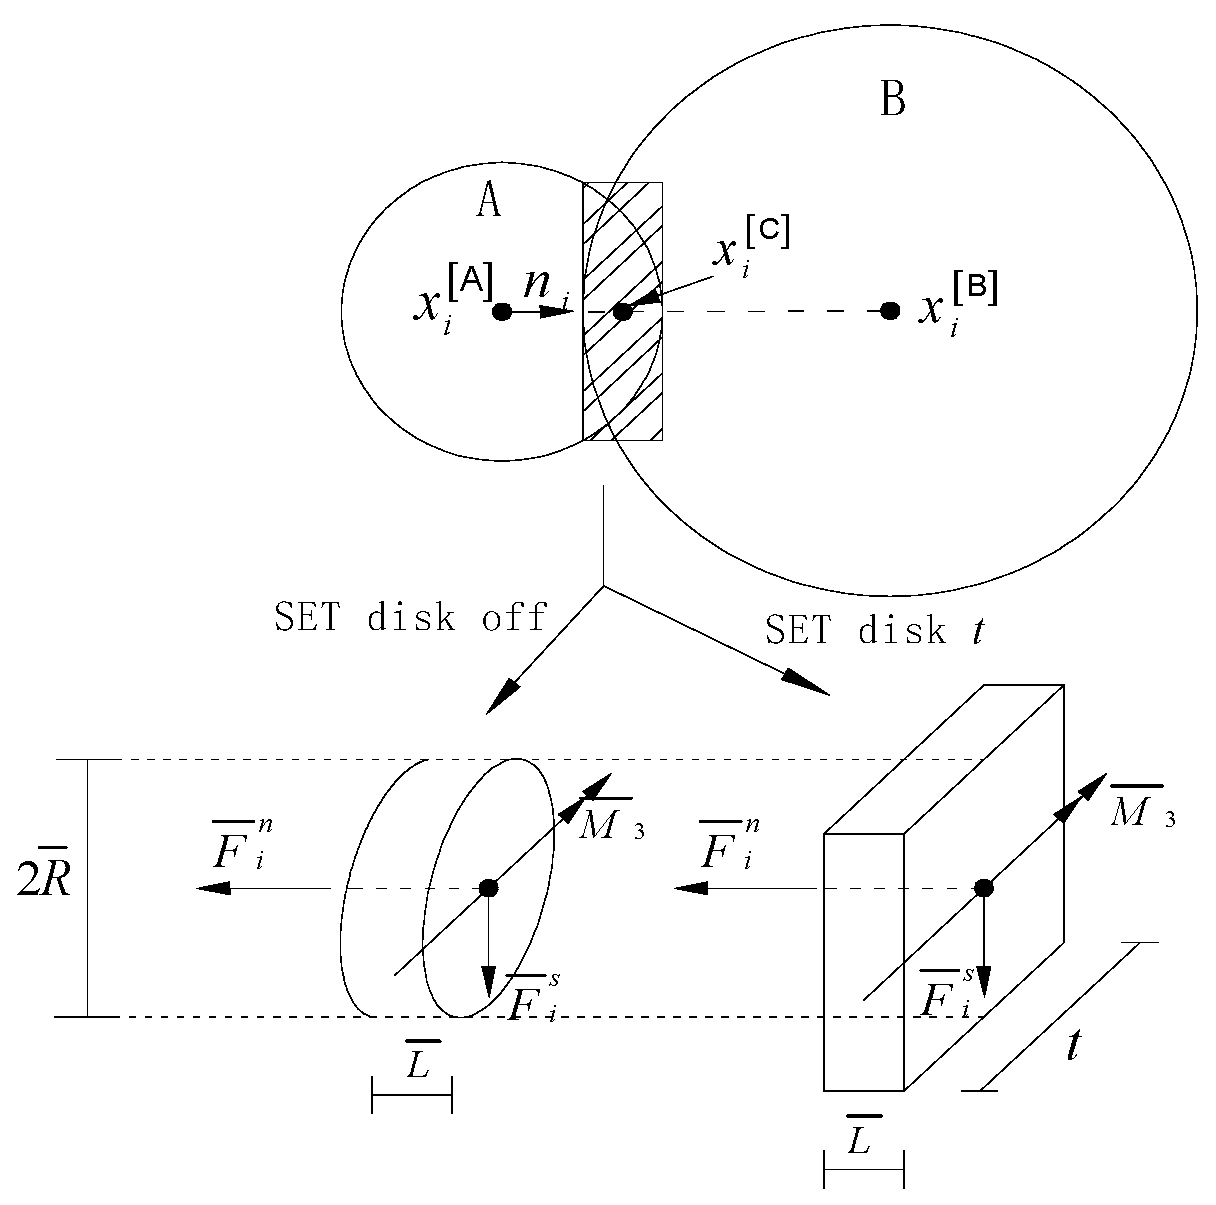
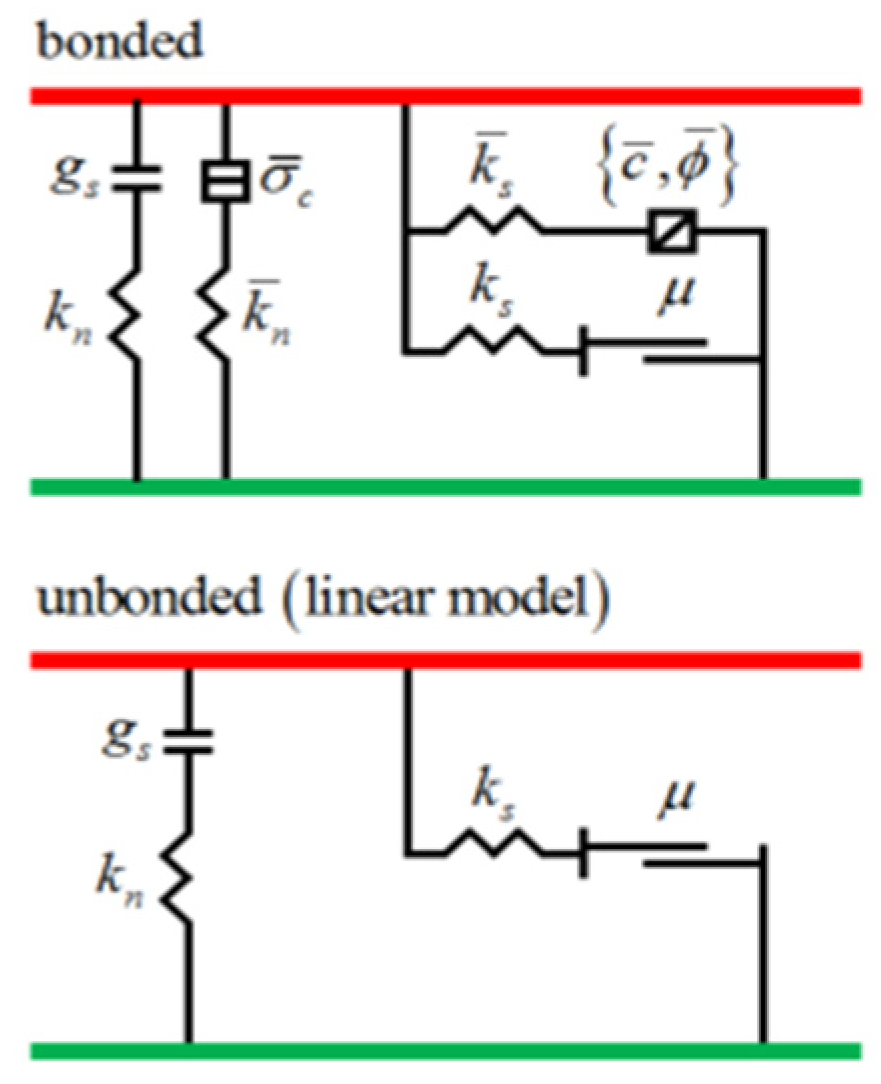
3.1. Model Establishment

When using discrete element particle flow numerical simulations to establish a model, the sample size and particle size must be considered first. From the point of view of numerical simulations, generally, the closer the particle size is to reality, the more it can reflect actual working conditions, but an excessive number of particles will greatly lengthen the calculation steps and time, so effective simplification of the model is necessary. The research of Jensen [23] pointed out that, in the numerical simulations, when the ratio of sample appearance size L to average particle diameter r is greater than 30, the number of particles in the numerical model has little effect on the simulation results. The research of Yang [24] also showed that uniaxial compression strength is not affected by the ratio. Combining the physical parameters of silty clay and the physical parameters of cement, three particle units of cement, soil 1, and soil 2 were set. The particle radius and density are shown in Table 6.
The size of the numerical simulation sample was consistent with that of the indoor test, and, in total, 22,836 particles were produced: 20,716 soil particles and 2120 cement particles. All particles were bonded in parallel (linear parallel bond model), particles and walls are connected in parallel (linear model), and the friction between the particles and the upper and lower walls was set to 0.3 (fric = 0.3), and the loading speed was 0.3 m/s. Model generation is shown in Figure 7.

3.2. Initial Value Setting of Model Meso-Parameters

In the process of discrete element numerical calculation, in addition to selecting a suitable contact model, the selection of meso-parameters is particularly important, which is the key to verification of the numerical simulation results and experimental results. In parallel bonding, there are many meso-parameters that need to be adjusted. The initial values of each meso-parameter are shown in Table 7.

3.3. Model Meso-Parameter Calibration

The PFC3D numerical simulation needs to calibrate the parameters and compare them with the macroscopic test results to obtain a stress–strain curve similar to the test results through continuous adjustment of the parameters. At the same time, it is necessary to compare them with the failure form during the test, so as to analyze the microscopic mechanical performance of the sample. Many scholars have studied the influence of meso-parameters on the macro-strength of geotechnical materials. Potyondy [25] used PFC3D to select a contact bonding model to study the influence of bonding model parameters on the stress–strain characteristics of rock. Uili [26] used PFC2D to select a contact bonding model to analyze the influence of meso-parameters on macro-strength and deformation. Zhang et al. [27] proposed a method based on orthogonal design and grey relational analysis to obtain the controlling influence factors of the macroscopic physical quantities of a simulated sample through the correlation sequence between macro and meso parameters. Liu Chang et al. [28] established uniaxial and biaxial numerical experiments of rock materials through PFC2D, studied the calibration process of parallel bonding parameters, and summarized the relationship between meso-parameters and macro-parameters. This paper selects the samples stress–strain curve with cement contents of 6% and 18%, and a curing age of 14 days as the research object for numerical simulation studies. According to the effect of different meso-parameters on the stress–strain curve, this paper formulates the following calibration ideas:
  • Adjust the effective modulus of soil particles (emod) and viscous equivalent modulus (pb_emod) to fit and reshape frozen soil, Eσ/2. Adjust the phase strength (pb_tension) and tangential strength (pb_coh) of the soil particle bonding method and fit the peak stress and strain of the reshaped frozen soil. Adjust the soil particle stiffness ratio (kratio) and viscous stiffness ratio (pb_kratio) to fit the post-peak curve shape.
  • Adjust the effective modulus of cement particles (emod) and viscous equivalent modulus (pb_emod) to fit and improve frozen soil, Eσ/2. Adjust the phase strength (pb_tension) and tangential strength (pb_coh) of the cement particle bonding method, and fit the peak stress and strain of the improved frozen soil. Adjust the cement particle stiffness ratio (kratio) and viscous stiffness ratio (pb_kratio) to fit the post-peak curve shape.
  • Adjust the friction angle (fa) and friction coefficient (fric) to match the failure form in the same way as the sample.
  • After adjustment, the above parameters need to be fine-tuned again in order to achieve a similar stress–strain curve.

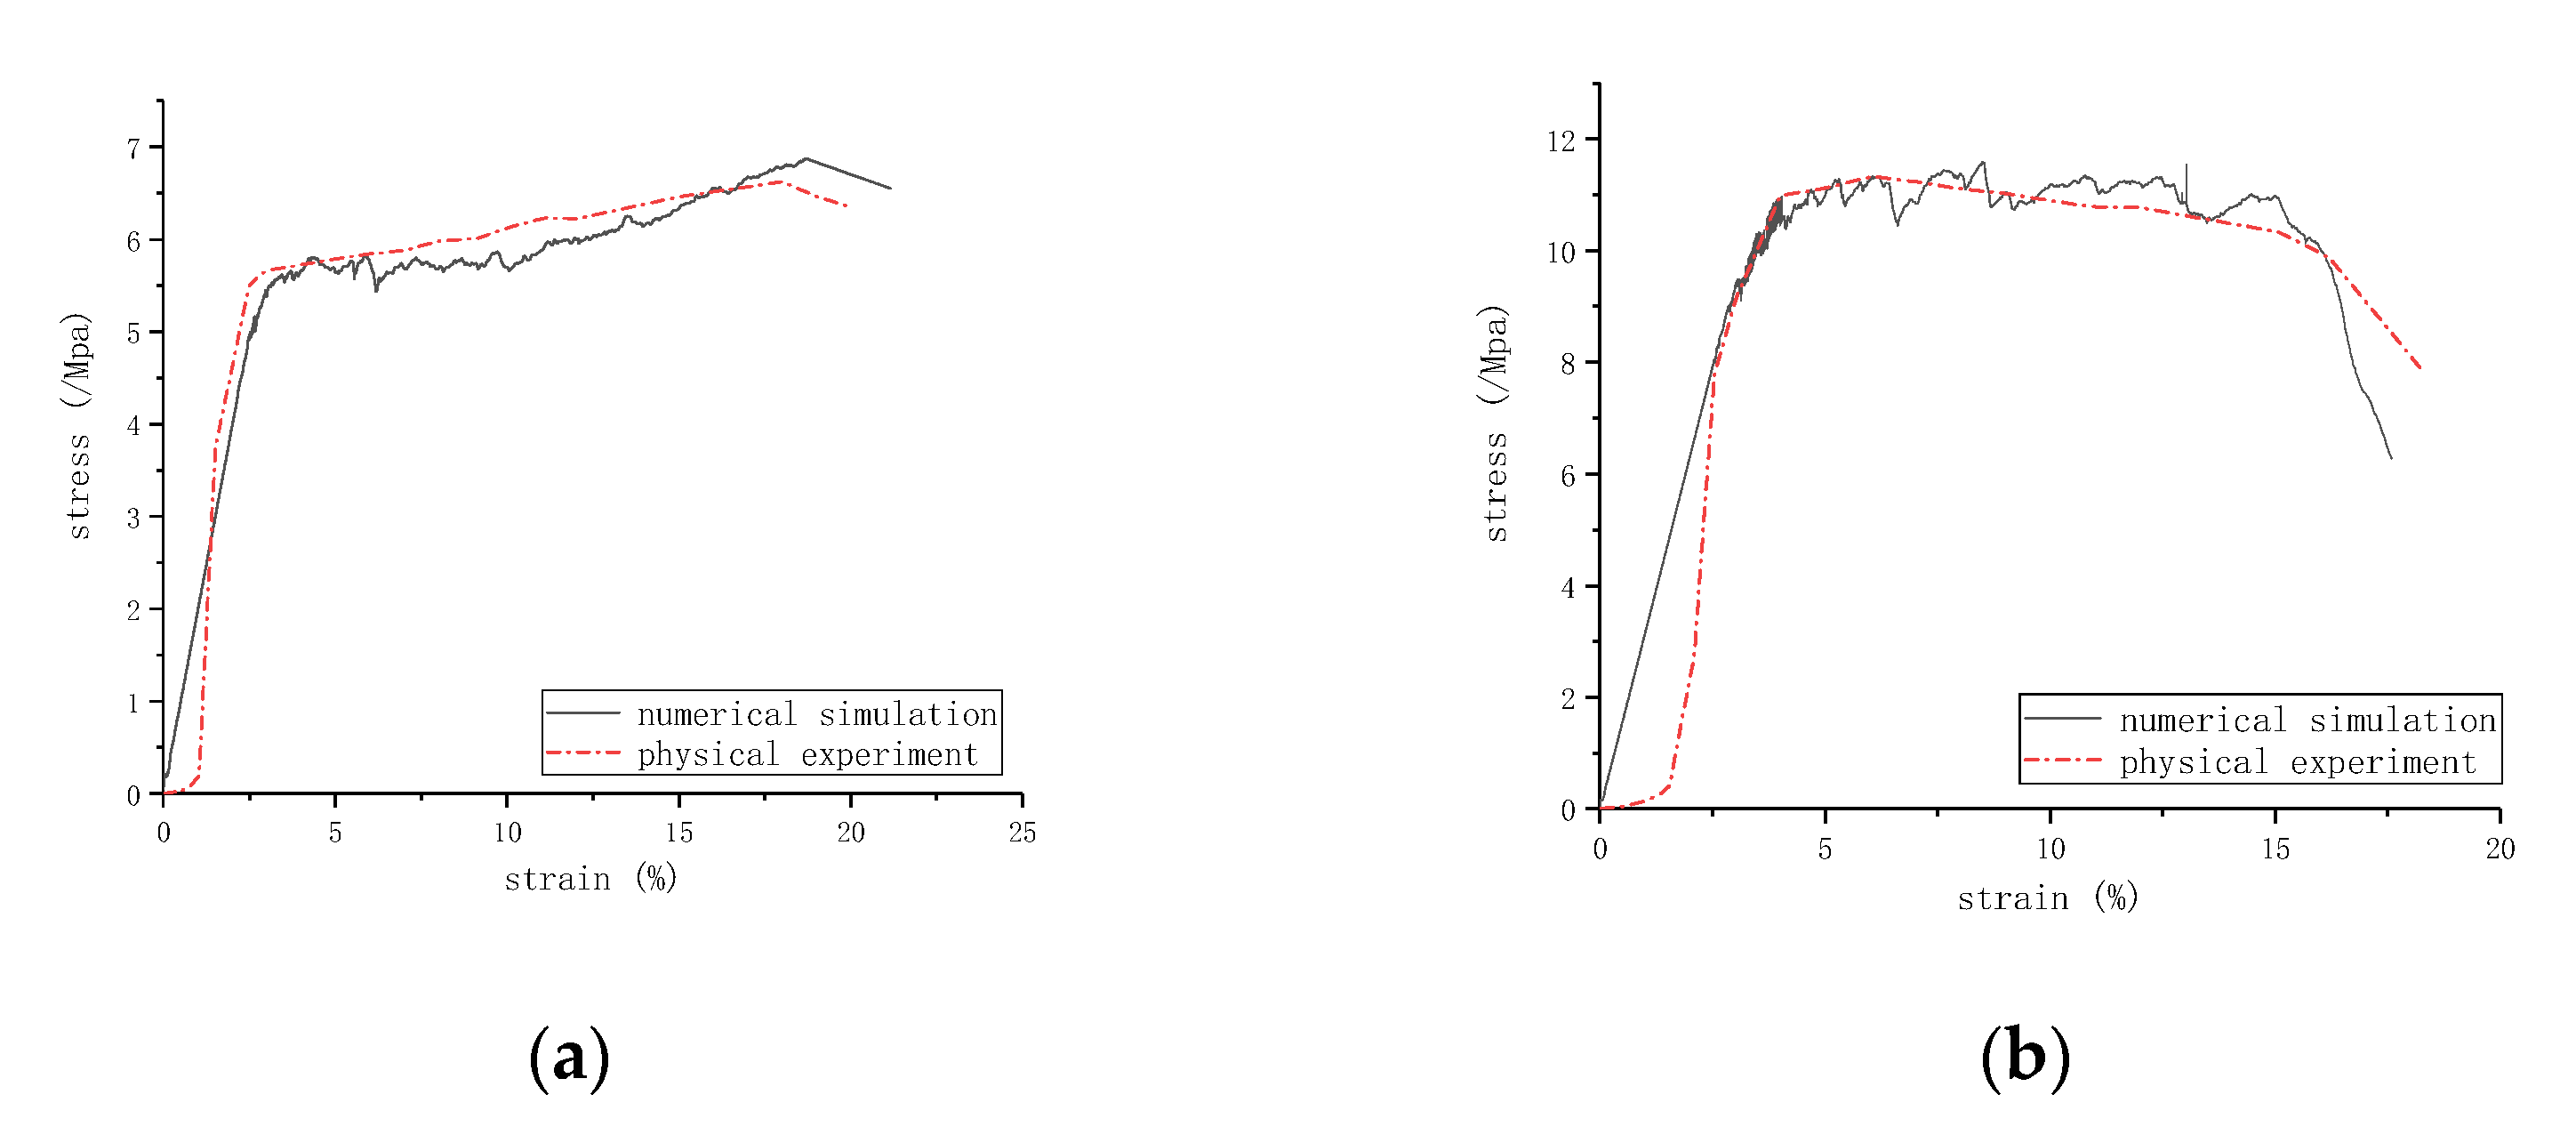
3.4. Analysis of Numerical Simulation Test Results

The comparative analysis of the results of the numerical simulation test and the stress–strain curve of the indoor test are shown in Figure 8.
From Figure 8a,b, it can be seen that the stress–strain curve obtained by numerical simulation is basically the same as the curve obtained by the indoor test, but in the linear elastic phase the former is approximately a straight line, while the latter is not a straight line. This is because, in the indoor test, the strain strengthening process occurs in the initial stage of strain loading, and it is an ideal elastic strain in the numerical simulation, which leads to the difference in the curve of the initial deformation of the sample. The curves of the samples in the middle and late stages of strain loading are basically the same, showing that the unconfined uniaxial test using PFC3D to simulate cement-improved frozen soil is reliable and effective.

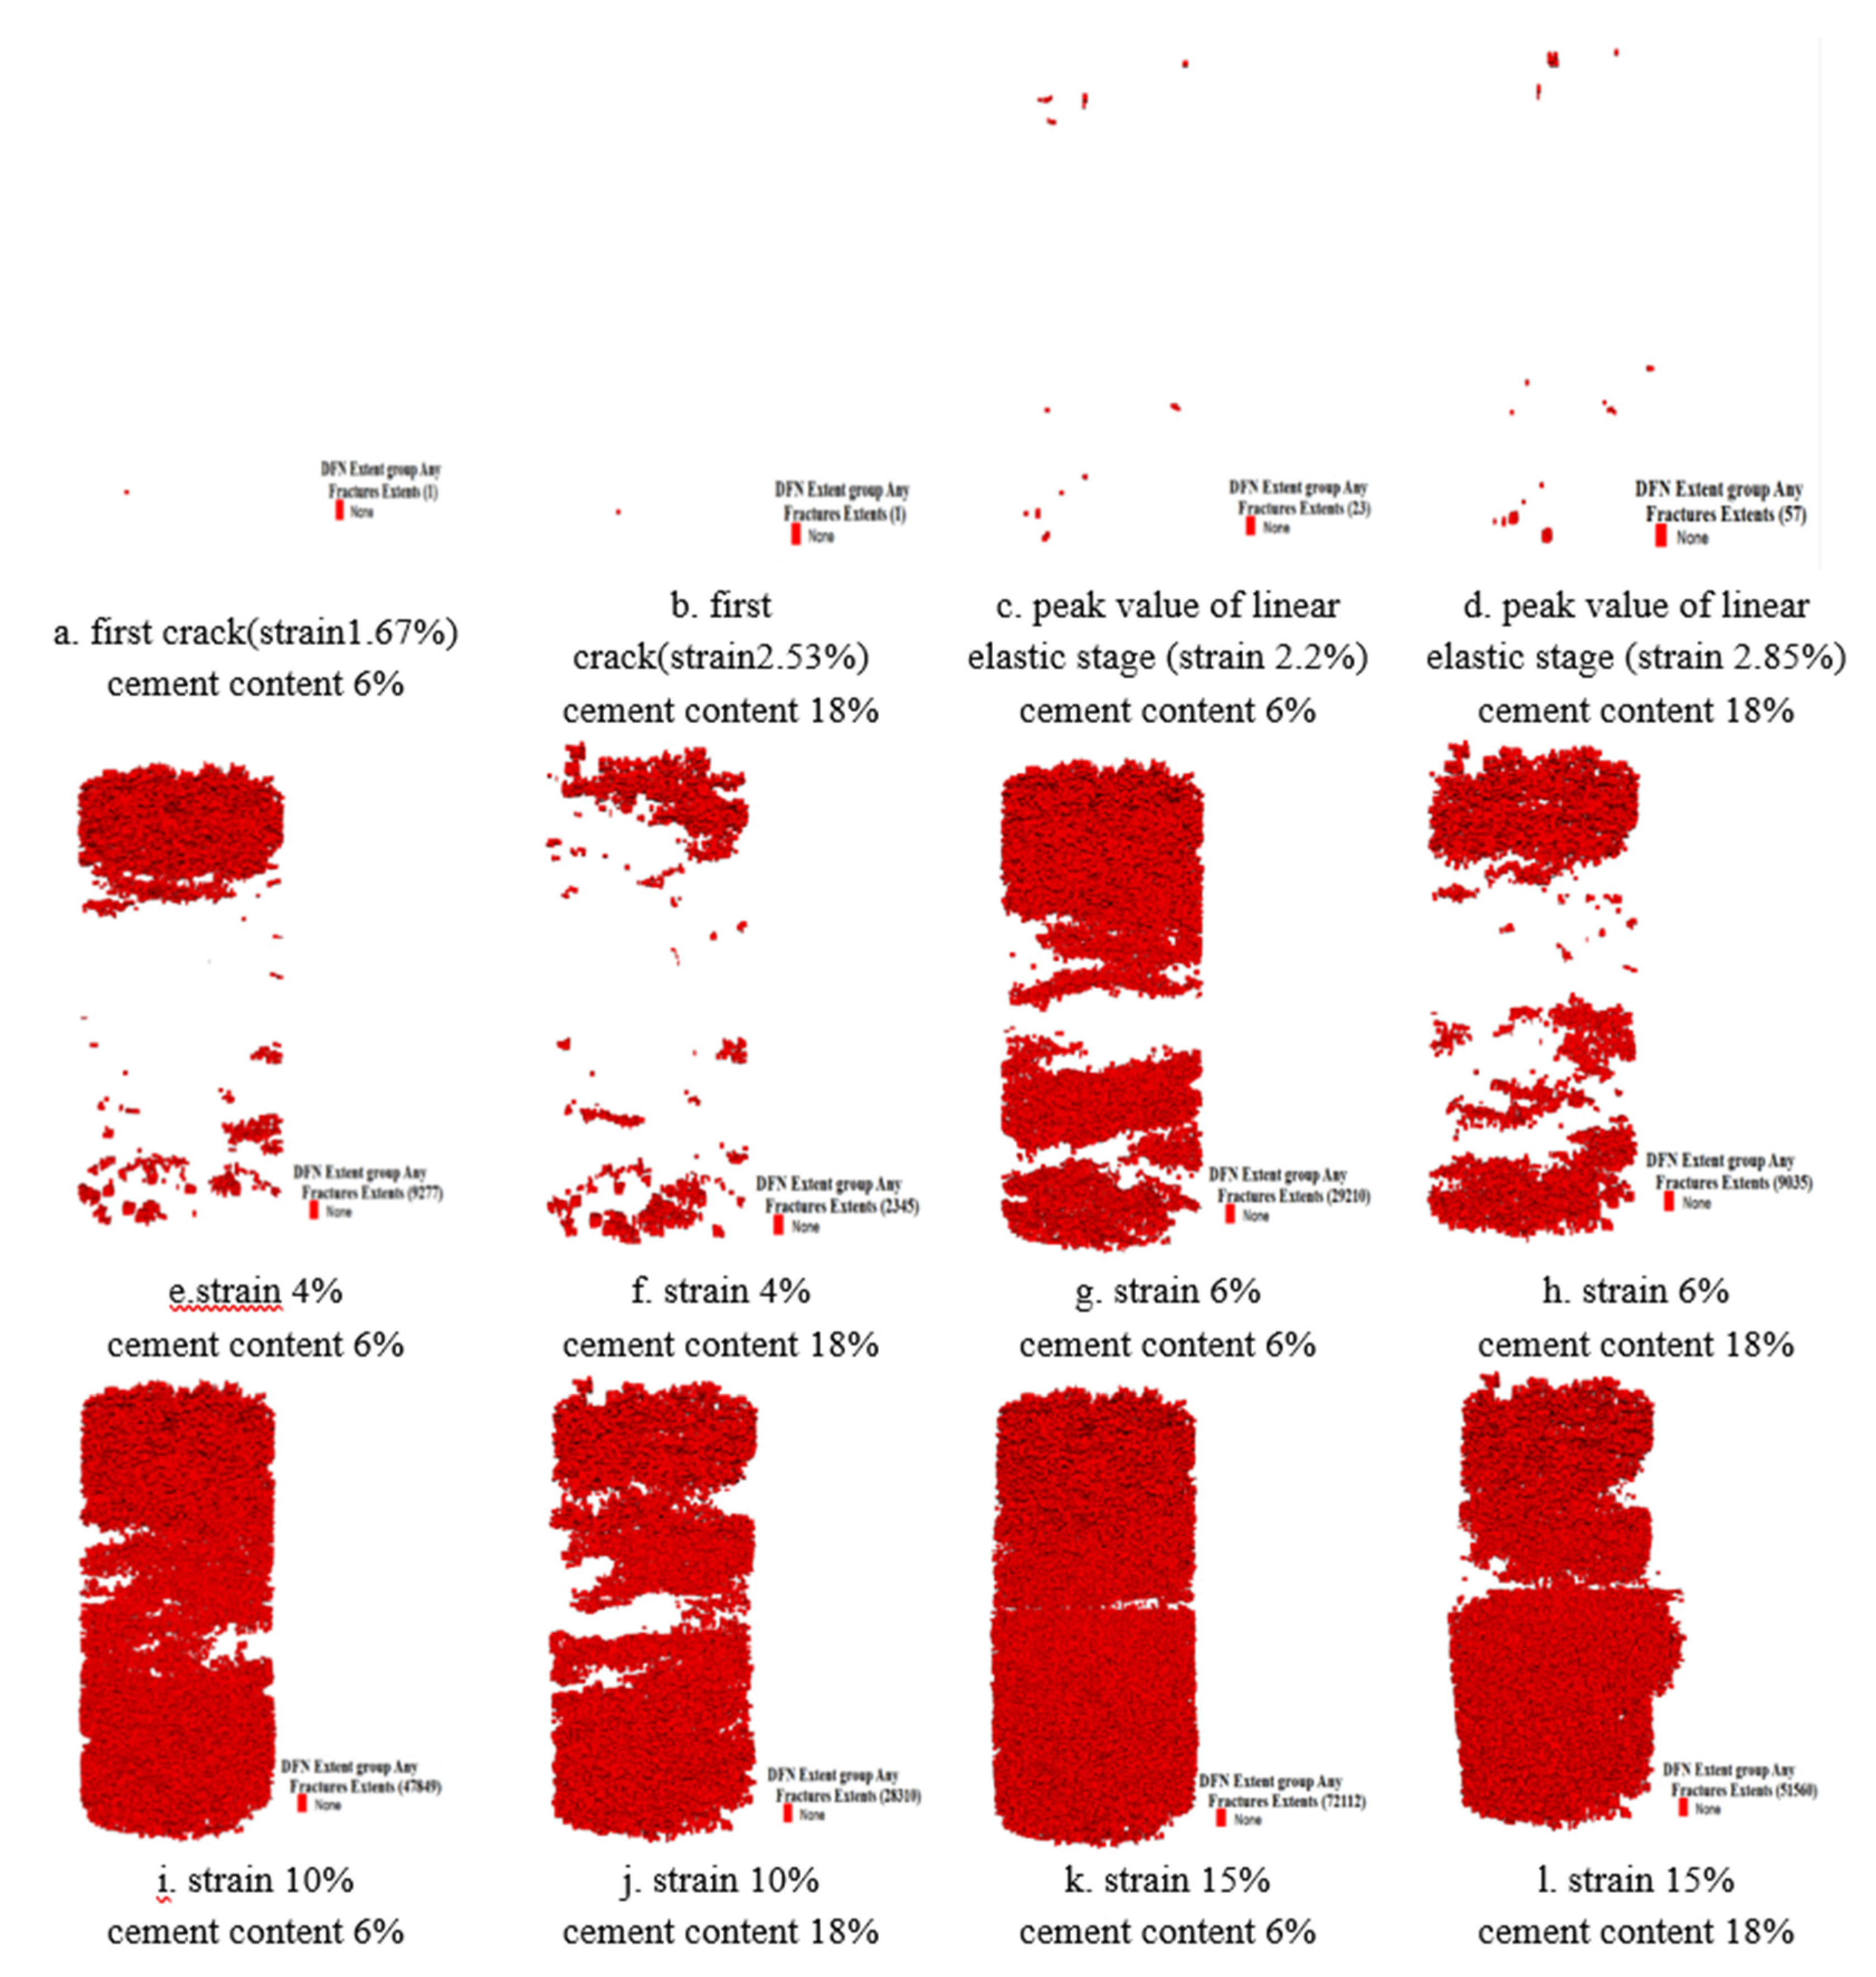
3.5. Comparative Analysis of Cracks, Stress Fields and Particle Displacement Fields

According to the numerical simulation results, the crack development of the two samples in different strain periods is compared, as shown in Figure 8.
From Figure 9a–d, we can see that, with the increase in cement content, the time for cracks to appear is different for different samples under the same loading rate. The sample with 6% cement content cracked at 1.67% strain, while the sample with 18% cement content cracked for the first time at 2.53% strain. It can be seen that the increase in cement content can delay the cracking time. In the linear elastic stage, a small amount of cracks appeared in the samples with different cement content, and at basically the same locations, indicating that the different cement content in the linear elastic stage had no obvious effect on the growth and development position of the microscopic cracks in the sample. Figure 9e–j shows a comparison of crack development in the samples at strains of 4%, 6%, and 10%. We can see that the locations of crack generation and accumulation are basically the same. The upper cracks are tightly distributed and develop downward, while the bottom crack development lagged. With the loading, the bottom cracks develop toward the middle of the sample, and the cracks develop with obvious stratification. When the sample strain reaches 10%, we can see that the sample with 6% cement content basically covered the entire sample, while the sample with 18% cement content had not been fully covered. In Figure 9k,l when the strain reached 15%, the sample with 6% cement content had cracks all over the sample, and only the middle of the sample had not yet produced cracks. The sample with 18% cement content was destroyed at that time, and there were still some areas on the upper part of the sample without cracks.
The semi-cylindrical interface of the vertical section of samples was selected for analysis, and the variations in the sample stress field using two different cement contents were compared. For a visual display of the changes of the stress field, the size of the stress in the stress field of the semi cylinder is represented by the thickness. The thicker the force chain, the greater the stress. Meanwhile, tension was used as the basis for observing the failure and shear position in the selected samples. The semi-cylindrical interface of the selected sample is shown in Figure 10.
The stress distribution at each strain time of the two cement contents is shown in Figure 11.
As can be seen from the figure above, the linear elastic stages of samples with different cement contents are shown in Figure 11a. Altogether, 63,803 and 63,645 force chains were activated in samples with 6% and 18% cement content, respectively, in the initial stage of loading. The stress field is in a state of compression, and the force chain is evenly distributed. Due to the axial load on the top, the compressive stress is largest at the top and the bottom of the fixed end. Due to the relative displacement of the particles under compression, tension appears at the top and bottom. During the loading process, as shown in Figure 11b,c, the tension in the stress field increases, and the number of total force chains also increases. The coarse pressure force chain of the 6% cement content sample is gathered at the lower part, while the tension of the 18% cement content sample is distributed evenly within the whole sample. After the strain reaches 10%, as shown in Figure 11d, the state of the stress field of the sample changes. Although the total number of force chains of the 6% cement content sample is bigger than that of the linear elastic stages, the compression force chains decrease, whereas the total number of force chains of the sample with 18% cement content still increases. In the sample failure stage, as shown in Figure 11e, the distribution of the stress field of two samples with different cement contents is very different. The coarse pressure force chains of the sample with 6% cement content almost disappear, whereas, even when reaching the failure stage, the coarse pressure force chains still exist and are in a state of bottom-to-top completeness with the 8% cement content sample, indicating when there is more cement content, there is a higher compressive strength and residual strength.
It can be seen from Figure 12a that the total force chain of the 6% sample increases slowly before the strain reaches 10%, and finally reaches a total of 993. After the strain of the sample reaches 10%, the number of force chains begins to decrease and the reduction rate increases significantly. When the strain reaches 20%, the total force chain decreases by 11,249. Before the strain of the 18% sample reaches 12%, the total force chain has significantly increased compared with the 6% sample, and a total of 1887 chains are activated. After the strain reaches 12%, the number of total force chains decreases rapidly. After the strain reaches 14%, the number of total force chains is less than 6%, which indicates that the sample has been damaged at that time. From the development of compression force chain in Figure 12b, the pressure force chain of the 6% sample continues to decrease, and the reduction rate is significantly different before and after a strain of 10%. The slope shows the characteristics of being slow in front and fast in the back, and a total of 27,328 pressure chains were reduced. For the curve of the 18% specimen before the strain reaches 12%, there is no significant change in the number of pressure chains; after the strain was 12%, there was an obvious trend of accelerated decline, and the total number of force chains decreased by 16,889. There are several reasons for the difference of force chain changes between the two samples: under the action of a constant loading rate, in the early stage of sample strain, the original parallel bond between particles has not been significantly damaged. The displacement of particles within the allowable range establishes a new bond with new particles, which is reflected in the increase in the number of force chains. The higher the cement content in the sample, the higher the values of bond strength and friction in the micromechanical parameters of cement particles, and the firmer and stable the activated pressure force chain is. In the force chain development curve, the pressure force chain increases continuously. Because of the higher the cement content of the sample, the macro elastic modulus of the sample is higher, and the effective modulus in the meso parameters is higher, the failure of the sample changes from plastic failure to brittle failure, which makes the macro failure forms of the two samples different.
From the tension development in the two samples in Figure 12c, the tensions of the two kinds of samples are continuously activated. The amount and growth rate of tension activation of the 6% sample are significantly higher than those of the 18% sample, and the activated tension is larger than that of the 18% sample. When the location of the tension and the location of the crack in Figure 9 are compared, it is found that the location of the tension is basically consistent with the location of crack development, which shows that the cracks in the cement sample are mainly caused by tension. In the sample failure stage, as shown in Figure 11e, the tension of the 6% sample changes from the top and bottom of the sample to central aggregation, and the tension force chains of the 18% sample also tend to aggregate. However, because the force is relatively small and the aggregation is not obvious, only the position where the tensile stress is generated is recorded, as shown in Figure 13.
It can be seen from the above figure that the tensile stress of the sample with 6% cement content is 2.9 times that of the sample with 18% cement content during failure, and the distribution of tension in the two samples is also different. The sample with 6% cement content has obvious aggregation in the middle, while the sample with 18% cement content has an obvious oblique tension band in the middle and lower parts of the sample. The final failure of the sample will produce an oblique failure section along the direction of the tension band, which shows that the increase in cement content also changes the failure form of the sample.
With a larger version of the figure, the relationship between the particle parameters and stress is more clearly observable. More detailed diagrams of the stress field of the two samples are shown in Figure 14.
In the Figure 14, the light color represents soil particles, while the green represents cement–soil particles. In the process of uniaxial compression, the coarse force chain is concentrated on the cement soil particles, while the force chain of the soil particles is fine. This indicates that the compressive strength of the sample is mainly determined by the number of cement soil particles and the force chains on the cement soil particles. The greater the number of cement particles, the greater the bond strength in the particle parameters, thus, the higher the compressive strength of the sample. When the strain of the sample reaches 10%, tension occurs for the first time between the soil particles in the sample with 6% cement content. The amount and size of the tension between the soil particles in the sample with 18% cement content are far smaller than in the 6% sample. When in the failure stage, the tension between the soil particles of the 6% sample increases compared with that of the 10% strain stage. Likewise, the coarse compressive stress on the cement particles disappears and tension emerges, combined with observable gaps around the particles, which indicates that the bond strength of the cement particles has failed and that the sample is in failure. Tension also appears in the sample with 18% cement content, yet the compressive force chains on the cement particles do not fail, and the gaps between the particles do not grow compared with before; the sample still has a large residual strength. The results show that the size of the force chains on the cement particles and the form of tension and compression are the main factors affecting the strength and deformation failure of the sample.
The particle displacement fields (vector sum of particle displacement) at each strain node of the two samples are determined and analyzed, which helps to build a deeper understanding of the effect of the cement content on particle displacement and the sample failure mode. The displacement fields of the two samples at each stage are shown in Figure 15.
At the initial stage of loading, as shown in Figure 15a,e, the sample has no large deformation as a whole, the maximum displacement occurs at the top of the sample, and the minimum displacement occurs at the upper part of the bottom plate. The particles in the same displacement area have the characteristics of horizontal stratification, and the boundaries between layers are obvious. At the strain strengthening stage, as shown in Figure 15b,c,f,j, the maximum and minimum displacement remain at the top and bottom. The boundary between layers of particles with similar displacement of the 6% sample was not obvious, and both way infiltration is observable. The 18% sample has a large dip angle between the layers, the boundary between the layers is still obvious, and the dip direction of the top and bottom of the sample are opposite. In the sample failure stage, it can be seen from Figure 15d,h that the failure forms of two samples with different cement contents are different. The 6% sample has a larger deformation on the whole, where the horizontal deformation is large and there is obvious shear expansion. There is an inclination angle between the adjacent displacement layers and the bottom plate, but the inclination angle is small. Combined with the tension activation diagram of the 6% sample in Figure 11, it shows that the particles in the sample have a relatively large dislocation, that the bond between particles is twisted and stretched, and that the large amount of potential energy accumulated eventually leads to a plastic tension failure. The deformation of the sample with 18% cement content is quite different from the former, and the volume expansion of the sample in the horizontal direction is not obvious. Although the sample has compression deformation, it is relatively small compared with the 6% sample. The displacement stratification has a large inclination angle with the bottom plate, and the inclination angle between the top and top stratification is opposite, resulting in staggered sliding up and down. The failure occurs along the intersection of the upper and lower displacement layers. Combined with the tensile stress activation diagram of the sample with 18% cement content in Figure 11, it can be seen that there is no large tensile stress between the sample particles, which indicates that the relative displacement between the particles is small and that the failure is caused by the dislocation with inclination between the displacement layers, which is shown to be tensile shear failure.

4. Conclusions

In this study, the uniaxial compressive strength of cement-improved frozen soil is studied by means of laboratory tests and numerical simulations. Combined with the laboratory test results, the micro characteristics of cement-improved frozen soil during uniaxial compression are analyzed using PFC3D numerical simulation software, and the following conclusions are drawn:
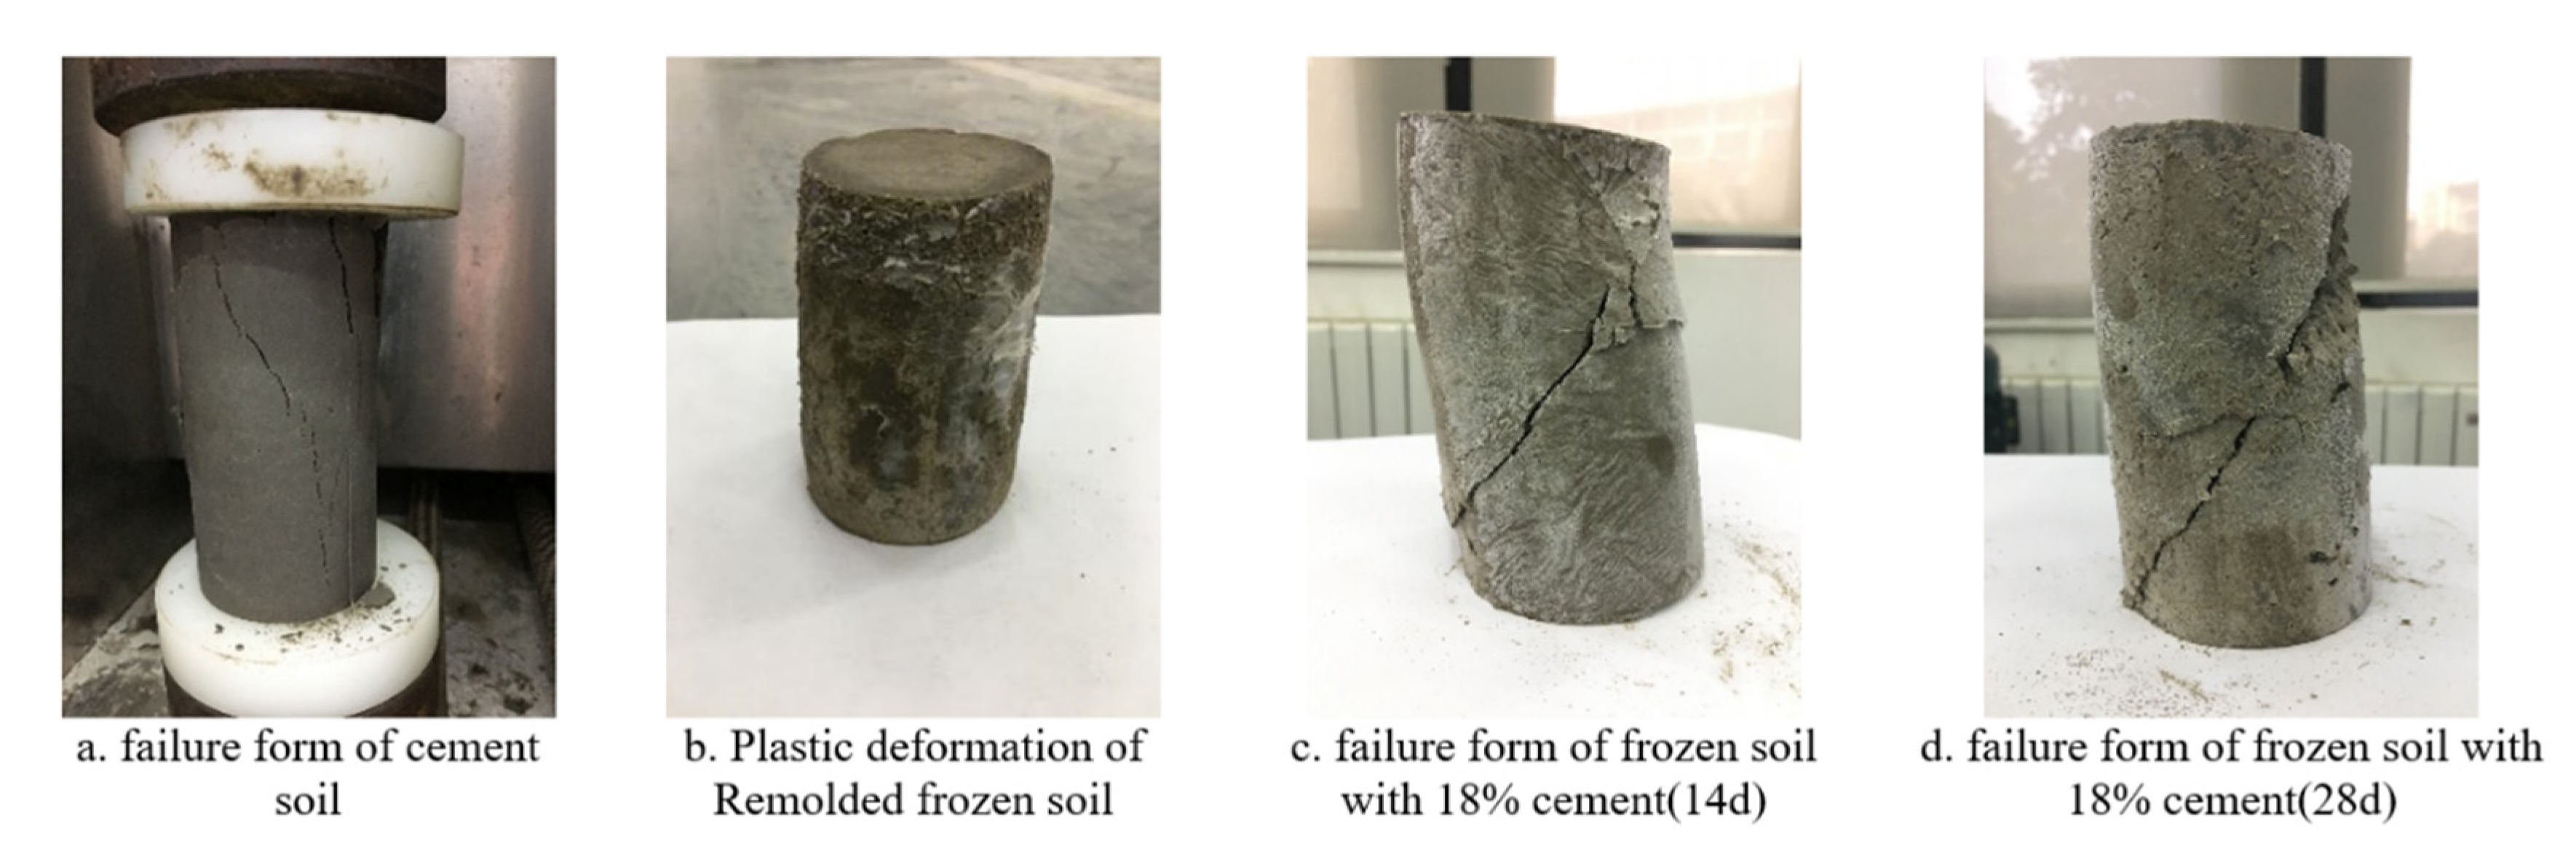
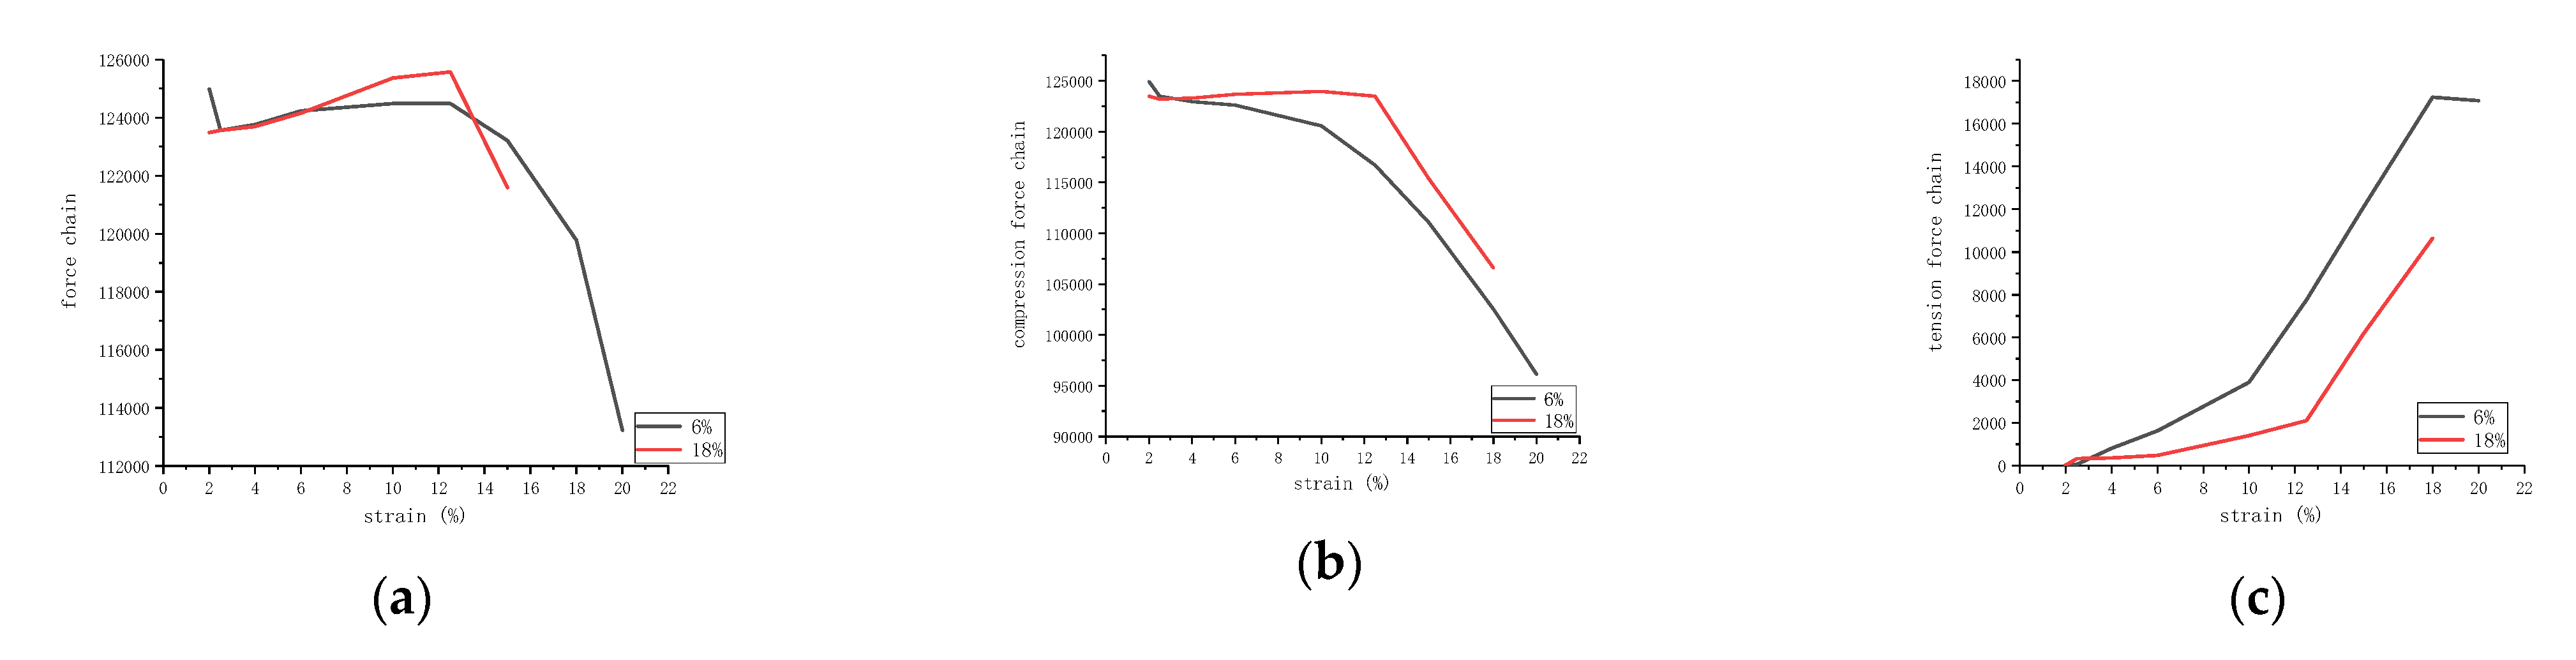
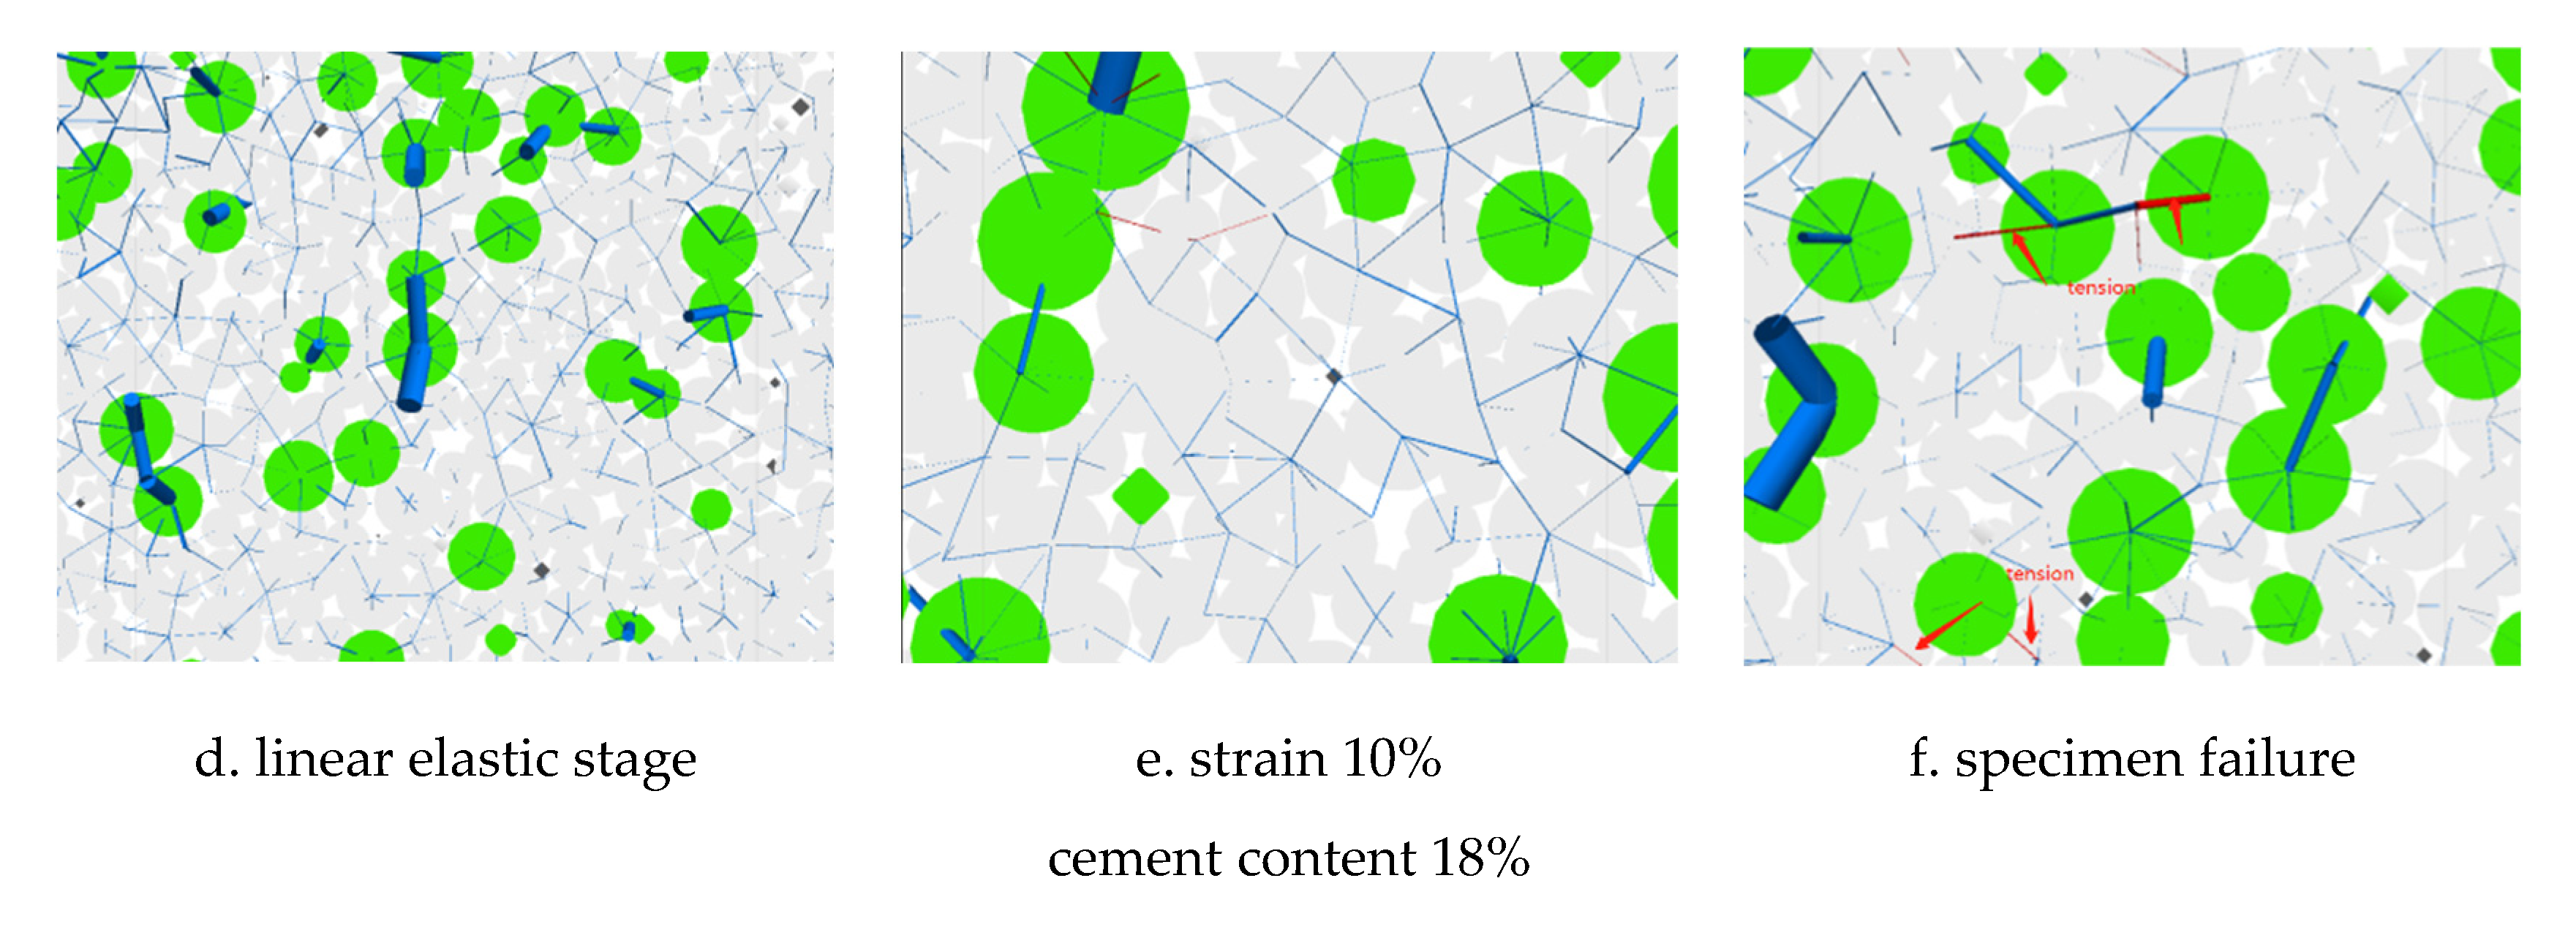
  • In the laboratory test, the order of cement-improved frozen soil in terms of peak strength is: cement soil < remolded frozen soil < 6% cement-modified frozen soil < 12% cement-modified frozen soil < 18% cement-modified frozen soil. With the increase in cement content, the curve changes from “linear elastic deformation-strain strengthening-plastic deformation-tensile failure” to “linear elastic deformation-strain strengthening-tensile shear failure”.
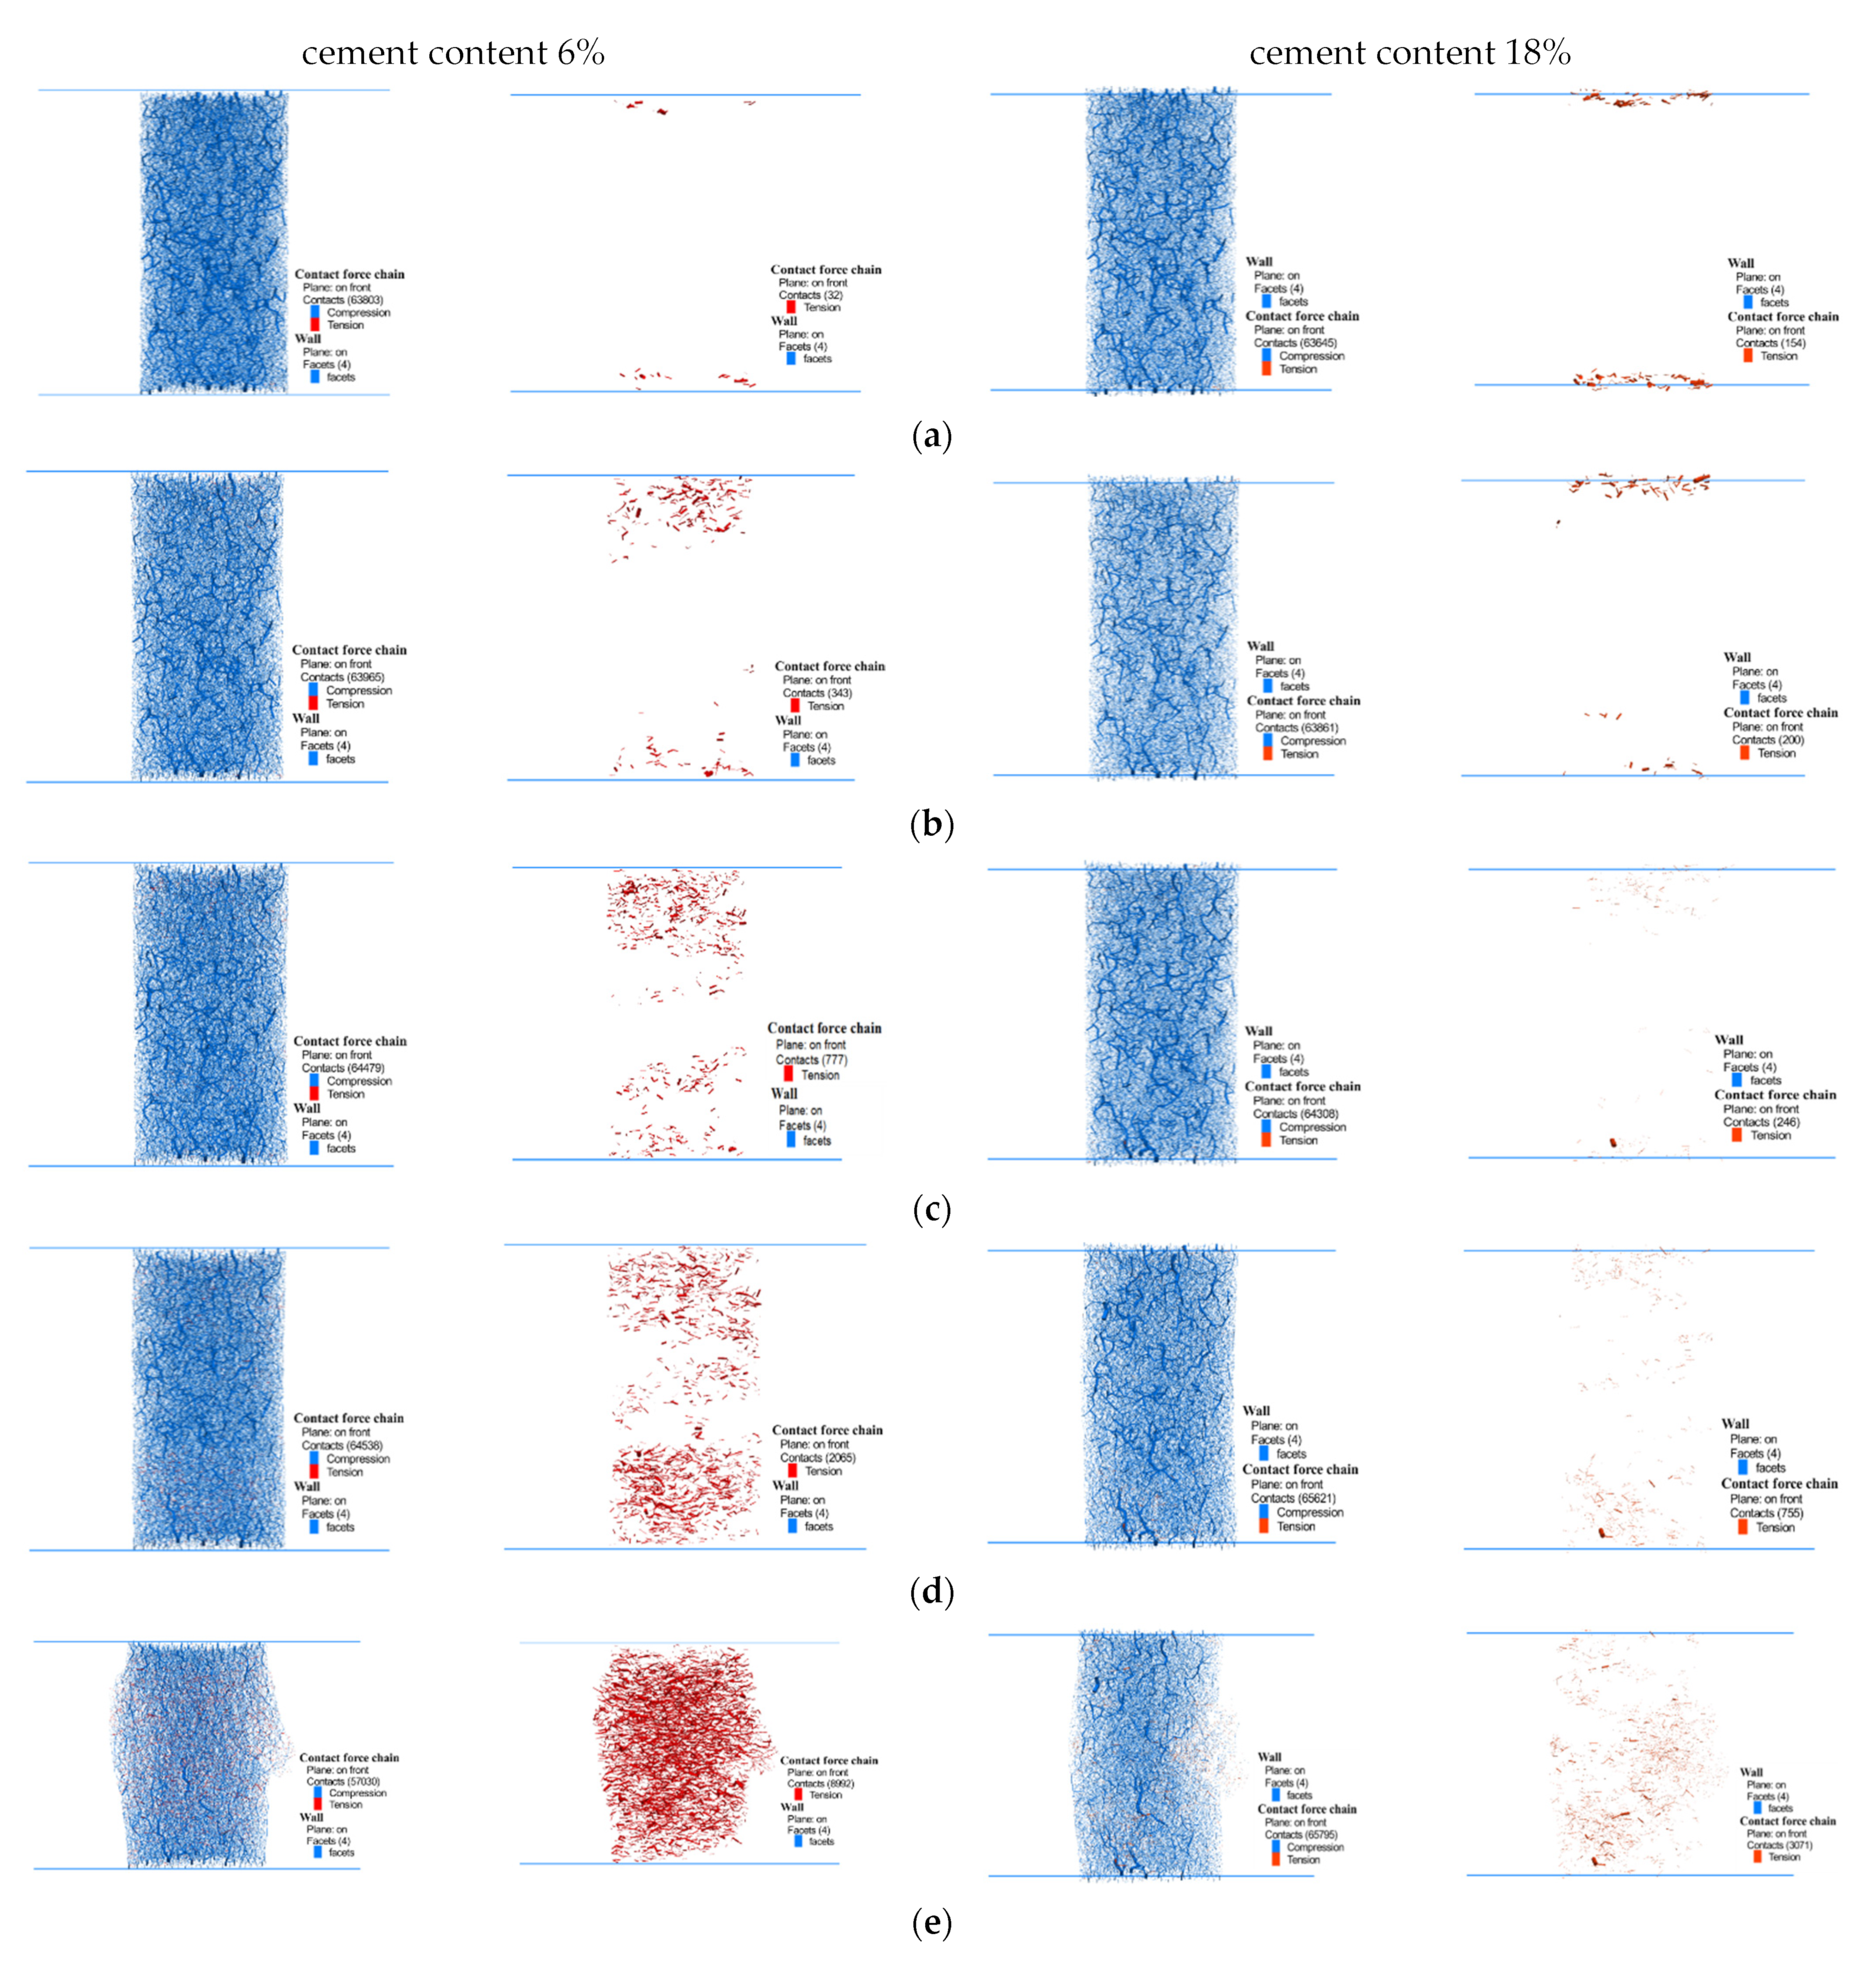
  • Under the same loading conditions, the initial location of the cracks in the samples with different cement contents is basically the same, and the increase in cement content can prolong the time of crack occurrence. With the same strain level, the number of cracks in the sample decreases with the increase in cement content.
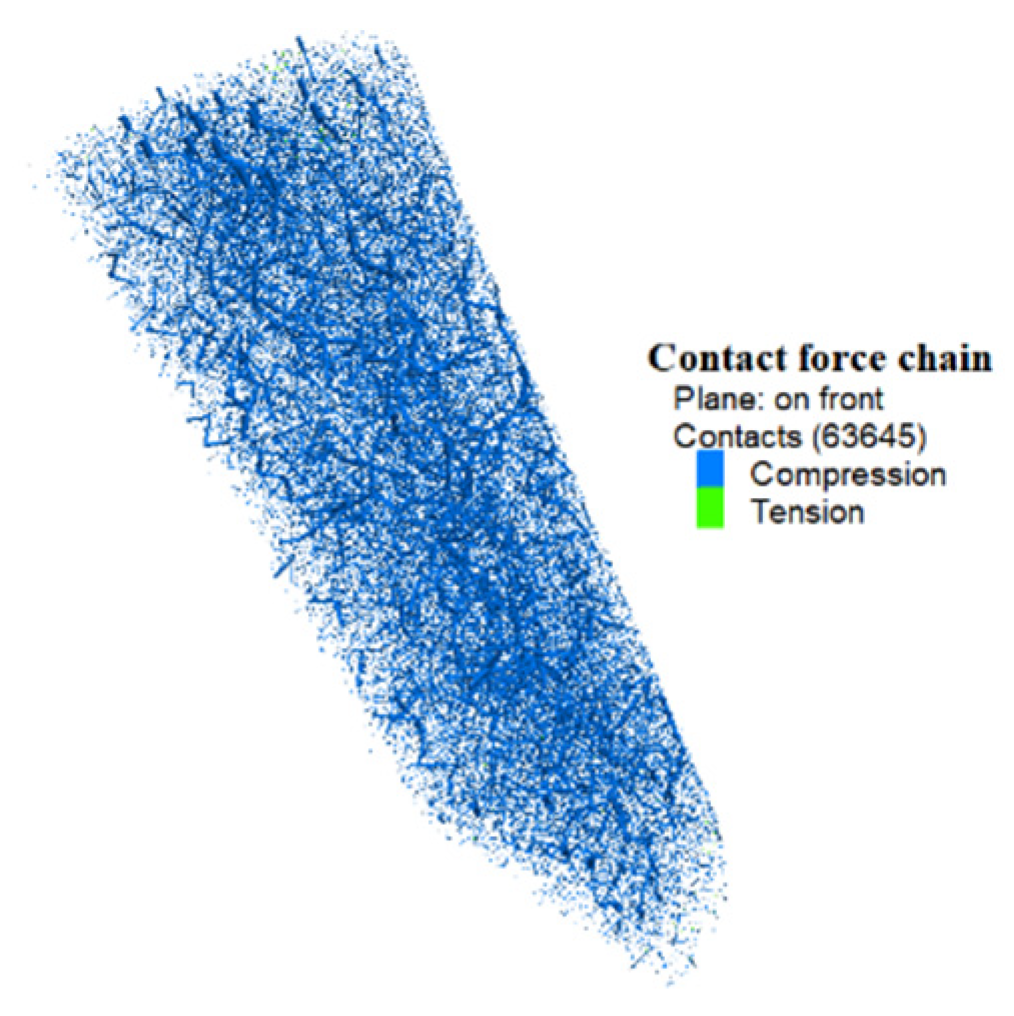
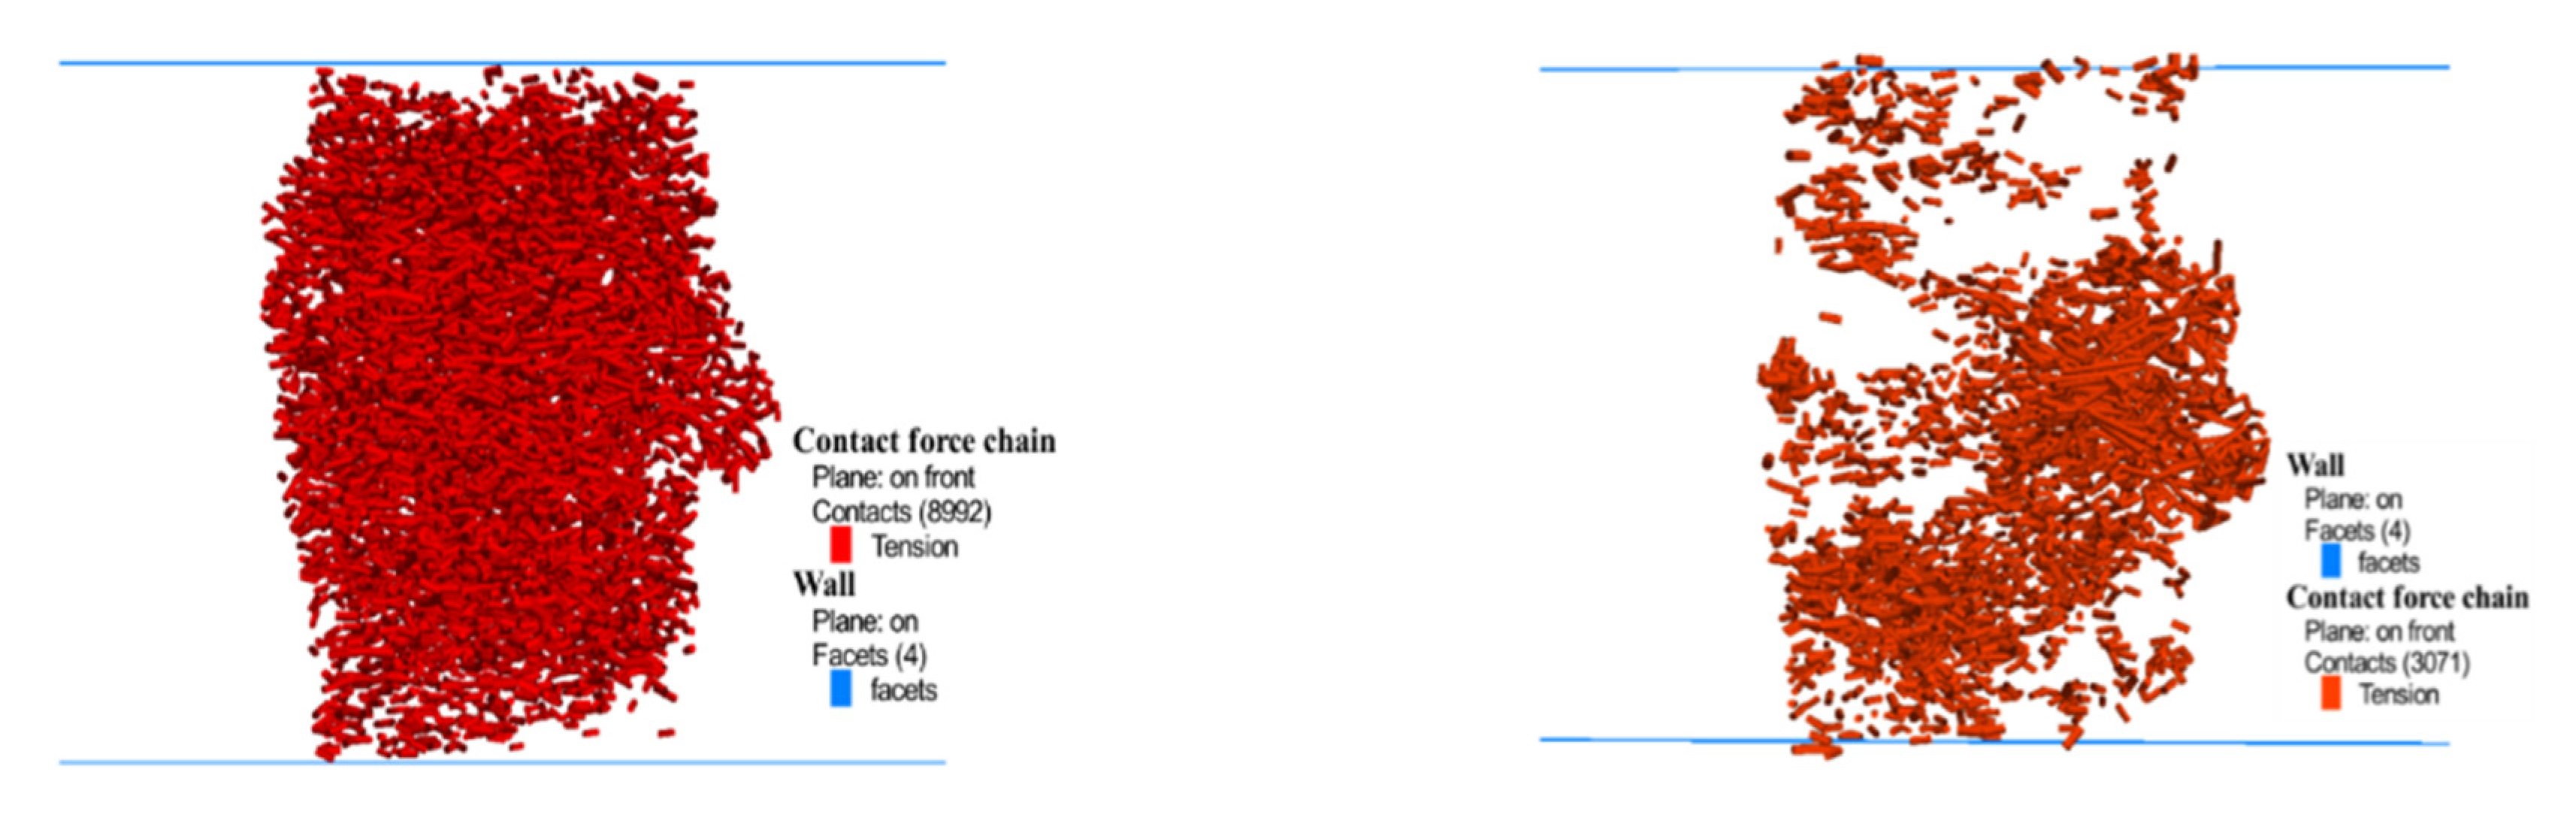
  • The stress field of the sample is in compression at the linear elastic stage, and the tensile stress chain is activated continuously with loading. At the linear elastic stage and strain strengthening state, new compressive stress chains are increasingly activated. For samples with a high cement content, more compressive stress chains are activated and less tensile stress chains are activated; when the activated tensile stress is smaller, the position of the tensile stress activation is differentiated due to different cement contents. When the specimen is damaged, the 6% specimen is mainly damaged by tensile plastic failure, and the 18% specimen is damaged by tensile shear failure.
  • The force chains in the stress field are not evenly distributed in the sample, and the coarse pressure force chains only exist on the cement particles. With the progress of loading, the tensile stress first appears in the connection of soil particles. When the pressure force chains of the cement particles in the sample are damaged or the tensile force chains between particles appear, this indicates that the sample is damaged.
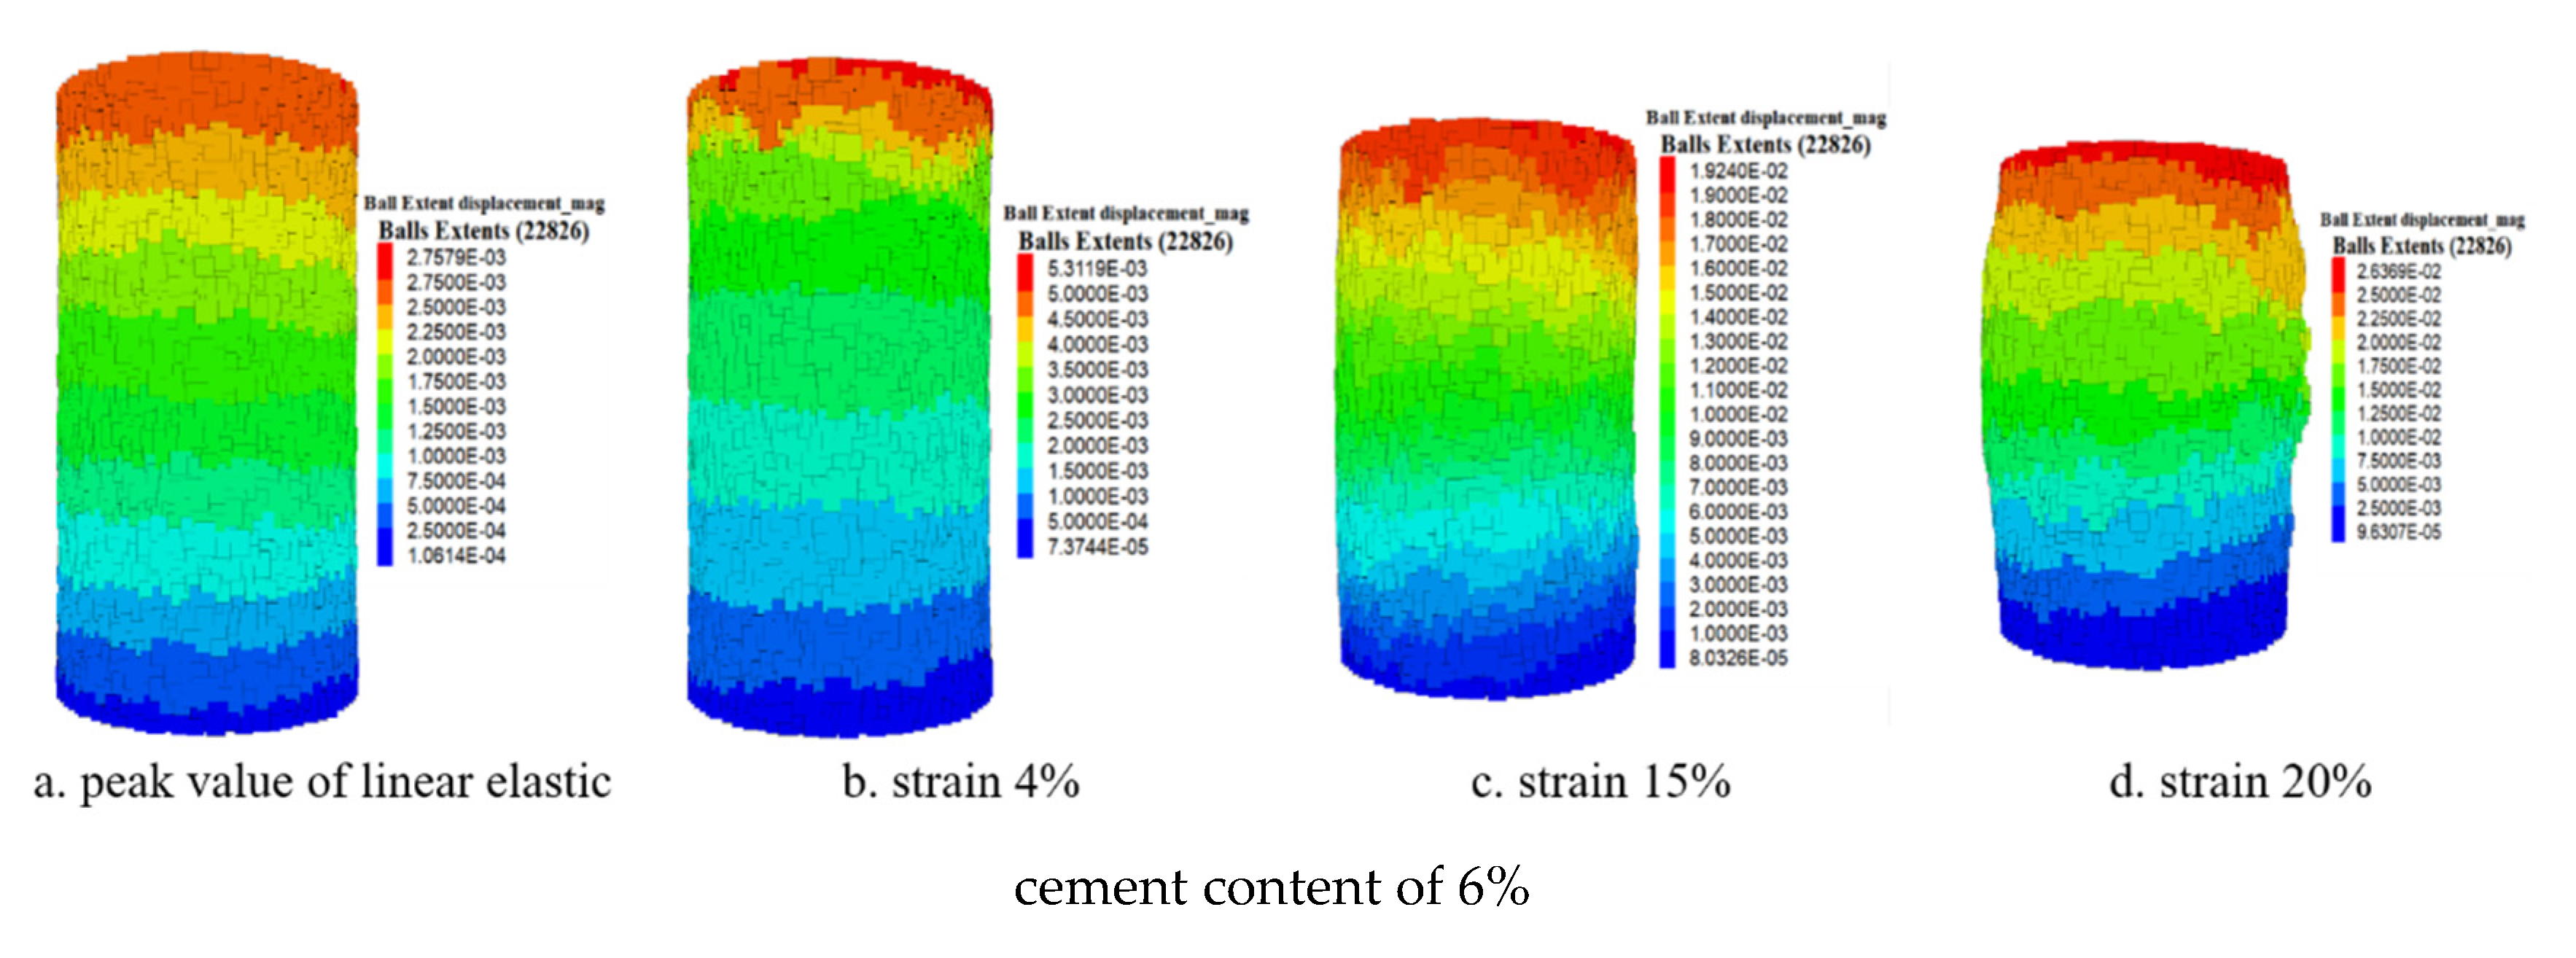
  • With different cement contents, the development of a particle displacement field is different. The sample with 18% cement content has obvious delamination dislocation, with a smaller deformation in the transverse direction, mainly concentrated in the axial direction, while the 6% sample has no delamination dislocation, and has a larger deformation in the transverse and axial directions.

Author Contributions

Conceptualization, F.D. and F.Y.; software, F.D.; validation, F.D., F.Y. and L.S.; formal analysis, F.D.; resources, F.D.; data curation, F.D. administration, L.S. funding acquisition, F.Y. All authors have read and agreed to the published version of the manuscript.

Funding

This research received no external funding.

Institutional Review Board Statement

Not applicable.

Informed Consent Statement

Not applicable.

Data Availability Statement

The details of the test data are sent to the publishing house in the form of e-mail.

Conflicts of Interest

The authors declare no conflict of interest.

References

  1. Prisinski, J.R.; Bhattacharja, S. Effectiveness of Portland cement and lime in stabilizing clay soils. J. Transport. Res. Rep. 1999, 1, 215–227. [Google Scholar] [CrossRef]
  2. Shihata, S.A.; Baghdadi, Z.A. Simplified Method to Assess Freeze-Thaw Durability of Soil Cement. J. Mater. Civ. Eng. 2001, 13, 243–247. [Google Scholar] [CrossRef]
  3. Croft, J.B. The influence of soil mineralogical composition on cement stabilization. Geotechnique 1967, 17, 119–135. [Google Scholar] [CrossRef]
  4. Qiang, M.; Li, S.; Qianyun, S. Experimental Study on the Mechanical Properties of Fly Ash Cement soil. Univ. Shanghai Sci. Technol. 2017, 39, 490–496. [Google Scholar]
  5. Da-Shuang, W.; Jun-Jie, Y.; Meng-Rong, D.; Xiao-Teng, S.; Xiao-Pian, W. Laboratory Test on the Prediction of Cement Soil Strength. Period. Ocean. Univ. China 2018, 48, 96–102. [Google Scholar]
  6. Yixin, T.; Hanlong, L.; Wei, Z. Study on engineering properties of cement-stabilized soil. Chiness J. Geotech. Eng. 2000, 22, 549–554. [Google Scholar]
  7. Huang, X.; Ning, J.G.; Guo, Y.; Zhu, B.L. Effect of cement content on the structural formation of stabilized soil. Chin. J. Geotech. Eng. 2006, 28, 436–441. [Google Scholar]
  8. Wang, J.; Ding, G.-Y.; Pan, L.-Y.; Cai, Y.-Q.; Gao, Y.-F. Study of mechanics behavior and constitutive model of cemented soil under static triaxial tests. Rock Soil Mech. 2010, 31, 67–72. [Google Scholar]
  9. Liang, R.-W.; Zhang, M.; Bai, X.-H. Analysis of laboratory test results of cemented soil. Rock Soil Mech. 2001, 22, 91–93. [Google Scholar]
  10. Horpibulsuk, S.; Miura, N.; Nagaraj, T.S. Clay-water/cement ratio identity for cement admixed soft clays. J. Geotech. Geoenviron. Eng. 2005, 131, 187–192. [Google Scholar] [CrossRef]
  11. Niu, Y.-Q.; Wang, X.; Liao, M.-K.; Jiang, D.-J.; Liu, D.-R. Experimental study on triaxial strength and deformation characteristics of frozen-improved loess. Chin. J. Geotech. Eng. 2016, 38, 198–203. [Google Scholar]
  12. Yin, Z.-H.; Zhang, J.-M.; Zhang, H.; Wang, H.-L. Water transformation law of cement improved frozen soil and its effect on strength. J. Harbin Inst. Technol. 2021, 53, 136–144. [Google Scholar]
  13. Chai, M.; Zhang, J. Improvement of Compressibility and Thaw-Settlement Properties of Warm and Ice-Rich Frozen Soil with Cement and Additives. Materials 2019, 12, 1068. [Google Scholar] [CrossRef] [Green Version]
  14. Chai, M.; Zhang, H.; Zhang, J.; Zhang, Z. Effect of cement additives on unconfined compressive strength of warm and ice-rich frozen soil. Constr. Build. Mater. 2017, 149, 861–868. [Google Scholar] [CrossRef]
  15. Ma, H.; Zhang, Z.; Yue, F.; Fan, Y. Strength variation law of frozen cement-treated silty clay. Sci. Technol. Eng. 2018, 18, 291–296. [Google Scholar]
  16. Cundall, P.A. A computer model for simulating progressive large scale movements in blocky rock systems. In Proceedings of the Symposium of the International Society for Rock Mechanics, Nancy, France, 4–6 October 1971; Volume I. Number 8. [Google Scholar]
  17. Burman, B.C. A discrete numerical-model for granular assemblies. Géotechnique 1980, 30, 331–334. [Google Scholar]
  18. Bock, H.; Bluemling, P.; Konietzky, H. Study of the micro-mechanical behaviour of the Opalinus Clay: An example of co-operation across the ground engineering disciplines. Bull. Eng. Geol. Environ. 2006, 65, 195–207. [Google Scholar] [CrossRef]
  19. Vardoulakis, I.; Mühlhaus, H.B. The thickness of shear bands in granular materials. Geotechnique 1987, 37, 271–283. [Google Scholar]
  20. Geng, L.; Huang, Z.-Q.; Miao, Y. Meso-mechanics Simulation Triaxial Test of Coarse-grained Soil. J. Civ. Eng. Manag. 2011, 28, 24–29. [Google Scholar]
  21. Ning, L.; Yue, G. Particle Flow Simulation of Triaxial Test of Transparent Sand. In Proceedings of the National Academic Conference on Engineering Geology, Xining, China, 2 August 2011; pp. 311–317. [Google Scholar]
  22. Liu, Y.; Zhu, J.; Yan, B. Meso-mechanical simulation study on triaxial test of coarse—Grained soil based on DEM. J. Railw. Sci. Eng. 2014, 4, 58–62. [Google Scholar]
  23. Jensen, R.P.; Bosscher, P.J.; Plesha, M.E.; Edil, T.B. DEM simulation of granular media-structure interface: Effects of surface roughness and particle shape. Int. J. Numer. Numer. Anal. Methods Geomech. 1999, 23, 531–547. [Google Scholar] [CrossRef]
  24. Yang, B.; Yue, J.; Lei, S. A study on the effects of microparameters on macroproperties for specimens created by bonded particles. Eng. Comput. 2006, 23, 607–631. [Google Scholar] [CrossRef]
  25. Dop, A.; Pac, B. A bonded-particle model for rock. Int. J. Rock Mech. Min. Sci. 2004, 41, 1329–1364. [Google Scholar]
  26. Utili, S.; Nova, R. DEM analysis of bonded granular geomaterials. Int. J. Numer. Anal. Methods Geomech. 2010, 32, 1997–2031. [Google Scholar] [CrossRef]
  27. Zhang, C.; Gu, S.; Wang, X. Research on Relationship between Macro-parameters and Micro-parameters of Rock-soil Samples Based on PFC. Subgrade Eng. 2020, 6, 47–53. [Google Scholar]
  28. Liu, C.; Chen, X.X.; Zhang, W.; Wang, S. Study on the Calibration Process of Parallel Bonding Meso-structure Parameter in PFC Numerical Simulation. Value Eng. 2017, 36, 204–207. [Google Scholar]
Figure 1. Stress–strain curves of different cement contents. (a). Stress–strain curve of 6% cement content. (b). Stress–strain curve of 12% cement content. (c). Stress–strain curve of 18% cement content.
Processes 10 00324 g001
Figure 2. Relationship between cement content and strength and elastic modulus. (a) Stress–strain curves of 7 d cement frozen soil, frozen soil, and cement soil. (b) Stress–strain curves of 14 d cement frozen soil, frozen soil and cement soil. (c) Peak strength of different cement contents. (d) Elastic modulus of different cement contents.
Processes 10 00324 g002
Figure 3. Relationship between curing age, strength, and elastic modulus. (a) Peak strength at different curing ages. (b) Elastic modulus at different curing ages.
Processes 10 00324 g003
Figure 4. Failure modes of specimens.
Processes 10 00324 g004
Figure 5. Schematic diagram of linear parallel bonding model.
Processes 10 00324 g005
Figure 6. Failure diagram of linear parallel bonding model.
Processes 10 00324 g006
Figure 7. Model particle distribution and final uniaxial compression model.
Processes 10 00324 g007
Figure 8. Comparisons between numerical and experimental results. (a) Cement content 6%. (b) Cement content 18%.
Processes 10 00324 g008
Figure 9. Comparison of crack development of cement contents of 6% and 18%.
Processes 10 00324 g009
Figure 10. Force chain diagram of a semi-cylindrical sample.
Processes 10 00324 g010
Figure 11. Comparison of stress field. (a) Linear elastic stage. (b) Strain 4%. (c) Strain 6%. (d) Strain 10%. (e) Specimen failure.
Processes 10 00324 g011
Figure 12. Force chain development of two samples. (a) Variation process of total force chain of two samples. (b) Variation process of compression force chain of two samples. (c) Variation process of tensile force chain of two samples.
Processes 10 00324 g012
Figure 13. Comparison of tensile stress positions during failure.
Processes 10 00324 g013
Figure 14. Local enlarged drawing of numerical model with different strains.
Processes 10 00324 g014aProcesses 10 00324 g014b
Figure 15. Displacement field of particles with different strains.
Processes 10 00324 g015aProcesses 10 00324 g015b
Table 1. Basic parameters of clay.
Soil Layerρ
(kg/m3)
ω0 (%)eωd (%)ωP
(%)
ωL
(%)
IP (%)IL
silty clay1780361.132823.537140.86
Table 2. Grain composition of soil sample.
Soil TypeParticle Composition
GritPowder ParticleCosmid
grain size/mm 0.5~0.250.25~0.0750.075~0.005<0.005
comparative content/% 013.161.225.7
Table 3. Strength parameters of frozen remolded soil specimens.
Sample
(W%-T)
Intensity/MPaPeak Strength/MPaFailure Strain/%Eσ/2/MPa
40-104.714.898.84110.05
Table 4. Strength parameter value of cement soil sample.
Sample
(W%-I%-day)
Intensity/MPaPeak Strength/MPaFailure Strain/%Eσ/2/MPa
40-18-72.602.601.8897.01
40-18-142.792.792.15112.5
40-18-243.263.262.04116.43
Table 5. Strength parameter value of cement frozen soil sample.
Sample
(W%-T-I%-day)
Intensity/MPaPeak Strength/MPaFailure Strain/%Eσ/2/MPa
40-10-6-75.345.4819.03159.30
40-10-6-146.356.6318.00223.97
40-10-6-286.026.1918.01173.88
40-10-12-75.776.3410.01175.14
40-10-12-146.196.828.12217.20
40-10-12-286.217.168.16237.09
40-10-18-76.239.339.12183.14
40-10-18-148.8911.349.03236.25
40-10-18-289.0111.457.01322.54
Table 6. Particle radius and density.
Particle NameArticle Size Range (mm)Density (kg/m3)
cement2.2 × 10−3–2.8 × 10−33150
soil11.25 × 10−3–1.6 × 10−31780
soil21.6 × 10−3–2.0 × 10−31780
Table 7. Initial values of linear parallel bonding model and initial value.
KeywordSymbolDescriptionInitial Value
mod Ε modulus [force/area]48 × 106
emod E * Effective modulus [force/area]48 × 106
kratio κ * Normal-to-shear stiffness ratio1
tension g s Tensile strength [stress]2.4 × 10⁶
Cohesion c Cohesion [stress]1.2 × 10⁶
fric μ friction coefficient [-]0.5
fa ϕ friction angle [degrees]20
pb_emod Ε * _ bond Effective modulus46 × 106
pb_kratio κ * _ bond Normal-to-shear stiffness ratio1
pb_tension σ c _ bond Tensile strength [stress]2.4 × 10⁶
pb_coh c _ bond Cohesion strength [stress]1.2 × 10⁶
pb_fric μ bond friction coefficient0.5
pb_fa ϕ _ bond friction angle [degrees]20
pb_rmul λ _ radius multiplier [-]1
Publisher’s Note: MDPI stays neutral with regard to jurisdictional claims in published maps and institutional affiliations.

