Article

Experimental and Numerical Investigation of the Dehydration of Ca(OH)2 at Low Steam Pressures

1
German Aerospace Center (DLR), Linder Höhe, 51147 Cologne, Germany
2
German Aerospace Center (DLR), Pfaffenwaldring 38-40, 70569 Stuttgart, Germany
3
Laboratory for Zero-Carbon Energy, Institute of Innovative Research, Tokyo Institute of Technology, 2-12-1-N1-22, O-okayama, Meguro-ku, Tokyo 152-8550, Japan
*
Author to whom correspondence should be addressed.
Processes 2022, 10(2), 325; https://doi.org/10.3390/pr10020325
Submission received: 20 January 2022 / Revised: 2 February 2022 / Accepted: 6 February 2022 / Published: 8 February 2022
(This article belongs to the Special Issue Advances in Thermochemical Energy Storage)

Abstract

:
The CaO/Ca(OH)2 system can be the basis for cost-efficient long-term energy storage, as the chemically stored energy is not affected by heat losses, and the raw material is cheap and abundantly available. While the hydration (thermal discharge) has already been addressed by several studies, for the dehydration (thermal charge) at low partial steam pressures, there is a lack of numerical studies validated at different conditions and operation modes. However, the operation at low steam pressures is important, as it decreases the dehydration temperature, which can enable the use of waste heat. Even if higher charging temperatures are available, for example by incorporating electrical energy, the reaction rate can be increased by lowering the steam pressure. At low pressures and temperatures, the limiting steps in a reactor might change compared to previous studies. In particular, the reaction kinetics might become limiting due to a decreased reaction rate at lower temperatures, or the reduced steam density at low pressures could result in high velocities, causing a gas transport limitation. Therefore, we conducted new measurements with a thermogravimetric analyzer only for the specific steam partial pressure range between 0.8 and 5.5 kPa. Based on these measurements, we derived a new mathematical fit for the reaction rate for the temperature range between 375 and 440 °C. Additionally, we performed experiments in an indirectly heated fixed bed reactor with two different operation modes in a pressure range between 2.8 and 4.8 kPa and set up a numerical model. The numerical results show that the model appropriately describes the reactor behavior and is validated within the measurement uncertainty. Moreover, our study revealed an important impact of the operation condition itself: the permeability of the reactive bulk is significantly increased if the dehydration is initiated by a rapid pressure reduction compared to an isobaric dehydration by a temperature increase. We conclude that the pressure reduction leads to structural changes in the bulk, such as channeling, which enhances the gas transport. This finding could reduce the complexity of future reactor designs. Finally, the presented model can assist the design of thermochemical reactors in the validated pressure and temperature range.

1. Introduction

One possible way to store large amounts of energy and thereby better utilize intermittent renewable energy sources is thermal energy storage. Using a chemical reaction as a thermochemical energy storage offers several advantages, as the chemically stored energy is not affected by thermal losses and the energy density is comparatively high. Another advantage of gas-solid reactions is that heat can also be transformed by adjusting the pressure of the gaseous component [1,2]. The reversible reaction of CaO with steam forming Ca(OH)2 is promising, as the base materials are non-toxic, industrially available, and comparatively cost-efficient. Consequently, the properties of this reaction system have been addressed by several studies. The cycle stability was proven [3,4], and different formulations for the thermodynamic equilibrium were proposed (e.g., [5,6]). Effective thermal conductivities of the bulk depend on the level of compression and are measured usually between 0.1 and 0.4 W/m/K [7].
For a storage application, it is desirable to dehydrate (i.e., thermally charge) the material at low temperatures, which requires the operation of the reactor at a low steam pressure. A closed steam system can achieve low pressures already by ambient cooling (e.g., a steam pressure of 5.5 kPa equals a temperature of 35 °C). Such a system can enable the utilization of waste heat for charging at temperatures below 400 °C. For the EU, for instance, more than 40% of the industrial waste heat would then be suitable [8]. Operation at a low steam pressure is also desirable when higher temperatures are available as a lower steam pressure increases the dehydration reaction rate. To support further reactor designs, numerical models are required, including suitable reaction kinetics and experiments to validate the models.
There are several kinetics studies on the dehydration of purged systems, thus working at negligible steam partial pressure (e.g., [9,10,11]). However, it was shown that even a low steam partial pressure can have a significant impact on the dehydration kinetics [12]. Matsuda et al. [13] performed measurements with a steam partial pressure between 1.5 and 15.7 kPa and different particle sizes between 5 and 900 µm. They assumed a two-step kinetics and found that the reaction rate is inversely proportional to the particle size. This impact of the particle size was also found by Criado et al. [14], but their kinetics used a single-step assumption based on measurements between 0 and 100 kPa steam partial pressure. Schaube et al. [4] derived two equations for a conversion below and above 0.2 and covered a pressure range between 0 and 95.6 kPa. For a higher pressure range between 50 and 500 kPa, Angerer et al. [15] derived a kinetics equation. These studies yield significantly different equations for the effective reactive rate, since the analyzed temperature and pressure range as well as the material’s composition and particle size varied. Thus, there is currently no universally valid kinetics equation for the dehydration of Ca(OH)2.
For heat storage systems with pure Ca(OH)2/CaO, mainly three reactor types are utilized. These are fluidized beds [16,17,18], directly permeated fixed beds [19], and indirect fixed beds (e.g., [20,21,22]). While several studies show measurements with these reactor types (e.g., [23] for an overview), there are only few measurements at low steam partial pressures. For instance, Criado et al. [16] performed dehydrations at steam partial pressures of 0 and 8 kPa in a bubbling fluidized bed reactor with a CaO mass between 1.8 and 2.5 kg. Schaube et al. [19] focused on the impact of different parameters on the hydration in a permeated 60 g fixed bed but also investigated the dehydration using a single steam partial pressure of 1.4 kPa. As an example for an indirectly heated fixed bed, Schmidt et al. performed several experiments in a reactor with 2.4 kg Ca(OH)2 [24]. However, they mainly measured at a pressure of 10 kPa and performed only one experiment at 1.4 kPa steam pressure. Since most studies focused on the hydration reaction, usually only a single steam pressure was used for the dehydration measurements, and there is not much data on pressure variations at low steam pressures, yet.
Several numerical studies of the reaction system have been conducted for each reactor type, and the impact on different parameters has been analyzed. Criado et al. [16] and Angerer et al. [15] used a model based on a gas phase and an emulsion phase to describe their experiments of a bubbling fluidized bed. A comprehensive model for a permeated fixed bed was introduced by Nagel et al. [25], and several simplified models were applied to this reactor type (e.g., [26,27]). For an indirectly heated fixed bed, some models with similar governing equations were utilized (e.g., [28,29,30]). However, few numerical analyses addressed the dehydration at low steam pressures, and due to the lack of experimental data, the numerical results have only been compared to single measurements.
Therefore, in this study, the dehydration of Ca(OH)2 at steam partial pressures below 5.5 kPa is analyzed comprehensively. We conducted measurements between 0.8 and 5.5 kPa steam partial pressure in a thermogravimetric analyzer (TGA) and fitted a mathematical model to these measurements to describe the reaction rates. Moreover, we performed lab-scale dehydration experiments in an indirectly heated fixed bed reactor in a pressure range of 2.8 to 4.8 kPa with varying thermal input and two different operation modes. With the derived fit for the reaction rate, we performed a finite-element simulation of these experiments and compared the results. Finally, a sensitivity analysis of the reactor was performed to show the limitations of the reactor.

2. Materials and Methods

2.1. Thermogravimetric Dehydration Measurements and Fit of the Effective Reaction Rate

For the determination of the effective reaction rate, analytical grade Ca(OH)2 with a minimum purity of 96% and a maximum concentration of CaCO3 of 3% was used. The average particle diameter (dp50) was 10.4 µm. Isothermal and isobaric measurements as well as dynamic, isobaric measurements with a heating rate of 5 K/min of the mass change were performed in a TGA setup [24]. The sample size was around 5.5 mg Ca(OH)2, and the gas volume flow, consisting of nitrogen or a nitrogen steam mixture, was set to 100 mL/min. To archive isothermal measurements, the gas composition was switched to a lower steam fraction, that enabled the reaction, after the sample temperatures had stabilized. After each dehydration measurement for a given pressure, the CaO was re-hydrated at 270 °C and 15 kPa steam partial pressure. Measurements were performed between 0.8 and 5.5 kPa steam partial pressure and temperatures between 365 and 440 °C, as stated in Table 1.
For the mathematical fit of the TGA measurements, it is assumed that the effective reaction rate in the rather small analyzed temperature and pressure range can be described by a single-step reaction consisting of the product of a temperature-, pressure- and conversion-dependent term, f T , h p , p Eq T   and g X , respectively, as depicted in Equation (1):
d X d t = f T h p , p Eq T g X .
For the temperature-dependent term, the Arrhenius equation ( f T = A exp E a   / R T with A being the pre-exponential coefficient, E a being the apparent activation energy, and R being the universal gas constant is used.
The fitting procedure consists of two steps. In the first step, a linear fit of the time-dependent conversion for isobaric and isothermal measurements is performed as described by Schaube et al. [4]. For these conditions, the conversion-dependent term can directly be compared to common reaction mechanism terms (i.e., the conversion-dependent term) stated by [31] to identify a suitable reaction mechanism. For the linear fit as well as for all other calculations and graphs, the equilibrium equation from Samms and Evans [6] is used to calculated the equilibrium pressure. Several common pressure-dependent terms are tested, and the one yielding the highest linearity in an Arrhenius plot is then utilized. Finally, the apparent activation energy and pre-exponential factor are determined by a linear fit in the Arrhenius plot.
As suggested by Vyazovkina et al. [31], the result of the linear fit is used as the initial values in a second step, which is a non-linear fit. By minimizing the quadratic differences, the fit optimizes all parameters simultaneously for all experiments (index exp), including also the non-isothermal measurements, according to Equation (2):
min i j X exp , i | j X fit , i | j 2   .
Here, j is a certain point in time in the measurement and i indicates each measurement. For each experiment, the same amount of time points is used to equally weight each measurement in the optimization. In addition to the result of the linear fit, also previously published kinetics are used as initial values for the non-linear fit. As pressure-dependent terms in Equation (1), the commonly used expression h p , p Eq T = 1 p / p Eq T a , as well as an expression by Koga et al. [12],
h p , p Eq T = p 0 p a 1 p p Eq T b ,
are used in the non-linear optimization. Here, p 0 is the standard pressure and a and b are fitting constants. For the conversion-dependent term, a generalized expression by Sestak and Breggren [32] with fitting parameters m, n and p’ is employed:
g X = X m 1 X n ln 1 X p .
The Levenberg–Marquardt as well as the Nelder–Mead algorithm as implemented in the “lmfit” library (version 1.0.3 [33]) are used for the iterative optimization. Since the parameter space for the non-linear fit is significantly larger than for the linear fit (i.e., 7 adjustable parameters for the non-linear fit instead of 2 plus a manually chosen conversion- and pressure-dependent term for the linear fit), a better fit is expectable, but the physical processes leading to the reaction rate might not be easily identified. For the non-linear fit, all parameters are constrained to ensure positive values. Maximum values of A and E a are set to 1030 1/s and 500 kJ/mol, respectively, while all other parameters have a maximum of 30 to avoid numerical problems during fitting. The results of the first step are omitted here, and only the results of the non-linear fit are given below.

2.2. Lab-Scale Experiments

Lab-scale experiments were performed in an indirectly heated cylindrical fixed bed reactor with a height of 70 mm and an inner diameter of 48 mm, as depicted in Figure 1a. Details of the reactor are described by Funayama et al. [34,35]. The reactor is placed in a reaction chamber to allow for pressure variations. A 500 W sheath heater heats the reactor and a scale measures the weight changes of the reaction chamber caused by the chemical reaction. The reaction chamber is connected to a vacuum pump and a water reservoir. The temperature of the water is controlled to adjust the steam pressure in the system via condensation or evaporation. All connecting pipes are heated to avoid condensation. An amount of 78.98 g Ca(OH)2 with a purity of 99.9% was filled inside the reactor, resulting in a bulk height of 57 mm. Inside the reactor, there are 7 thermocouples, as displayed in Figure 1b, and additionally, there are 2 pressure probes at the vacuum pump (p) and the water reservoir (pc). The theoretical conversion is calculated as the quotient of the time-dependent, measured mass difference to the theoretical mass difference: X exp ,   th = Δ m t / Δ m th . The maximum theoretical mass change for the used Ca(OH)2 mass is 19.2 g. Additionally, a normalized conversion ( X exp , norm = Δ m t / Δ m t = end ) is calculated to compare the experiments to the simulation if full conversion is not reached in the experiments.
Before each experiment, the system has been evacuated via the vacuum pump. Two kinds of dehydration experiments were performed with the reactor. In the first procedure, labeled “T+”, the dehydration is triggered by raising the bulk temperature above the equilibrium temperature for a constant pressure. Here, at the beginning of an experiment, the heater is set to a temperature below the thermodynamic equilibrium, and the reactor is connected to the water reservoir. When a steady state is reached, the experiment is started by setting the temperature of the sheath heater around the reactor to a temperature above the thermodynamic equilibrium, triggering the dehydration reaction after the equilibrium temperature is exceeded. The reaction is considered complete when the temperatures as well as the reactor mass reach a constant level.
In the second dehydration procedure, the reaction is enabled by lowering the pressure and hence labeled “p−“. Initially, a steam pressure above the equilibrium temperature is set in the reaction chamber, and the reactor is disconnected from the water reservoir by a valve. The water temperature is decreased to lower the pressure in the remaining part that is disconnected from the reactor. Then, the reactor is heated up to a set temperature. When the temperatures in the reactor and in the water reservoir stabilize, the valve is opened again, and the pressure equalizes. Consequently, the pressure in the reaction chamber and therefore also the equilibrium temperature decreases rapidly, which initiates the dehydration reaction in the bulk. Again, the experiment is considered finished when the temperature as well as the measured reactor mass reach steady values. Table 2 shows the applied parameters for the conducted experiments.

2.3. Simulation Model

2.3.1. Assumptions and Governing Equations

The model used for the simulation is based on [36], which was already applied to the hydration simulation of CaO. However, the governing equations and assumptions for models of CaO/Ca(OH)2 reaction systems are similar in most simulation studies. To simplify the calculations, the following assumption were made:
  • No strong three-dimensional effects occur, and a two-dimensional rotation symmetric model is sufficient (based on [28]).
  • The CaO/Ca(OH)2 bulk acts as a continuum with an equally distributed density over the whole filling level (i.e., no structural changes of the bulk such as agglomerates occur).
  • The bulk outside the simulated area (Figure 1) has a negligible impact (since there are no further temperature measurements in this area, the temperature field can hardly be validated there).
  • Local thermal equilibrium is assumed.
  • Radiative heat transfer is negligible (based on [26]).
  • The reaction rate is independent from the particle diameter.
The energy balance of the bed is given in Equation (5):
Δ H T X t n Ca OH 2 , 0   = ρ bed X , T , p c p , bed T T t λ bed X , T T + ρ steam T , p c p , steam   T , p u T .
The index bed denotes the effective properties of the bulk filled with steam. Therefore, the properties of steam and bulk (density ρ , isobaric heat capacity c p , and thermal conductivity λ ) are weighted by the porosity ϵ and the solid fraction 1 ϵ , respectively, and summed up. As local thermal equilibrium is assumed, T stands for the temperature of the bulk and the steam. u describes the Darcy velocity of the steam. The molar reaction enthalpy is given by Δ H T . The effective reaction rate X / t describes the change of the conversion X over time t and n Ca OH 2 , 0 is the initial mole number of Ca(OH)2.
The mass transport in the bulk is considered by including Darcy’s law:
p = μ K u .
Here, p stands for the pressure, μ stands for the steam viscosity, and K stands for the permeability. The Carman–Kozeny relationship K = d p 2 ϵ 3 180 1 ϵ 2 is used to calculate the permeability depending on the particle diameter d p and the porosity ϵ .
For the effective reaction rate, we derived an equation based on the TGA measurements as described before. The employed equation is given in the results section (Equation (7)).

2.3.2. Initial and Boundary Conditions

The measured pressure in the beginning of the experiment is used as the initial pressure for the whole bed. Furthermore, the measured pressures are used as boundary condition on the top of the reactor (boundary B1–B2, as shown in Figure 1). The measured temperature at position 0.5R (T0.5R) is set to the whole bulk as initial value, and a linear interpolation of the temperature measurements at the borders of the bulk are used as boundary conditions (boundaries B1–B2, B2–B3–B5, and B4–B5). Therefore, no additional thermal loss mechanisms have to be considered for the simulated area. For B1–B4, a symmetry boundary is used. The parameters used for the bulk are given in Table 3. The reaction enthalpy and isobaric heat capacity are temperature interpolated, and exemplary values are given in the table.
A rectangular mesh with increasing element numbers at the boundaries is used; 80 vertical and 50 horizontal elements build the mesh. Using the time until 90% of the bulk is converted as a characteristic value shows that a further increase in the mesh elements by a factor of 4 has a negligible influence on the characteristic value by 0.1%.

3. Results and Discussion

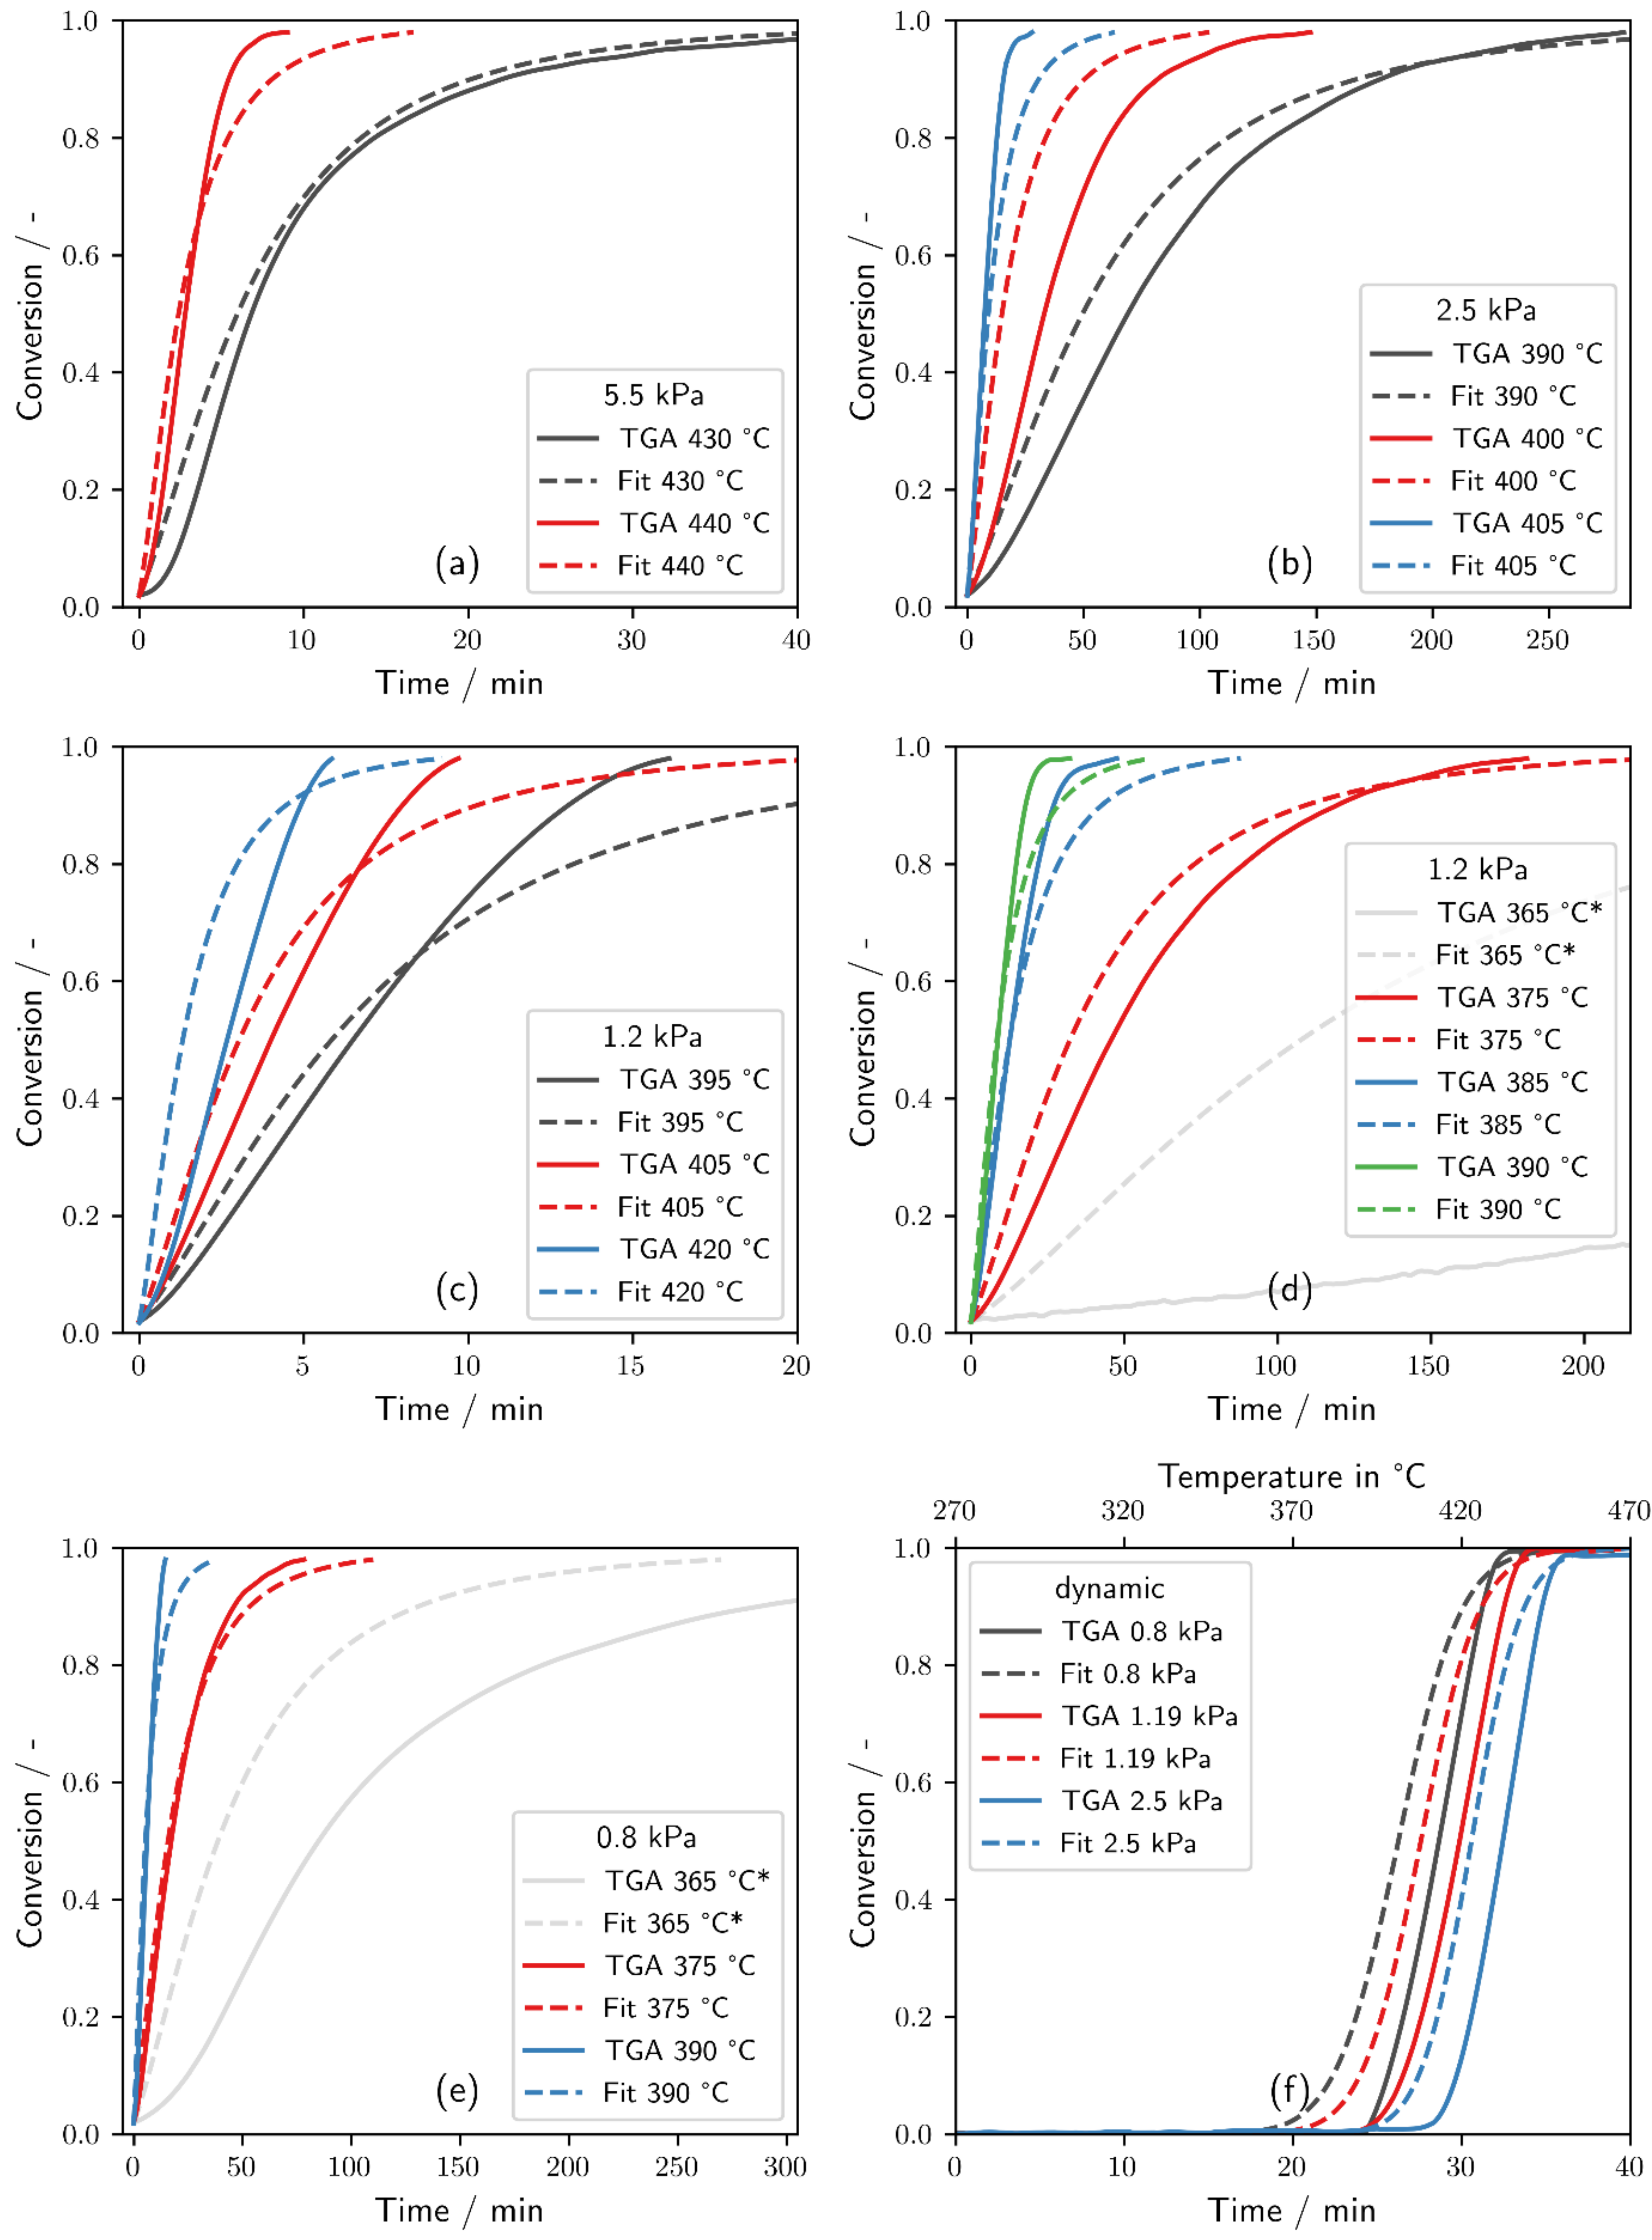
3.1. Thermogravimetric Dehydration Measurements and Fit of the Effective Reaction Rate

Figure 2 displays the results of the isothermal and dynamic TGA experiments (solid lines). The reaction rate increases with higher temperatures and lower pressures, but the time scales vary significantly in the analyzed range. For high temperatures and low pressures (i.e., a large distance to the thermodynamic equilibrium), full conversion can be reached within 5 min (420 °C at 1.2 kPa, Figure 2c), while for a lower distance to the thermodynamic equilibrium, a conversion below 15% is reached after 200 min (365 °C at 1.2 kPa, Figure 2d). Moreover, there is a narrow temperature zone in a range of 40–50 K above the thermodynamic equilibrium temperature where the transition between a comparatively slow and fast conversion takes place. The decrease of 10 K from 375 to 365 °C increases the time for reaching the same conversion by the factor of 6 and 13 for a pressure of 1.2 and 0.8 kPa, respectively (Figure 2d,e). Furthermore, also a pressure change can have a strong impact on the reaction rate: if the pressure is increased at 390 °C from 0.8 to 1.2 kPa (factor 1.47), the time for reaching full conversion is increased by 1.6 times, but if the pressure is approximately tripled to 2.5 kPa, the time until full conversion is reached increases by a factor of 19 (Figure 2e,d,b).
An explanation for this behavior could be the change of the limiting step. Koga et al. [12] found that for isothermal measurements, there is an induction period with negligible mass change followed by a conversion phase with a sigmoidal conversion course. This might be the reason why some studies found an effective onset temperature [13,15]. With the assumed one-step kinetics, we could either fit the curves comparatively close or far from the equilibrium satisfactorily but not the whole range. Since higher reaction rates are more relevant for technical applications, we neglect the TGA measurements with the longest reaction durations (i.e., the gray curves in Figure 2) for the fit. With the remaining 16 measurements, Equation (7) is derived by the minimization of Equation (2):
d X d t = 1.25 × 10 11 min exp 144 , 816 J mol R T 1 p p Eq 7.72 X 0.05 1 X 1.37 ln 1 X 0.22
The dashed lines in Figure 2 are the integral of Equation (7), which show a qualitatively similar behavior to the measurements. The fit has overall a low mean quadratic difference to the measurements in the analyzed temperature and pressure range (i.e., 0.007 compared to 0.26 for the kinetics by Matsuda et al. and 0.071 for the equations by Schaube et al.). However, some qualitative deviations occurred: For isothermal conditions, in most cases, the fit corresponds to the measurement until a conversion of approximately 80% is reached and underestimates the reaction rate for the last phase of the conversion. In the other cases, the fit rather overestimates the reaction rate. While the extrapolation to 365 °C for 1.2 and 0.8 kPa shows a distinct decrease in the overall reaction rate, the measured reaction rate is still significantly overestimated. Although the course of the measurement and fit is similar for the dynamic measurements (Figure 2f), the fitted curves are shifted and precede the measurements by about 2 min (10 K). This can also be attributed to the overestimation of the reaction rate closer to the equilibrium.

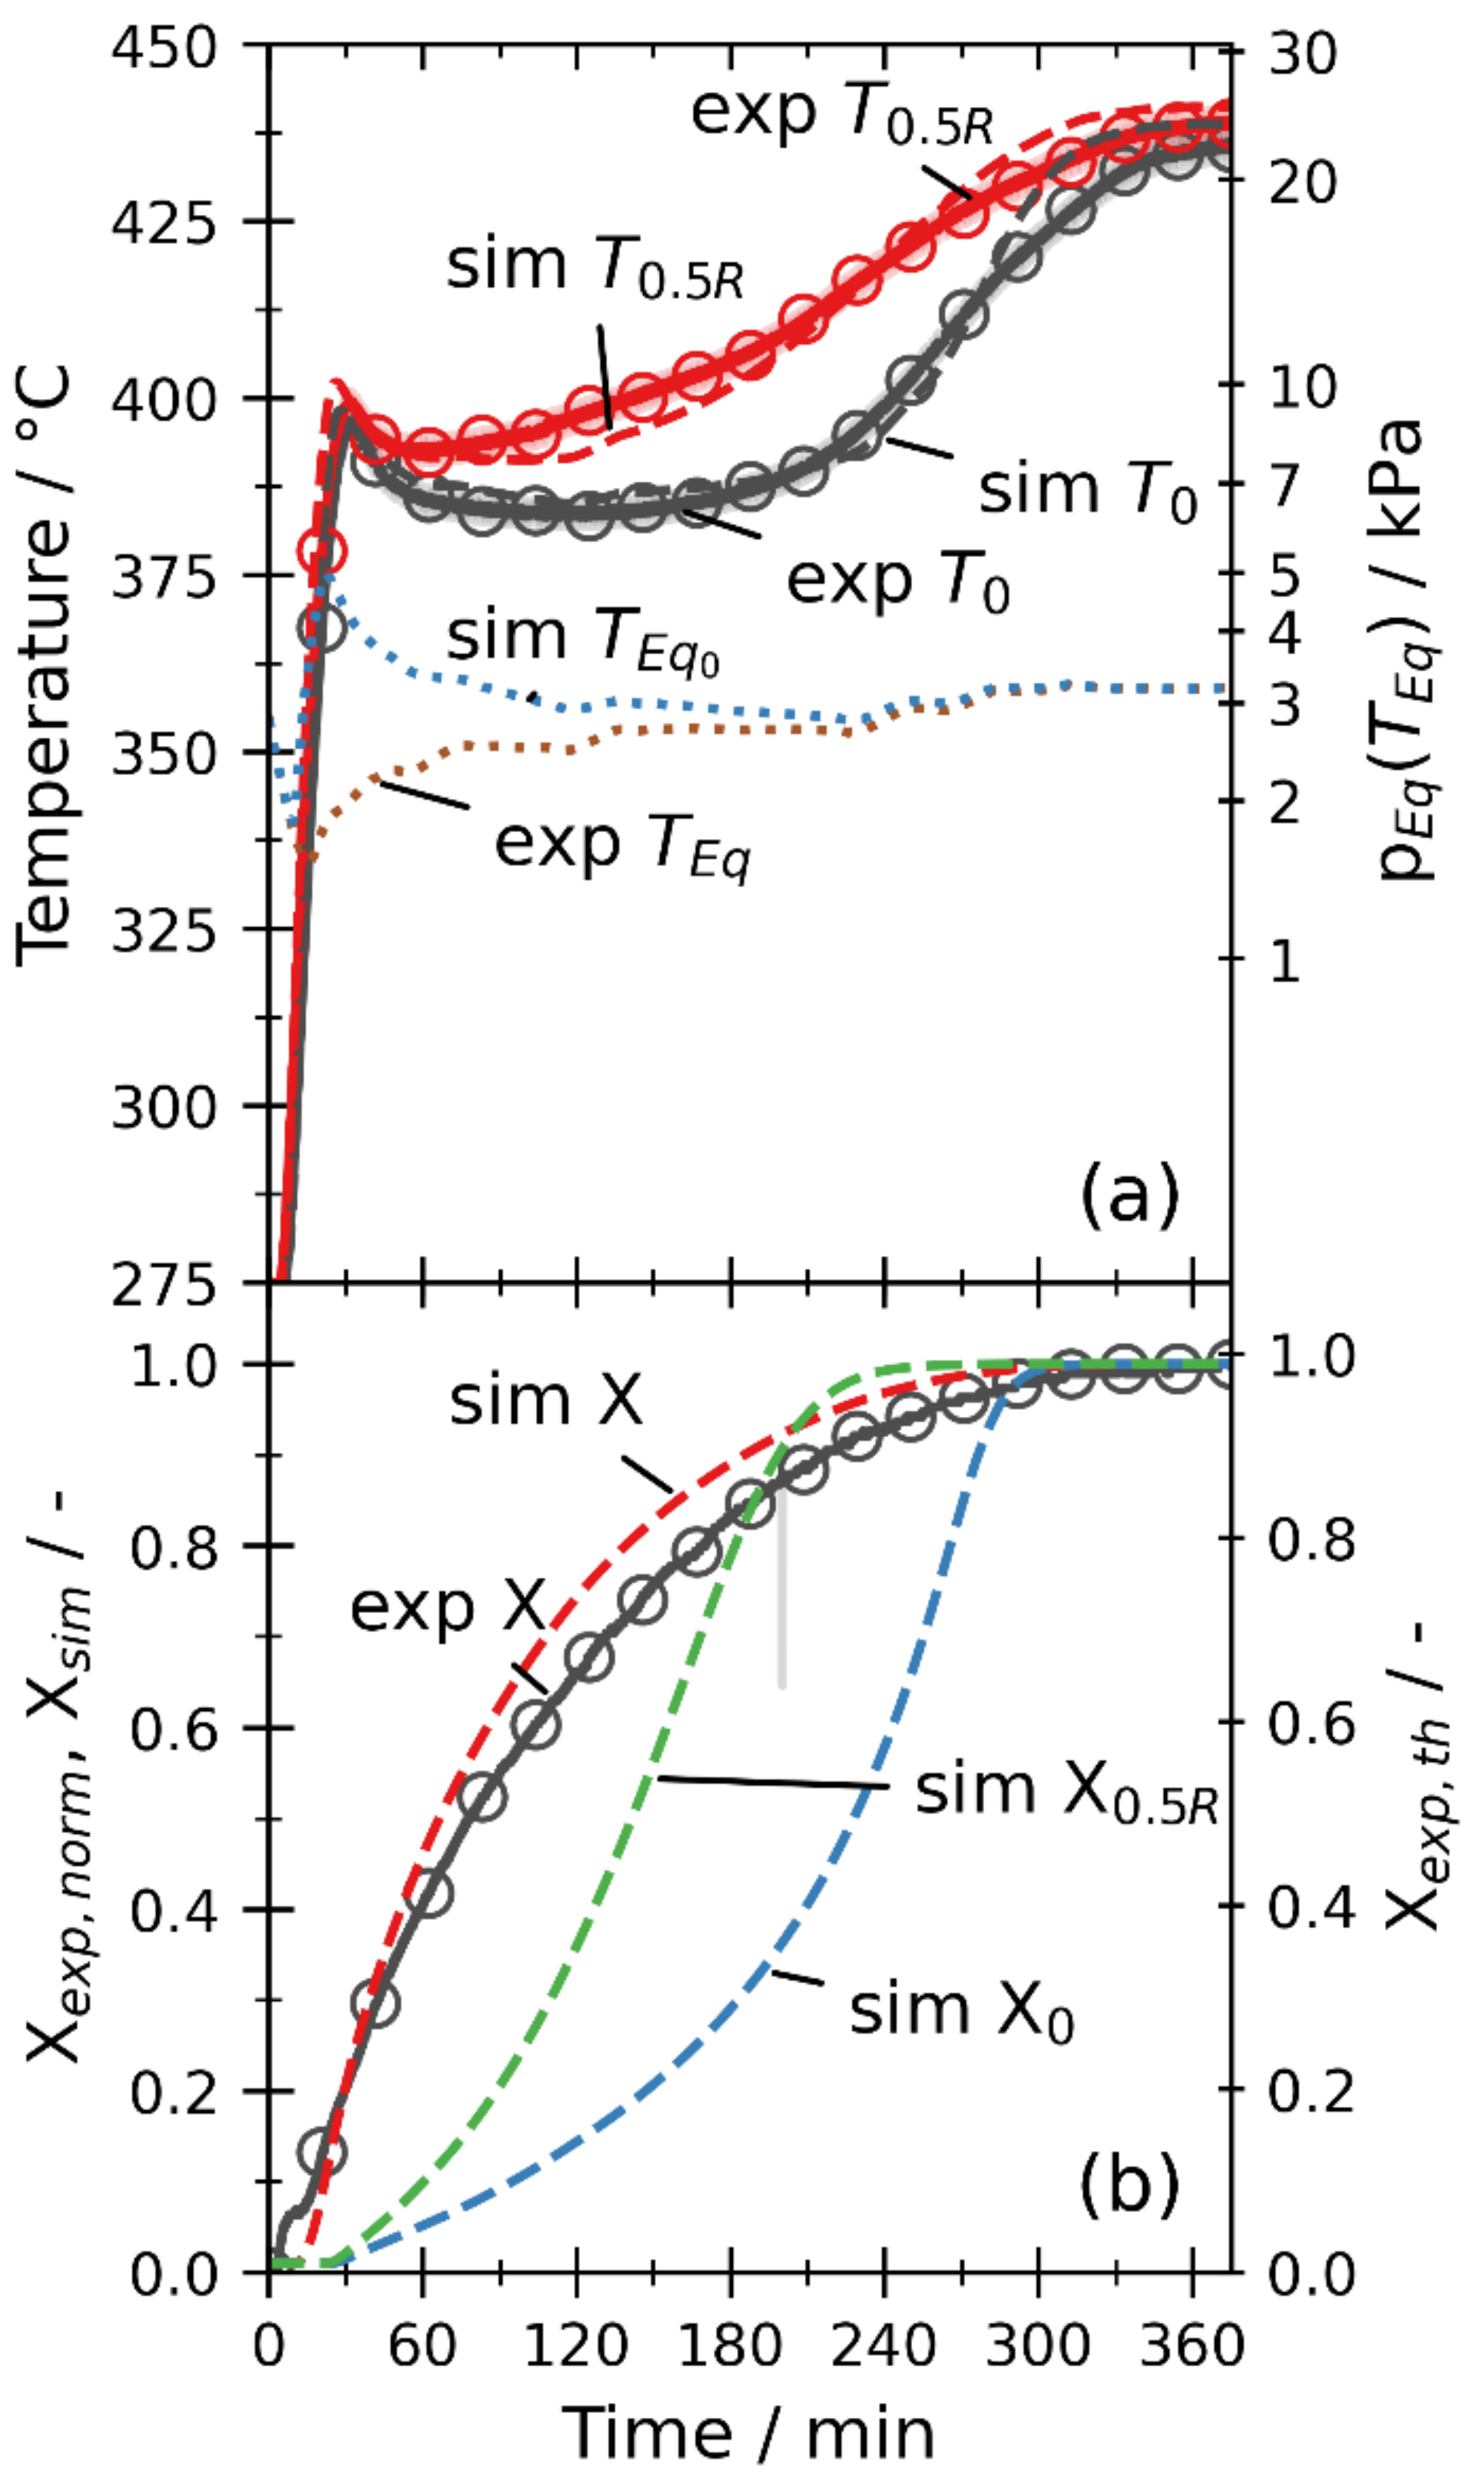
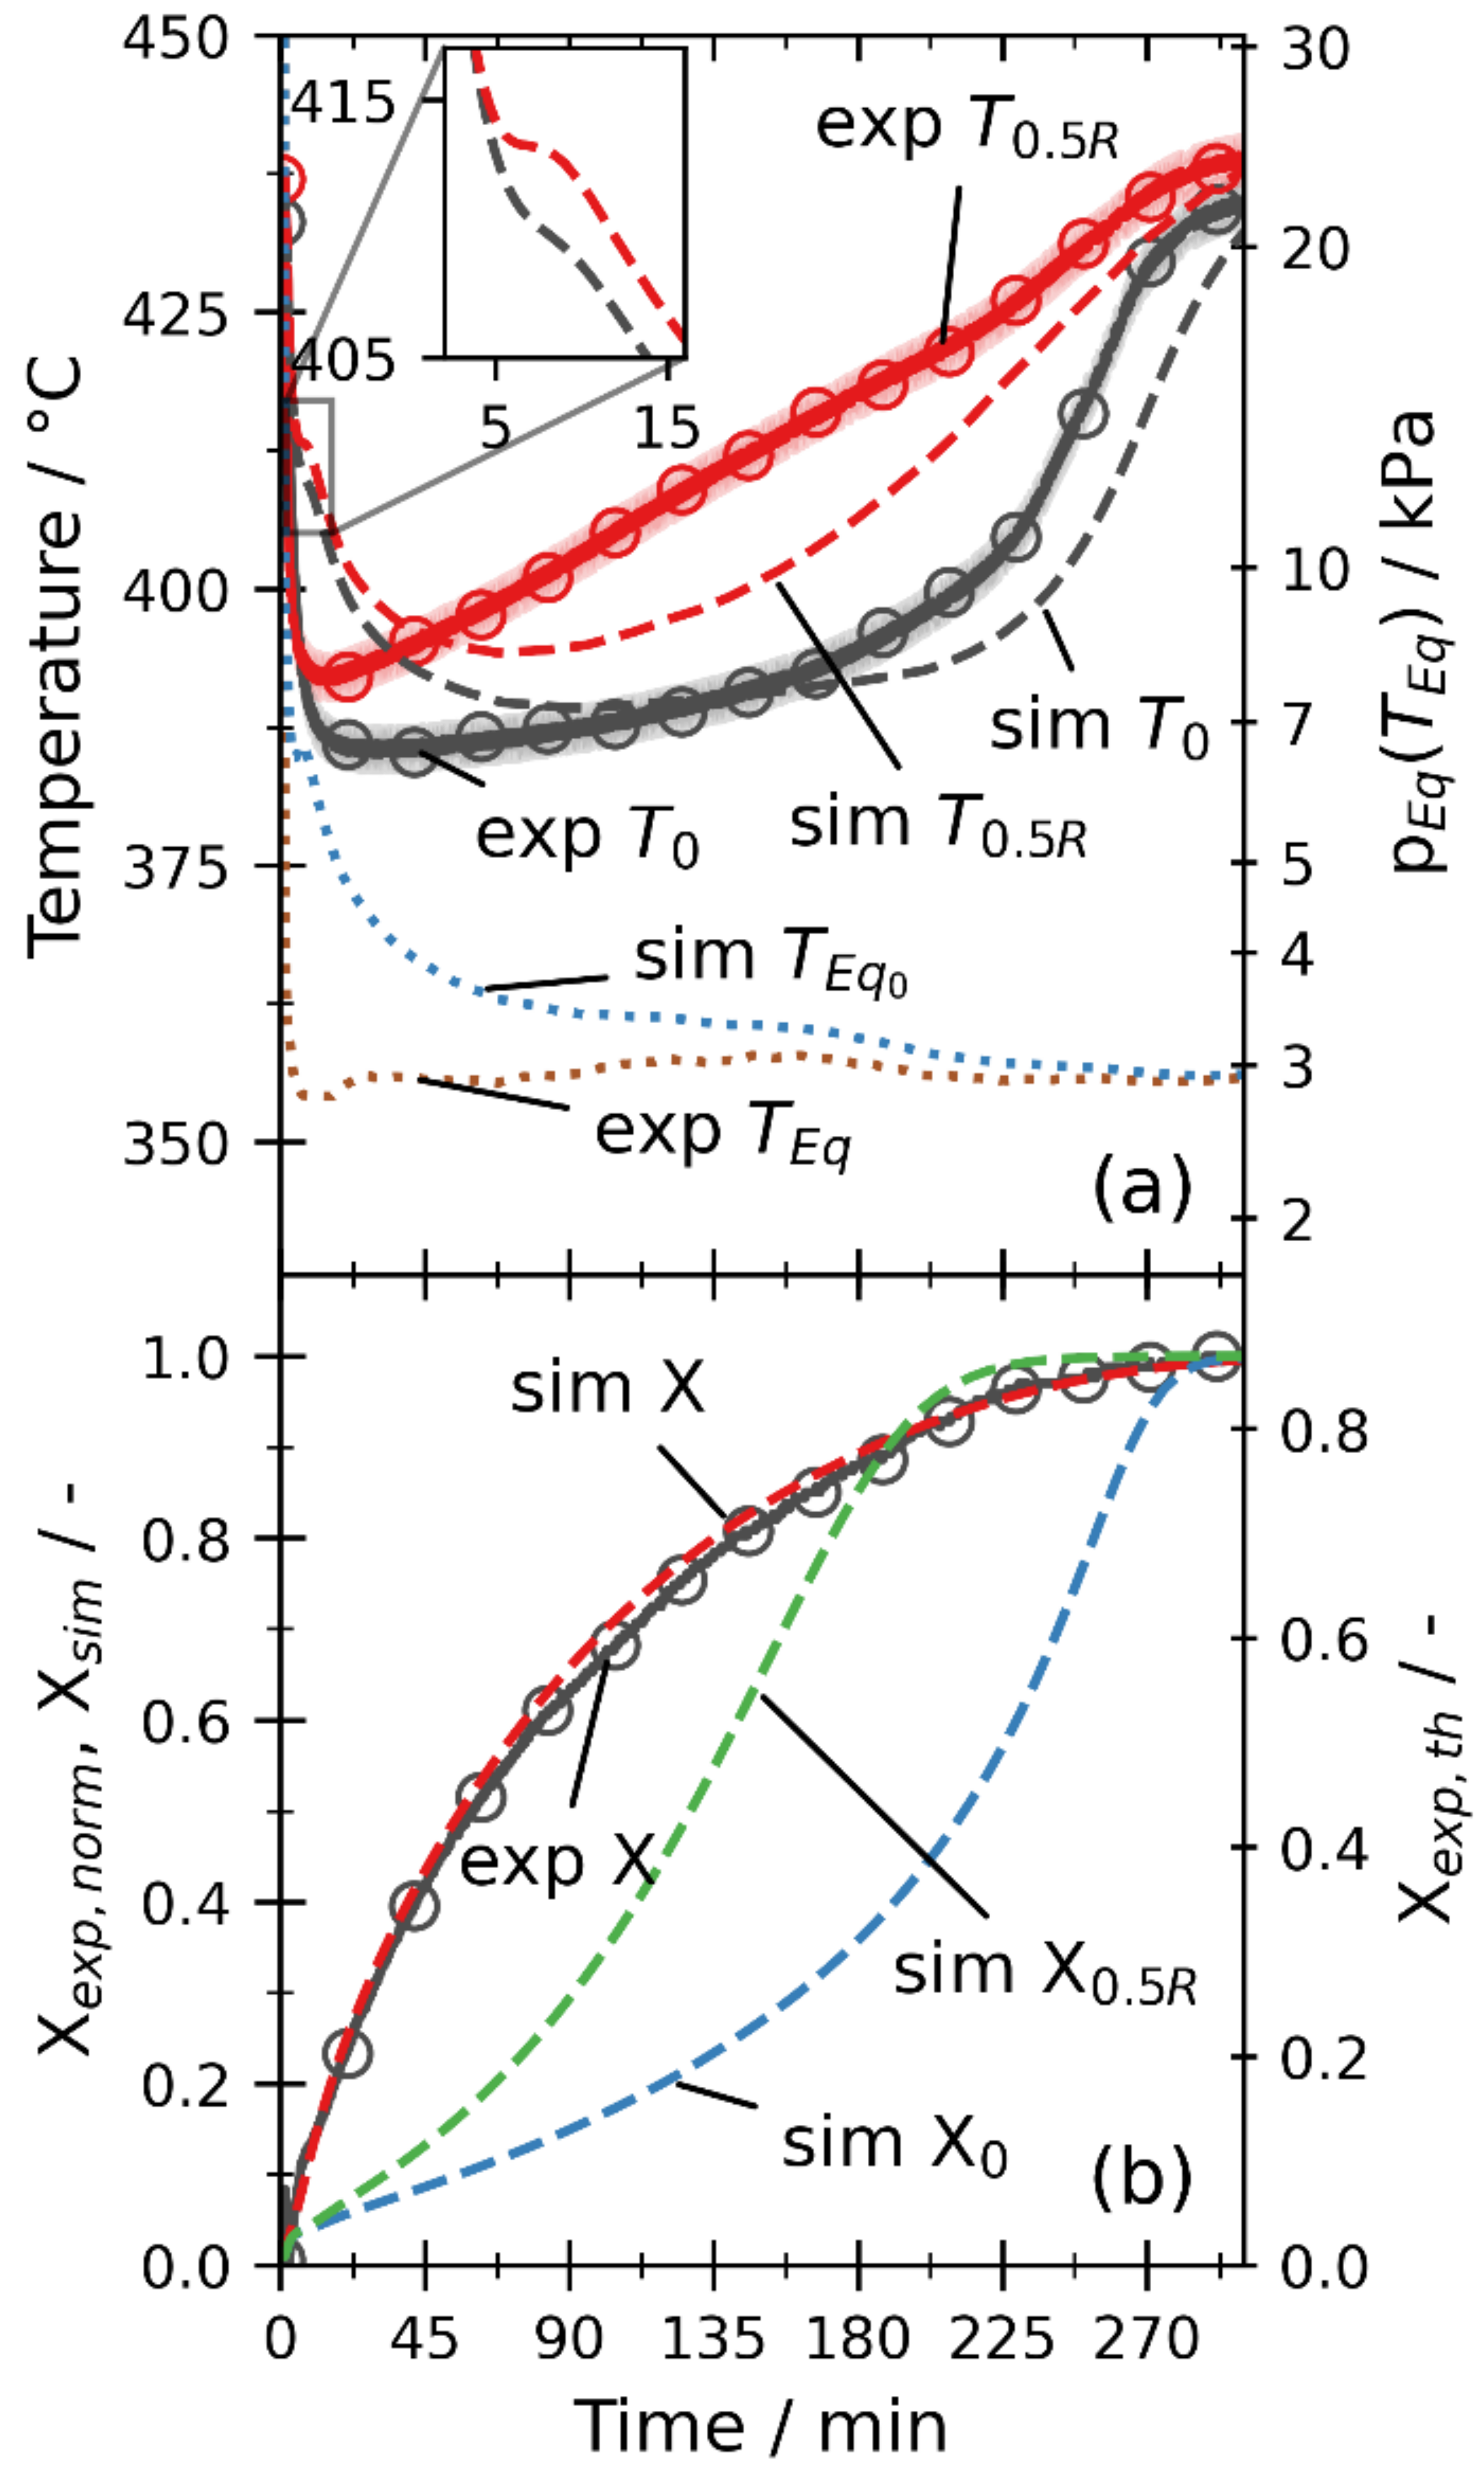
3.2. Comparison of Experiments and Simulations

For the lab-scale experiments, the measurements are shown accompanied by the numerical results to enable a direct comparison and characterize the model’s limitations. Only representative experiments for the T+ and p− modes are shown here, while the remaining experiments from Table 2 are given in the Supplementary Materials (Figures S1–S4).

3.2.1. Thermal Conductivity of the Bulk

In the literature, the effective thermal conductivity of Ca(OH)2 and CaO differs between 0.1 and 0.4 W/(m K). For this study, in a first step, the thermal conductivity of the porous bed was fitted with experiments at conditions inhibiting the chemical reaction. The fit results in a thermal conductivity of 0.6 and 0.7 W/(m K) for a CaO and Ca(OH)2 matrix, respectively, yielding effective thermal conductivities of the bed of about 0.25 W/(m K) for the analyzed experiments. Figure 3 shows the measured temperature of a Ca(OH)2 bulk during heating up without reaction at a steam pressure of 90 kPa as well as the corresponding simulation. Overall, the simulated temperatures show close agreement with the measurements and have a mean absolute error (MAE) of 2.4 and 2.6 K for the temperature measured on the symmetry axis, T0, and on the half radius, T0.5R, respectively. There are small deviations at temperatures between 275 and 325 °C and above 425 °C, indicating that the temperature dependence of the thermal conductivity of the solids in the respective range might have a small impact. However, the temperature dependency is neglected in the following simulations due to the lack of reliable data. Moreover, as the final temperature plateaus of the simulation matches the plateaus of the experiment closely, the interpolated temperature boundary condition is a suitable approximation for the thermal losses of the reactor. Hence, the heat transfer as well as the effect of the temperature boundary conditions are adequately described by the numerical model.

3.2.2. Dehydration by Temperature Increase

A dehydration reaction initiated by a temperature increase (T+) from an initial temperature of 270 °C is depicted in Figure 4. Both T0 and T0.5R (black and red solid line with markers in Figure 4a) increase until a local maximum is reached after 30 min. Then, T0.5R decreases to a short plateau at 390 °C and minute 50, which is held for about 30 min and finally increases again up to a temperature of 440 °C. For T0, the plateau is at a lower temperature of 385 °C, and with a duration of about 120 min, it is more pronounced. The following temperature increase is steeper, covering 150 K in 150 min. The equilibrium temperature from the measured steam pressure ‘exp TEq’ (orange dotted line) shows a slowly increasing course with a mean temperature of 353 °C, which corresponds to a pressure of 2.8 kPa. The measured conversion (exp X, black solid line with markers in Figure 4b) shows a decelerating course, starting at about 14 min and reaching its maximum conversion, which also corresponds to a theoretical full conversion after 360 min.
For the simulation, a particle diameter of 5 µm is assumed, and the temperatures T0 and T0.5R are depicted in Figure 4a (black and red dashed line, respectively). They are in close agreement with the corresponding measurements with an MAE of 3 K for both temperatures. The local maxima occur at minute 25, which is slightly earlier than in the measurements. The equilibrium temperature calculated from the pressure at T0 (sim T Eq 0 , blue dotted line) also shows a local maximum at 375 °C at 20 min and decreases again, converging to the equilibrium temperature calculated by the measured pressure (i.e., exp T Eq read from the pressure scale in Figure 4a). The overall simulated conversion (sim X, red dotted line in Figure 4b) starts to increase at 14 min and also shows a decelerating course, reaching full conversion 300 min later. Compared to the measured normalized conversion, the simulation slightly overestimates the reaction rate and has an MAE of 0.04. The conversion at the symmetry axis and the half radius (sim X0, blue dashed line and sim X0.5R, green dashed line) start 8 min after the global conversion increases, and both show a sigmoidal increase. However, X0.5R increases faster than X0 and reaches full conversion 60 min earlier.
The local temperature maximum is caused by a mass transport limitation in the bulk that is pronounced for the first 120 min. The sheath heater heats the bulk and enables the dehydration firstly at the adjacent material. In the beginning, the whole heat transferring area of the reactor is covered by Ca(OH)2, and there is no thermal resistance due to a product layer. Therefore, the effective reaction rate is the fastest in the beginning and slows down gradually, as is shown by the global conversion. Steam is generated faster than it can exit through the bulk, and thus, the pressure in the bulk increases, slowing down the reaction rate. Consequently, a local temperature maximum is reached for T0 and T0.5R. When the annular product layer grows from the outside to the center, the effective global reaction rate decreases and thereby also the pressure in the bulk gradually decreases. Now, the endothermic dehydration uses more heat than is conducted into the bulk and T0 as well as T0.5R decrease again until a thermal equilibrium between the conducted heat and the heat consumed by the dehydration is reached. Finally, the temperatures increase again, since on the one hand, the reaction rate decreases for higher conversions, and on the other hand, the heat flux into the center is increased as the outer material is already converted and cannot act as a heat sink anymore. As the simulation yields a similar local maximum compared to the experiments, the effective reaction rate, the thermal conductivity, as well as the mass transport through the bulk are a close approximation of the measurement for the given conditions.
Figure 5 shows the pressure distribution inside the bulk at the local temperature maximum at minute 25. The measured pressure has a local minimum at that time, and therefore, the pressure at the top of the bulk amounts to 1.9 kPa. At the top, the isobaric lines are nearly horizontal and tilt to the bottom of the reactor, since the steam can only leave the system at the top. As the reaction front moves from the outside to the center of the reactor, the pressure increases with the radius for a given height.

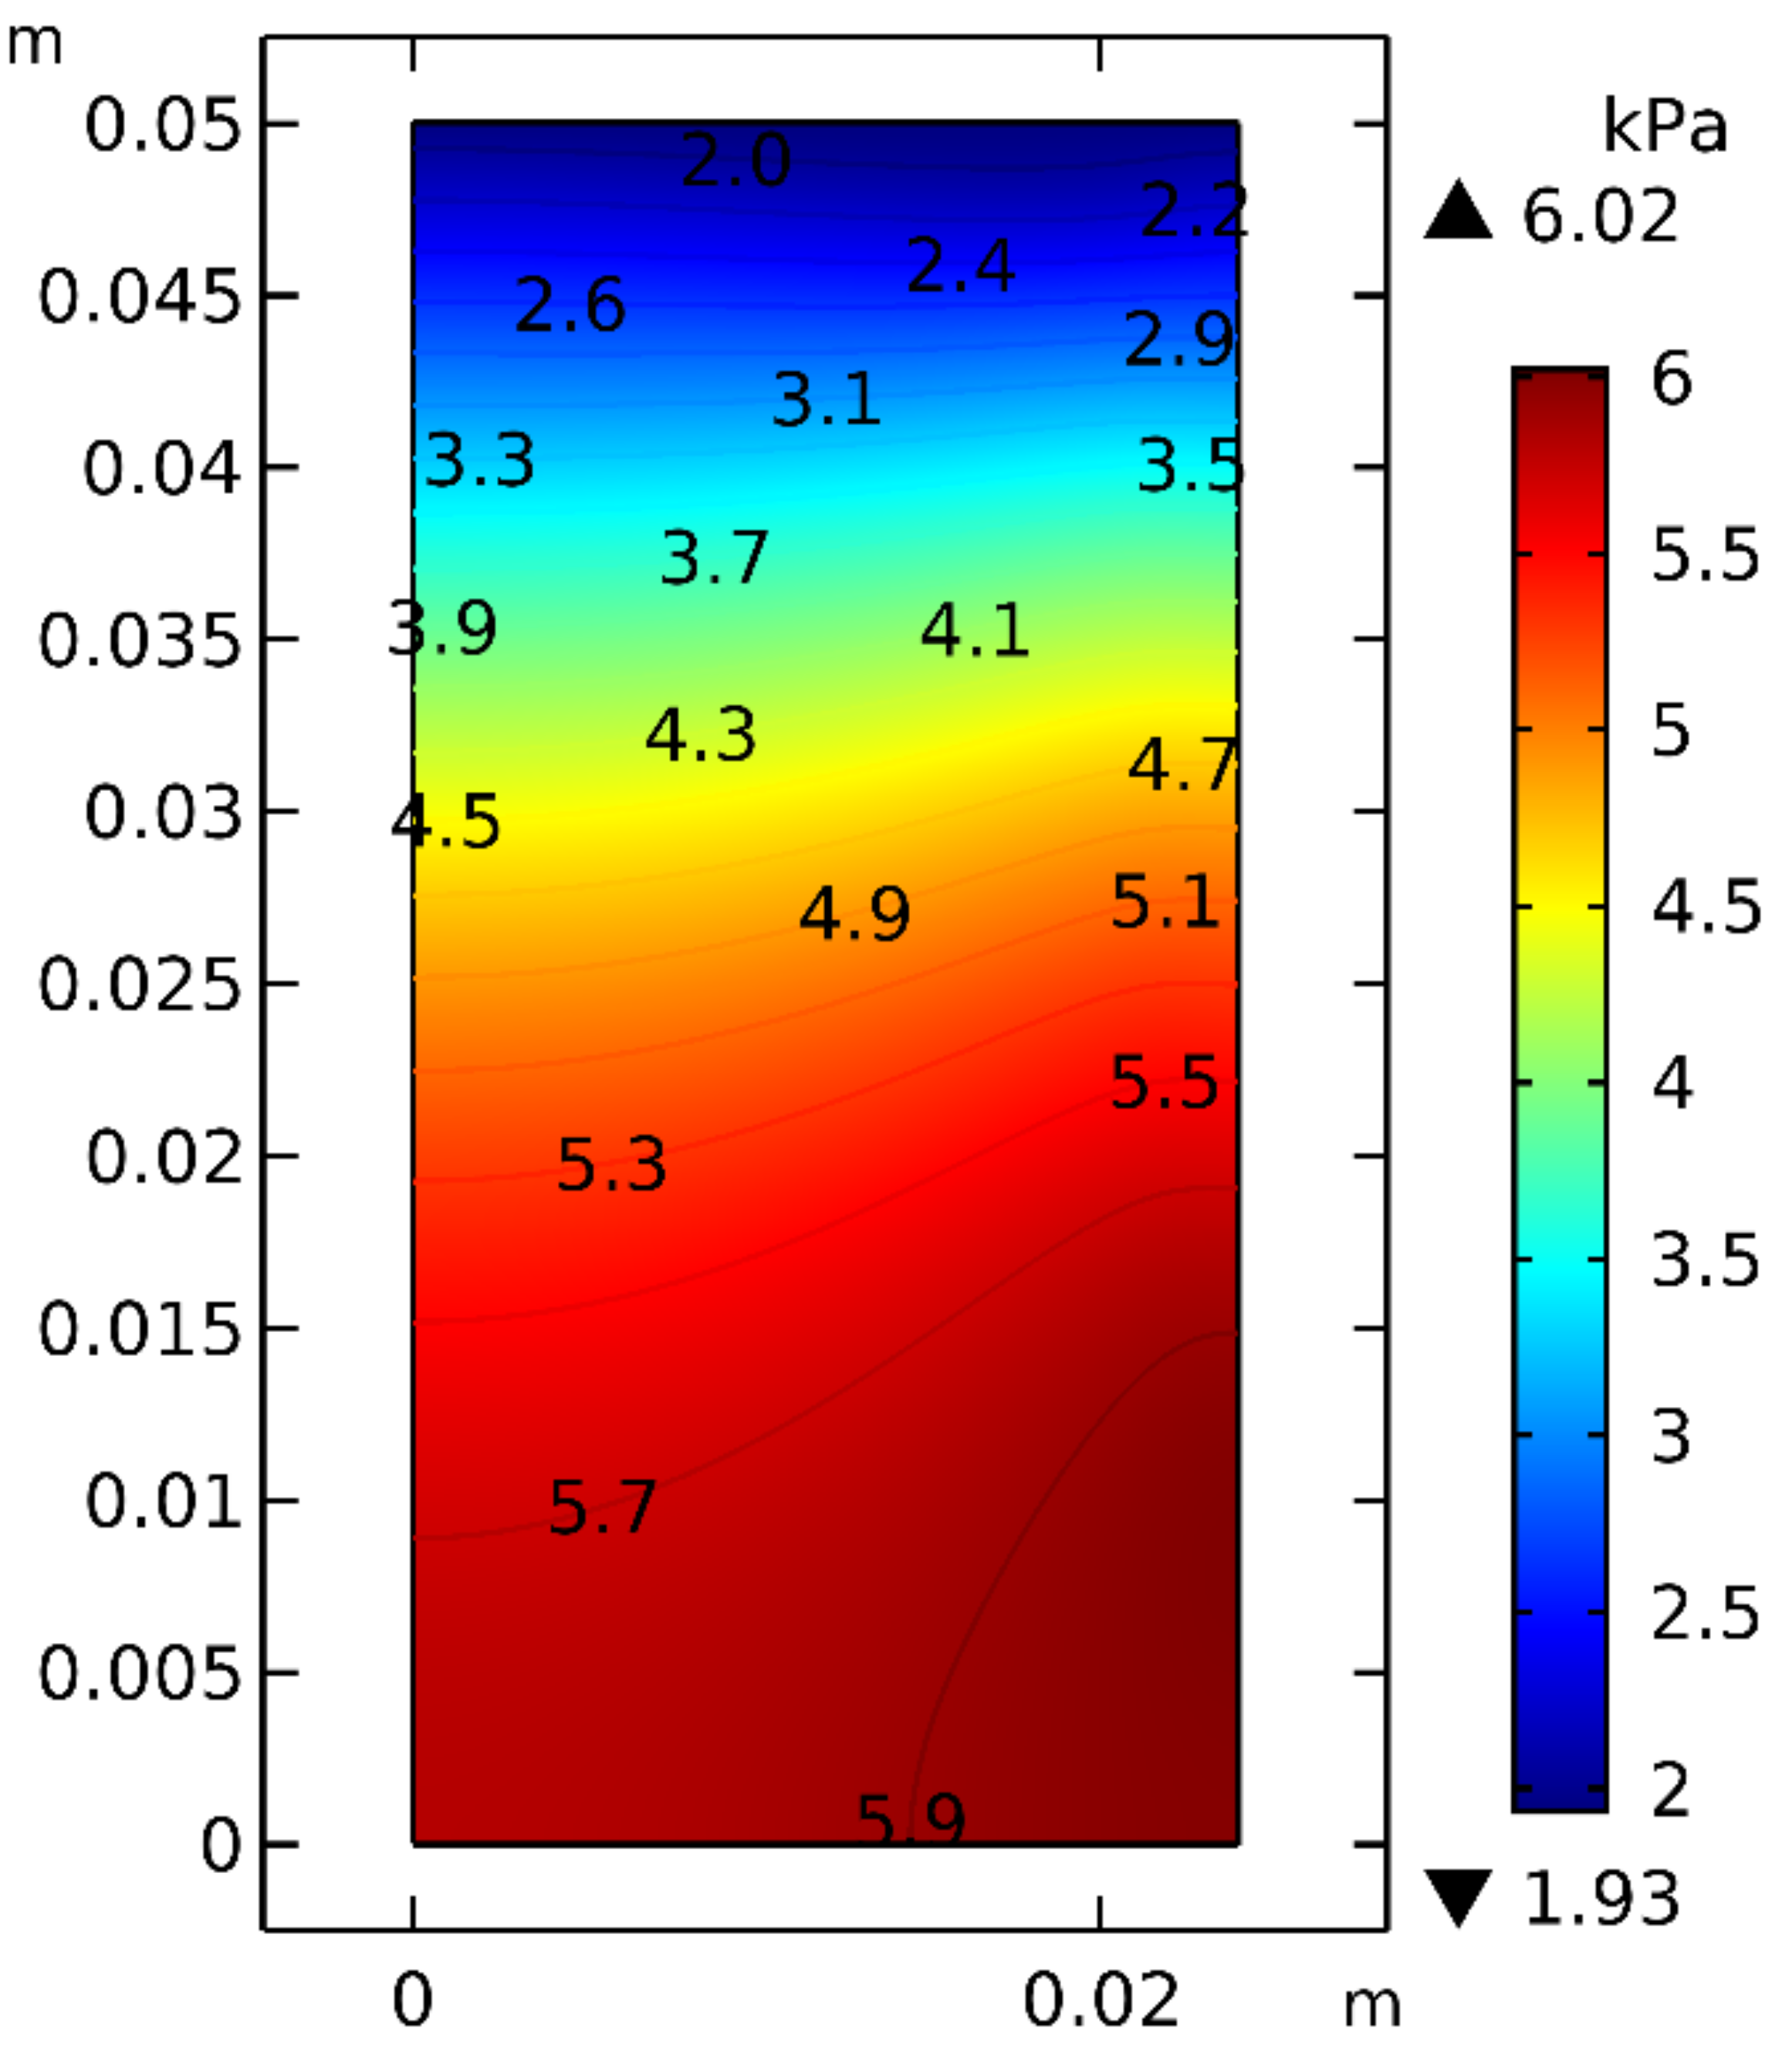
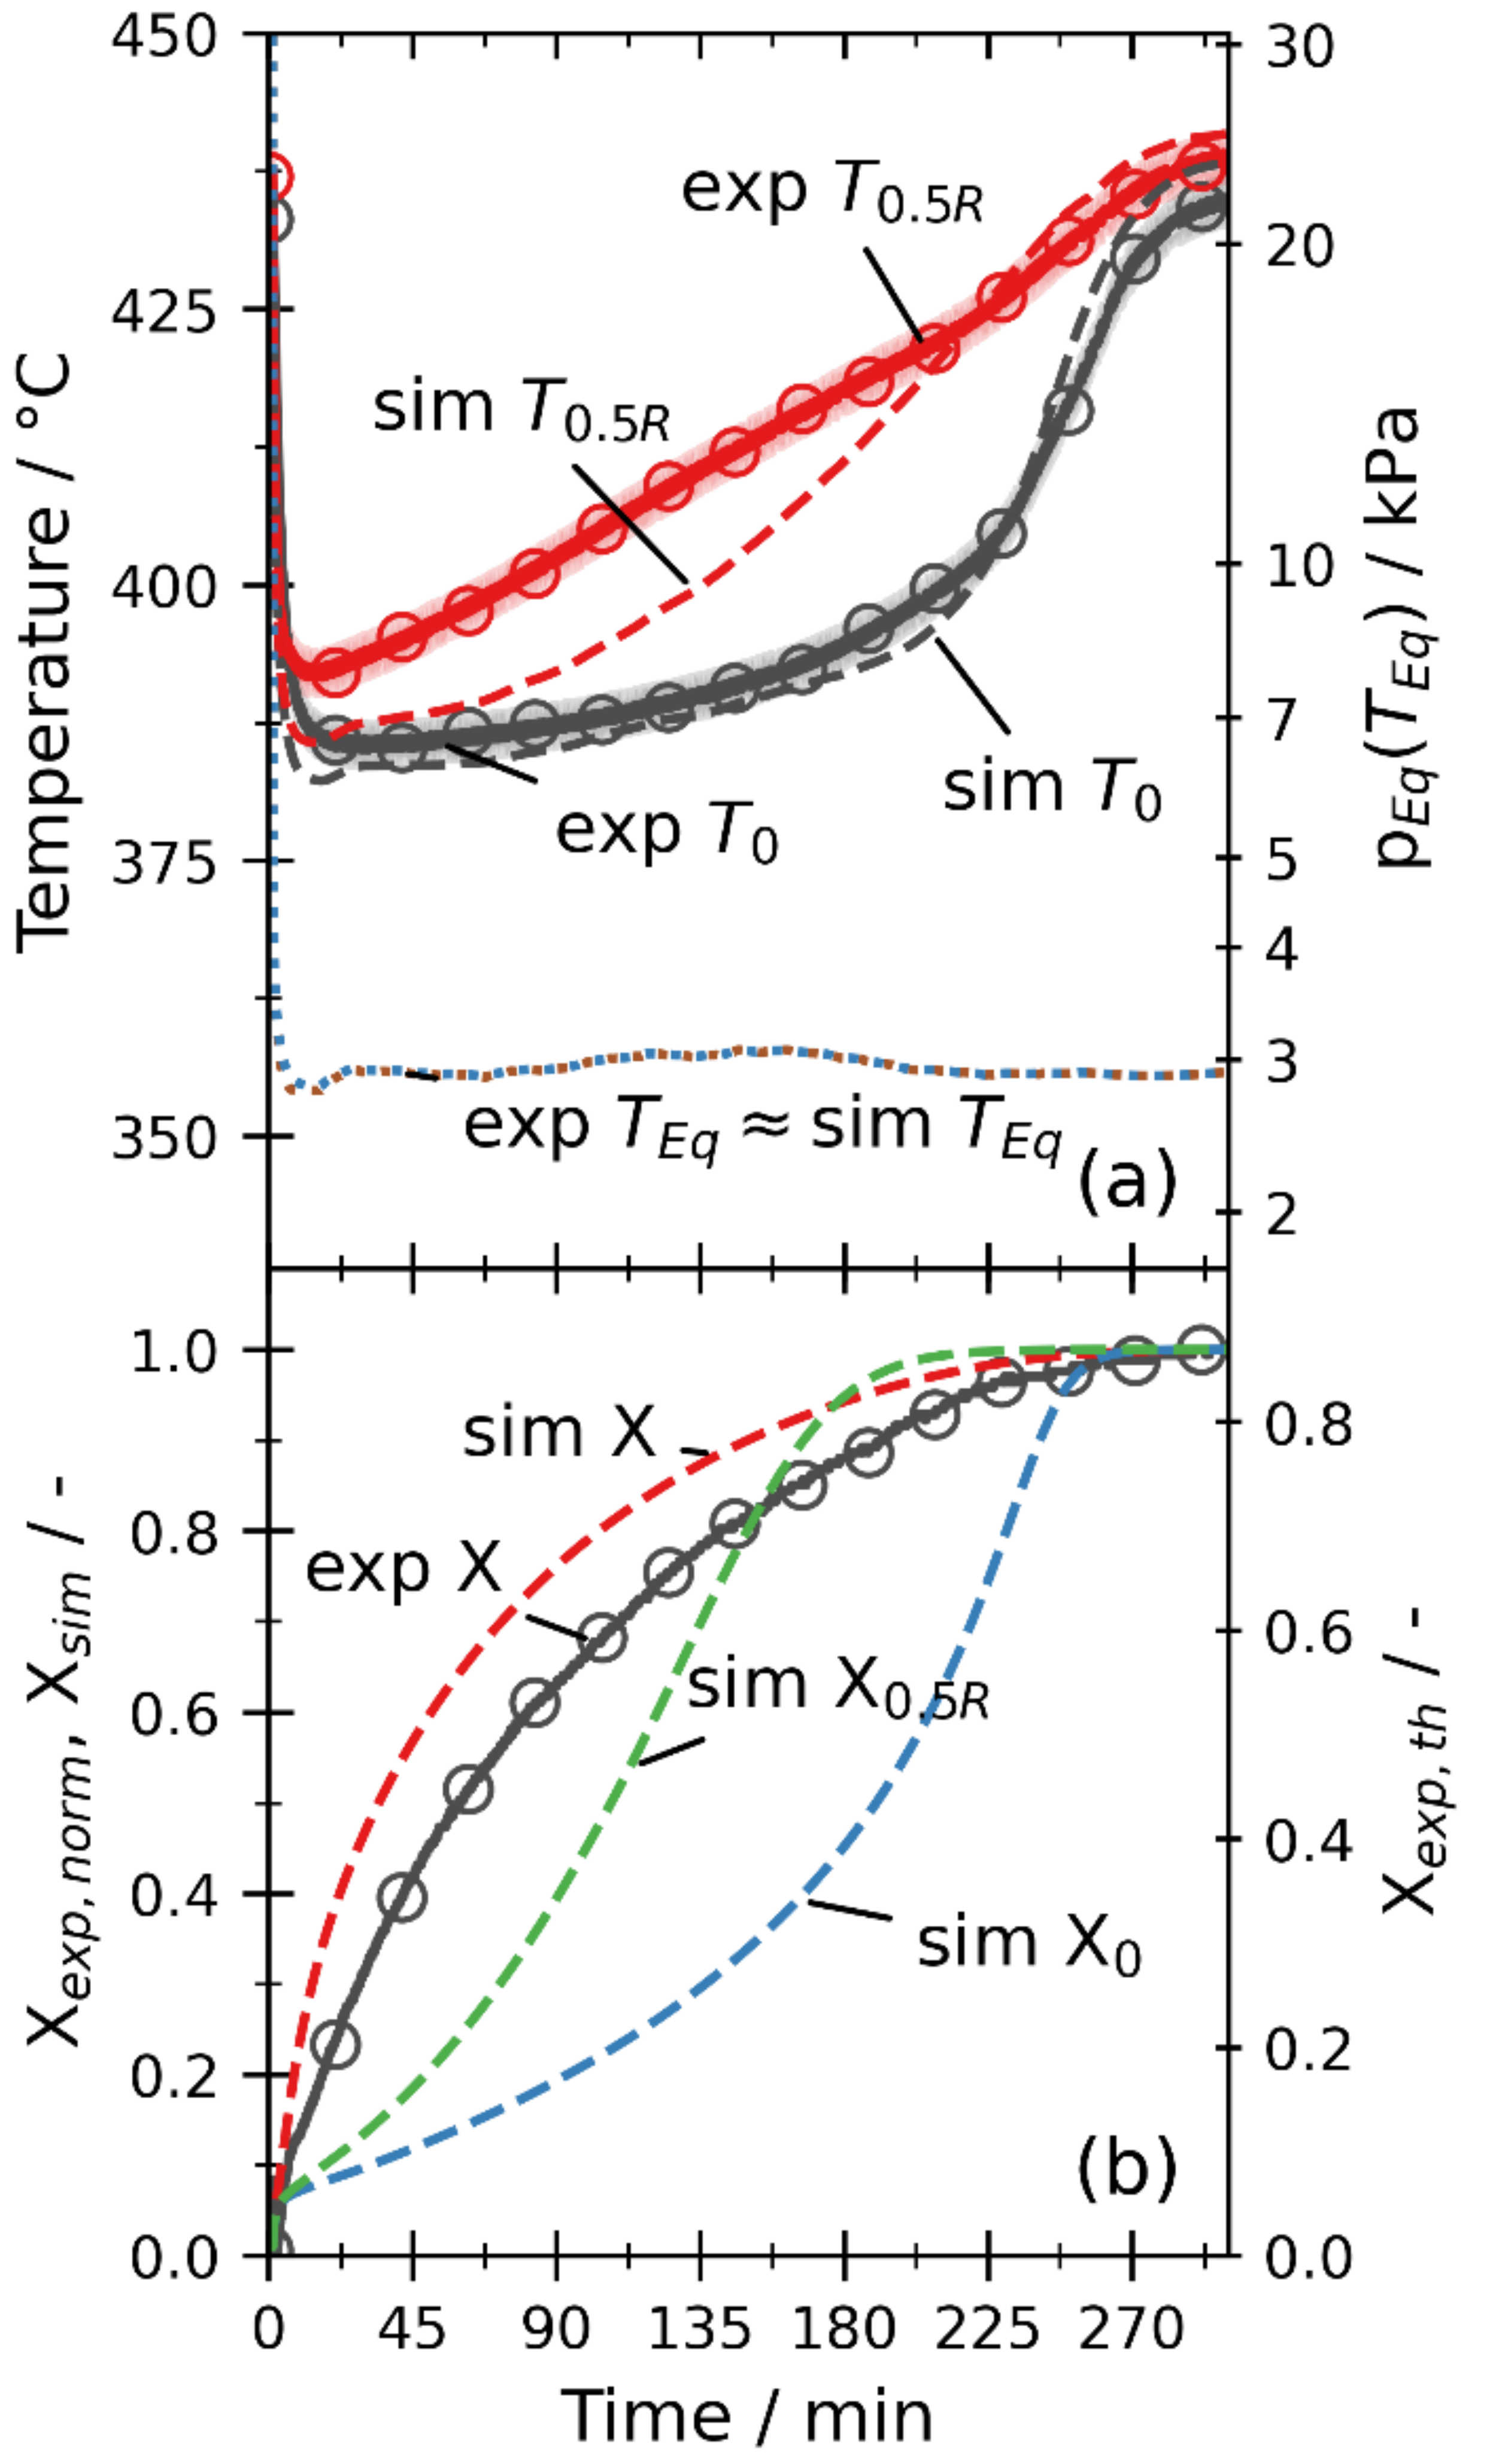
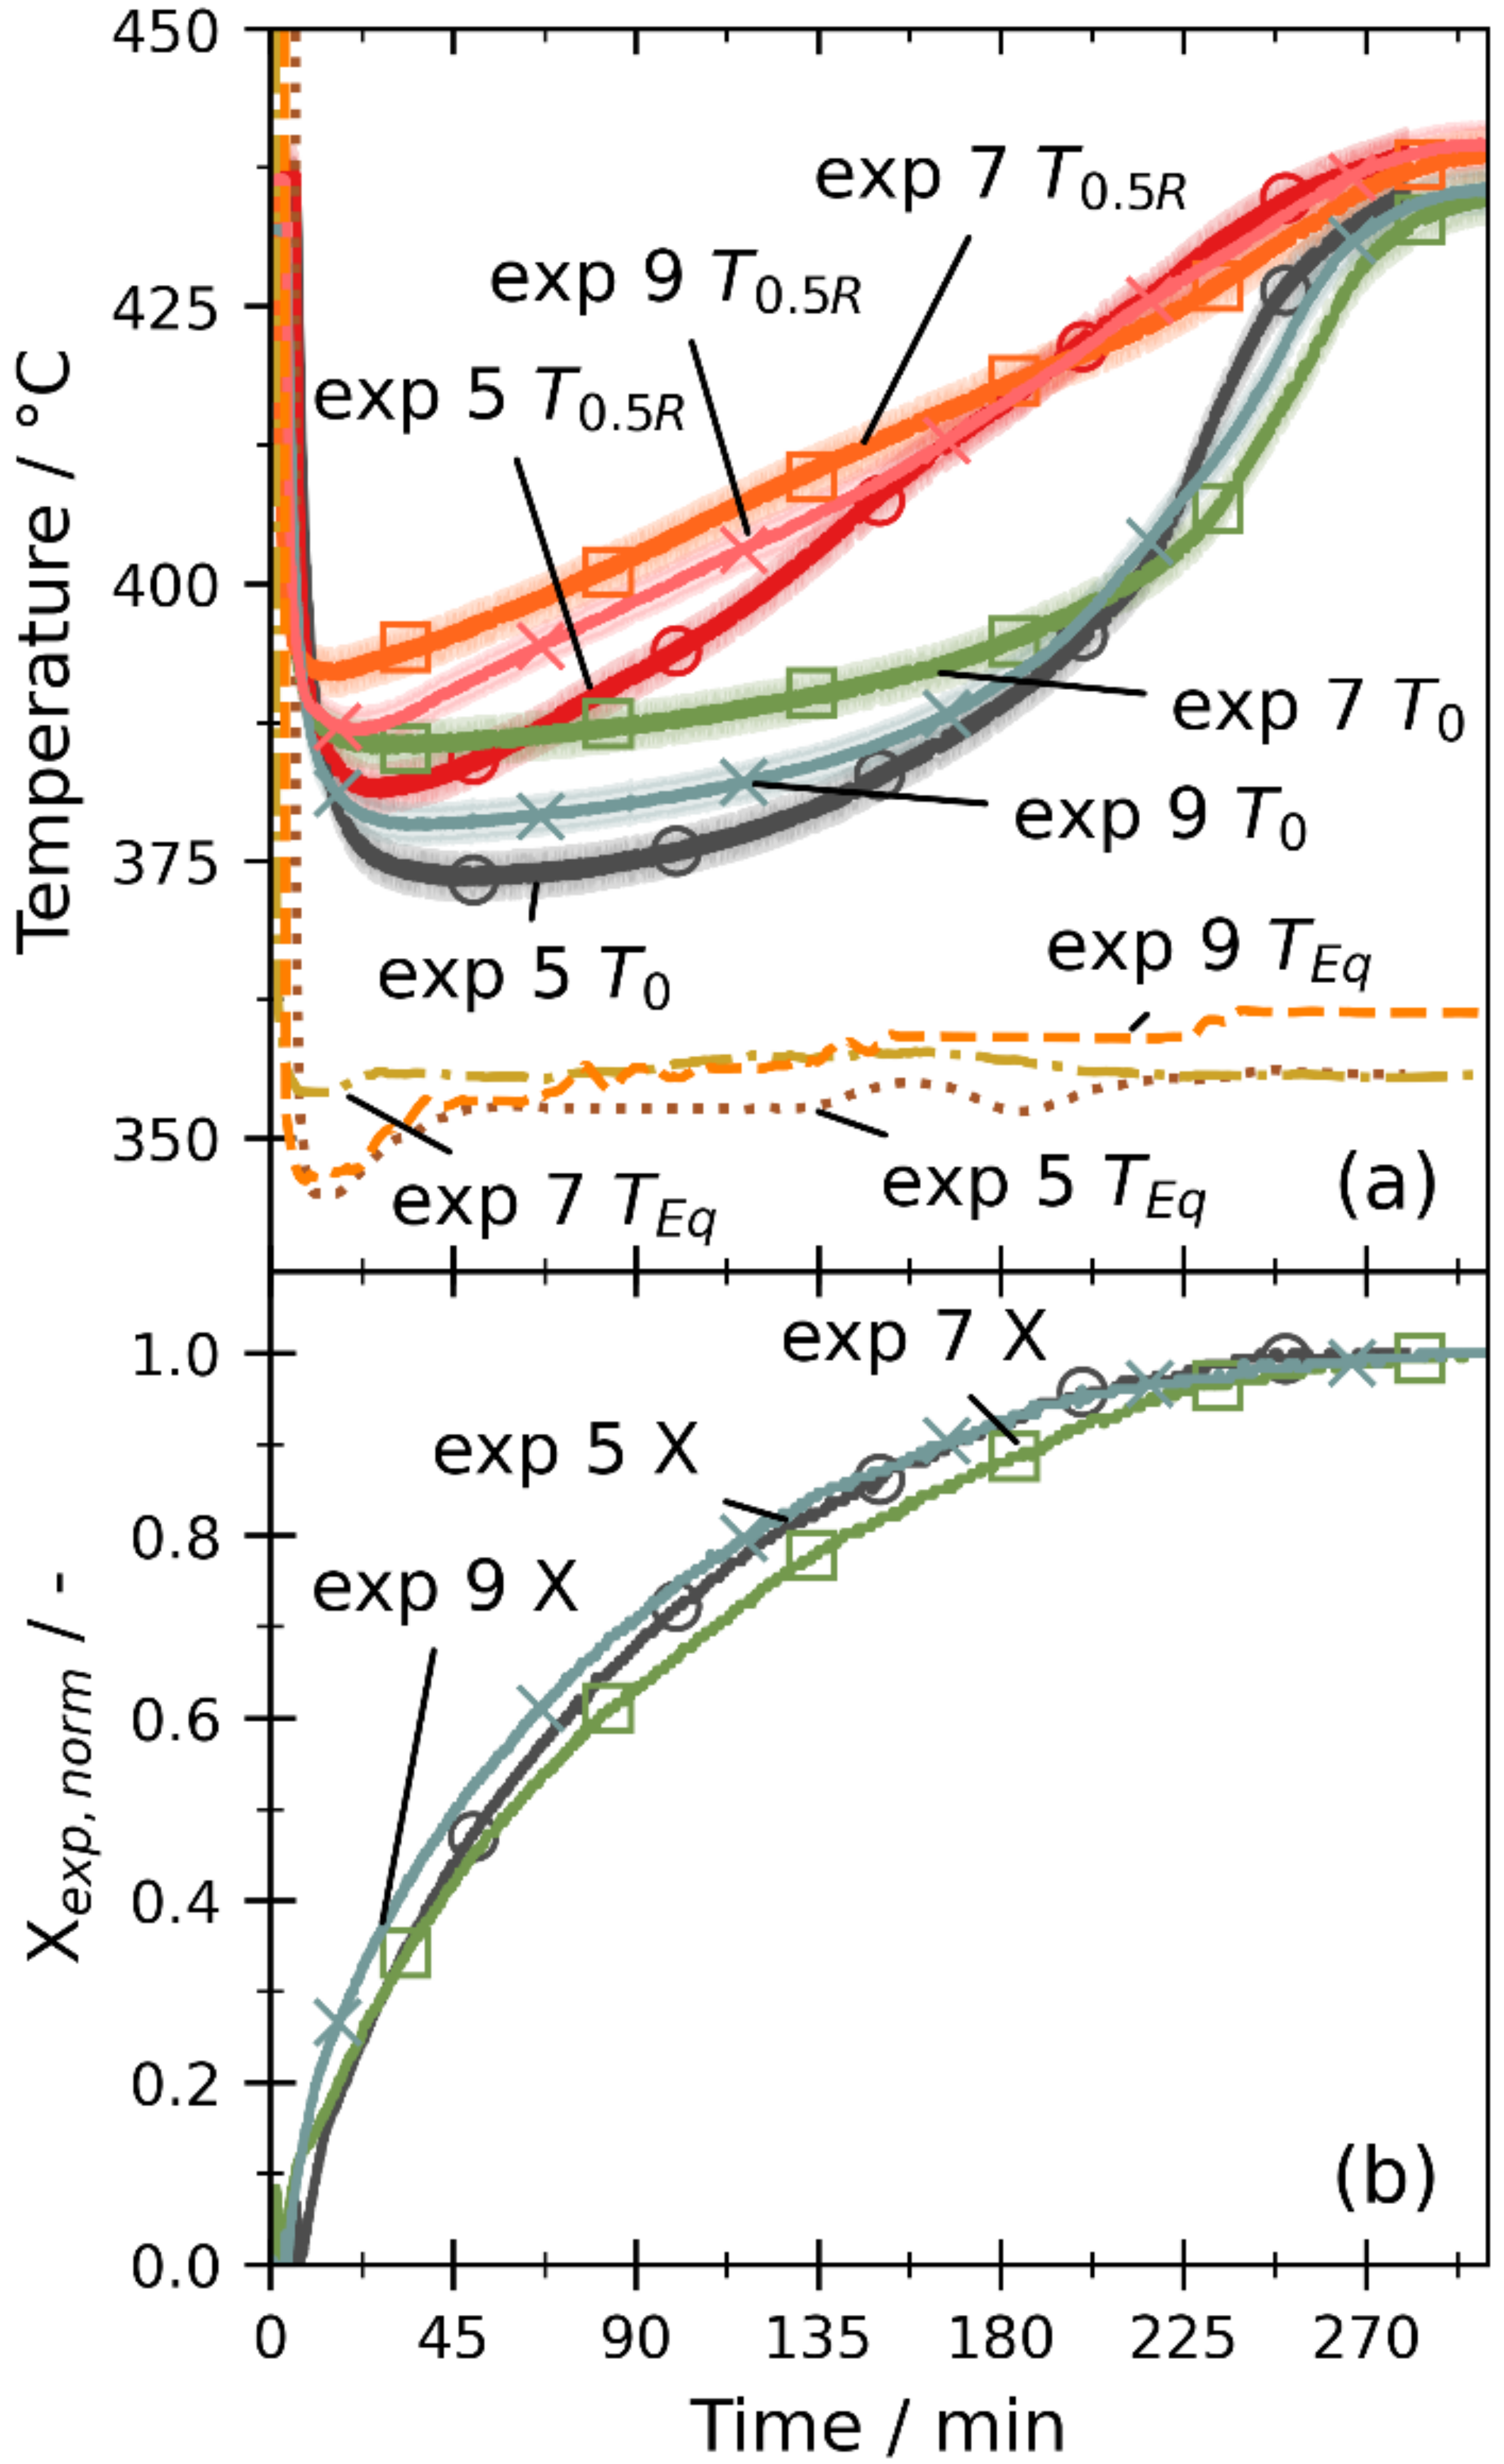
3.2.3. Dehydration by Pressure Reduction

Figure 6 shows a dehydration reaction induced by a pressure reduction (p−). At the beginning, the bulk has a temperature of about 435 °C, and the steam pressure inside the closed reactor amounts to 60 kPa, corresponding to an equilibrium temperature of 480 °C and consequently inhibiting the dehydration reaction. After one minute, the valve to the condenser is opened, and the pressure in the reaction chamber (exp TEq) decreases rapidly to about 3 kPa in minute 5. Thus, the measured temperatures T0 and T0.5R both decrease. T0.5R reaches a minimum after 10 min at 392 °C and then increases nearly linearly to 440 °C at minute 300. The minimum of T0 is reached after 20 min at 385 °C, and then, there is also a slow linear temperature increase for 150 min to 395 °C. Then, the temperature course becomes sigmoidal and reaches 434 °C at the end of the experiment. As in the previous experiments, also for the p− experiment, the conversion has a decelerating course. However, there is an initial peak, converting 12% within the first ten minutes. The maximum conversion is reached after about 300 min corresponding to a conversion of 87%.
Qualitatively, the simulated temperatures (dashed lines in Figure 6a) show a similar behavior compared to the measurements. However, there is another local minimum after 5 and 7 min for T0 and T0.5R, respectively, which does not occur in the experiment. Thereafter, both temperatures decrease again, reach a global minimum, and increase again. Although the temperature levels of the global minimum (390 °C for T0 and 394 °C for T0.5R) are close to the measurements, the minimum is shifted toward higher times (i.e., 100 and 70 min for T0 and T0.5R, respectively).
In the simulation with a particle diameter of 5 µm, a mass transport limitation occurs, resulting in the spread of the local equilibrium temperature calculated from the pressure at position 0 (sim TEq0) and the equilibrium temperature given by the measured pressure (exp TEq). Both temperatures are converging, but it takes about 180 min to reach a similar value. However, the experiment indicates no mass transport limitation, as the global temperature minima are reached directly after the pressure reduction. After the pressure drop caused by opening the valve, the whole bulk is 80 K above the equilibrium temperature, allowing a fast conversion and steam release. Since this effect happens in addition to the heat input from the sheath heaters, the mass transport limitation should be more distinct for the p− dehydration compared to the T+ dehydration (Figure 4). However, this is not the case. A possible explanation for this unexpected behavior is a structural change of the bulk. The pressure shock could lead to channels in the reaction bed. The tendency to form channels was already observed for permeated fixed beds of Ca(OH)2 [38]. Since the bed temperature is around 80 K over the equilibrium temperature, the whole bed partially dehydrates driven by the sensible energy. The volume reduction of the particles occurring during dehydration in combination with the steam release might additionally favor channeling. Thus, the gas transport through the channels leads to a significantly reduced pressure drop. However, structural changes have not yet been considered in the simulation, and thus, the experiment and simulation differ here.
To account for these possible changes of the bulk in the p− mode nonetheless, the permeability is arbitrarily increased by a factor of 100. According to the Carman–Kozeny relationship and since the particle diameter solely impacts the permeability in the simulation model, the increase in the permeability is equivalent to a larger particle diameter of 50 µm. Figure 7 shows the simulation results with the higher permeability. At point 0, the pressure is approximately the same as the pressure used as the boundary condition; consequently, the mass transport limitation is effectively eliminated. Therefore, T0 and T0.5R both directly reach a global minimum at 16 min and 382 °C and at 13 min and 386 °C, respectively. While T0.5R is underestimated for the enhanced permeability and reaches the measured plateau temperature of T0, the MAEs for both temperatures reduce: for T0.5R to 6.23 K and for T0 considerably to 2.75 K. The global conversion has again a similar course to the measurement but overestimates the conversion. Thus, the MAE for the conversion increases to 0.08. The courses of X0 and X0.5R are similar to the simulation with a particle size of 5 µm. However, the initial rapid local conversion increase is doubled, reaching 6% after 5 min. Since the increased permeability can account for the changes of the bulk, it is used in all other simulations of p− experiments.

3.2.4. Variation of Thermal Input

Figure 8 shows the dehydration induced by a pressure reduction from 66 to 3.5 kPa with a heater temperature of 490 °C and thus a higher thermal input. Both measured temperatures have a similar course as the experiments with a heater temperature of 450 °C and reach a similar global minimum temperature of 382 °C and 391 °C for T0 and T0.5R, respectively. However, for T0.5R, the temperature increase is steeper, reaching its end temperature of 480 °C approximately 170 min after the minimum. For T0, the part with a linear increase is 90 min shorter, and at minute 180, the final temperature of 476 °C is reached. The maximum conversion of theoretically 83% is reached already after 150 min.
The simulation also accounts for the higher thermal input, and after the measured minimum temperatures are matched within a 3 K range, both temperatures reach their final values already after 170 min. While T0.5R shows a lower temperature level compared to the measurement, T0 matches the measurement until 95 min within a 3 K margin. However, the linear temperature increase at position 0 is longer in the simulation (until minute 125 compared to minute 95 for measured T0). The course of the simulated conversion is similar to the measured conversion but overestimates the measurements. Due to the higher initial bed temperature, the conversion after the pressure drop reaches already 10% at position 0 and 0.5R.
As the measurement of T0 corresponds to the simulation until 95 min but increases 30 min earlier, the bulk might be not fully hydrated before this experiment. This corresponds to the maximum theoretical conversion of 83% for this experiment. Another reason might be that the local density is decreased due to the structural changes.

3.2.5. Overall Discussion

For all analyzed variations, the numerical results resemble the measurements. Especially, the plateau temperature (i.e., the part of slow linear temperature increase) of T0 is close to the measured plateaus. During the plateau, there is a thermal equilibrium between heat supplied by the heaters and heat consumed by the endothermic reaction. Thus, the correspondence of measurement and simulation at this point indicates that the used mathematical fit is an appropriate description of the effective reaction rate in the bulk. In Table 4, an overview of the differences of the simulations and measurements is given. The remaining graphs are given in the Supplementary Materials (Figures S1–S4). In general, the simulation can approximate the measurements within a temperature–MAE range of ±7 K for T0 and ±10 K for T0.5R as well as the MAE of the conversion within ±0.08. For the conversion, a part of the deviation might be explained by the neglected part of the bulk outside the simulated area. A large part of the remaining deviations might stem from structural changes in the bulk due to swelling or agglomeration. The changes of a cycled Ca(OH)2/CaO bulk are depicted in the Supplementary Materials (Figure S5), as has been shown by several other studies (e.g., [22,39,40]). These changes also explain why experiments with similar boundary conditions vary considerably. Figure 9 shows the comparison of the measurements of the experiments E5, E7, and E9 with a heater temperature of 450 °C and a steam pressure of around 3 kPa. Although the general temperature and conversion courses are resemblant, the MAEs of E5 and E7 are 9 K, 7 K, and 0.03 for T0, T0.5R, and the conversion, respectively. Hence, the used model yields MAEs in a similar magnitude and can be considered validated within the measurement uncertainty. Thus, the model can assist the design of further reactors.
Changes of the bulk might also explain the differences between the p− and T+ experiments. With the rapid pressure drop supported by the particle shrinkage and steam release, on the one hand, channels may form, increasing the permeability locally, and on the other hand, parts of the bulk can be moved toward the filter or even the whole bulk can expand, which is indicated by a comparison of the bulk before and after cycling (Figure S5). In the latter case, parts of the bulk are in a section of the reactor that is not simulated and only indirectly heated, thus explaining the lower theoretical conversion of the p− experiments. A lower local material density might also explain the underestimation of T0.5R for the p− experiments, as with a lower density, the reaction takes up less heat and thereby results in higher temperatures. Another possible reason for the underestimation is that the structural changes of the bulk might affect the positions of the thermocouples and thereby alter the measurements of T0 and T0.5R. The missing of a mass transport limitation for the p− experiments can only be explained by structural changes. Additionally, the local temperature maximum (Figure 4 at minute 25) does not occur for the T+ experiments with the 100 times enhanced permeability (Figure S6), indicating that the channeling effect has been at least partially removed. Since the T+ experiments have been performed between p− experiments, the enhanced permeability of the p− experiment cannot be attributed to a mere agglomeration of the bulk after several cycles. Thus, the operation mode of the reactor impacts the structural changes. Consequently, further research is required to model the structural changes and show to which extent they can be controlled by different operation modes. One way to account for these structural changes is the simulation on a particle scale, as already demonstrated by [41]. However, this becomes quickly computationally expensive for larger systems.

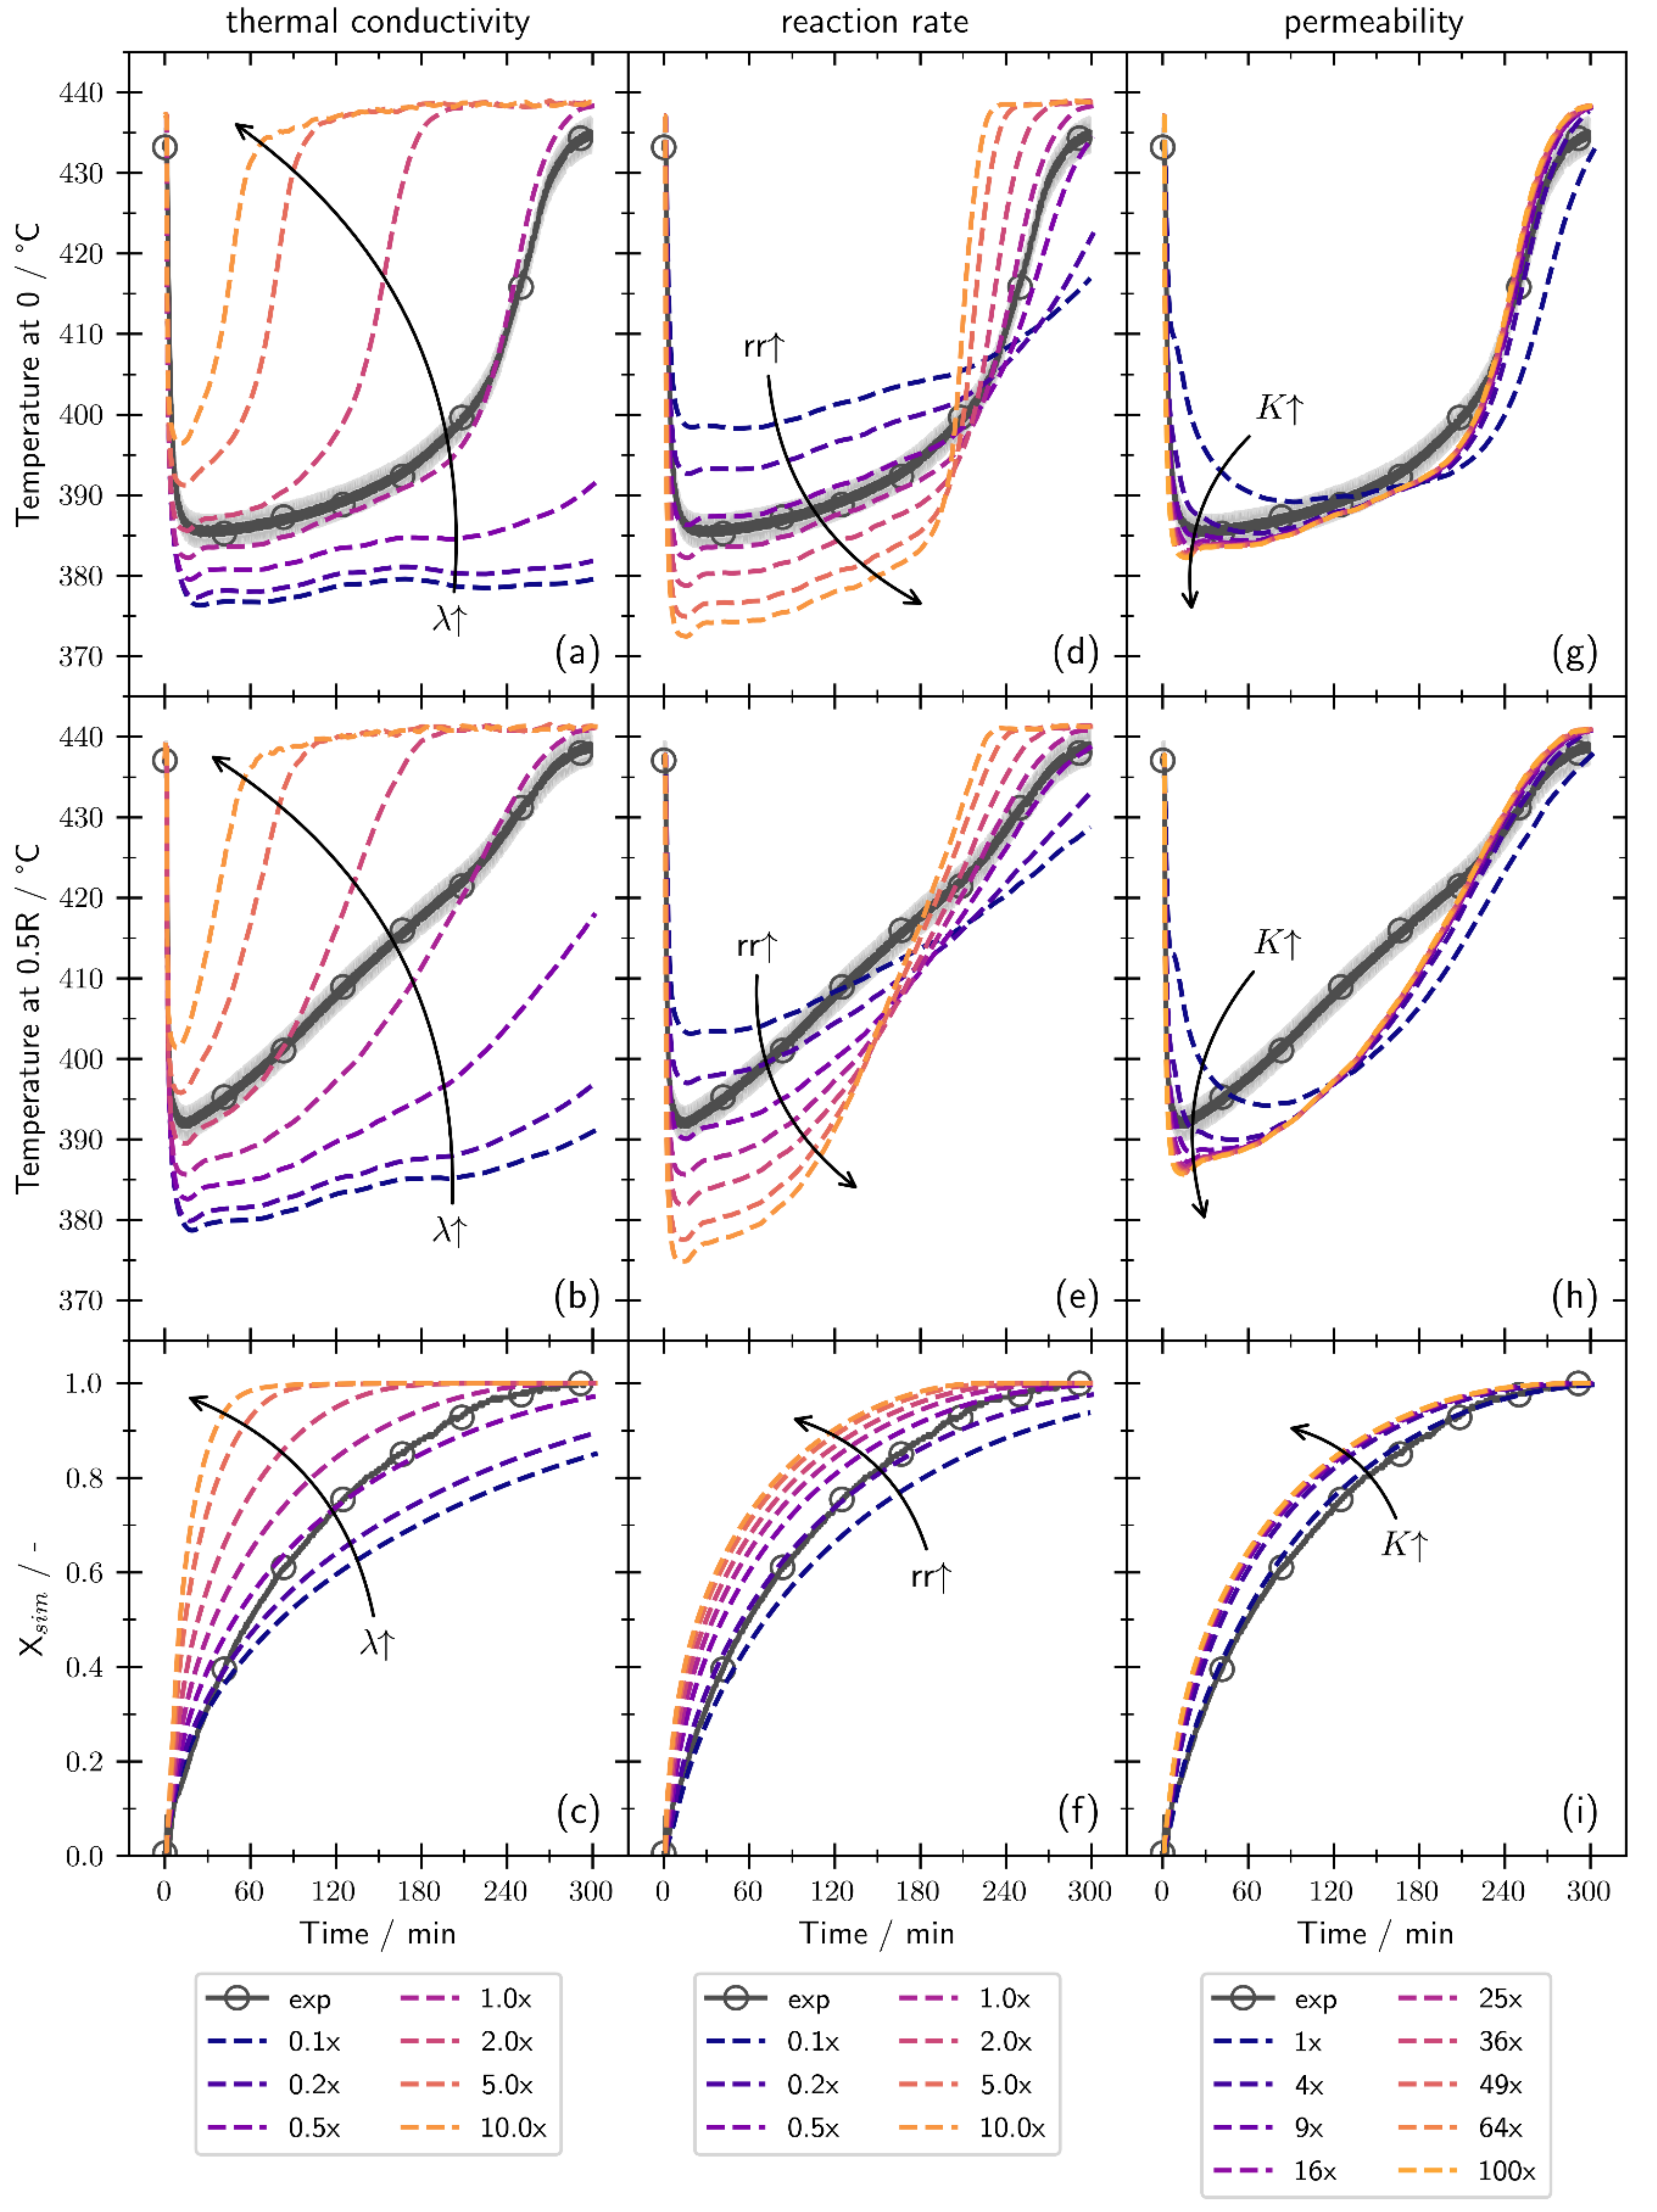
3.3. Sensitivity Study

With the validated model, the sensitivity and limitations of the system are analyzed. Therefore, the effective thermal conductivity and the reaction kinetics are varied by the factors 0.1, 0.2, 0.5, 1, 2, 5, and 10. Furthermore, the permeability has been varied between factors 1 and 100, which is equivalent to a variation of the particle size.
Figure 10 displays the results of the variations for a p− simulation, although the T+ variation (S7) shows similar results.
Increasing the thermal conductivity shifts the temperature increase to lower times and increases the global minimum temperature for both T0 and T0.5R (displayed in Figure 10a,b). The time until full global conversion is reached varies largely from 60 min with 10-fold thermal conductivity to reaching only 85% after 300 min for a factor of 0.1 (depicted in Figure 10c).
An increased reaction rate causes lower temperatures (Figure 10d,e) during the dehydration reaction and an increased overall conversion Figure 10f. Therefore, the temperatures increase faster at the end of the simulation. Here, for the higher reaction rates, the material is already fully converted, while for a lower reaction rate, the reaction is still ongoing, reducing the temperature increase. The time for full conversion decreases with an increase in the reaction rate, but there is only a marginal difference between factors 2, 5, and 10. Overall, the derived equation for the reaction rate describes the local temperature profiles best, since no analyzed factor yields a lower mean absolute error for both temperatures simultaneously.
The impact of the permeability variation is low. Temperatures T0 and T0.5R show different courses for a factor of 1, 4, and 9, but a further increase has no distinct impact (Figure 10g,h). The conversion graph, Figure 10i, shows lower values for the factor 1, but all other factors yield approximately the same conversion course. Thus, a further increase in the permeability over the factor of 9 has no distinct effect, and the simulation with an increase in the permeability by a factor of 100 might overestimate the true permeability enhancement. However, the exact enhancement cannot be derived from the simulation results but is at least at position 0 and 0.5R greater or equal 9.
The system is mainly limited by the low thermal conductivity which was already shown for higher pressures (e.g., [28]). Thus, improving the effective thermal conductivity by fins, material modifications, or switching to a reactor type with an improved heat input are the most promising options to optimize the dehydration also with low steam partial pressures. Mass transport is only limiting at position 0 and 0.5R for a permeability enhancement below 9 (i.e., particles sized below 15 µm). Thus, structural changes of the bulk such as agglomeration or channeling can improve the reactor performance to a certain degree and are not necessarily negative.

4. Conclusions

The dehydration of Ca(OH)2 in a pressure range between 0.8 and 5.5 kPa and temperatures up to 490 °C has been analyzed by a comprehensive approach. This low-pressure range is beneficial for thermochemical energy storage, since the system can be charged at lower temperatures. An equation for the reaction rate has been determined by thermogravimetric measurements in a 5.5 mg scale. Additionally, experiments in a fixed bed reactor with a bulk mass of about 80 g have been conducted. Furthermore, a numerical model has been implemented, and the numerical results have been compared to the experimental data. The main findings are as follows:
  • The reaction kinetics becomes comparatively slow (i.e., 200 min or longer until full conversion is reached) in the analyzed pressure range for temperatures approximately closer than 40–50 K to the equilibrium temperature by Samms and Evans.
  • Assuming a one-step reaction, common models for the reaction kinetics cannot adequately describe the slow kinetics “close” to the equilibrium and fast kinetics further away from the equilibrium in one equation.
  • A new equation for the reaction rate has been derived for a pressure and temperature range between 0.8 and 5.5 kPa and 375 and 440 °C.
  • The gas transport is adequately described by the Carman–Kozeny equation for dehydrations initiated by a temperature increase. However, when the dehydration is triggered by a pressure reduction, structural changes of the bulk occur (e.g., channeling), and the permeability is enhanced. These structural changes have been incorporated by increasing the permeability by a factor of 100.
  • When the channeling effects are considered by the increased permeability, the simulation yields mean absolute errors below 10 K for the temperatures and below 0.08 for the global conversion. Thus, the simulation model is validated within the measurement uncertainties of the setup for different operation modes, temperatures, and pressures.
The sensitivity study of the model showed that the fixed bed reactor is mainly limited by heat transfer. So, the most promising optimizations are increasing the thermal conductivity by material modifications or an improved reactor design.

Supplementary Materials

The following supporting information can be downloaded at: https://www.mdpi.com/article/10.3390/pr10020325/s1, Figure S1: Comparison of experimental and numerical results for E11; Figure S2: Comparison of the experimental and numerical results for E3; Figure S3: Experimental and numerical results for E5; Figure S4: Experimental and numerical results for E9; Figure S5: Comparison of the bulk before and after the experiments; Figure S6: Simulation with an assumed permeability increase by the factor 100 for E11 and E13; Figure S7: Variation of the thermal conductivity, the reaction rate, and the permeability for E13.

Author Contributions

K.R.: Conceptualization, Methodology, Validation, Formal analysis, Investigation (numerical), Visualization, Writing—Original Draft; I.B.: Methodology, Writing—Review and Editing; M.L. (Michael Lutz): Formal analysis (TGA data), Writing—Review and Editing; S.F.: Investigation (experiments), Writing—Review and Editing; Y.K.: Supervision (experiments), Writing—Review and Editing; M.L. (Marc Linder): Conceptualization, Methodology, Writing—Review and Editing, Supervision; M.S.: Conceptualization, Methodology, Investigation (experiments), Writing—Review and Editing, Supervision. All authors have read and agreed to the published version of the manuscript.

Funding

This research was partially funded by the Karl-Vossloh-Stiftung, Project No.: S047/10043/2017.

Data Availability Statement

Datasets generated during the current study are available from the corresponding author on reasonable request.

Acknowledgments

The authors thank Andrea Hanke for performing the TGA measurements, Nils Rahner for performing the measurement of the particle size, Nicole Neumann for useful discussions, and Max Mensing for preliminary simulation works.

Conflicts of Interest

The authors declare no conflict of interest.

Nomenclature

SymbolDescriptionUnit
Δ H Reaction enthalpyJ/mol
ρ Densitykg/m3
λ Thermal conductivityW/m/K
μ Dynamic viscosityPa s
aFitting coefficient-
bFitting coefficient-
c p Isobaric heat capacityJ/kg/K
d p Particle sizem
KPermeability
mFitting coefficient-
n C a O H 2 , 0   Initial molar mass of Ca(OH)2 mol
pPressurePa
p’Fitting coefficient-
TTemperatureK
tTimes
uVelocitym/s
XConversion-
Indices:
EqEquilibrium
expExperiment
iMeasurement number
jPoint in time

References

  1. Fujimoto, S.; Bilgen, E.; Ogura, H. Dynamic simulation of CaO/Ca(OH)2 chemical heat pump systems. Exergy Int. J. 2002, 2, 6–14. [Google Scholar] [CrossRef]
  2. Stengler, J.; Linder, M. Thermal energy storage combined with a temperature boost: An underestimated feature of thermochemical systems. Appl. Energy 2020, 262, 114530. [Google Scholar] [CrossRef]
  3. Rosemary, J.K.; Bauerle, G.L.; Springer, T.H. Solar Energy Storage Using Reversible Hydration-Dehydration of CaO-Ca(OH)2. J. Energy 1979, 3, 321–322. [Google Scholar] [CrossRef]
  4. Schaube, F.; Koch, L.; Wörner, A.; Müller-Steinhagen, H. A thermodynamic and kinetic study of the de- and rehydration of Ca(OH)2 at high H2O partial pressures for thermo-chemical heat storage. Thermochim. Acta 2012, 538, 9–20. [Google Scholar] [CrossRef]
  5. Halstead, P.E.; Moore, A.E. The thermal dissociation of calcium hydroxide. J. Chem. Soc. 1957, 0, 3873–3875. [Google Scholar] [CrossRef]
  6. Samms, J.A.C.; Evans, B.E. Thermal dissociation of Ca(OH)2 at elevated pressures. J. Appl. Chem. 1968, 18, 5–8. [Google Scholar] [CrossRef]
  7. Schaube, F.; Antje, W.Ă.; Tamme, R. High Temperature Thermochemical Heat Storage for Concentrated Solar Power Using Gas-Solid Reactions. J. Sol. Energy Eng. 2011, 133, 31006. [Google Scholar] [CrossRef]
  8. Papapetrou, M.; Kosmadakis, G.; Cipollina, A.; Commare, U.L.; Micale, G. Industrial waste heat: Estimation of the technically available resource in the EU per industrial sector, temperature level and country. Appl. Therm. Eng. 2018, 138, 207–216. [Google Scholar] [CrossRef]
  9. Yan, J.; Zhao, C.Y. Thermodynamic and kinetic study of the dehydration process of CaO/Ca(OH)2 thermochemical heat storage system with Li doping. Chem. Eng. Sci. 2015, 138, 86–92. [Google Scholar] [CrossRef]
  10. Gupta, A.; Armatis, P.D.; Sabharwall, P.; Fronk, B.M.; Utgikar, V. Kinetics of Ca(OH)2 decomposition in pure Ca(OH)2 and Ca(OH)2-CaTiO3 composite pellets for application in thermochemical energy storage system. Chem. Eng. Sci. 2021, 246, 116986. [Google Scholar] [CrossRef]
  11. Khachani, M.; el Hamidi, A.; Halim, M.; Arsalane, S. Non-isothermal kinetic and thermodynamic studies of the dehydroxylation process of synthetic calcium hydroxide Ca(OH)2. J. Mater. Environ. Sci. 2014, 5, 615–624. [Google Scholar]
  12. Koga, N.; Favergeon, L.; Kodani, S. Impact of atmospheric water vapor on the thermal decomposition of calcium hydroxide: A universal kinetic approach to a physico-geometrical consecutive reaction in solid–gas systems under different partial pressures of product gas. Phys. Chem. Chem. Phys. 2019, 21, 11615–11632. [Google Scholar] [CrossRef] [PubMed]
  13. Matsuda, H. Kinetic Study of Ca(OH)2/CaO Reversible Thermochemical Reaction for Thermal Energy Storage by Means of Chemical Reaction. Kagaku Kogaku Ronbunshu 1985, 11, 542–548. [Google Scholar] [CrossRef] [Green Version]
  14. Criado, Y.A.; Alonso, M.; Abanades, J.C. Kinetics of the CaO/Ca(OH)2Hydration/Dehydration Reaction for Thermochemical Energy Storage Applications. Ind. Eng. Chem. Res. 2014, 53, 12594–12601. [Google Scholar] [CrossRef] [Green Version]
  15. Angerer, M.; Becker, M.; Härzschel, S.; Kröper, K.; Gleis, S.; Vandersickel, A.; Spliethoff, H. Design of a MW-scale thermo-chemical energy storage reactor. Energy Rep. 2018, 4, 507–519. [Google Scholar] [CrossRef]
  16. Criado, Y.A.; Huille, A.; Rougé, S.; Abanades, J.C. Experimental investigation and model validation of a CaO/Ca(OH)2 fluidized bed reactor for thermochemical energy storage applications. Chem. Eng. J. 2017, 313, 1194–1205. [Google Scholar] [CrossRef] [Green Version]
  17. Rougé, S.; Criado, Y.A.; Soriano, O.; Abanades, J.C. Continuous CaO/Ca(OH)2 Fluidized Bed Reactor for Energy Storage: First Experimental Results and Reactor Model Validation. ACS Publ. 2017, 56, 844–852. [Google Scholar] [CrossRef] [Green Version]
  18. Bian, Z.; Li, Y.; Zhang, C.; Zhao, J.; Wang, T.; Lei, W. Heat release performance and evolution of CaO particles under fluidization for CaO/Ca(OH)2 thermochemical heat storage. Process Saf. Environ. Prot. 2021, 155, 166–176. [Google Scholar] [CrossRef]
  19. Schaube, F.; Kohzer, A.; Schütz, J.; Wörner, A.; Müller-Steinhagen, H. De- and rehydration of Ca(OH)2 in a reactor with direct heat transfer for thermo-chemical heat storage. Part A: Experimental results. Chem. Eng. Res. Des. 2013, 91, 856–864. [Google Scholar] [CrossRef]
  20. Schmidt, M.; Szczukowski, C.; Roßkopf, C.; Linder, M.; Wörner, A. Experimental results of a 10 kW high temperature thermochemical storage reactor based on calcium hydroxide. Appl. Therm. Eng. 2014, 62, 553–559. [Google Scholar] [CrossRef] [Green Version]
  21. Yan, J.; Zhao, C.Y. Experimental study of CaO/Ca(OH)2 in a fixed-bed reactor for thermochemical heat storage. Appl. Energy 2016, 175, 277–284. [Google Scholar] [CrossRef]
  22. Dai, L.; Long, X.-F.; Lou, B.; Wu, J. Thermal cycling stability of thermochemical energy storage system Ca(OH)2/CaO. Appl. Therm. Eng. 2018, 133, 261–268. [Google Scholar] [CrossRef]
  23. Yuan, Y.; Li, Y.; Zhao, J. Development on Thermochemical Energy Storage Based on CaO-Based Materials: A Review. Sustainability 2018, 10, 2660. [Google Scholar] [CrossRef] [Green Version]
  24. Schmidt, M.; Gutierrez, A.; Linder, M. Thermochemical energy storage with CaO/Ca(OH)2—Experimental investigation of the thermal capability at low vapor pressures in a lab scale reactor. Appl. Energy 2017, 188, 672–681. [Google Scholar] [CrossRef]
  25. Nagel, T.; Shao, H.; Singh, A.K.; Watanabe, N.; Roßkopf, C.; Linder, M.; Wörner, A.; Kolditz, O. Non-equilibrium thermochemical heat storage in porous media: Part 1–Conceptual model. Energy 2013, 60, 254–270. [Google Scholar] [CrossRef]
  26. Schaube, F.; Utz, I.; Wörner, A.; Müller-Steinhagen, H. De- and rehydration of Ca(OH)2 in a reactor with direct heat transfer for thermo-chemical heat storage. Part B: Validation of model. Chem. Eng. Res. Des. 2013, 91, 865–873. [Google Scholar] [CrossRef]
  27. Xiao, S.; Praditia, T.; Oladyshkin, S.; Nowak, W. Global sensitivity analysis of a CaO/Ca(OH)2 thermochemical energy storage model for parametric effect analysis. Appl. Energy 2021, 285, 116456. [Google Scholar] [CrossRef]
  28. Ranjha, Q.; Oztekin, A. Numerical analyses of three-dimensional fixed reaction bed for thermochemical energy storage. Renew. Energy 2017, 111, 825–835. [Google Scholar] [CrossRef]
  29. Seitz, G.; Mohammadi, F.; Class, H. Thermochemical Heat Storage in a Lab-Scale Indirectly Operated CaO/Ca(OH)2 Reactor—Numerical Modeling and Model Validation through Inverse Parameter Estimation. Appl. Sci. 2021, 11, 682. [Google Scholar] [CrossRef]
  30. Wang, M.; Chen, L.; Zhou, Y.; Tao, W.-Q. Numerical Simulation of the Physical–Chemical–Thermal Processes During Hydration Reaction of the Calcium Oxide/Calcium Hydroxide System in an Indirect Reactor. Transp. Porous Media 2020, 140, 667–696. [Google Scholar] [CrossRef]
  31. Vyazovkin, S.; Burnham, A.K.; Criado, J.M.; Pérez-Maqueda, L.A.; Popescu, C.; Sbirrazzuoli, N. ICTAC Kinetics Committee recommendations for performing kinetic computations on thermal analysis data. Thermochim. Acta 2011, 520, 1–19. [Google Scholar] [CrossRef]
  32. Šesták, J.; Berggren, G. Study of the kinetics of the mechanism of solid-state reactions at increasing temperatures. Thermochim. Acta 1971, 3, 1–12. [Google Scholar] [CrossRef]
  33. Newville, M.; Stensitzki, T.; Allen, D.B.; Ingargiola, A. LMFIT: Non-Linear Least-Square Minimization and Curve-Fitting for Python. Astrophys. Source Code Libr. 2014, ascl-1606. [Google Scholar] [CrossRef]
  34. Funayama, S.; Takasu, H.; Zamengo, M.; Kariya, J.; Kim, S.T.; Kato, Y. Performance of thermochemical energy storage of a packed bed of calcium hydroxide pellets. Energy Storage 2019, 1, e40. [Google Scholar] [CrossRef] [Green Version]
  35. Funayama, S.; Takasu, H.; Zamengo, M.; Kariya, J.; Kim, S.T.; Kato, Y. Composite material for high-temperature thermochemical energy storage using calcium hydroxide and ceramic foam. Energy Storage 2019, 1, e53. [Google Scholar] [CrossRef] [Green Version]
  36. Risthaus, K.; Bürger, I.; Linder, M.; Schmidt, M. Numerical analysis of the hydration of calcium oxide in a fixed bed reactor based on lab-scale experiments. Appl. Energy 2020, 261, 114351. [Google Scholar] [CrossRef]
  37. Barin, I. Thermochemical Data of Pure Substances; Wiley: Weinheim, Germany; New York, NY, USA, 1995. [Google Scholar] [CrossRef]
  38. Roßkopf, C.; Haas, M.; Faik, A.; Linder, M.; Wörner, A. Improving powder bed properties for thermochemical storage by adding nanoparticles. Energy Convers. Manag. 2014, 86, 93–98. [Google Scholar] [CrossRef]
  39. Gollsch, M.; Afflerbach, S.; Drexler, M.; Linder, M. Structural integrity of calcium hydroxide granule bulks for thermochemical energy storage. Sol. Energy 2020, 208, 873–883. [Google Scholar] [CrossRef]
  40. Schmidt, M.; Linder, M. Power generation based on the Ca(OH)2/CaO thermochemical storage system—Experimental investigation of discharge operation modes in lab scale and corresponding conceptual process design. Appl. Energy 2017, 203, 594–607. [Google Scholar] [CrossRef]
  41. Mahmoudi, A.; Donkers, P.A.J.; Walayat, K.; Peters, B.; Shahi, M. A thorough investigation of thermochemical heat storage system from particle to bed scale. Chem. Eng. Sci. 2021, 246, 116877. [Google Scholar] [CrossRef]
Figure 1. Schematic setup adapted with permission from ref. [35] (a), copyright 2019 John Wiley and Sons, and cross-section area of the reactor (b). Geometry values are given in mm. Blue and red squares are positions of thermocouples.
Processes 10 00325 g001
Figure 2. Comparison of the TGA measurements for the dehydration and their respective mathematical fit for different pressures and temperatures (ae) and dynamic measurements (f). Entries marked with ‘*’ were not considered for the fitting procedure.
Processes 10 00325 g002
Figure 3. Comparison of measurements and simulation for the heating up procedure of Ca(OH)2 without reaction at a steam pressure of 90 kPa. MAEs are 2.4 K for T0 and 2.6 K for T0.5R.
Processes 10 00325 g003
Figure 4. Experimental and numerical results of temperatures (a) and conversions (b) for experiment “E13” with an assumed particle diameter of 5 µm for the simulation. The dehydration is triggered by a temperature rise with a steam pressure of about 2.8 kPa and heaters set to 450 °C. MAEs are 3 K for T0 and T0.5R and 0.04 for the global conversion. The corresponding equilibrium pressure of the equilibrium temperatures ( sim   T Eq 0 and exp   T Eq ) is shown on the right pressure scale.
Processes 10 00325 g004
Figure 5. Pressure distribution inside the reactor at minute 25 (local temperature maximum) for E13.
Processes 10 00325 g005
Figure 6. Comparison of the experimental and numerical results of temperatures (a) and conversions (b) for E7. The heaters are set to 450 °C, and the dehydration is induced by a pressure reduction to 3 kPa. A particle diameter of 5 µm is used for the simulation. The MAEs amount to 6 K, 7.8 K, and 0.01 for T0, T0.5R, and the conversion, respectively.
Processes 10 00325 g006
Figure 7. Comparison of the experimental and numerical results of temperatures (a) and conversions (b) for E7. Here, an enhanced permeability by the factor 100 is used for the simulation. MAEs are 2.8 K for T0, 6.2 K for T0.5R, and 0.08 for the conversion.
Processes 10 00325 g007
Figure 8. Comparison of the experimental and numerical results of temperatures (a) and conversions (b) for E15. The pressure is reduced to 3.5 kPa, and heaters are set to 490 °C. In the simulation, an enhanced permeability by the factor 100 is used. The MAEs amount to 6 K, 8.2 K, and 0.04 for T0, T0.5R, and the conversion, respectively.
Processes 10 00325 g008
Figure 9. Comparison of three experiments (E5, E7, E9) with similar pressures and the same heater temperature of 450 °C. Experimental and numerical results of temperatures (a) and conversions (b).
Processes 10 00325 g009
Figure 10. Variation of the thermal conductivity (ac), the reaction rate (df), and the particle diameter (gi) for E7. The direction of the arrow indicates increasing values.
Processes 10 00325 g010
Table 1. Overview of the TGA measurements. Isothermal values in brackets have been measured, but they were not used for the fitting procedure.
Pressure/kPaIsothermal:
Temperature/°C
Dynamic (5 K/min): Temperature/°C
0.8(365)375390 270–460
1.2(365 1)375385390395405420270–475
2.5390400405 270–490
5.5430440
1 Stopped after 10 h.
Table 2. Overview of the dehydration experiments.
NameTypeAverage Steam Pressure/kPaStart Temperature/°CHeater Temperature/°C
E3 1p−4.8450450
E5p−2.9450450
E7p−3450450
E9p−3.3450450
E11T+3.6350490
E13T+2.8280450
E15p−3.4490490
1 The first dehydration experiment (E1) was not used in this study due to complications during the experiment.
Table 3. Overview of the used parameters for the numerical model.
ParameterUnitSymbolValue Reference
Thermal conductivity, solid matrixW/(m K) λ CaO
λ Ca OH 2
0.6
0.7
Fitted (see Section 3.2.1)
Particle diameterµm d p 5
Gas constantJ/(mol K)R8.314
Reaction enthalpykJ/mol Δ H T 101at 450 °C[37]
Isobaric heat capacity CaO
Ca(OH)2
J/(kg K) c p ,   bulk T 923
1504
at 450 °C
at 450 °C
[37]
Table 4. Overview of the mean absolute errors between experiments and simulations.
ExperimentTypeTheoretical
Final Conversion
Permeability FactorMAEs
T0/KT0.5R/KX/-
E3p−79% *1000.933.980.03
E5p−86%1004.272.860.06
E7p−87%1002.756.230.08
E9p−92%1003.483.10.08
E11T+94%16.99.90.02
E13T+98%1330.04
E15p−83%1006.028.170.04
* experiment was stopped before a steady state was reached.
Publisher’s Note: MDPI stays neutral with regard to jurisdictional claims in published maps and institutional affiliations.

