Article

Evaluation of Portable Vibrational Spectroscopy Sensors as a Tool to Detect Black Cumin Oil Adulteration

by
Ahmed Menevseoglu
Department of Gastronomy and Culinary Arts, School of Tourism and Hotel Management, Agri Ibrahim Cecen University, Agri 04100, Turkey
Processes 2022, 10(3), 503; https://doi.org/10.3390/pr10030503
Submission received: 28 January 2022 / Revised: 28 February 2022 / Accepted: 1 March 2022 / Published: 2 March 2022

Abstract

:
Black cumin oil adulteration has become a concern because it has numerous health benefits and a high price. Therefore, a simple, non-destructive, and rapid method to identify adulterations in black seed oil is necessary to protect the quality of the oils. This study aimed to perform a non-invasive method to authenticate black cumin oil by portable FT-NIR, FT-MIR, and Raman spectrometers. Spectra were collected with portable devices and analyzed using Soft Independent Modelling of Class Analogy (SIMCA) to generate a classification model to identify pure black cumin oil and partial least squares regression (PLSR) to predict the adulterant levels. For confirmation, the fatty acid profile of the oils was determined by gas chromatography (GC). SIMCA and PLSR models provided a very high performance in detecting adulterated samples in all portable units. These portable units showed great potential for rapid and non-destructive monitoring to identify adulterated black cumin oils.

1. Introductıon

Edible oils provide polyunsaturated fatty acids and other bioactive substances such as vitamin E, cardioprotective functional components. Black cumin oil (BCO), one of the edible oils, extracted from Nigella sativa, commonly grows in the Middle East and Southwest Asia. For years, the seeds of black cumin have been traditionally used to treat diseases such as asthma, bronchitis, and other inflammatory diseases. BCO is one of the most extensively studied oils in recent years due to its numerous health benefits [1,2,3]. Pharmacological properties of BCO have been reported in the literature, including anti-inflammatory [1], anti-diabetic [2], anti-cancer [3], antioxidant [4] properties. Because BCO now has a high commodity value, and its price per liter is almost 25–30 times higher than known vegetable oils such as sunflower, soybean, corn, and canola oil, the adulteration of BCO has become a concern. Therefore, developing non-invasive, rapid, sensitive, and high-throughput methods is required to protect the quality of pure BCO.
Several traditional methods such as gas chromatography (GC) with mass spectroscopy (MS), high-performance liquid chromatography (HPLC) with MS, and nuclear magnetic resonance (NMR) have been applied to detect food adulterations. Many studies can be found in the literature on the detection of oil adulteration by those traditional methods [5,6,7,8]. These conventional methods are highly sensitive and accurate; however, these methods focus on a specific marker compound in the pure oils [8,9,10]. Moreover, these methods are based on targeted approaches. Therefore, a chemical marker such as fatty acids and sterols is predefined for the identification and/or quantification. However, other adulterants that cannot be determined through the selected method may not detect adulteration and authenticity [11]. Furthermore, these methods are expensive, require detailed sample preparation, and are therefore invasive, use chemical solvents mostly environmentally unfriendly, and the devices require high-cost maintenance and well-trained personnel [12].
As an alternative to conventional methods, vibrational spectroscopy techniques (VST) (namely NIR, MIR, Raman) combined with chemometrics have received attention in detecting oil adulteration. Because VST provide rapid, sensitive, non-destructive, and chemical information of the analyzed sample, the techniques get attention from researchers. Many studies that focus on detecting oil adulteration by VST can be found in the literature [13,14,15,16,17,18,19]. In the case of black cumin oil adulteration, few studies can be found [20,21]. Those studies are mostly based on a single unit/method at a time. Very few studies reported a comparison of at least two different spectroscopies on the detection of adulteration and authenticity [22,23]. Thanks to the development of vibrational spectroscopy units, this technology impacted the availability of sensors to use in fields and real-time assessments that help rapid and non-invasive identification of suspected samples. Thus, handheld/portable units provide the ability to take rapid actions on the spot [24]. Handheld and portable FT-IR instruments provide two options: operating in the attenuated total reflection (ATR) or diffuse reflection modes. These instruments are based on smaller forms of traditional interferometer designs that are insensitive to shock, temperature, and vibration, and provide very similar performance to those benchtop units [25,26]. Miniaturized Raman spectrometers are offered with different excitation sources such as 532, 785, and 1064 nm. With the development of technology, vibrational spectroscopy units can now be miniaturized as small as a cellular phone [27].
This research aimed to evaluate the performance of portable FT-NIR, FT-MIR, and Raman spectrometers on identifying adulterated black cumin oils. To the best of our knowledge, these three techniques have not been compared and evaluated to detect black cumin oil adulteration.

2. Materials and Methods

2.1. Materials

Black cumin oils (40 different commercial products), canola oils (six different commercial products), corn oils (six different commercial products), soybean oils (six different commercial products), and sunflower oils (six different commercial products) were purchased online, and from various local markets in Istanbul, Turkey. Canola, corn, soybean, and sunflower oils were selected because of their low price and cheaper substances in black cumin oil. Samples were stored at 4 °C until further analysis to prevent any oil-induced oxidative changes. One of the pure black cumin oils was chosen randomly, and it was adulterated with 5, 10, 15, 20, and 25% (w/w) canola, corn, soybean, and sunflower oils, separately. These levels were chosen to determine the detection limit for adulteration.

2.2. Methods

2.2.1. Reference Method

Gas Chromatography: The fatty acid profile was determined using a fatty acid methyl ester (FAME) procedure [28] with slight modifications. A total of 100 µL oil sample was dissolved in 1 mL of hexane in a microcentrifuge tube; after adding 20 µL 2N potassium hydroxide in methanol, the mixture was vortexed for one minute. The microcentrifuge tube was set aside for the phase separation, and 750 µL of an aliquot from the upper part was removed into another microcentrifuge tube, which already has a pinch of sodium sulfate anhydrous. The tube was centrifuged at 13.2× g rpm for 5 min, and the upper part (~500 µL) was transferred into a borosilicate glass vial. Samples were analyzed using an Agilent 6890 (Santa Clara, CA, USA) GC, with a flame ionization detector (FID) and an HP G1513A autosampler and a tray. Fatty acids were eluted through an HP-88 100 m × 0.25 mm × 0.2 µm column (Agilent, Santa Clara, CA, USA), and helium was used as a carrier gas. A total of 1 µL of the sample was injected with a split ratio of 20:1. The oven temperature was set at 110 °C for 1 min, then increased to 220 °C (5 °C/min) and held for 15 min. The injector temperature was 220 °C, and the detector temperature was 250 °C. The identification of the fatty acids was achieved by comparing each peak’s retention time against the reference standards (Supelco® 37 Component FAME Mix, Sigma Aldrich, St. Louis, MO, USA). GC analyses for each sample were carried out in duplicate.

2.2.2. Spectroscopy

Handheld Near-Infrared spectrometer: The NIR spectra of the oil samples were collected using micro-NeoSpectra (Si-Ware Systems, Cairo, Egypt). This sensor is equipped with a single-chip Michelson interferometer with a monolithic Opto-electro-mechanical structure with a single uncooled indium-gallium-arsenide (InGaAs) photodetector. A total of 75 µL of oil sample were deposited on the sensor, and the spectra were collected at the range of 7400–3920 cm−1 in absorbance mode and with a 16 cm−1 resolution. Samples were scanned for 15 s to increase the signal-to-noise ratio. Spectral data collection was carried out in duplicate.
Portable Mid-Infrared spectrometer: A total of 50 μL of the oil sample was placed on the IR crystal. The FT-IR 5500 (Agilent Technologies Inc., Santa Clara, CA) spectrometer equipped with a temperature-controlled 5-bounce ZnSe crystal set to 65 °C. The spectra were collected at 4 cm−1 resolutions over a range from 4000 to 650 cm−1, and an interferogram of 64 scans was co-added to increase the signal-to-noise ratio. Spectral data collection was carried out in duplicate.
Portable Raman spectrometer: Three milliliters of oil sample were placed in a 10-mm light path quartz cuvette (Hellma Analytics, Mulheim, Germany), and the Raman spectra were collected using a WP 1064 compact portable Raman spectrometer (Wasatch Photonics, Durham, NC, USA). The Raman unit was equipped with an Indium Gallium Arsenide (InGaAs) detector and a laser source operating at 1064 nm. The spectra were collected from 1855 to 200 cm−1 with a resolution of 4 cm−1, and three scans were co-added to improve the signal-to-noise ratio of the spectrum with an integration time of 3000 ms. In addition, a background spectrum was acquired in between every sample to eliminate the environmental variations. Spectral data were displayed in terms of scattered light by the sample and viewed using EnlightenTM software (Wasatch Photonics, Durham, NC, USA). Spectral data collection was carried out in duplicate.

2.3. Data Analysis

A multivariate data analysis software (Pirouette version 4.5, Infometrix Inc., Bothell, WA, USA) was used to analyze the spectral data.
Soft Independent Modeling of Class Analogy (SIMCA): One of the supervised pattern recognition techniques that rely on a confidence region for each class after PCA is applied. Observations are projected in each PC that decide if the observation belongs to that class or not. Because the spectra are complex, SIMCA is required to obtain meaningful information of the data matrix [29]. More information can be found in the literature [30,31]. SIMCA was used to determine the pure samples and adulterated black cumin oils. Each class is generated by a separate PCA model that provides information about the relevance of variables and outlier detection. Unknown samples are projected into each PCA model, and the degree of the fit allows the determination of whether a sample is assigned to a class, fits several classes, or does not fit in any of the classes. Known classes (black cumin, canola, corn, soybean, and sunflower oils) were used to create a classification model to identify the correct classes (80% of the total samples). Then, the validation data set (20% of the samples that were not used in the classification model) was informed to evaluate the model. SIMCA was evaluated based on three-dimension class projection, misclassification (if the sample was predicted in the correct or wrong classes), and interclass distance (ICD). Only SIMCA was used for classification in this study because the best results could be obtained. Another classification model, PLS-DA, was also applied to detect adulterated BCOs; however, it did not separate adulterated BCOs from the pure BCOs. SIMCA identified the adulterated samples, which were decided to be used in this study.
Partial Least Square Regression (PLSR): partial least square regression (PLSR) was used to evaluate the fitness of the model using the standard error of cross-validation (SECV), standard error of prediction (SEP), coefficient of correlation (r), and outlier diagnostics. Sunflower and canola oil adulteration in black cumin oil were predicted by using PLSR. PLSR is one of the most used multivariate data analyses for correlated, noisy, and multi-X variables. For example, data obtained from FT-NIR, FT-MIR, and Raman can have thousands of data points (X variable, i.e., FT-MIR—from 3500 cm−1 to 800 cm−1). Besides, the number of data points can be increased or decreased by selecting a spectral resolution. Detailed information for PLSR can be found in the literature [32,33,34,35]. Samples with large residuals indicating the samples with structure do not fit in the model, and high leverage indicating the sample or variable has a substantial impact on the calibration model considered outliers (not shown in the data).

3. Results and Discussion

Table 1 summarizes the fatty acid profile of black cumin, canola, corn, soybean, and sunflower oils. Five of the 40 commercial black cumin oils were suspected of adulterating with different oils because both chromatography and spectroscopy determined the differences. Pure black cumin oils consisted of myristic (4%), palmitic (8%), stearic (2.5%), oleic (26%), linoleic (57%), linolenic (0.3%), and eicosadienoic (2%) acids. Adulterated black cumin oils, on the other hand, consisted of a very low amount of myristic and eicosadienoic acids and a relatively high amount of linolenic acid. Canola or soybean oils were suspected to be used as an adulterant in the black cumin oils. The proportion of fatty acids in black cumin oils depends on the country of origin. As previously mentioned, single chromatography may not be used to detect oil adulteration since the proportion of fatty acids in the pure black cumin oils was also varied. This research used untargeted approaches in vibrational spectroscopic techniques to provide more detailed chemical information. It could detect the adulteration based on other compounds such as vitamin E.

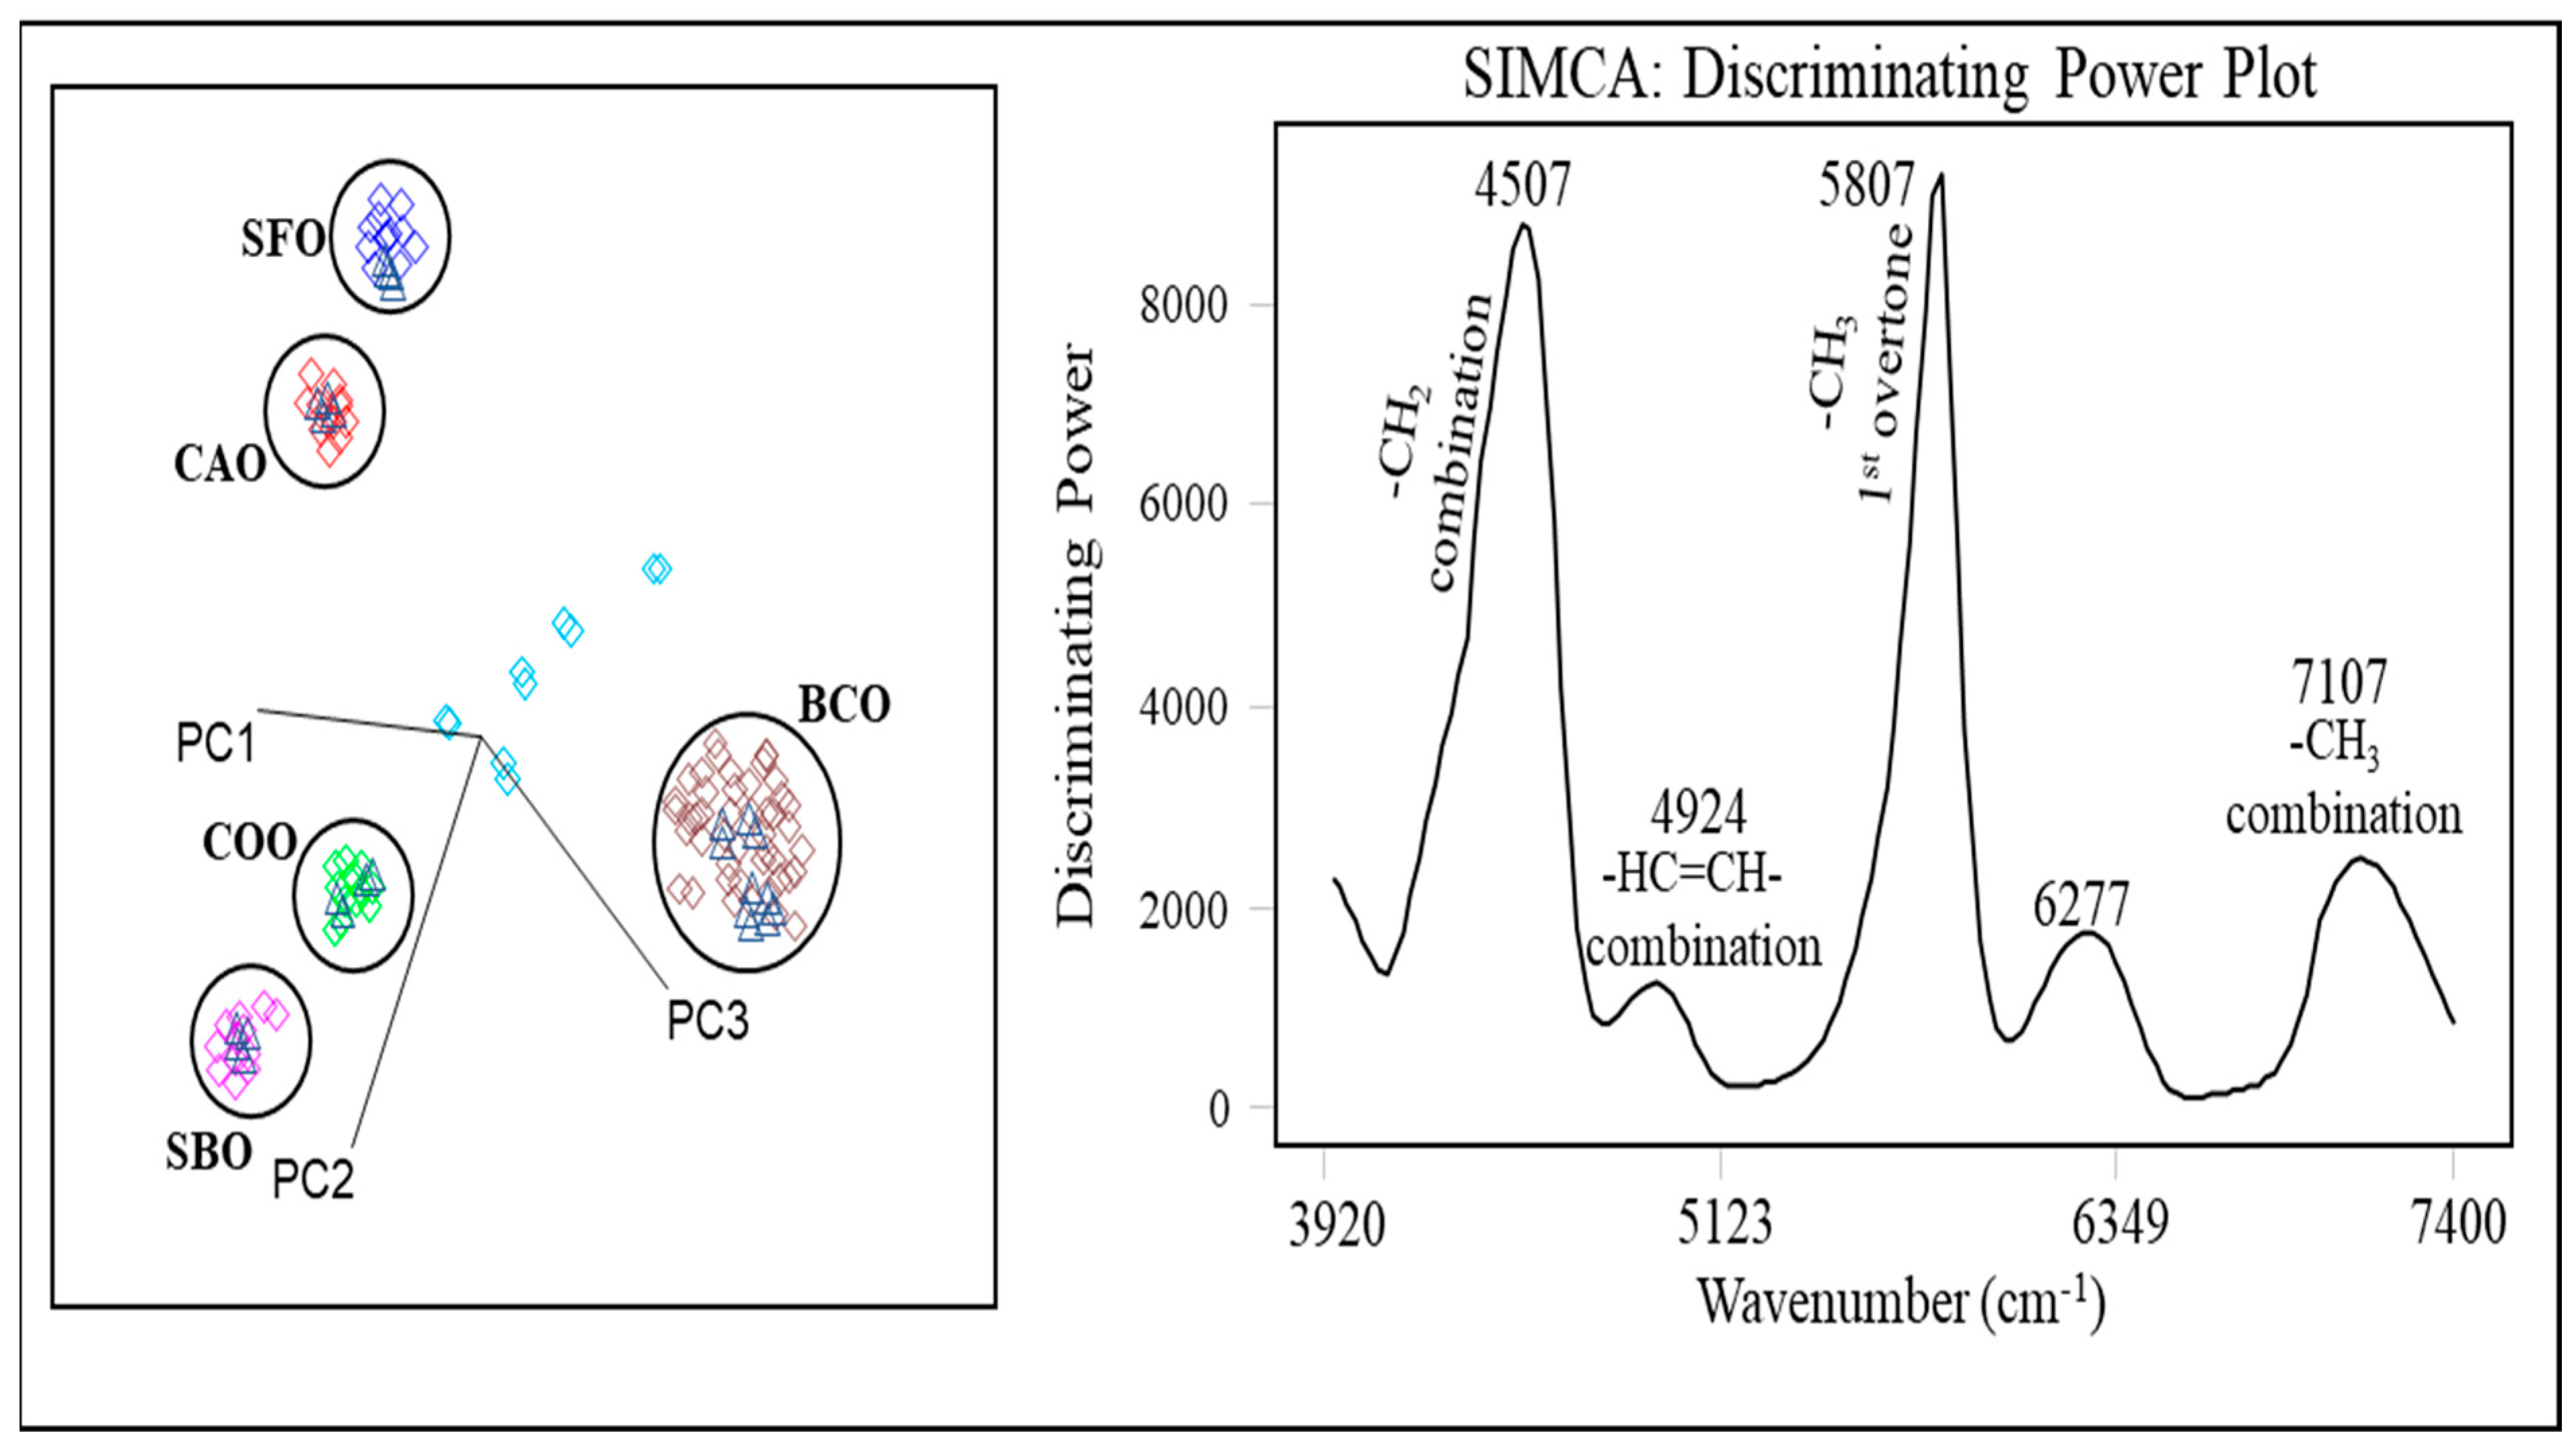
3.1. Classification Model with Handheld FT-NIR

To make the interpretation easier, the spectra were preprocessed using mean-centered and transformed using ‘normalize’ and ‘smooth’ (with a second-order poly-nominal filter with a 35-point window) that improves the spectral characteristics. Many transformation options such as first derivative, baseline correction, Multiplicative Scatter Correction (MSC), and Standard Normal Variate (SNV) were applied to the spectral data, but the best results were obtained by using normalized and smooth transforms. Those transforms were used for removing any variation in the absorbance spectra due to a variation of the light penetration between samples. SIMCA was used to create an algorithm for the classification of the oils. SIMCA 3D class projection was shown in Figure 1. Black cumin, canola, corn, soybean, and sunflower oils were clustered distinctly. The most important absorption peaks were found at 4507 cm−1 (-CH2 combination), 4924 cm−1 (-HC=CH- combination), 5807 cm−1 (-CH3 first overtone), and 7107 cm−1 (-CH3 combination). Peak identifications were made based on the literature [36].
At around 4500 cm−1, the combination of C–H stretching vibration with other vibrational modes characteristics can be observed in this part of the electromagnetic spectra. At around 5000 cm−1, all peaks of the oils were associated with the absorption bands of fatty acids having cis double bonds. The absorption intensity at these wavenumbers increases with the degree of total unsaturation. Around 5800 cm−1, the peaks were associated with methyl, methylene, and ethylene groups. This region could also be correlated with the degree of triglyceride unsaturation. Around 7100 cm−1, very little useful information can be obtained. Nevertheless, this region corresponds to the C–H stretching vibration combination. Moreover, the first overtone of the water absorption band perturbs this region’s absorption. Table 2 shows the interclass distances. Interclass distances (ICD) describe the similarities and/or dissimilarities between the classes, and it is generally accepted that classes show differentiation when the ICD is >3 [37]. ICD of the BCO against vegetable oils was over 22.5, indicating FT-NIR discriminates the black cumin oils perfectly. Besides the ICD values, the SIMCA classification model had no misclassification, and the model’s prediction performance revealed 100% specificity and sensitivity. Handheld FT-NIR spectrometer combined with multivariate analysis showed that it could be used as an alternative method to detect black cumin oil adulteration with vegetable oils.

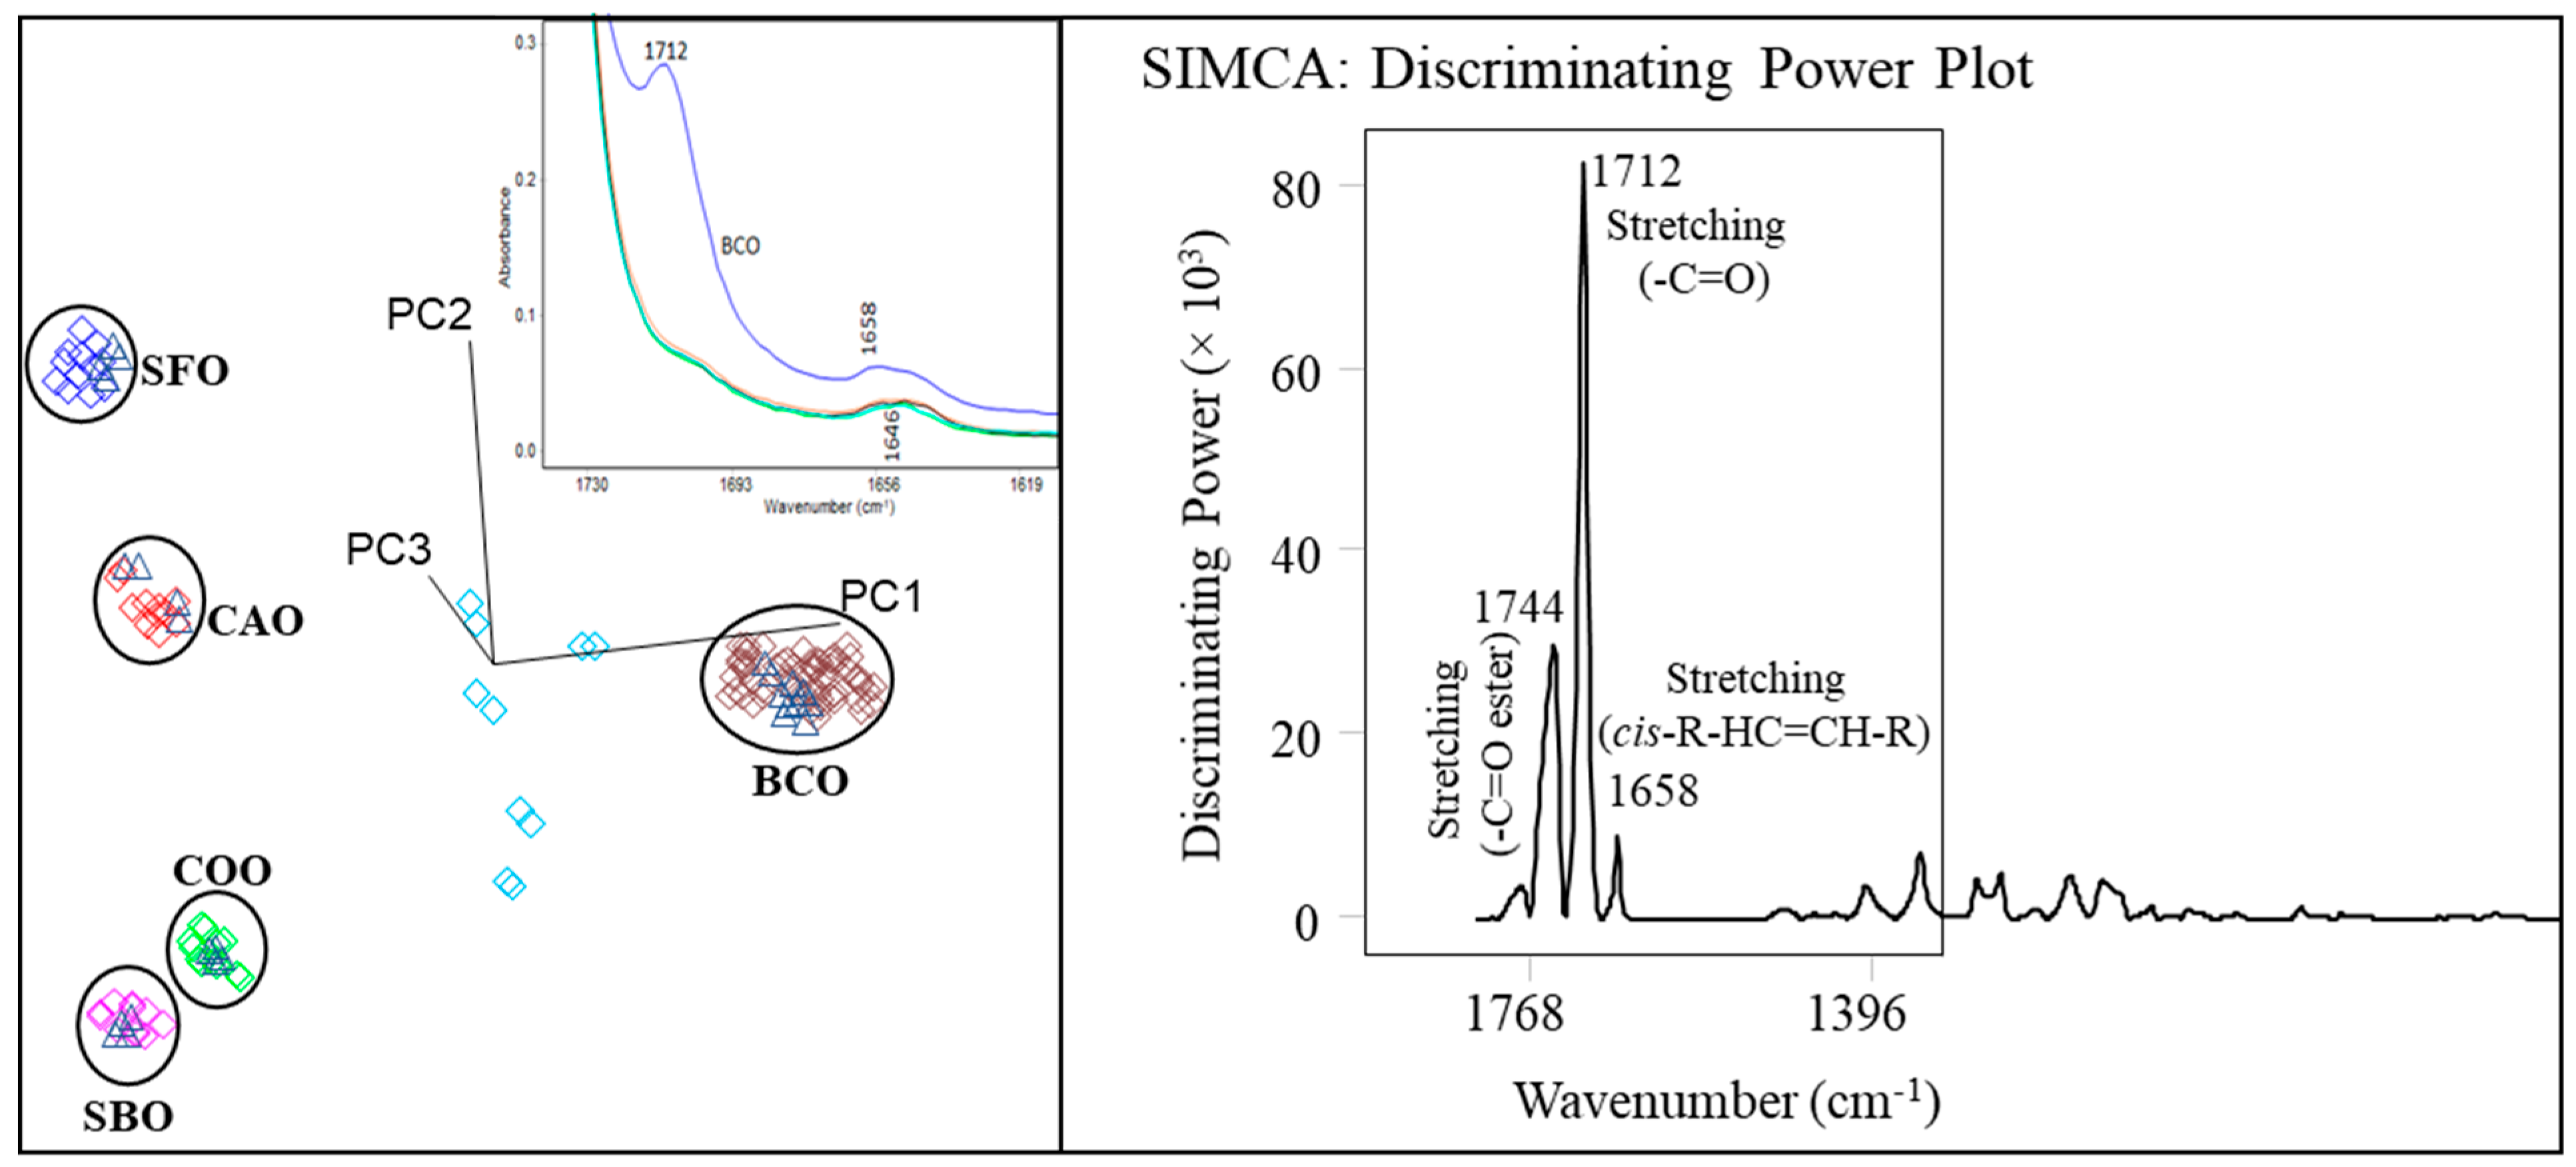
3.2. Classification Model with Portable FT-MIR

The spectra were preprocessed using mean-centered and transformed using ‘smooth’ and ‘second derivative’ (with a second-order poly-nominal filter with a 35-point window). To identify small and nearby lying absorption peaks that were not resolved better in the unprocessed spectra, a transformation of the second derivative was used to increase the specificity of those peaks. Moreover, baseline errors can be removed by using second derivative spectra. Conversely to NIR data transformation, many options were used again to obtain the best output, and second derivative and smooth transforms gave the best classification. SIMCA 3D class projection was shown in Figure 2 Black cumin oils, canola, corn, soybean, and sunflower oils were clustered distinctly. Based on the discriminating power, the peaks at 1744 and 1712 cm−1 are associated with –C=O ester stretching of fatty acids (Figure 2). The peak at 1658 cm−1 was related to C=C stretching (cis-R-HC=CH-R) from polyunsaturated fatty acids. The peaks assignment was based on the previous reports [38,39]. Examining the spectra closely, there were sharp differences in the region between 1750 and 1640 cm−1. Between 1750 and 1700 cm−1, black cumin oils have two peaks, whereas the others revealed only one.
Moreover, black cumin oils revealed peak at 1658 cm−1, whereas the others at 1646 cm1. These peaks may correspond to the ester linkage of triacylglycerol. The ICD values (Table 2) were at least 12.3 between the samples, which indicates that portable FT-MIR spectrometer discriminated the samples very distinctly. The SIMCA model obtained from FT-MIR spectra had no misclassification, and the model’s prediction performance revealed 100% specificity and sensitivity. Overall, the portable FT-MIR spectrometer showed that it could be used for routine analysis for the authentication control of the black cumin oils.

3.3. Classification Model with Portable Raman

The spectra were preprocessed using mean-centered and transformed using ‘normalize’ and ‘smooth’ (with second-order poly-nominal filter with a 35-point window) to reduce the noise and improve spectral characteristics. Many options were used similar to NIR data transformation, and normalized and smooth transforms provided the best classification. Associated bands to the model (Figure 3) were found around 1257 cm−1 (stretching =CH-), 1448 cm−1 (bending -CH2), and 1657 cm−1 (stretching cis-R-HC=CH-R). The peak assignments were made based on the previous studies [11]. Those bands may be related to monounsaturated and polyunsaturated fatty acids, and a positive correlation could be observed as an increase in the band intensity increases the percentage of unsaturated fatty acids in oils similar to obtained from the FT-MIR SIMCA model. FT-MIR and Raman spectrometers are complementary techniques. For instance, the discriminating power of the peak at 1712 cm−1 was very high on the model obtained from FT-IR spectra, while Raman spectra showed very low power. On the contrary, the power of the peak at 1658 cm−1 was very low on the model of FT-IR spectra, while Raman spectra showed very high power. The SIMCA model showed its great potential in detecting the adulteration of black cumin oil with vegetable oils since the ICD values were over 8.7, indicating portable Raman spectrometer discriminated the samples distinctly.
Comparing the three units, the Raman spectrometer was weaker than FT-NIR, and FT-MIR as ICD values of the classes were lower than those obtained from FT-NIR and FT-MIR spectra. Therefore, the best results were obtained from the portable FT-MIR spectrometer.

3.4. Prediction Models

Table 3 shows the performance of predicting models developed using handheld FT-NIR, portable FT-MIR, and Raman spectrometers to predict fatty acids and adulterant levels. In most cases, using many factors improves the prediction performances; however, it may include noise or irrelevant components that can cause overfitting the model. Similarly, using fewer factors than the optimal number can cause underfitting, resulting from less variance than needed [40]. The optimum factors for our predictive models were between three to five. All generated predictive models had very good performances in terms of high rval and low SECV values. Spectra were collected under the same conditions for the samples purchased from the markets to evaluate the portable units’ performances. Validation models showed a similar or slightly lower performance than calibration models.
Interestingly, the prediction of myristic and eicosadienoic acids was relatively lower than other fatty acids predictions using all three units. Overall, among the three units, the best performance was obtained from the portable FT-MIR spectrometer. On the other hand, the handheld FT-NIR spectrometer showed the least performance for the predicting models. FT-MIR and Raman spectrometer performances were excellent for all prediction models because the rval, when it is over 0.90, indicated the prediction level was excellent [41]. Similarly, Aykas et al. (2020) reported that the portable FT-MIR unit has superior performances over the portable Raman unit on predicting fatty acid composition in olive oil samples [11]. FT-NIR also showed excellent performance for the prediction models except for stearic acid as it was 0.89; however, it still shows a very good performance.

4. Conclusions

In this study, black cumin oil adulteration with vegetable oils was aimed to be determined by handheld FT-NIR, portable FT-MIR, and Raman spectrometers. SIMCA and PLSR models were developed to authenticate pure black cumin oils and predict fatty acid and adulterant levels. Portable vibrational spectroscopic units, combined with chemometrics, provided rapid (~10 s), non-invasive, and reliable determination of adulterated black cumin oil with vegetable oils. Based on the portable units and GC results, the study showed that five out of 40 commercial black cumin oils on the market were suspected as adulterated. FT-MIR spectrometer showed slightly better performance than FT-NIR and Raman spectrometers. Vibrational spectroscopy techniques may detect vegetable oil adulterations in black cumin oil as low as 5%. Therefore, these units can be used as an alternative to traditional methods and provide the oil industry and government agencies with an easy, non-invasive method to detect black cumin oil adulteration.

Funding

This research received no external funding.

Acknowledgments

The author would like to thank Luis E. Rodriguez-Saona (The Ohio State University, Department of Food Science and Technology) and Didem Peren Aykas (Adnan Menderes University, Department of Food Engineering, Aydin, Turkey) for their technical support in this study.

Conflicts of Interest

The author declares no conflict of interest. This article does not contain any studies with human or animal subjects.

References

  1. Piras, A.; Rosa, A.; Marongiu, B.; Porcedda, S.; Falconieri, D.; Dessì, M.A.; Ozcelik, B.; Koca, U. Chemical Composition and in Vitro Bioactivity of the Volatile and Fixed Oils of Nigella Sativa L. Extracted by Supercritical Carbon Dioxide. Ind. Crops Prod. 2013, 46, 317–323. [Google Scholar] [CrossRef]
  2. Singh, S.; Das, S.S.; Singh, G.; Schuff, C.; de Lampasona, M.P.; Catalán, C.A.N. Composition, In Vitro Antioxidant and Antimicrobial Activities of Essential Oil and Oleoresins Obtained from Black Cumin Seeds ( Nigella Sativa L.). BioMed Res. Int. 2014, 2014, 918209. [Google Scholar] [CrossRef] [PubMed] [Green Version]
  3. Kaseb, A.O.; Chinnakannu, K.; Chen, D.; Sivanandam, A.; Tejwani, S.; Menon, M.; Dou, Q.P.; Reddy, G.P.-V. Androgen Receptor– and E2F-1–Targeted Thymoquinone Therapy for Hormone-Refractory Prostate Cancer. Cancer Res. 2007, 67, 7782–7788. [Google Scholar] [CrossRef] [PubMed] [Green Version]
  4. Darakhshan, S.; Bidmeshki Pour, A.; Hosseinzadeh Colagar, A.; Sisakhtnezhad, S. Thymoquinone and Its Therapeutic Potentials. Pharmacol. Res. 2015, 95–96, 138–158. [Google Scholar] [CrossRef]
  5. Sun, X.; Zhang, L.; Li, P.; Xu, B.; Ma, F.; Zhang, Q.; Zhang, W. Fatty Acid Profiles Based Adulteration Detection for Flaxseed Oil by Gas Chromatography Mass Spectrometry. LWT-Food Sci. Technol. 2015, 63, 430–436. [Google Scholar] [CrossRef]
  6. Ok, S. Authentication of Commercial Extra Virgin Olive Oils. J. Am. Oil Chem. Soc. 2016, 93, 489–497. [Google Scholar] [CrossRef]
  7. Shi, T.; Wu, G.; Jin, Q.; Wang, X. Detection of Camellia Oil Adulteration Using Chemometrics Based on Fatty Acids GC Fingerprints and Phytosterols GC–MS Fingerprints. Food Chem. 2021, 352, 129422. [Google Scholar] [CrossRef]
  8. Ok, S. Detection of Olive Oil Adulteration by Low-Field NMR Relaxometry and UV-Vis Spectroscopy upon Mixing Olive Oil with Various Edible Oils. Grasas Y Aceites 2017, 68, 173. [Google Scholar] [CrossRef] [Green Version]
  9. Brigante, F.I.; Lucini Mas, A.; Pigni, N.B.; Wunderlin, D.A.; Baroni, M.V. Targeted Metabolomics to Assess the Authenticity of Bakery Products Containing Chia, Sesame and Flax Seeds. Food Chem. 2020, 312, 126059. [Google Scholar] [CrossRef]
  10. Zhang, L.; Shuai, Q.; Li, P.; Zhang, Q.; Ma, F.; Zhang, W.; Ding, X. Ion Mobility Spectrometry Fingerprints: A Rapid Detection Technology for Adulteration of Sesame Oil. Food Chem. 2016, 192, 60–66. [Google Scholar] [CrossRef]
  11. Aykas, D.P.; Karaman, A.D.; Keser, B.; Rodriguez-Saona, L. Non-Targeted Authentication Approach for Extra Virgin Olive Oil. Foods 2020, 9, 221. [Google Scholar] [CrossRef] [PubMed] [Green Version]
  12. Subramanian, A.; Alvarez, V.B.; Harper, W.J.; Rodriguez-Saona, L.E. Monitoring Amino Acids, Organic Acids, and Ripening Changes in Cheddar Cheese Using Fourier-Transform Infrared Spectroscopy. Int. Dairy J. 2011, 21, 434–440. [Google Scholar] [CrossRef]
  13. Quiñones-Islas, N.; Meza-Márquez, O.G.; Osorio-Revilla, G.; Gallardo-Velazquez, T. Detection of Adulterants in Avocado Oil by Mid-FTIR Spectroscopy and Multivariate Analysis. Food Res. Int. 2013, 51, 148–154. [Google Scholar] [CrossRef]
  14. Li, B.; Wang, H.; Zhao, Q.; Ouyang, J.; Wu, Y. Rapid Detection of Authenticity and Adulteration of Walnut Oil by FTIR and Fluorescence Spectroscopy: A Comparative Study. Food Chem. 2015, 181, 25–30. [Google Scholar] [CrossRef] [PubMed]
  15. Elzey, B.; Pollard, D.; Fakayode, S.O. Determination of Adulterated Neem and Flaxseed Oil Compositions by FTIR Spectroscopy and Multivariate Regression Analysis. Food Control 2016, 68, 303–309. [Google Scholar] [CrossRef]
  16. Georgouli, K.; Martinez Del Rincon, J.; Koidis, A. Continuous Statistical Modelling for Rapid Detection of Adulteration of Extra Virgin Olive Oil Using Mid Infrared and Raman Spectroscopic Data. Food Chem. 2017, 217, 735–742. [Google Scholar] [CrossRef] [Green Version]
  17. Chen, H.; Lin, Z.; Tan, C. Fast Quantitative Detection of Sesame Oil Adulteration by Near-Infrared Spectroscopy and Chemometric Models. Vib. Spectrosc. 2018, 99, 178–183. [Google Scholar] [CrossRef]
  18. Farres, S.; Srata, L.; Fethi, F.; Kadaoui, A. Argan Oil Authentication Using Visible/near Infrared Spectroscopy Combined to Chemometrics Tools. Vib. Spectrosc. 2019, 102, 79–84. [Google Scholar] [CrossRef]
  19. Du, Q.; Zhu, M.; Shi, T.; Luo, X.; Gan, B.; Tang, L.; Chen, Y. Adulteration Detection of Corn Oil, Rapeseed Oil and Sunflower Oil in Camellia Oil by in Situ Diffuse Reflectance near-Infrared Spectroscopy and Chemometrics. Food Control 2021, 121, 107577. [Google Scholar] [CrossRef]
  20. Rohman, A.; Wibowo, D.; Sudjadi; Lukitaningsih, E.; Rosman, A.S. Use of Fourier Transform Infrared Spectroscopy in Combination with Partial Least Square for Authentication of Black Seed Oil. Int. J. Food Prop. 2015, 18, 775–784. [Google Scholar] [CrossRef] [Green Version]
  21. Arslan, F.N.; Akin, G.; Karuk Elmas, Ş.N.; Yilmaz, I.; Janssen, H.-G.; Kenar, A. Rapid Detection of Authenticity and Adulteration of Cold Pressed Black Cumin Seed Oil: A Comparative Study of ATR–FTIR Spectroscopy and Synchronous Fluorescence with Multivariate Data Analysis. Food Control 2019, 98, 323–332. [Google Scholar] [CrossRef]
  22. Menevseoglu, A. Non-Destructive Detection of Sesame Oil Adulteration by Portable FT-NIR, FT-MIR, and Raman Spectrometers Combined with Chemometrics. J. Turk. Chem. Soc. Sect. A Chem. 2021, 8, 775–786. [Google Scholar] [CrossRef]
  23. Dogruer, I.; Uyar, H.H.; Uncu, O.; Ozen, B. Prediction of Chemical Parameters and Authentication of Various Cold Pressed Oils with Fluorescence and Mid-Infrared Spectroscopic Methods. Food Chem. 2021, 345, 128815. [Google Scholar] [CrossRef]
  24. Nagarajan, R.; Mehrotra, R.; Bajaj, M.M. Quantitative Analysis of Methanol, an Adulterant in Alcoholic Beverages, Using Attenuated Total Reflectance Spectroscopy. J. Sci. Ind. Res. 2006, 65, 416–419. [Google Scholar]
  25. Haas, J.; Mizaikoff, B. Advances in Mid-Infrared Spectroscopy for Chemical Analysis. Annu. Rev. Anal. Chem. 2016, 9, 45–68. [Google Scholar] [CrossRef]
  26. Crocombe, R.A. Portable Spectroscopy. Appl. Spectrosc. 2018, 72, 1701–1751. [Google Scholar] [CrossRef]
  27. Wu, H.; Qian, J.; Bergles, E.; Chandler, L. A Portable Multiexcitation Dispersive Raman Spectrometer for Environmental Analysis; BaySpec Inc.: San Jose, CA, USA, 2013. [Google Scholar]
  28. Ichihara, K.; Shibahara, A.; Yamamoto, K.; Nakayama, T. An Improved Method for Rapid Analysis of the Fatty Acids of Glycerolipids. Lipids 1996, 31, 535–539. [Google Scholar] [CrossRef] [PubMed]
  29. de Maesschalck, R.; Candolfi, A.; Massart, D.L.; Heuerding, S. Decision Criteria for Soft Independent Modelling of Class Analogy Applied to near Infrared Data. Chemom. Intell. Lab. Syst. 1999, 47, 65–77. [Google Scholar] [CrossRef]
  30. Wold, S. Pattern Recognition by Means of Disjoint Principal Components Models. Pattern Recognit. 1976, 8, 127–139. [Google Scholar] [CrossRef]
  31. Lavine, B.K. Clustering and Classification of Analytical Data. In Encyclopedia of Analytical Chemistry; John Wiley & Sons, Ltd.: Chichester, UK, 2000. [Google Scholar]
  32. Haaland, D.M.; Thomas, E.V. Partial Least-Squares Methods for Spectral Analyses. 1. Relation to Other Quantitative Calibration Methods and the Extraction of Qualitative Information. Anal. Chem. 1988, 60, 1193–1202. [Google Scholar] [CrossRef]
  33. Jong, S. de PLS Fits Closer than PCR. J. Chemom. 1993, 7, 551–557. [Google Scholar] [CrossRef]
  34. Brereton, R.G. Introduction to Multivariate Calibration in Analytical Chemistry. Analyst 2000, 125, 2125–2154. [Google Scholar] [CrossRef]
  35. Wold, S.; Sjöström, M.; Eriksson, L. PLS-Regression: A Basic Tool of Chemometrics. Chemom. Intell. Lab. Syst. 2001, 58, 109–130. [Google Scholar] [CrossRef]
  36. Hourant, P.; Baeten, V.; Morales, M.T.; Meurens, M.; Aparicio, R. Oil and Fat Classification by Selected Bands of Near-Infrared Spectroscopy. Appl. Spectrosc. 2000, 54, 1168–1174. [Google Scholar] [CrossRef]
  37. Brown, S.D. Chemometrics: A Textbook. D. L. Massart. B. G. M. Vandeginste, S. N. Deming, Y. Michotte, and L. Kaufman, Elsevier, Amsterdam, 1988. ISBN 0-444-42660-4. Price Dfl 175.00. J. Chemom. 1988, 2, 298–299. [Google Scholar] [CrossRef]
  38. Rohman, A.; Ariani, R. Authentication of Nigella Sativa Seed Oil in Binary and Ternary Mixtures with Corn Oil and Soybean Oil Using FTIR Spectroscopy Coupled with Partial Least Square. Sci. World J. 2013, 2013, 740142. [Google Scholar] [CrossRef] [PubMed] [Green Version]
  39. Rodriguez-Saona, L.E.; Giusti, M.M.; Shotts, M. Advances in Infrared Spectroscopy for Food Authenticity Testing. In Advances in Food Authenticity Testing; Elsevier: Amsterdam, The Netherlands, 2016; pp. 71–116. [Google Scholar]
  40. Abdi, H. Partial Least Squares Regression and Projection on Latent Structure Regression (PLS Regression). WIREs Comput. Stat. 2010, 2, 97–106. [Google Scholar] [CrossRef]
  41. Urbanocuadrado, M.; Luquedecastro, M.; Perezjuan, P.; Gomeznieto, M. Comparison and Joint Use of near Infrared Spectroscopy and Fourier Transform Mid Infrared Spectroscopy for the Determination of Wine Parameters. Talanta 2005, 66, 218–224. [Google Scholar] [CrossRef] [PubMed]
Figure 1. Soft independent modeling of class analogy—3D projection and discriminating power by SIMCA obtained from handheld FT-NIR. BCO: black cumin oil; CAO: canola oil; COO: corn oil; SBO: soybean oil; SFO: sunflower oil; triangles: validation; unclassified: adulterated black cumin oils; PC1-2-3: Principal Component.
Processes 10 00503 g001
Figure 2. Soft independent modeling of class analogy—3D projection and discriminating power by SIMCA obtained from portable FT-MIR. BCO: black cumin oil; CAO: canola oil; COO: corn oil; SBO: soybean oil; SFO: sunflower oil; triangles: validation; unclassified: adulterated black cumin oils; PC1-2-3: Principal Component.
Processes 10 00503 g002
Figure 3. Soft independent modeling of class analogy—3D projection and discriminating power by SIMCA obtained from portable Raman. BCO: black cumin oil; CAO: canola oil; COO: corn oil; SBO: soybean oil; SFO: sunflower oil; triangles: validation; unclassified: adulterated black cumin oils; PC1-2-3: Principal Component.
Processes 10 00503 g003
Table 1. Summary of fatty acid profiles of black cumin, canola, corn, soybean, and sunflower oils.
n14:016:018:018:118:218:320:2
MinMaxMinMaxMinMaxMinMaxMinMaxMinMaxMinMax
BCO354.08 ± 0.998.06 ± 1.262.47 ± 0.2425.91 ± 1.4257.28 ± 1.900.28 ± 0.111.93 ± 0.75
2.605.706.069.732.172.8922.5028.1853.6660.370.140.511.223.51
Adulte-rated BCO50.23 ± 0.0610.71 ± 1.122.82 ± 0.2935.15 ± 5.2148.86 ± 4.471.78 ± 0.880.48 ± 0.18
0.160.348.7912.112.383.2727.7343.2341.9354.030.783.010.330.80
Canola oil6ND4.23 ± 0.111.91 ± 0.2763.98 ± 1.3220.05 ± 0.597.16 ± 0.161.35 ± 0.20
--4.114.531.762.2362.8165.3118.7421.366.827.350.981.51
Corn oil6ND11.57 ± 0.321.67 ± 0.0232.11 ± 1.5252.41 ± 1.501.51 ± 0.230.37 ± 0.04
--11.1411.901.651.7030.5634.1650.3753.951.271.820.330.43
Soybean oil6ND10.88 ± 0.483.59 ± 0.2224.06 ± 1.0353.17 ± 1.146.60 ± 0.33ND
--10.2111.283.283.7923.0925.4951.5754.126.156.93--
Sunflower oil6ND4.63 ± 0.343.41 ± 0.2762.15 ± 0.9728.19 ± 0.970.39 ± 0.040.23 ± 0.01
--4.174.963.123.7760.9263.2927.1729.500.330.430.220.24
n-number of samples; BCO: black cumin oil; 14:0-myristic acid; 16:0-palmitic acid; 18:0-stearic acid; 18:1-oleic acid; 18:2-linoleic acid: 18:3-linolenic acid; 20:2-eicosadienoic acid; ND: not determined; ± standard deviation.
Table 2. Interclass distances obtained from SIMCA models.
Interclass Distances (ICD)
UnitOilBCOCAOCOOSBOSFO
FT-NIRBCO-39.934.634.322.5
CAO39.9-28.116.646.8
COO34.628.1-33.59.5
SBO34.316.633.5-48.2
SFO22.546.89.548.2-
FT-MIRBCO-35.736.237.233.7
CAO35.7-25.627.812.3
COO36.225.6-12.726.9
SBO37.227.812.7-27.9
SFO33.712.326.927.9-
RamanBCO-13.612.68.715.4
CAO13.6-17.048.422.5
COO12.617.0-20.448.2
SBO8.748.420.4-48.6
SFO15.422.548.248.6-
BCO: black cumin oil; CAO: canola oil; COO: corn oil; SBO: soybean oil; SFO: sunflower oil.
Table 3. Statistical performance of the prediction models developed using FT-NIR, FT-MIR, and Raman spectrometers for predicting fatty acid and adulteration levels of black cumin oil.
UnitParameterCalibration ModelValidation Model
Range aN bF cSEC drcal eRangeNSEP frval g
FT-NIR14:00.2–5.74741.10.830.3–5.6111.30.79
16:04.1–12.16740.40.944.3–11.9170.60.92
18:01.7–3.86640.10.911.8–3.6160.20.89
18:122.5–65.36731.20.9623.1–64.9171.40.95
18:218.8–60.46731.30.9619.0–59.8171.40.95
18:30.1–7.46550.20.920.2–7.2170.40.91
20:20.2–3.56250.70.770.3–3.2150.90.74
CAO0–251631.30.955.0–20.041.40.94
COO0–251641.20.965.0–20.041.30.95
SBO0–251640.90.975.0–20.041.00.96
SFO0–251641.30.955.0–20.041.30.94
FT-MIR14:00.2–5.74850.60.880.3–5.6120.80.85
16:04.1–12.16630.10.984.3–11.9160.10.97
18:01.7–3.86730.10.991.8–3.6160.20.98
18:122.5–65.36740.40.9923.1–64.9160.50.97
18:218.8–60.46740.70.9819.0–59.8160.90.96
18:30.1–7.46750.30.970.2–7.2160.40.94
20:20.2–3.56150.50.820.3–3.2150.60.78
CAO0–251631.20.965.0–20.041.30.95
COO0–251631.00.975.0–20.041.00.96
SBO0–251630.60.985.0–20.040.70.98
SFO0–251641.10.965.0–20.041.20.95
Raman14:00.2–5.74850.70.860.3–5.6121.00.82
16:04.1–12.16640.20.974.3–11.9160.30.95
18:01.7–3.86740.10.981.8–3.6170.10.96
18:122.5–65.36630.80.9823.1–64.9171.00.97
18:218.8–60.46740.90.9619.0–59.8161.10.95
18:30.1–7.46740.40.950.2–7.2170.50.93
20:20.2–3.56250.70.800.3–3.2150.90.76
CAO0–251641.20.965.0–20.041.30.95
COO0–251641.10.965.0–20.041.30.95
SBO0–251640.60.975.0–20.040.70.96
SFO0–251641.10.955.0–20.041.30.94
a The unit of the range is %. b Number of samples used in calibration models. c The number of factors. d Standard error of cross-validation. e Correlation coefficient of calibration. f Standard error of prediction. g Correlation coefficient of prediction for external validation. 14:0-myristic acid; 16:0-palmitic acid; 18:0-stearic acid; 18:1-oleic acid; 18:2-linoleic acid: 18:3-linolenic acid; 20:2-eicosadienoic acid; CAO: canola oil; COO: corn oil; SBO: soybean oil; SFO: sunflower oil.
Publisher’s Note: MDPI stays neutral with regard to jurisdictional claims in published maps and institutional affiliations.

