Article

Calibration and Testing of Discrete Element Simulation Parameters for Urea Particles

1
School of Mechanical and Electrical Engineering, Shihezi University, Shihezi 832003, China
2
Key Laboratory of Intelligent Control and Decision-Making for Complex Systems, School of Automation, Beijing Institute of Technology, Beijing 100081, China
*
Authors to whom correspondence should be addressed.
Processes 2022, 10(3), 511; https://doi.org/10.3390/pr10030511
Submission received: 8 February 2022 / Revised: 27 February 2022 / Accepted: 2 March 2022 / Published: 4 March 2022

Abstract

:
The lack of accurate simulation model parameters in the optimization design process of variable fertilizer application devices has resulted in large errors between simulation and theoretical calculation results, which has restricted the development of variable fertilizer application devices to a certain extent. Additionally, there are few scholars studying urea granules, so many parameters of urea granular fertilizer cannot be directly obtained from the literature. The aim of this study is to calibrate a set of simulation parameters by combining physical and simulation tests. In this study, intrinsic parameters were systematically determined, including the particle size, particle density, elastic modulus, Poisson’s ratio and their static friction coefficients, rolling friction coefficients and restitution coefficients of urea particles. By performing the urea particle stacking test, the static friction coefficient between urea particles was calibrated to 0.27, and the rolling friction coefficient between particles was 0.11. To check the reliability of the calibration parameters, the simulation and physical tests of the repose angle and bulk density of urea particles were compared, and the results show that the relative error of repose angles and bulk density of urea particles was 0.78% and 1.19%, respectively. Through the simulation of the mechanical variable fertilizer discharger and the comparison test of the benchtop fertilizer discharging performance, the maximum relative error between the simulation and physical test fertilizer discharge is 3.69% when the working length of the outer sheave is 25 mm; the maximum relative error between the simulation and physical test fertilizer discharge is 3.39% when the working length is 35 mm; the maximum relative error between the simulation and physical test fertilizer discharge is 6.86% when the working length is 45 mm; the maximum relative error between the simulation and physical test fertilizer discharge is 4.95% when the working length is 55 mm. The maximum relative error between the simulated and physical test fertilizer discharge was 6.86% at 45 mm opening and 4.95% at 55 mm opening, and the results show that the urea particle calibration parameters are reliable. The results of this study can provide a theoretical reference for the optimization design and simulation study of variable fertilizer application devices.

1. Introduction

Agricultural fertilizers play a significant role in agricultural production as an important production material that can effectively contribute to the increase in crop yield and income [1]. Although active organic fertilizers that can produce pollution-free and pollution-free green foods have emerged, chemical fertilizers still occupy an important position in modern agricultural production. For a considerable time period in the future, the application of chemical fertilizers will remain one of the indispensable means to achieving sustainable agricultural development [2].
Cotton is an important strategic material for the national livelihood and raw material for the textile industry in China [3]. A large amount of chemical fertilizers, especially basal and seed fertilizers, is applied to cotton in the cultivation process. Variable fertilizer application technology is an important part of modern precision agriculture technology, which is of great significance to the healthy and sustainable development of agriculture in China. Mechanized fertilizer application is the prerequisite foundation to realize the variable fertilizer application technology. At present, the mechanized fertilizer application method is mainly based on slotted-wheel fertilizer application and disc-type fertilizer spreading [4,5]. As one of the most widely used fertilizer dispersers in fertilizer application machinery in China, external slotted-wheel fertilizer dispersers have difficulty in precisely controlling the amount of fertilizer and uneven fertilizer dispersal [6].
To improve the working performance of fertilizer drains, scholars at home and abroad have conducted much research on fertilizer draining devices. In recent years, EDEM (a simulation software developed by DEM solutions, UK) based on the discrete element method has been widely used in the optimization analysis of fertilizer discharge devices [7,8,9]. Studying the interaction between its key components and fertilizer particles through the discrete element method can provide a reference basis to design and optimize fertilizer discharge devices, which can effectively improve the R&D (Research and Development) efficiency and reduce the R&D cost. Xue et al. [10] used the discrete element simulation software EDEM to numerically simulate the structural parameters of the fertilizer discharger and conduct simulation experiments, analyzed the effects of the spiral blade diameter, pitch and fertilizer discharge shaft speed on the fertilizer discharge performance of the fertilizer discharger, and obtained the regression mathematical model of the working parameters of the fertilizer discharger, coefficient of variation of the fertilizer discharge volume and stability of the fertilizer discharge. Sun et al. [11] used EDEM to study the optimal combination of motion parameters and geometric parameters of the fertilizer spreader. Dun et al. [12] used EDEM to establish a discrete element model of an external slotted-wheel fertilizer discharger and analyzed the effect of changes in the structural parameters of the chamfer of the discharged fertilizer tongue on the flow characteristics of fertilizer particles. Cao [13] optimized the design of the operating parameters of the spiral fertilizer discharger using discrete element simulation analysis and bench tests. Wang [14] used the EDEM discrete element simulation software to experimentally study the working length of the outer groove wheel, speed of the fertilizer discharge shaft and opening angle of the fertilizer discharge tongue; then, they optimized the combination of working parameters.
In this study, urea particles are used as the research object. Urea particle intrinsic parameters and their interaction characteristic parameters are measured based on basic domestic and foreign bulk material parameter measurement methods, and a discrete element simulation model of urea particles is established. The EDEM software (discrete element method) was used to simulate the urea particle accumulation process. The image processing method was used to determine the repose angle of the urea particle group. The repose angle test was used to calibrate the discrete element simulation of the interparticle friction coefficient. The reliability of the urea particle model and its simulation parameters were verified through bench tests to provide a reference for the optimization of the structure of the variable fertilizer application device.

2. Materials and Methods

The test object of this study was urea granular fertilizer containing 46.4% N produced by Shihezi Voda Agricultural Technology Co., Ltd. (Shihezi, China). with 93.6% sphericity. Urea particles are bulk materials, and the motion in the simulation test is a bulk motion process [15]. For analytical calculations using discrete element simulation software, the Hertz-Mindin no-slip contact model [16] can be used to simulate the interaction among urea particles and between the urea particles and the fertilizer discharge device because there is almost no adhesion on the fertilizer surface.

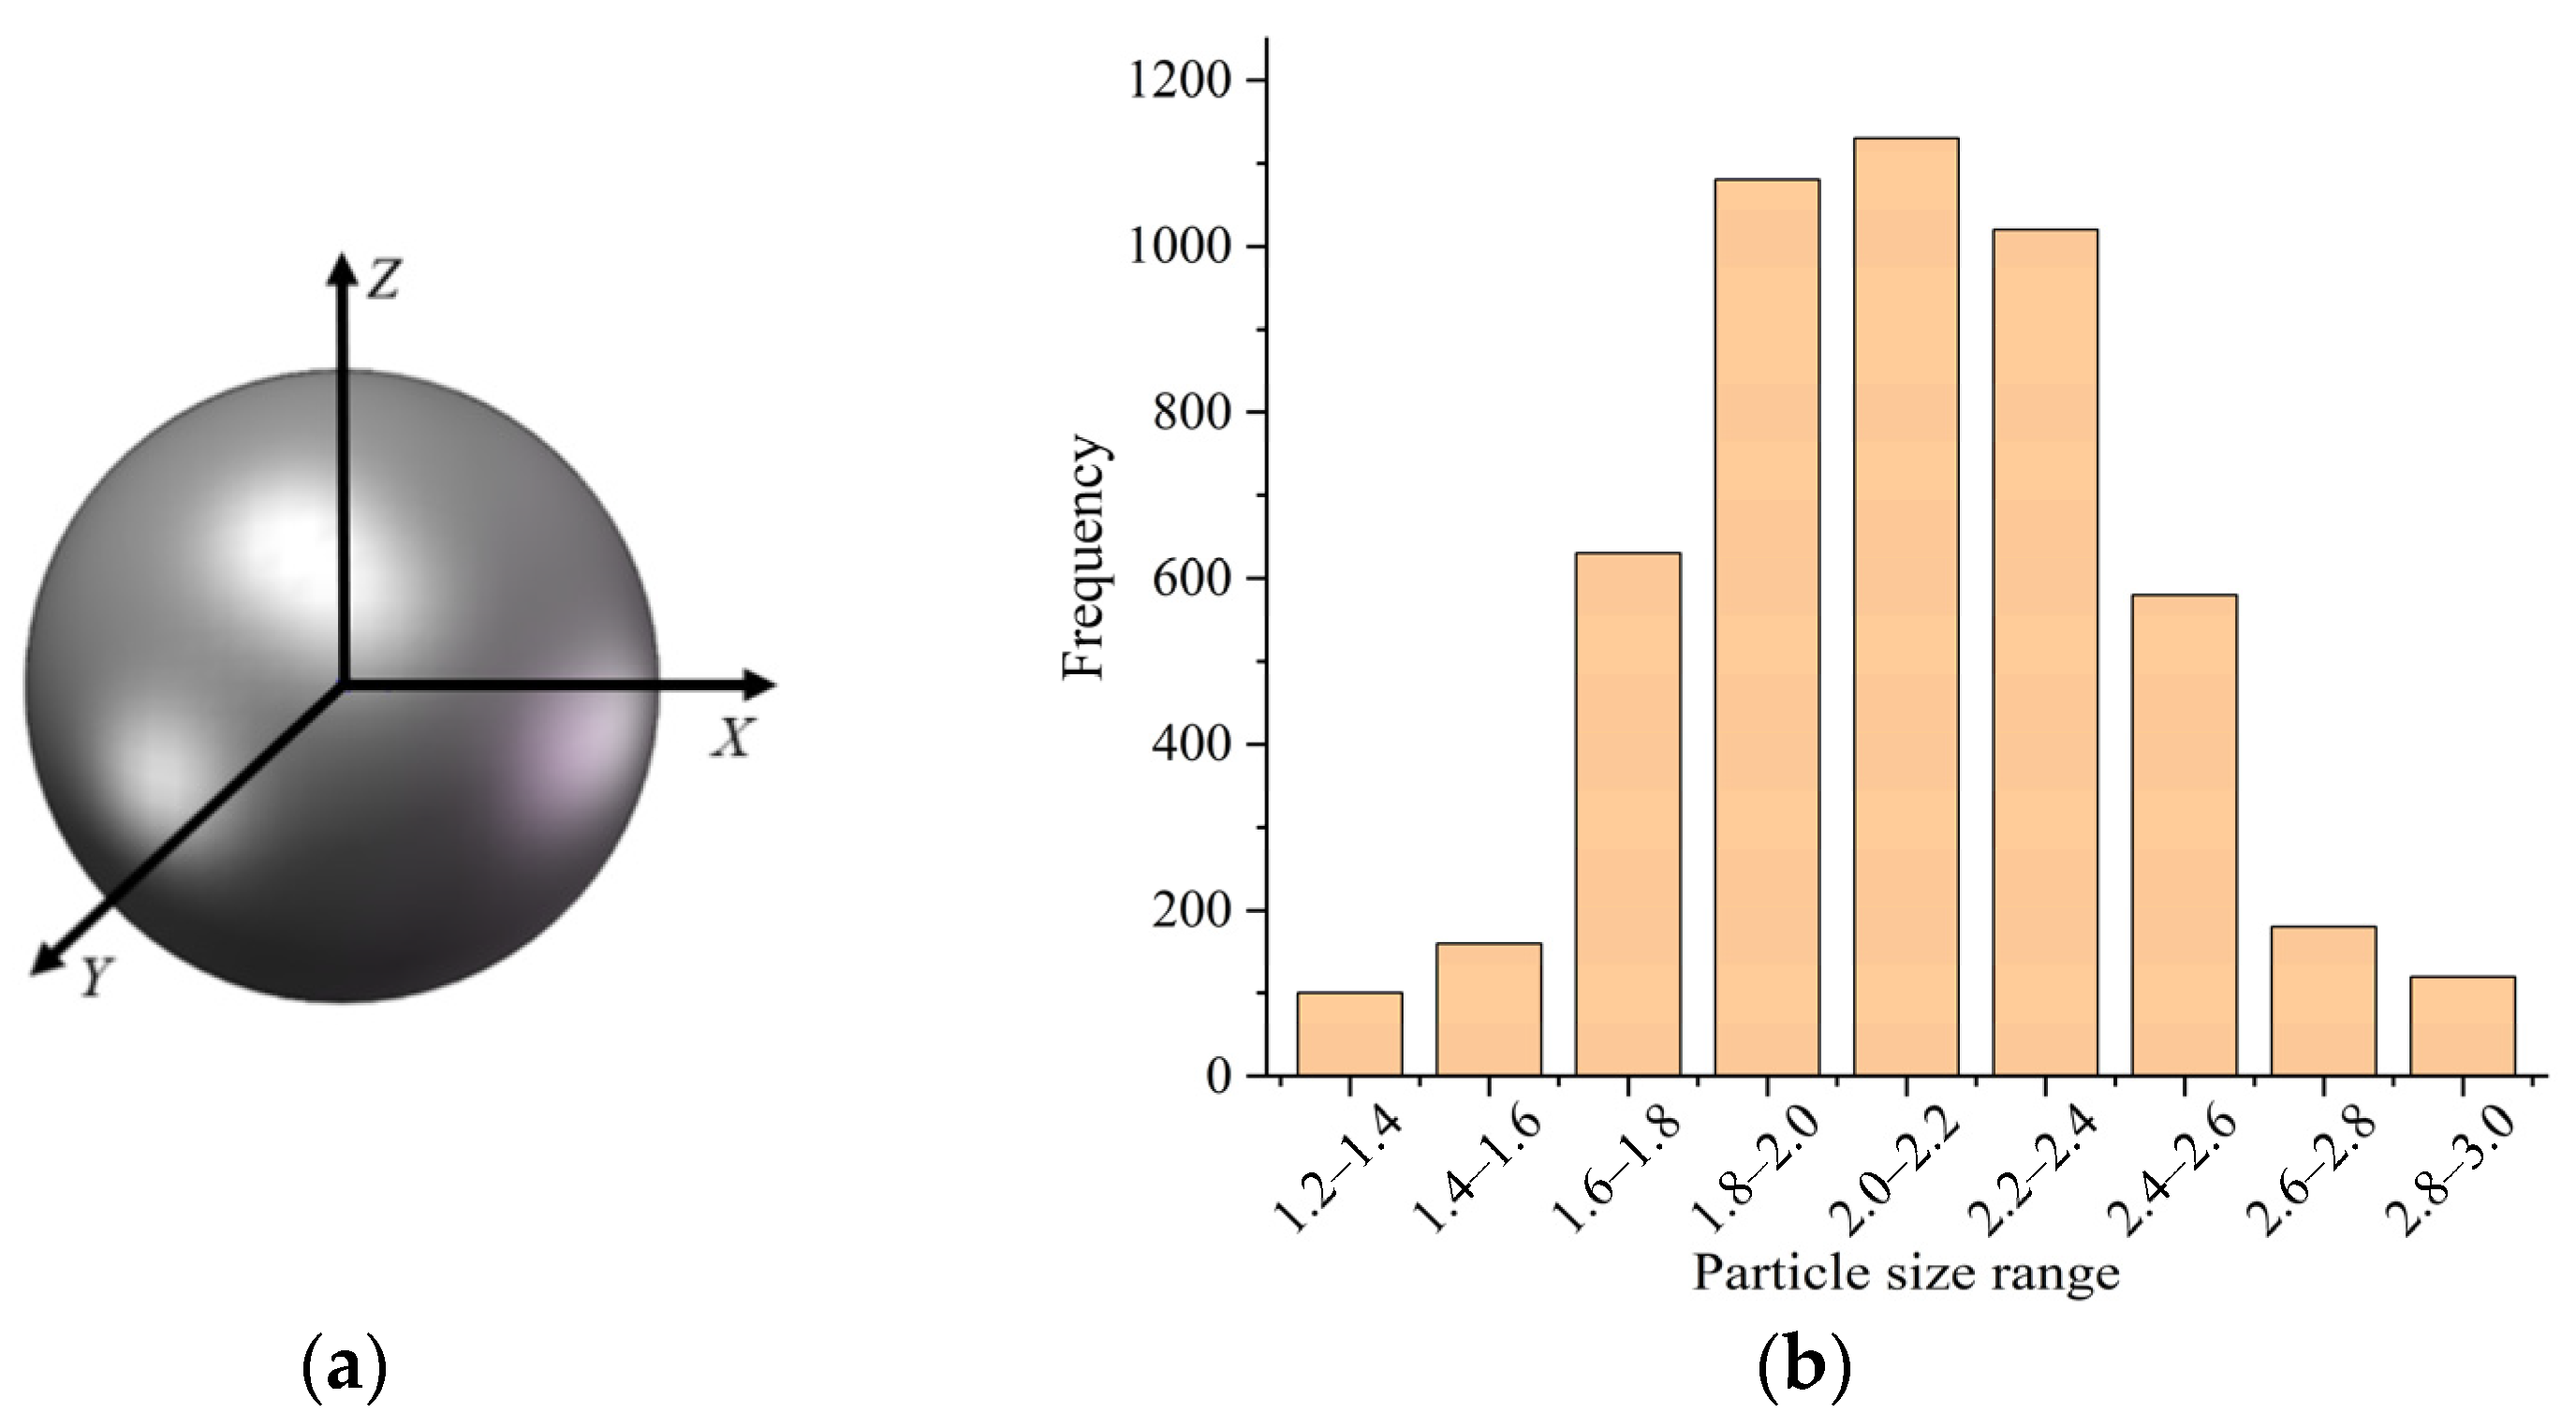
2.1. Basic Physical Properties and Geometric Model of Urea ParticlesSubsection

Randomly selected urea particles of regular shape (5000 grains) were divided into 5 groups of 1000 grains each. The mass of each group of urea particles was weighed using an electronic balance scale (accuracy 0.01 g) and averaged to obtain the thousand particle mass of fertilizer particles. Acetone reagent was selected to measure the density of each group of urea particles using the drainage method, and the moisture content of each group of urea particles was determined using the drying method. Then, the density and moisture content of the urea particles were obtained by taking the average of the data from the five tests. One group was randomly selected to measure the particle size of urea particles using a digital Vernier caliper (accuracy 0.01 mm).
We prepared a funnel, stand, 500 mL measuring cylinder and length ruler. Then, we slowly funneled each group of the above urea particles through the funnel into the measuring cylinder, measured the final resting height of the particles in the measuring cylinder and calculated the bulk density [17]. The test was repeated for 5 groups to take the average value.
The basic physical characteristic parameters of urea particles are shown in Table 1.
Since the selected urea particles are regularly shaped spherical particles, the geometric model of the urea particles is a spherical model (Figure 1a), and the size distribution properties of the model are parameterized based on the radius distribution of the urea particles in simulation tests. The particle size distribution of urea particles can be derived from the measured particle size, from which the mean and standard deviation are obtained. Figure 1b shows that the particle size distribution of urea particles is normally distributed, and its mean and standard deviation of particle size are 2.13 mm and 0.21 mm, respectively.

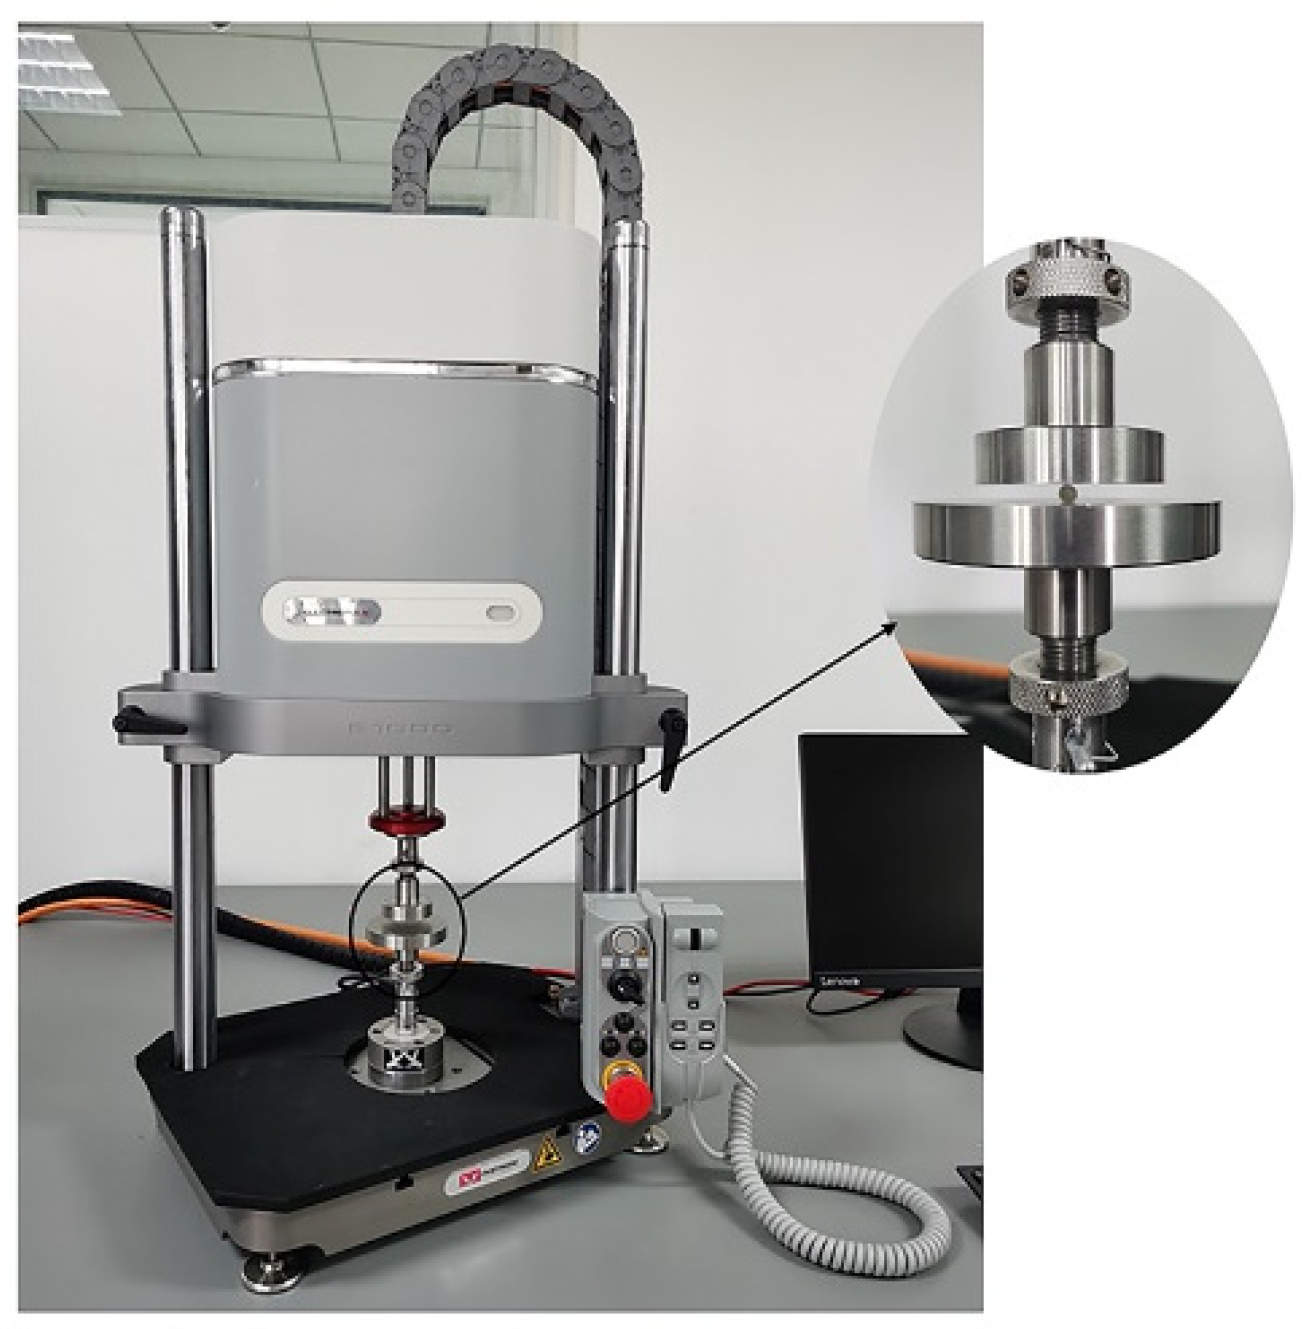
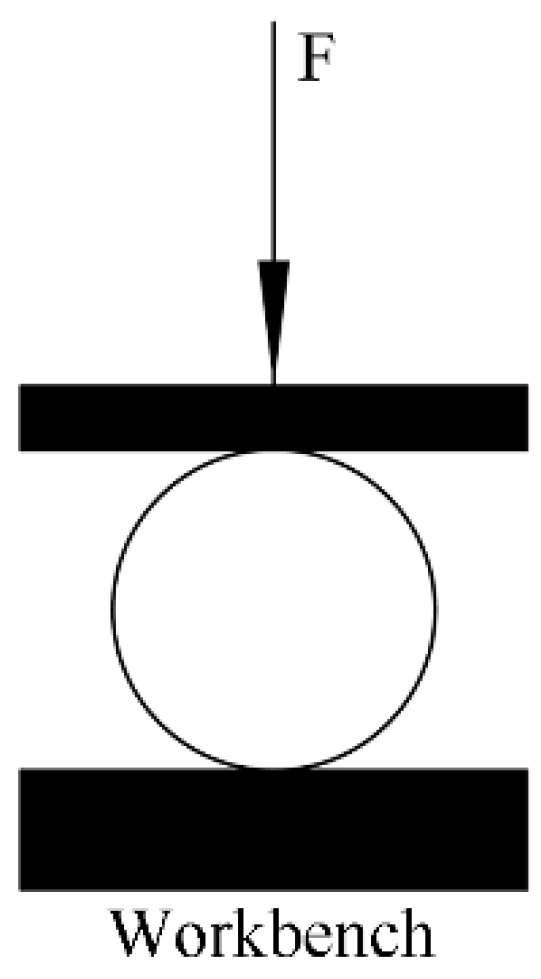
2.2. Poisson’s Ratio and Modulus of Elasticity

Poisson’s ratio and modulus of elasticity are important material property parameters, both of which can be measured and calculated using a universal material testing machine [18]. In this study, an E1000 universal material testing machine (Figure 2), manufactured by Instron, Norwood, MA, USA, was used for the compression tests.
Twenty urea particles were randomly selected, and their particle size was recorded. According to ASAE S368.4 DEC2000 (R2017) [19], for the compression test of spherical materials, the urea particles were placed on the carrier table, and the planar cylindrical indenter was slowly lowered to apply pressure to the urea particle sample (loading). When the fertilizer particle ruptured, the probe stopped moving down and slowly moved up (unloading), as shown in Figure 3. During the test, the loading speed was 5 mm/min, and the unloading speed was 30 mm/min; data collection begins when the load is greater than 1 N and stops when the load is reduced by 20%. According to the recorded pressure and deformation data, the system automatically makes the relationship curve of pressure and deformation.
Poisson’s ratio is the ratio of the absolute value of the transverse positive strain (X-axis) to the axial positive strain (Z-axis) [20,21]. The deformation variables collected by the instrument system are axial deformation variables, and the lateral deformation variables of the unloaded urea particles should also be measured with a digital Vernier caliper (DL91150, made by Deli in Ningbo, China). Then, the values are substituted into Equation (1) for calculation.
μ = | ε x ε z | = Δ L / L Δ H / H
where μ —Poisson’s ratio; ε x —transverse positive strain; ε z —axial positive strain; ∆L—urea particle transverse absolute deformation, mm; L—urea particle transverse initial size, mm; ∆H—absolute axial deformation of urea particles, mm; H—axial initial size of urea particles, mm; here, L = H, both of which are the diameter size of urea particles.
Based on the collected deformation variables and loading loads, the modulus of elasticity of urea particles can be calculated from Equations (2) and (3).
E = 0.338 F ( 1 μ 2 ) D 3 / 2 [ 2 K ( 2 R ) 1 / 3 ] 3 / 2
cos θ = ( 1 R 1 1 R 1 ) ( 1 R 1 + 1 R 1 + 1 R 2 + 1 R 2 )
where E—modulus of elasticity, MPa; F—loaded or unloaded load, N; D—deformation variable, m; µ—Poisson’s ratio; K—intermediate constant (from cos θ in ASAE S368.4 DEC2000 (R2017) standard [19] corresponding to the query, see Table 2), taken as 1.351; R—radius of curvature of the contact point between urea particles and pressure plate (in this test is the radius of urea particles), mm; in this test, R 1 = R 1 , so cos θ = 0.
After calculating Poisson’s ratio and modulus of elasticity for 20 urea particles separately and finding the average value, the Poisson’s ratio and modulus of elasticity of urea particles were obtained as 0.3 and 6.72 × 10⁷ Pa, respectively.

2.3. Restitution Coefficient

The restitution coefficient reflects the change in the motion state of the object before and after the collision. It is defined by Newton as the ratio of the normal separation velocity after the collision to the normal approach velocity before the collision [22,23]. Hlosta et al. [24] proposed a method to measure the particle–particle restitution coefficient based on a double pendulum. This method is suitable for particles with a diameter greater than 5 mm, which is very convenient and accurate. Because the diameter of urea particles is very small, the collision recovery coefficient is measured by free-falling collision in this paper. According to the kinematic principle, a restitution coefficient determination device for urea particles was designed, including a modified iron frame table, a digital display angle ruler (accuracy 0.01°), a Vernier caliper (accuracy 0.02 mm), a collision plate and a buffer box with fine sandy soil. The principle of restitution coefficient determination is shown in Figure 4.
Urea particles of uniform size were closely pasted on cardboard to form a urea particle plate. The test will be conducted with a PVC plate and urea particle plate fixed on the collision plate. Urea particles free-fall from the horizontal feeding point with the collision plate distance of H free-fall after colliding with the material on the collision plate with an inclination of 45° and parabolically move to fall into the buffer sand box. The horizontal displacement S and vertical displacement h of the urea particle movement under identical height conditions and the restitution coefficient are deduced using the kinematic formula. To reduce the measurement error and influence of individual differences of the material on the results, 30 urea particles were selected for repeated tests.
Each group of data was measured, and the average value was calculated by the following formula:
v 0 = 2 g H
{ S = v x t H = v y t + 1 2 g t 2
According to the restitution coefficient Newton defined [25,26], there are:
e = v n v 0 n = v x 2 + v y 2 cos [ 45 ° + arctan v y v x ] v 0 sin 45 °
where v0—instantaneous velocity of urea particles before collision, m/s; t—time taken for urea particles to fall to the buffer box after collision, s; vx—horizontal separation velocity of urea particles after collision, m/s; vy—vertical separation velocity of urea particles after collision, m/s; e—restitution coefficient; vn—normal separation velocity of urea particles after collision, m/s; v0n—normal velocity of urea particles before collision, m/s.
The restitution coefficients between urea particles and PVC sheets and urea particles and particles were calculated to be 0.36 and 0.27, respectively.

2.4. Friction Coefficient

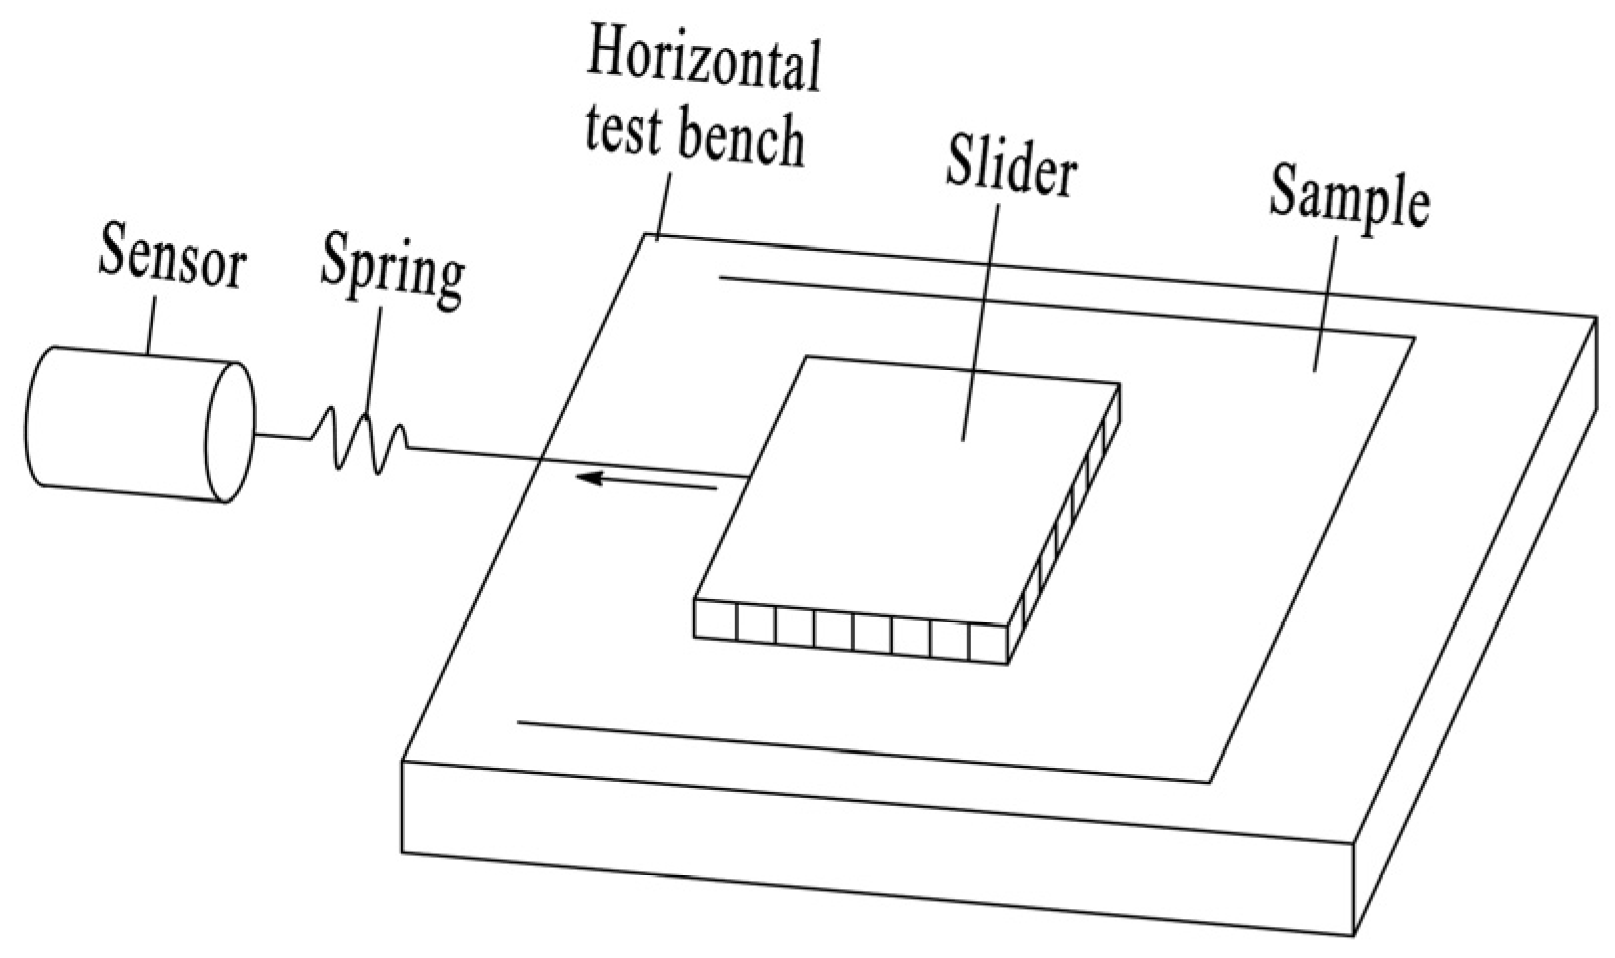
2.4.1. Static Friction Coefficient

The coefficient of static friction is an important factor that affects the repose angle of urea particles and is an important parameter in the design of fertilizer discharge devices.
In this paper, the static friction coefficients between urea particles and PVC plates and between urea particles and particles were measured using an MXS-05A friction coefficient meter (made by SUMSPRING in Jinan, China), as shown in Figure 5. The measurement principle is shown in Figure 6.
During the test, room temperature is 23 ± 2 °C. The PVC plate and urea particle plate were fixed on the horizontal test bench. Then, the urea particles were evenly and closely glued to the lower surface of the slider using adhesive glue. The stroke was set at 150 mm, the instrument was started, and the slider was slowly pulled. After the test, the instrument automatically displayed the measured static friction coefficient.
The static friction coefficients between urea particles and PVC sheets and between urea particles and particles were determined to be 0.32 and 0.24, respectively, by 10 repeated tests and taking the average value.

2.4.2. Rolling Friction Coefficient

In this study, the rolling friction coefficient was determined by the slope method [27,28]. Because of the high sphericity of the selected urea particles, it can ensure that the particles are in the rolling condition in the test. The test apparatus was a CNY-1 inclinometer (made by Jingji Testing Instrument Company in Jinan, China). The test materials were selected from PVC plates and urea particle plates.
Before the test, the test panel was horizontally placed so that the angle pointer pointed to 0°. During the test, different materials were attached to the test panel of the inclinometer. Urea particles were placed on the surface of the material to be tested. The angle between the test panel and the horizontal surface was gradually increased. When the urea particles in contact with the surface of the material just began to roll stop, we recorded the pointer that indicated angle φ and calculated the rolling friction factor of urea particles as
μ = tan φ
Ten urea particles were taken, and each particle was tested three times. The results were averaged. The average rolling friction coefficients between urea particles and PVC plates and between urea particles and particles were measured to be 0.04 and 0.06, respectively.
Because contact parameters such as the static friction coefficient and rolling friction coefficient significantly affect the repose angle [29], to obtain accurate friction coefficients, this paper subsequently uses the measured values of physical tests as the basis to select the range of values of the simulation test parameters. The repose angle is used to simulate and calibrate the friction coefficient.

2.5. Natural Repose Angle Simulation Calibration

The natural angle of repose of urea particles reflects their flow and friction characteristics [30]. Since the main working environment of urea particles in the actual fertilizer discharge process is in the fertilizer discharger and fertilizer application pipe, the materials in contact with the fertilizer in the test were selected from the same material as its PVC material for the parameter calibration test, which is convenient for providing a database for the subsequent study of the flow of simulated fertilizer in actual working conditions.

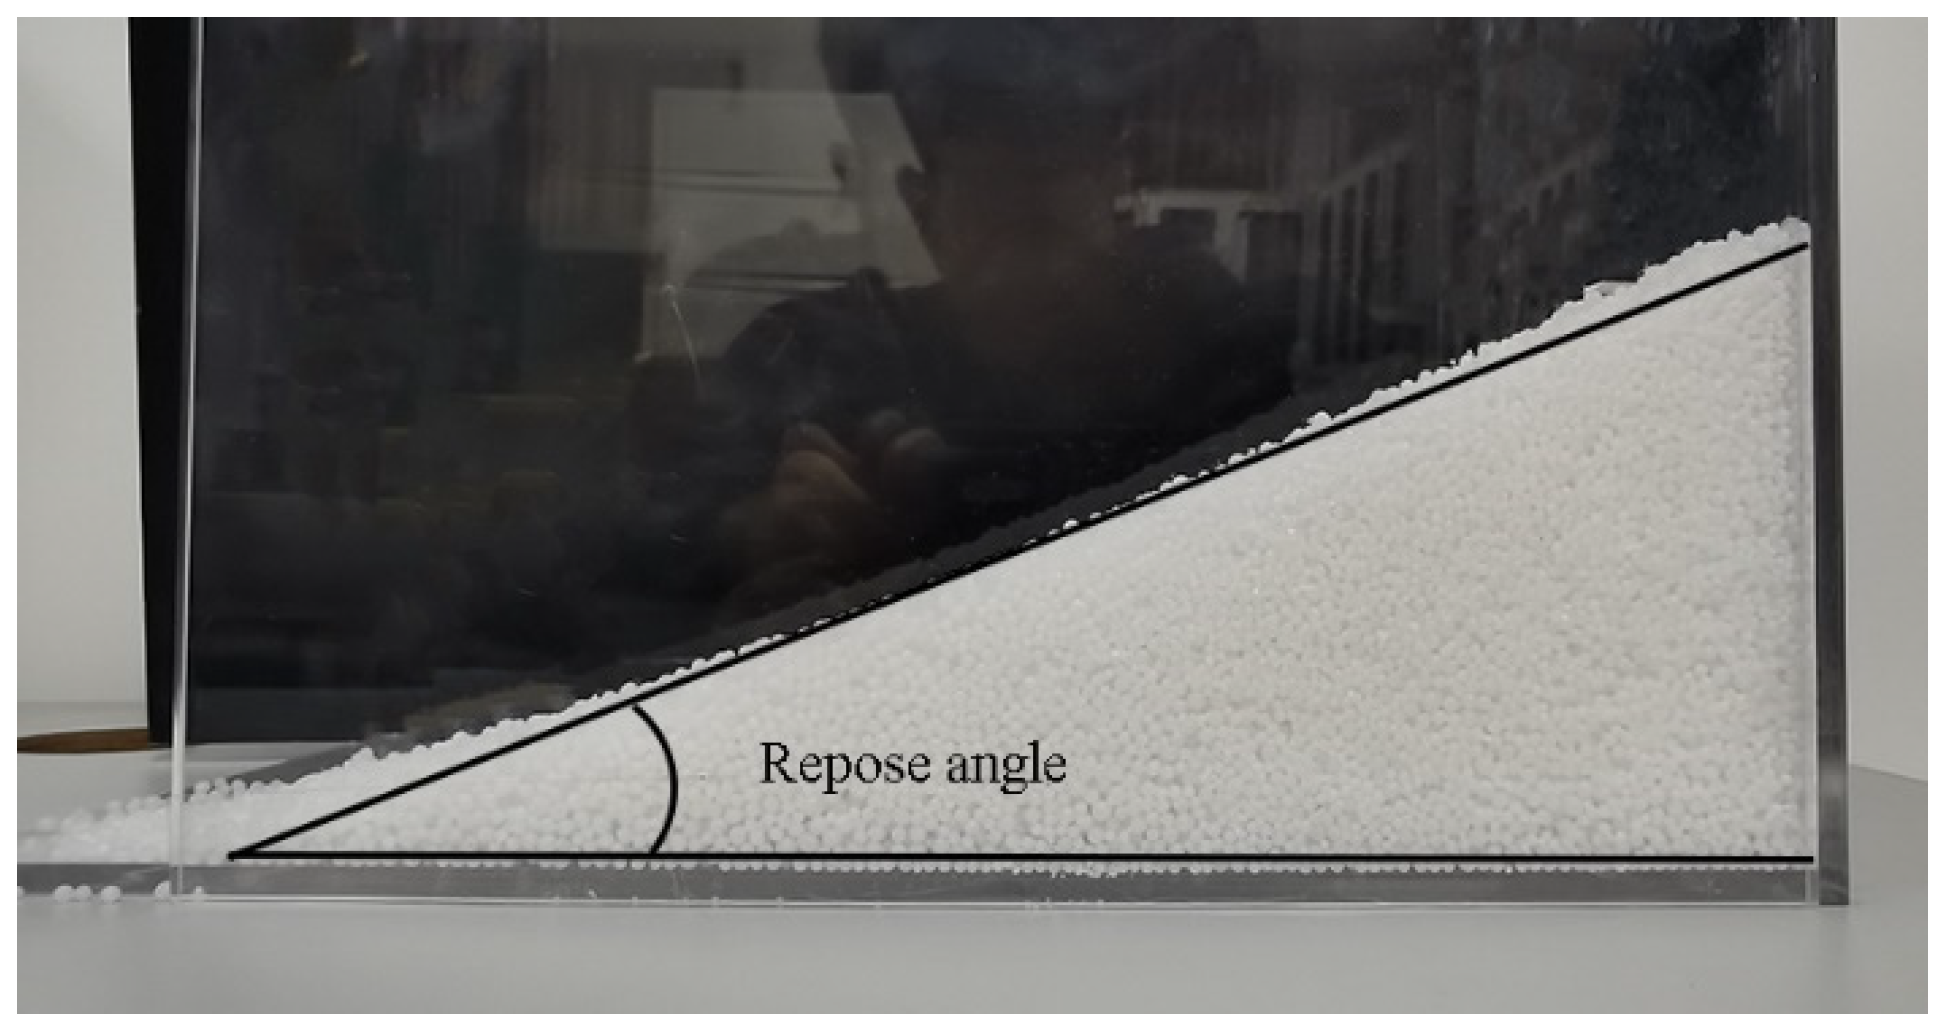
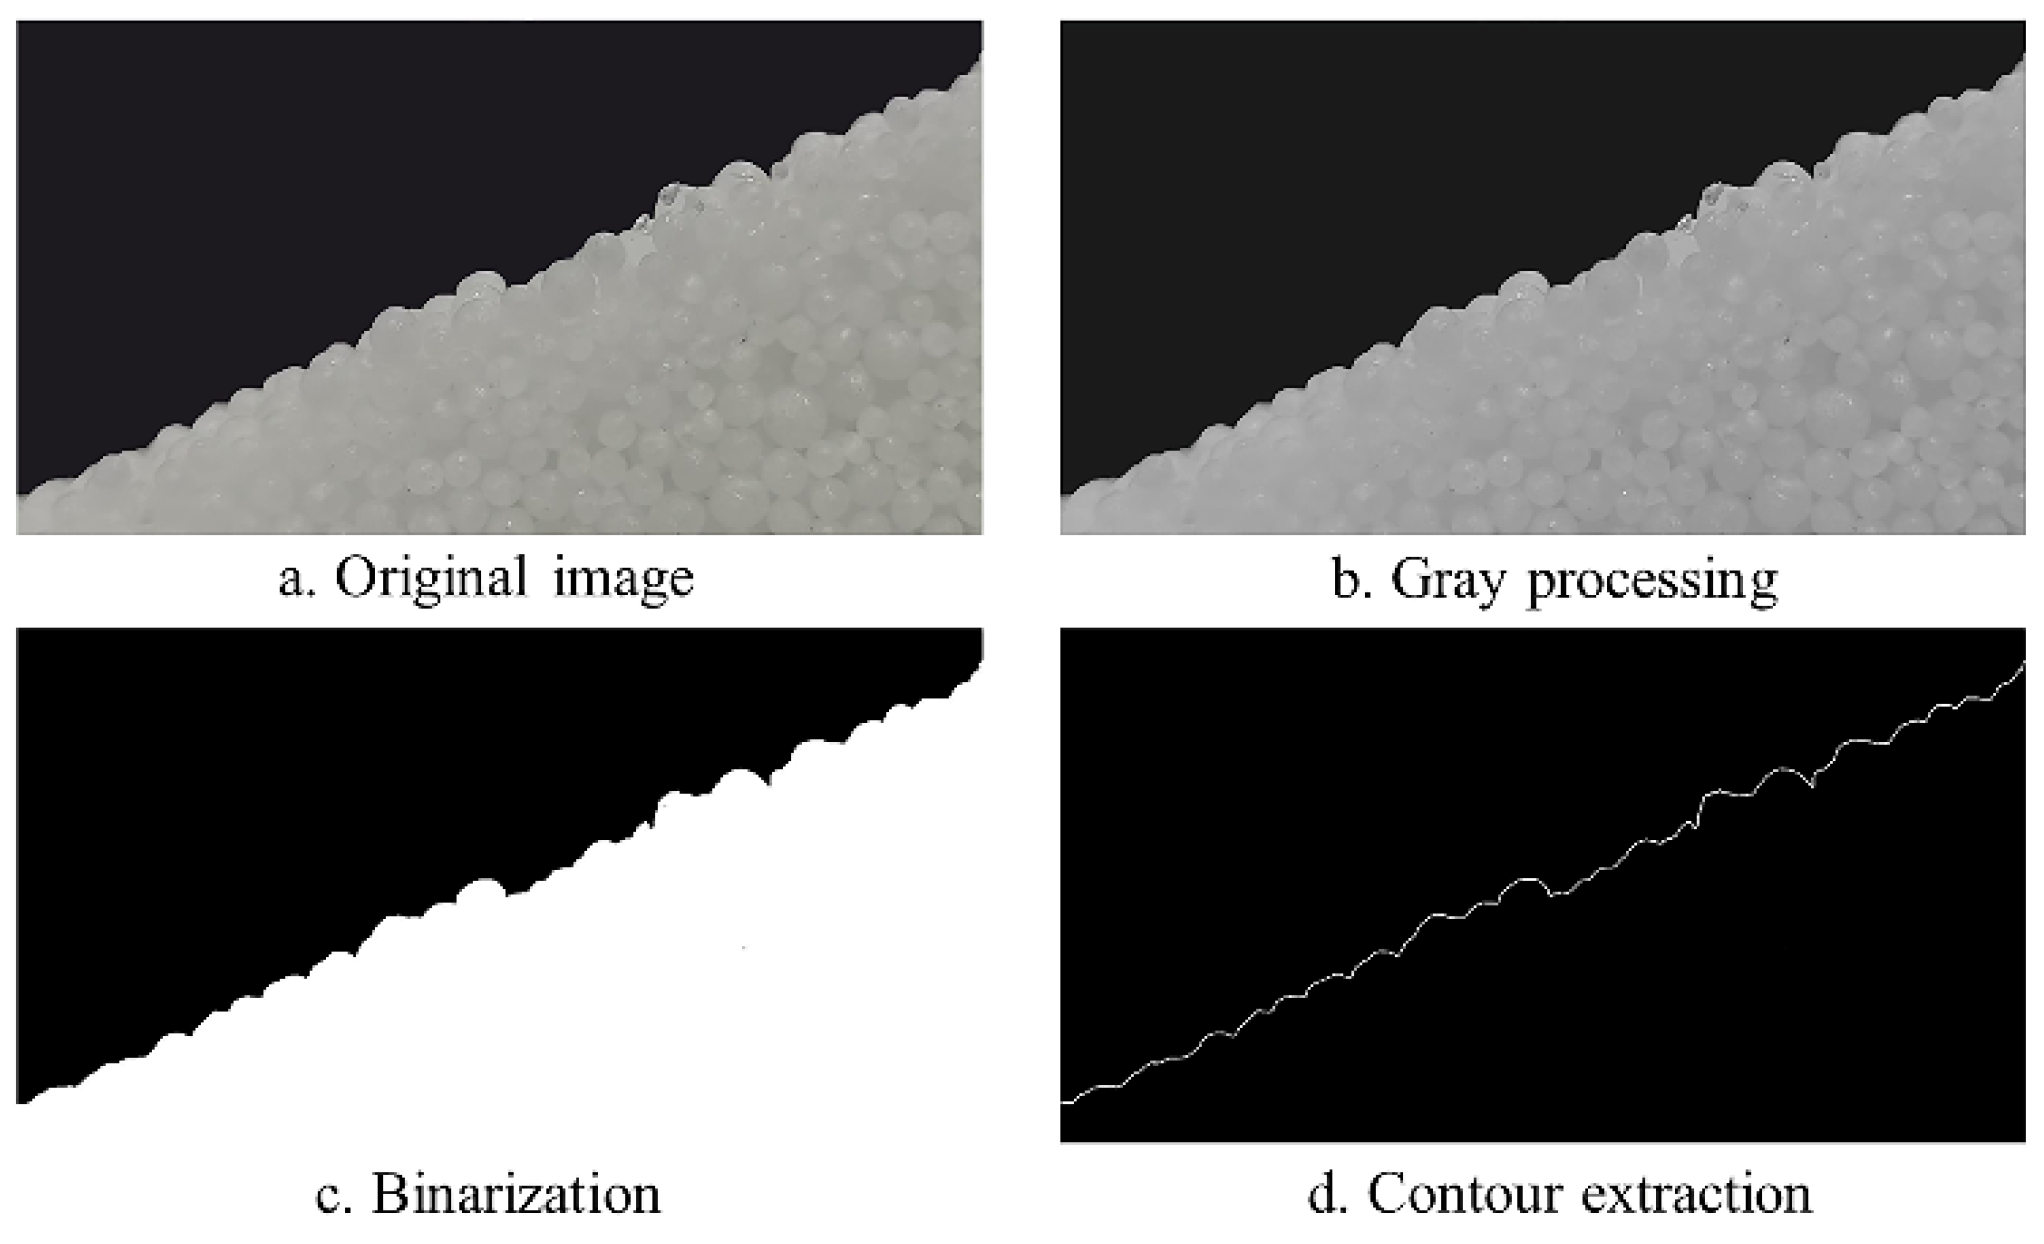
2.5.1. Physical Repose Angle Determination

In this paper, the test was performed by the draw plate method. The room temperature was 23 ± 2 °C The physical repose angle measuring device was a PVC plastic box without a cover, and the box size was 200 mm × 100 mm × 100 mm. Urea particles (0.3 kg) were placed in the measuring device, and the measuring device-side baffle could slide upward. The test slowly lifted up the baffle, and the process of urea particles under the action of gravity to the opening slid down to be stable urea particles. The urea particle’s resting-state slope angle is its natural repose angle (Figure 7). The test was repeated 10 times, and the results of each test were photographed using a digital camera for further analysis.
To reduce the measurement repose angle error, MATLAB 2018b (MathWorks, Inc. in the Natick, MA, USA) was used to read the particle stacking image, as shown in Figure 8, according to which the image was grayed out and binarized. Finally, the binarized image edge profile curve was extracted, the least-squares method was used to fit the profile curve to a straight line and the slope of the fitted straight line was the tangent of the repose angle to be measured. After calculation and analysis, the actual repose angle of urea particles was obtained as 22.94°.

2.5.2. Establishment of the Urea Particle Simulation Model and Parameter Setting

When conducting the discrete element simulation test, the urea particle simulation model was first established. The sphericity of the urea particle sample is greater than 90% by measurement and calculation, which indicates that the fertilizer particles sample responds to the overall fertilizer particles with high spherical distribution characteristics, so the spherical shape is most suitable as the 3D model of the fertilizer particle in the simulation process, as shown in Figure 9. Solidworks was used to model it in 3D and exported to the STL format file.
In this study, the urea particle simulation model was established using the spherical particle filling method [31]. The measured urea particle physical property parameters were imported into the EDEM software with a normal particle size distribution. The software automatically calculated the urea particle simulation model material properties. Simultaneously, the geometric model of the test measurement device was imported into the EDEM software. The simulation model geometric relationships were defined according to the physical repose angle test, i.e., the urea particle model filling mass, geometric model shape, and dimensions were identical to those of the physical test device. The material of the measuring device was set to PVC, and its physical properties were identical to the material parameters in the literature [32]. During the test, the box side baffle was lifted at a speed of 0.02 m/s, and the urea pellet population naturally fell to form a pile. The repose angle images were processed using MATLAB after the test.

2.5.3. Urea Particle Friction Coefficient Calibration

The simulation geometry model material was set to PVC. Other input parameters were used for the repose angle simulation test using the above experimentally measured values, which resulted in a simulated repose angle of 18.45° for urea particles. The obtained results were compared with the physical repose angle of 22.94°, and the relative error was 19.57%. The reason for this error is that the urea particles are irregularly shaped and depressed in the actual test, but the discrete element model of urea particles has a regular shape and smooth surface in the simulation process, which reduces the contact area among particles and leads to a smaller surface roughness of the urea particle simulation model. This has a more significant effect on the interparticle friction coefficient of the urea particle simulation model [33], so the interparticle friction coefficient of urea must be calibrated.
The urea interparticle static friction coefficient and rolling friction coefficient, which have the greatest effect on the repose angle, were selected as the test factors. The urea particle repose angle was the response value to perform a 2 × 3 full-factor test. Many pretests were performed to determine the simulation test levels according to the measured values of the interparticle friction coefficient in this study, as shown in Table 3. The simulation repose angle test was performed according to the test level in Table 3, and the regression equation was established to determine the optimal value.

3. Results

3.1. Repose Angle Variation Trend Analysis

The simulation test results of the static friction factor among urea particles, rolling friction factor and repose angle of urea particles are shown in Table 4.
Table 4 shows that the simulated repose angle value increases with the increase in static friction coefficient and rolling friction coefficient of urea particles. The static friction coefficient more significantly affects the repose angle than the rolling friction coefficient.

3.2. Repose Angle Regression Analysis

The mathematical model of the effect of the static friction factor and rolling friction factor between urea particles on the repose angle was obtained by fitting the simulation results to a binary regression using the MATLAB fitting toolbox Cftool [34] as:
y = 0.97 + 98.81 x 1 + 14.96 x 2 158.59 x 1 2 152 x 2 2 + 240 x 1 x 2
where y is the physical repose angle, (°); x1 is the interparticle static friction coefficient; x2 is the interparticle rolling friction coefficient. The coefficient of determination of this regression equation is R2 = 0.99, and the root mean square error is 0.12°, which indicates that the regression equation has a good fit with the actual data and good reliability. The repose angle target test value of 22.94° was substituted into the equation. The values of the interparticle static friction coefficient and rolling friction coefficient were 0.27 and 0.11, respectively, when solved.

4. Test Verification

4.1. Repose Angle Test Verification

The determined static friction coefficient of 0.27 and rolling friction coefficient of 0.11 among urea particles were simulated for the repose angle test. The images were collected at the end of the test to compare with the physical repose angle of urea particles (Figure 10). The repose angle of the simulation test was 23.12°, and the error was 0.78% compared with the physical repose angle of 22.94°. This is a significant improvement over the relative error before calibration.

4.2. Bulk Density Verification

As shown in Figure 11, using the calibrated parameters for the packing test, the height of the particle bed was 50 ± 0.3 mm and the bulk density was 794.1 kg/m3, with a relative error of 1.19% with the physical test results.

4.3. Fertilization Simulation Test and Verification

The simulation test of mechanical variable fertilizer discharger discharge performance was performed. Its relative error was calculated with the discharge volume per unit time of the fertilizer discharger bench test. The reliability of the calibrated urea particle simulation parameters was further tested.

4.3.1. Simulation Parameter Setting

In this study, a mechanical variable fertilizer discharger is used, which can improve urea particle group mobility. The main contacts with urea particles during the operation of the fertilizer discharger are the fertilizer discharger baffle plate, fertilizer discharger wheel and fertilizer discharger box. The material is mainly hard PVC. For the simulation test, to verify the accuracy of the calibration parameters, the simulation model material was kept consistent with the actual situation. The fertilizer discharger model was imported into the EDEM software. The working lengths of the fertilizer discharger were set to 25 mm, 35 mm, 45 mm and 55 mm, the rotational speed was set to 60 r/min, and the uniform rotation speed was 30 s, the mass of the urea pellet model generated was 5 kg and the simulation time was 35 s.

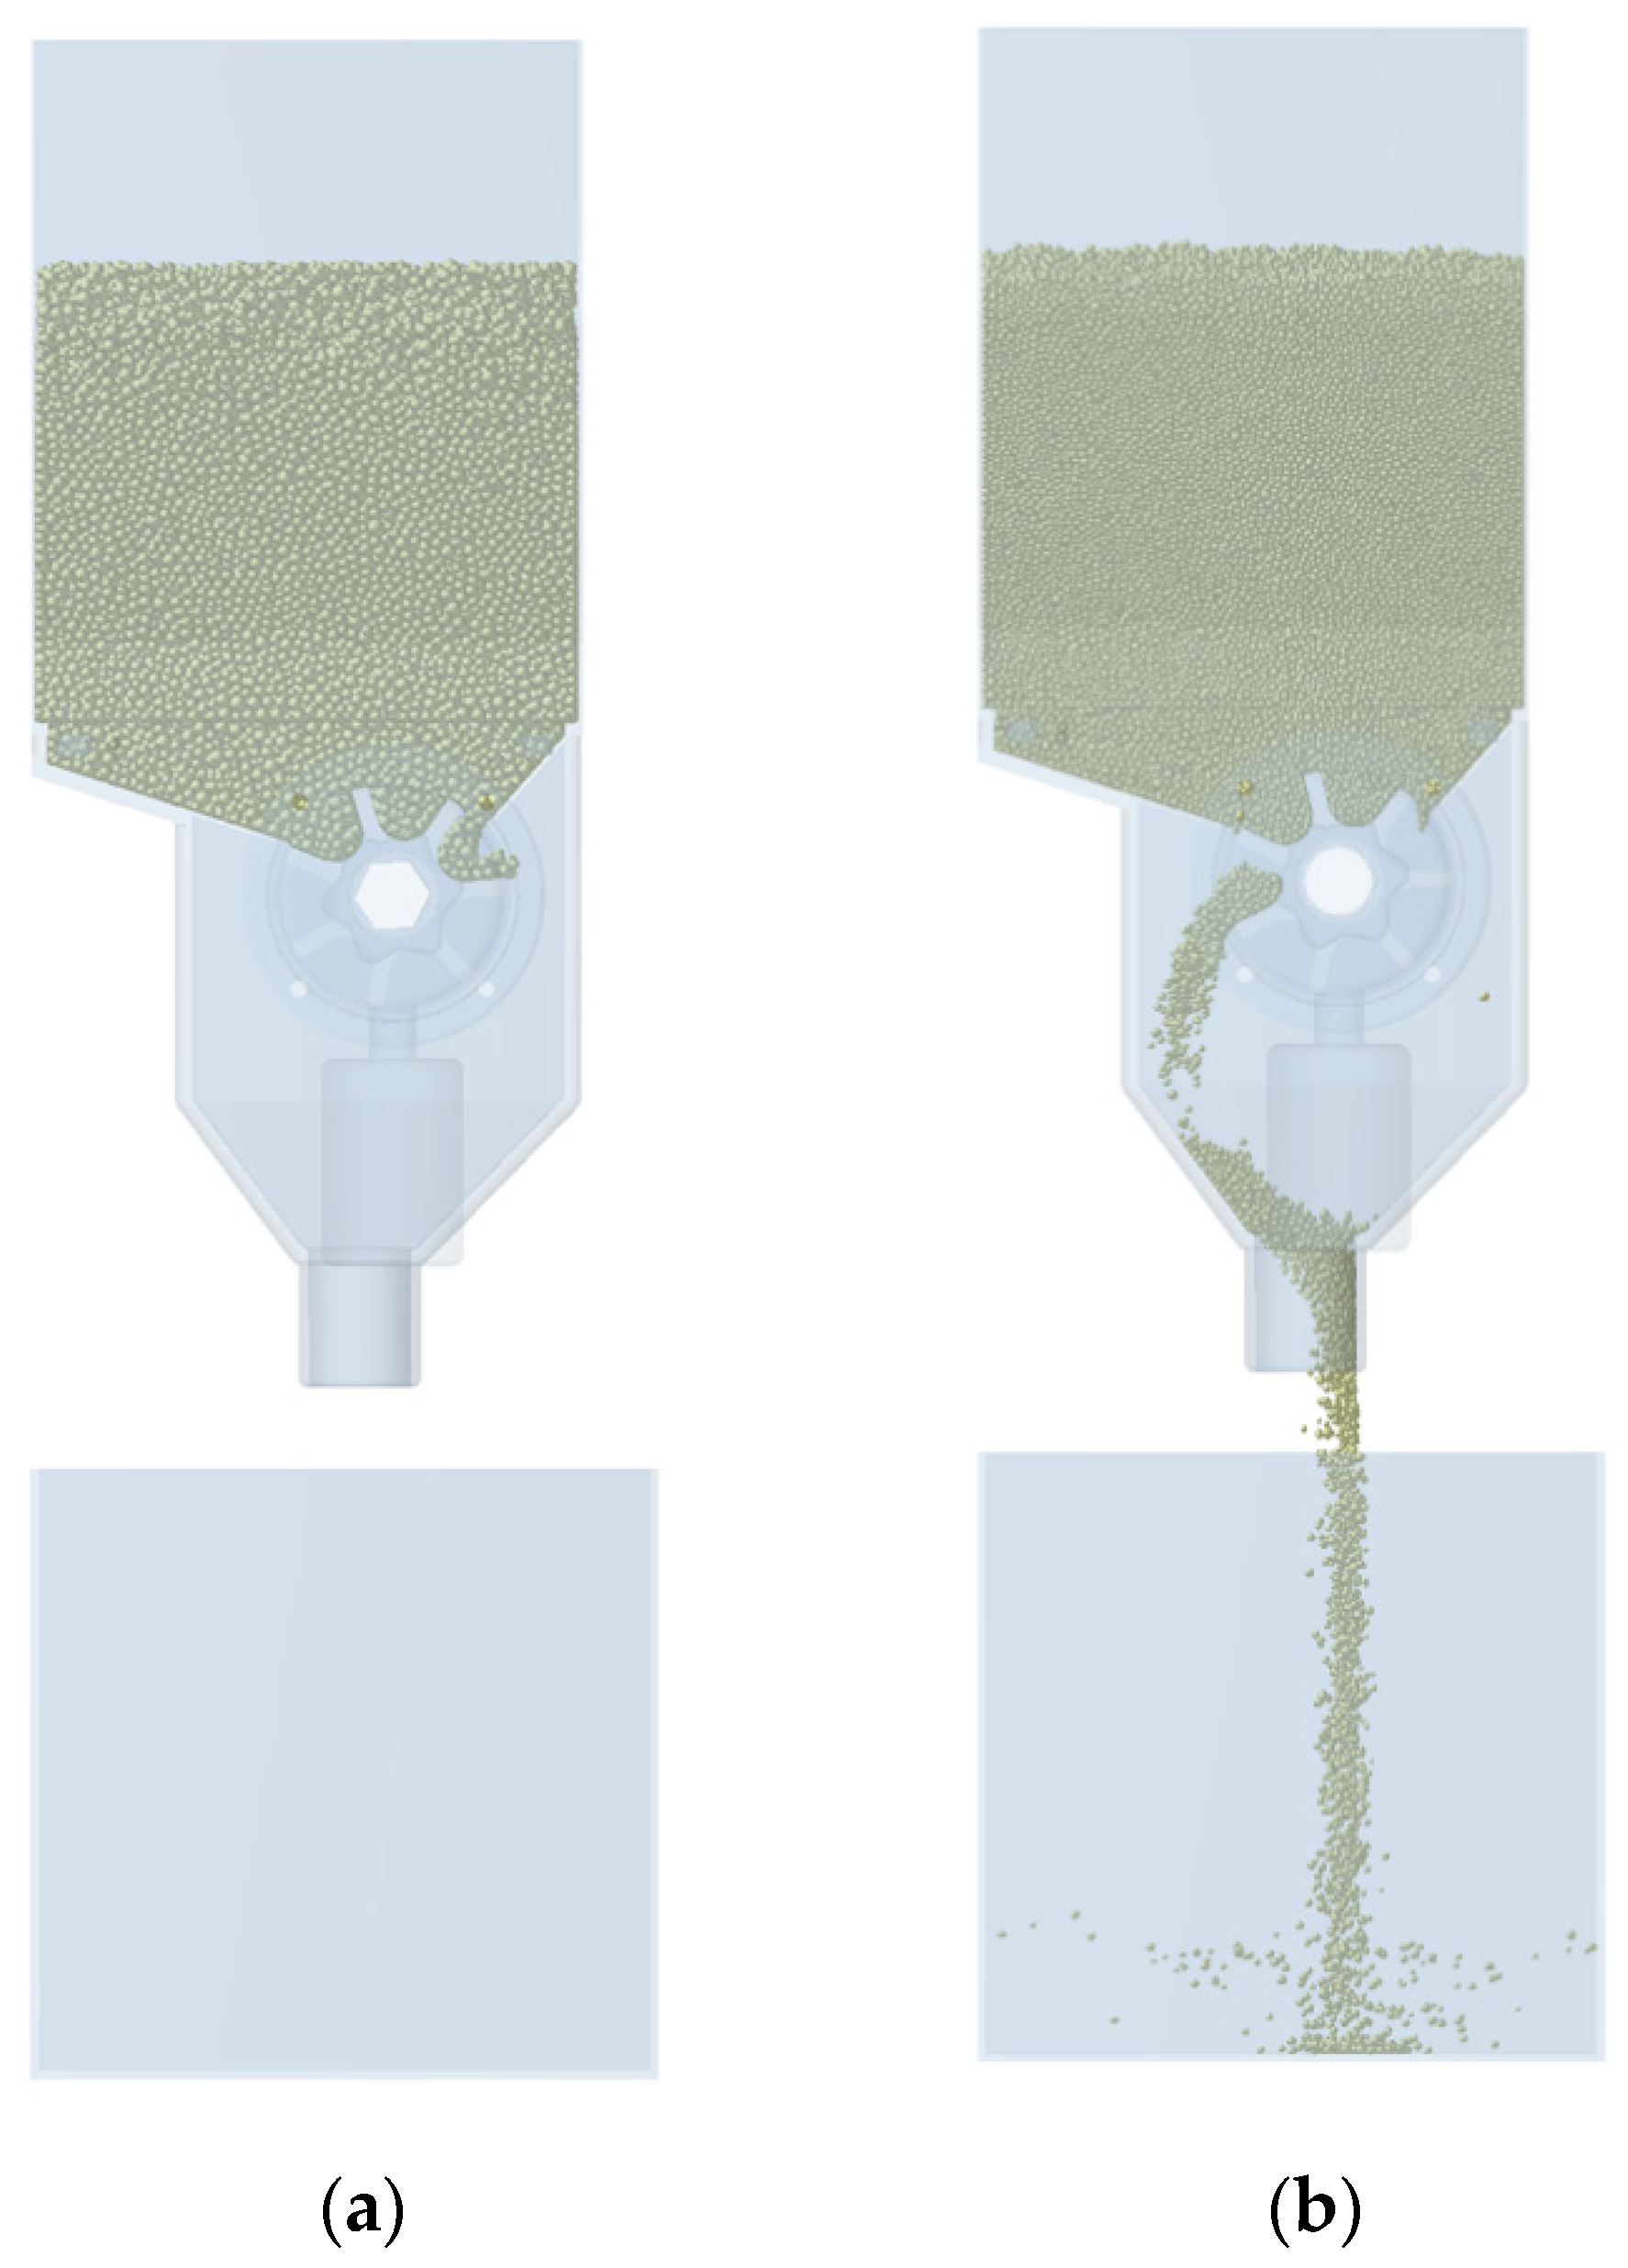
4.3.2. Model Simulation of the Fertilizer Discharge Process and Results

The simulation process of variable fertilizer discharging is shown in Figure 12. The discharging wheel rotates counterclockwise, and the urea particles enter the slot wheel under their own gravity (Figure 12a). With the rotation of the discharging wheel, the urea particles fall into the discharging box and are discharged from the discharge port (Figure 12b).

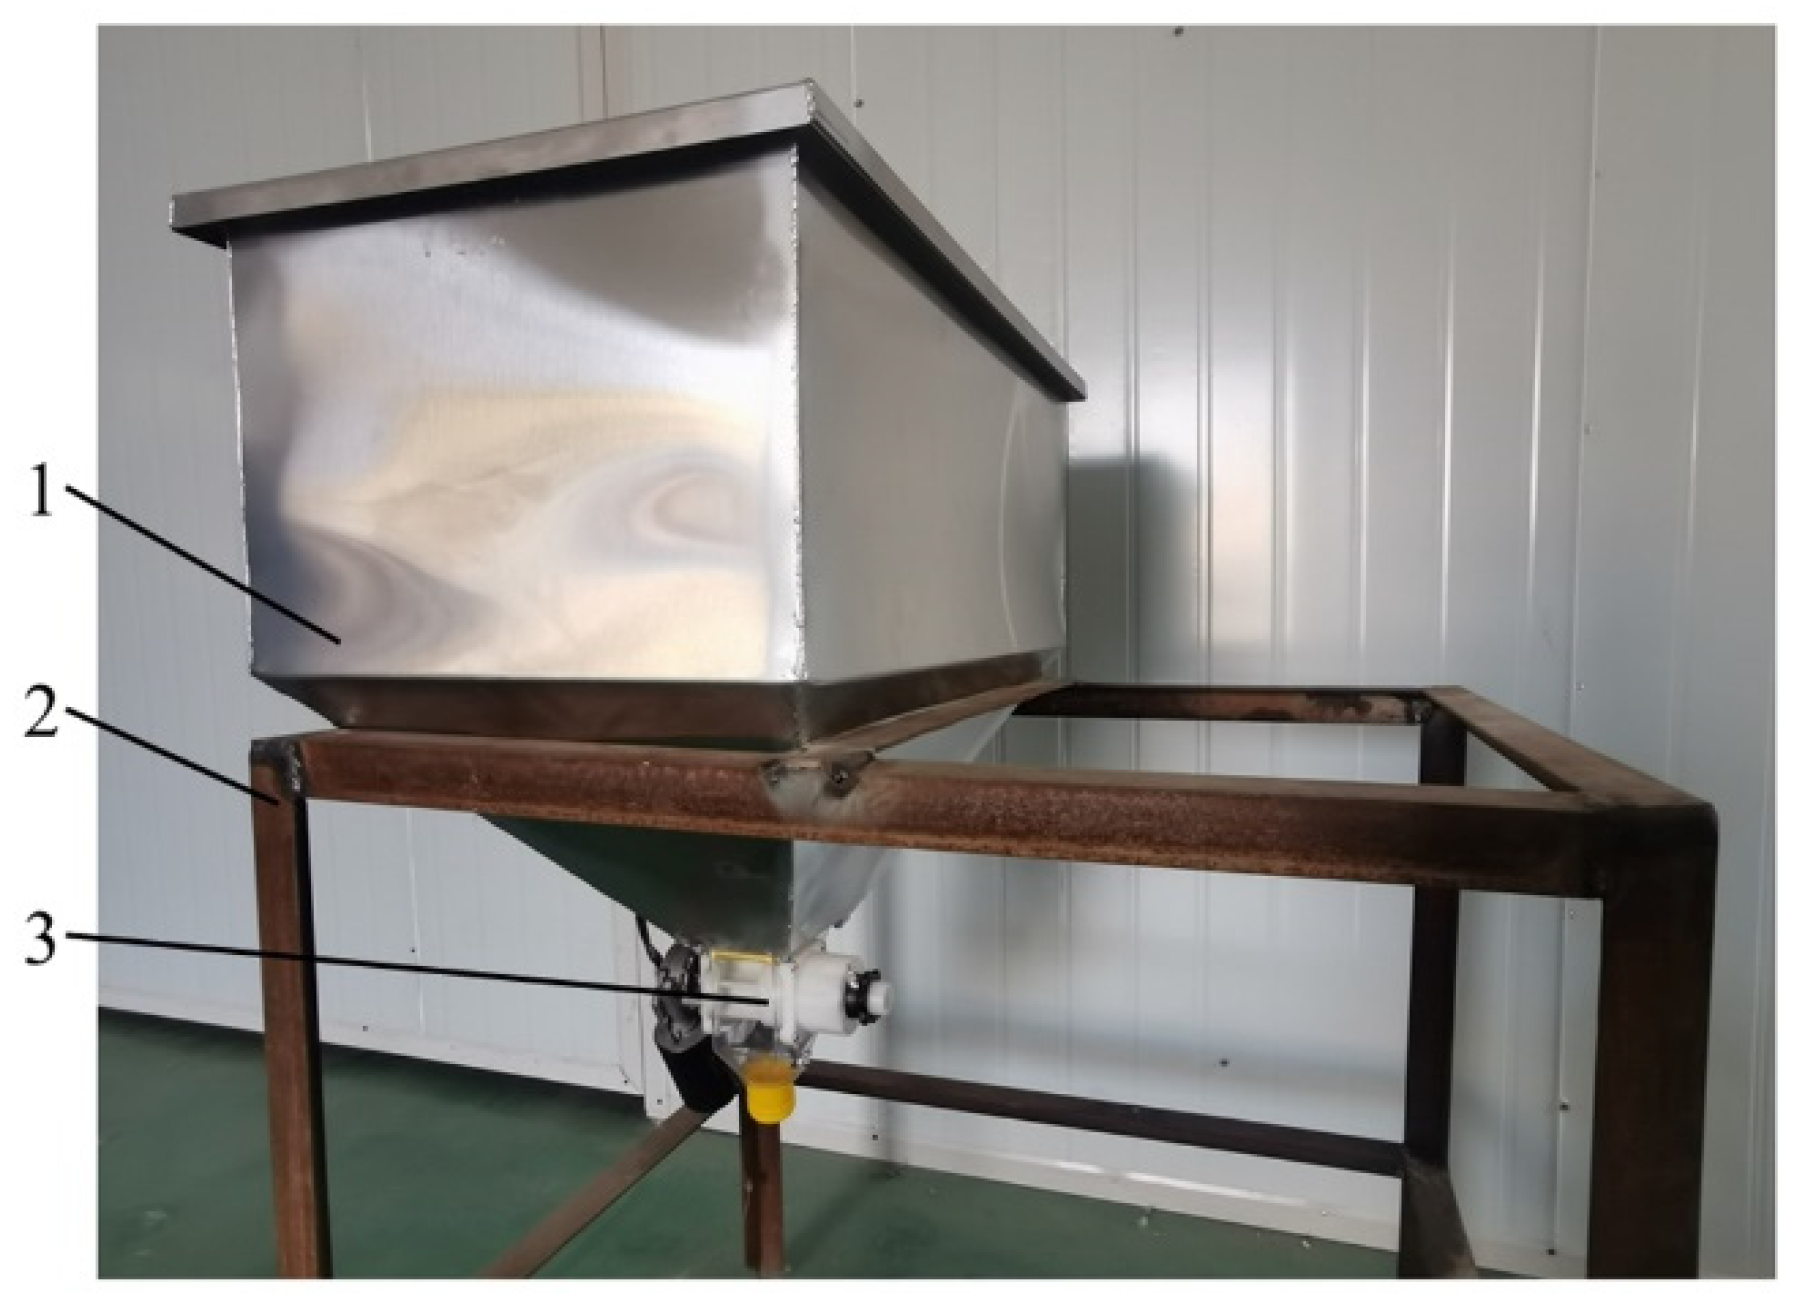
4.3.3. Bench Test Verification

As shown in Figure 13, the fertilizer discharge bench test was conducted on the assembled variable fertilizer discharger test bench in the laboratory of Shihezi University (Shihezi, China), which mainly consisted of a fertilizer tank, an electric variable fertilizer discharger and a mounting frame. The test urea samples were from the same batch as the above tests, and the test environment temperature was 25 ± 1 °C. The fertilizer discharger was an electric variable fertilizer discharger manufactured by Shihezi Voda Agricultural Science (Shihezi, China), made of PVC plastic, with a speed of 60 r/min during the test.
The test was conducted by adjusting the working length to 25 mm, 35 mm, 45 mm and 55 mm, respectively, discharging fertilizer at a uniform speed for 30 s, repeating the test three times and weighing the discharged fertilizer.

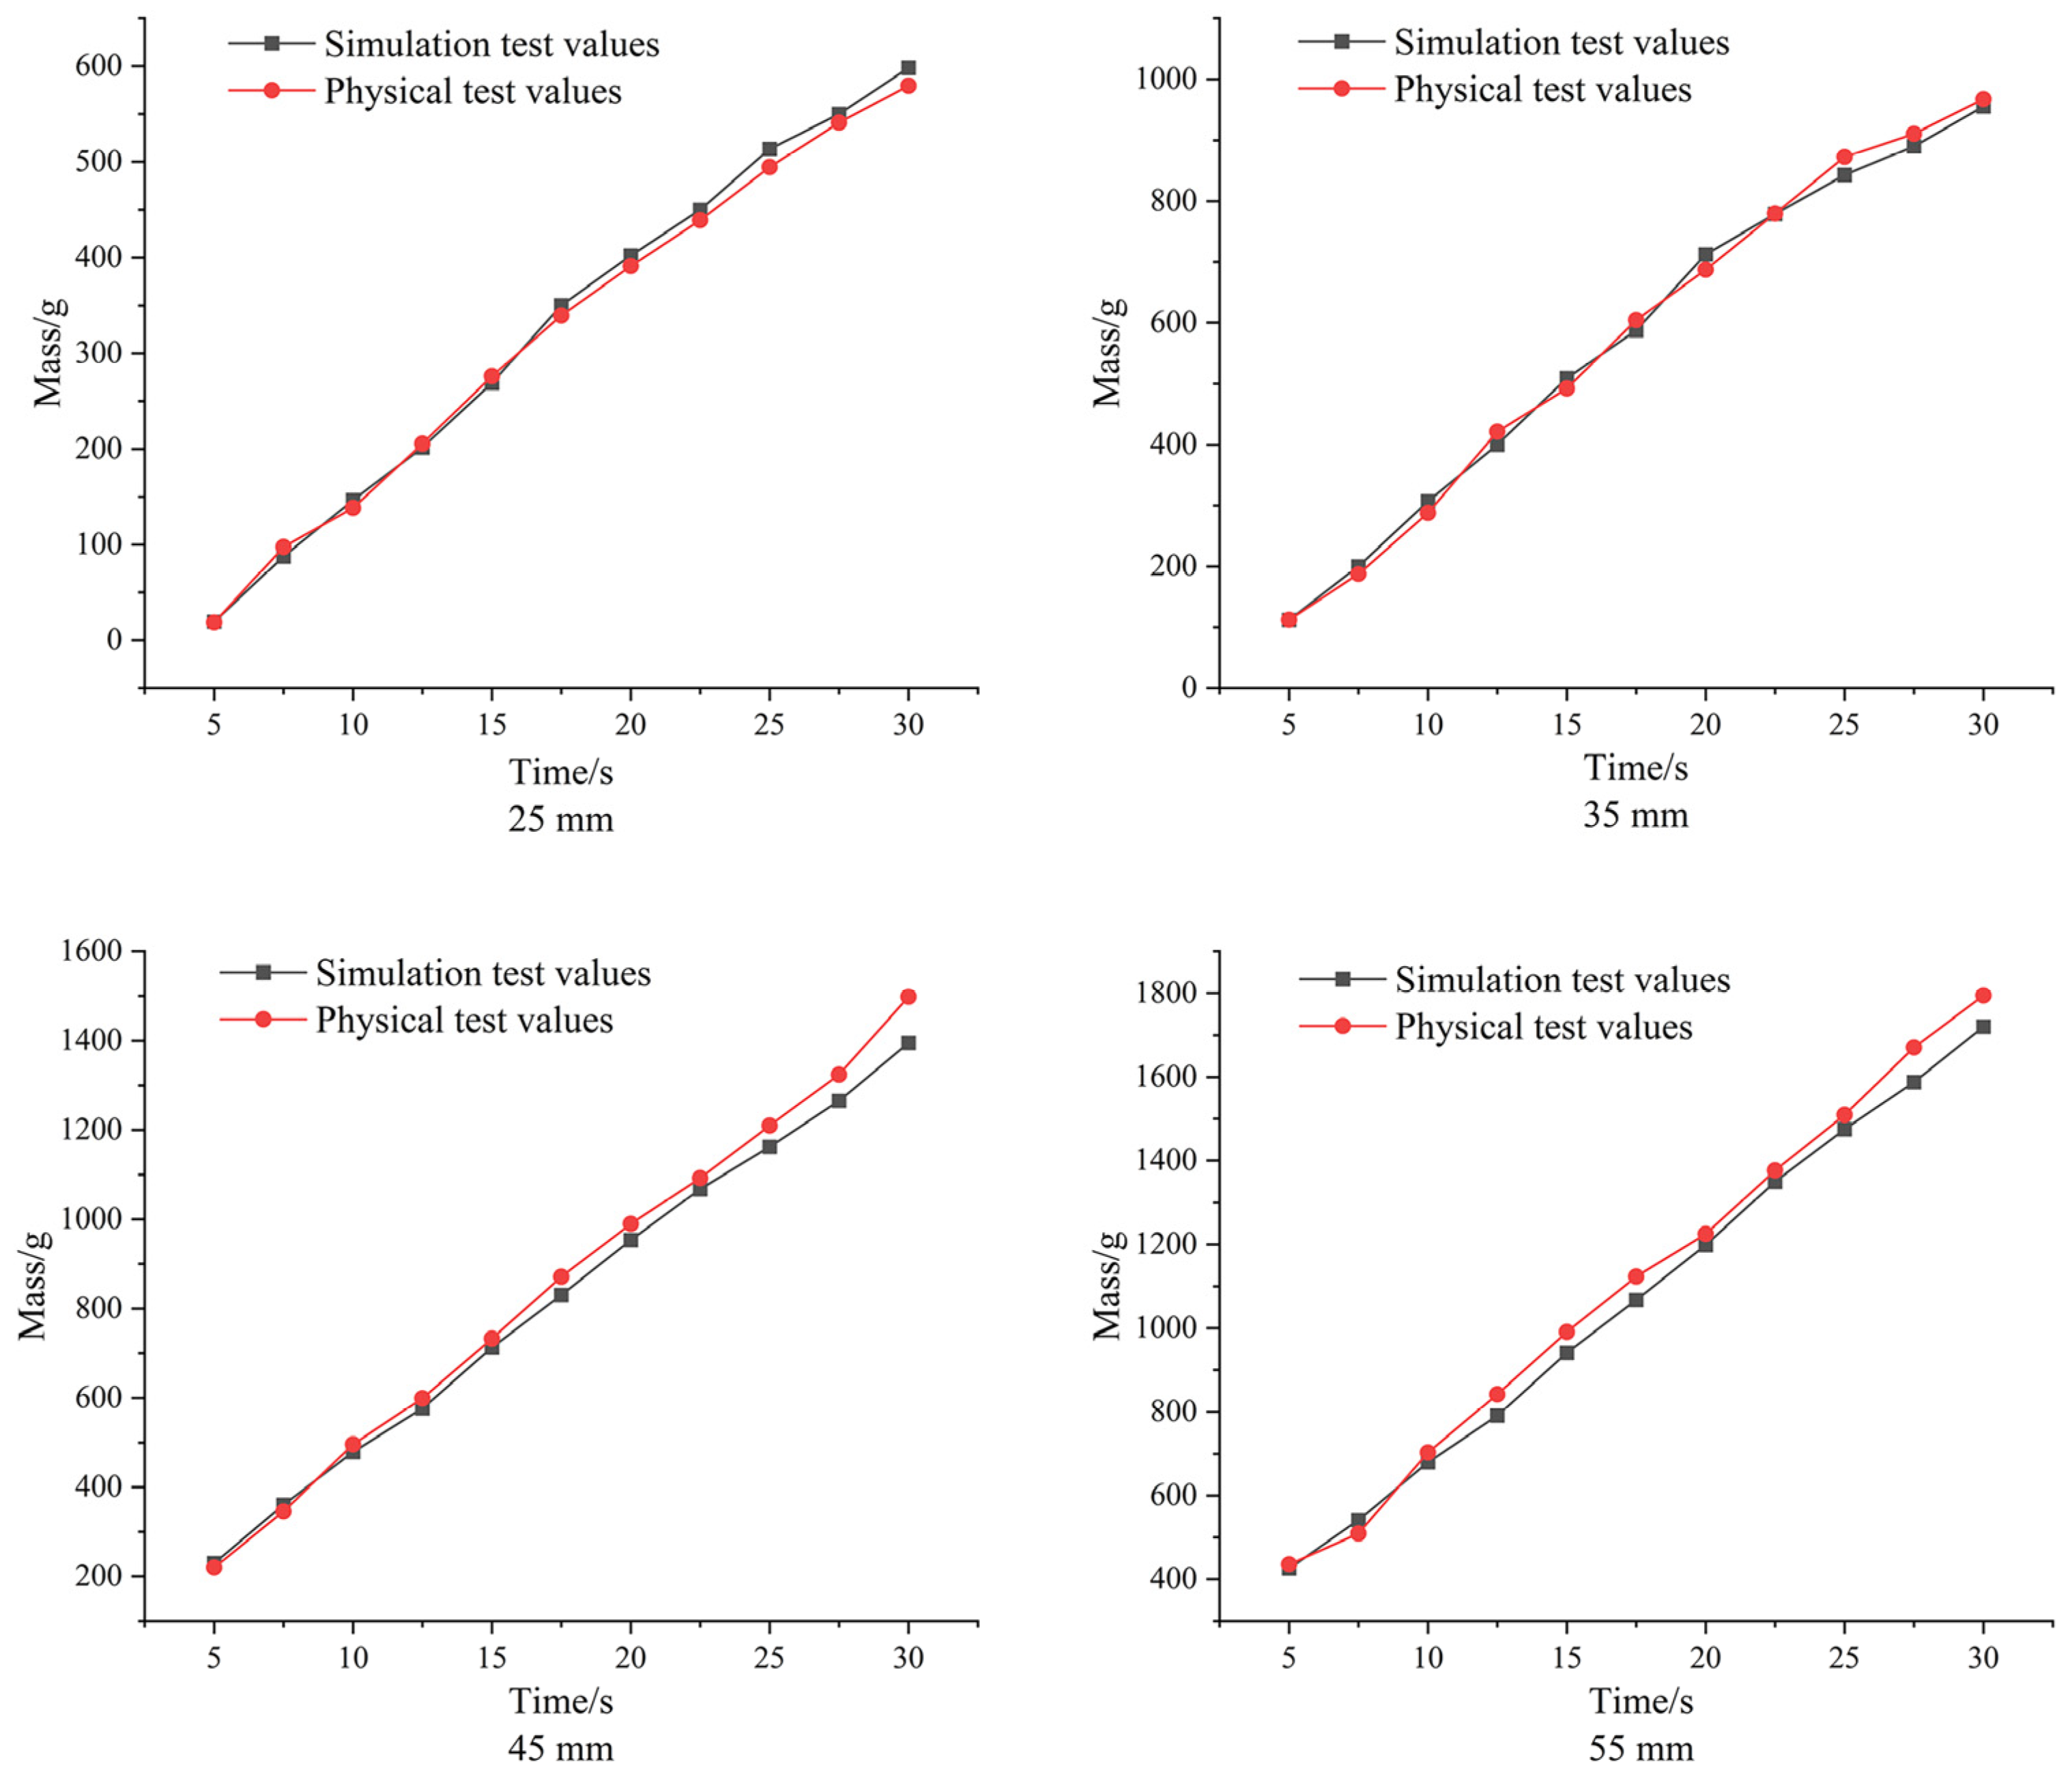
4.3.4. Test Results and Analysis

From the Figure 14, it can be seen that the maximum relative error between the simulation and physical test fertilizer discharge is 3.69% when the working length is 25 mm; the maximum relative error between the simulation and physical test fertilizer discharge is 3.39% when the working length is 35 mm; the maximum relative error between the simulation and physical test fertilizer discharge is 6.86% when the working length is 45 mm; the maximum relative error between the simulation and physical test fertilizer discharge is 4.95% when the working length is 55 mm. The maximum relative error between the simulated and physical test fertilizer discharge was 6.86% at 45 mm opening and 4.95% at 55 mm opening. The results indicate that the calibrated values of urea particle simulation parameters in this study are reliable.
The final parameters after calibration are shown in Table 5.

5. Conclusions

In this study, the basic physical parameters of urea granular fertilizer (particle size, thousand particle mass, density, modulus of elasticity and Poisson’s ratio, etc.) were measured by physical tests. The average restitution coefficient, static friction coefficient and rolling friction coefficient between urea pellets—pellets were 0.27, 0.24 and 0.06, respectively. The average restitution coefficient, static friction coefficient and rolling friction coefficient between urea pellets-PVC sheets were 0.36, 0.32 and 0.04, respectively.
The simulation parameters were calibrated based on the repose angle measured by the draw plate method and optimized by EDEM simulation software combining experimental measurements and discrete element simulation. Using the repose angle as the response value, the simulation parameters were optimized by using the response surface method and surface fitting in Origin 2021 software (OriginLab, Inc. in Northampton, MA, USA), and the second-order regression equation between the repose angle and the significant parameters was established and the optimal repose angle target value (22.94°) was added to the equation to obtain the optimal simulation parameters. The optimal combination of parameters was 0.27 for the urea particle–particle static friction coefficient and 0.11 for the urea particle–particle rolling friction coefficient.
The calibration parameters were verified using simulation analysis and physical bench tests to compare the repose angle of urea particles and the amount of fertilizer discharged. The results show that the relative error between the simulation and physical repose angle and bulk density of urea particles is 0.78% and 1.19%, respectively. The maximum relative error (6.86%) in the amount of fertilizer discharged per minute between the simulation of the variable fertilizer discharge device and the bench test was observed when the working length of the discharge slot wheel was 45 mm. Thus, the calibrated discrete element model contact parameters of urea particles are accurate and reliable.
In this study, the calibration and optimization methods of discrete element simulation parameters of urea granular fertilizer were explored, and an accurate discrete element simulation model of urea granular fertilizer was established. These results provide a theoretical basis and technical support for the design and research of subsequent variable fertilizer application devices.

Author Contributions

Conceptualization, H.B. and S.Y.; methodology, W.D.; software, H.B.; validation, H.B., S.Y. and Y.W.; investigation, Y.W.; resources, W.D.; data curation, H.B.; writing—original draft preparation, H.B.; writing—review and editing, H.B.; visualization, W.D. and S.Y.; supervision, L.Z. and Y.X. All authors have read and agreed to the published version of the manuscript.

Funding

This research was funded by the Science and Technology Bureau of Xinjiang Production and Construction Corps funded scientific and technological research projects in key areas, grant number 2020AB002.

Institutional Review Board Statement

Not applicable.

Informed Consent Statement

Not applicable.

Acknowledgments

We thank Siyao Yu, Wancheng Dong and Yuqi Wang for their practical measurement work in this physical process. At the same time, we also thank the key laboratory of Shihezi University for the experimental conditions that allowed us to successfully complete this experiment. Finally, we thank the instructor for his constructive comments on the earlier version of the manuscript.

Conflicts of Interest

The authors declare no conflict of interest.

References

  1. Zhang, L.; Yan, C.; Guo, Q.; Zhang, J.; Ruiz-Menjivar, J. The impact of agricultural chemical inputs on environment: Global evidence from informetrics analysis and visualization. Int. J. Low-Carbon Technol. 2018, 13, 338–352. [Google Scholar] [CrossRef] [Green Version]
  2. Weeks, J.J., Jr.; Hettiarachchi, G.M. A review of the latest in phosphorus fertilizer technology: Possibilities and pragmatism. J. Environ. Qual. 2019, 48, 1300–1313. [Google Scholar] [CrossRef] [PubMed] [Green Version]
  3. Wu, C.; Feng, J.; Chen, C.; Wang, J.; Liu, C.; Lin, Y.; Kang, J. Analysis of the current situation of cotton industry and mechanization development in China. China J. Agric. Chem. 2021, 42, 215–221. [Google Scholar]
  4. Bangura, K.; Gong, H.; Deng, R.; Tao, M.; Liu, C.; Cai, Y.; Liao, K.; Liu, J.; Qi, L. Simulation analysis of fertilizer discharge process using the Discrete Element Method (DEM). PLoS ONE 2020, 15, e0235872. [Google Scholar] [CrossRef]
  5. Yang, H.; Zhang, L.; Dong, W.; Fang, Y.; Hu, D.; Yang, D. Analysis and experiment of discharging device of bivariate fertilizer applicator based on discrete element method. Mech. Des. Res. 2019, 35, 179–183. [Google Scholar]
  6. Chen, H.; Zheng, J.; Lu, S.; Zeng, S.; Wei, S. Design and experiment of vertical pneumatic fertilization system with spiral Geneva mechanism. Int. J. Agric. Biol. Eng. 2021, 14, 135–144. [Google Scholar] [CrossRef]
  7. He, Y.; Li, C.; Zhao, X.; Gao, Y.; Li, S.; Wang, S. Simulation analysis of the fertilizer ejecting device of corn fertilizer applicator based on EDEM. J. Phys. Conf. Ser. 2020, 1633, 012061. [Google Scholar] [CrossRef]
  8. Ding, S.; Bai, L.; Yao, Y.; Yue, B.; Fu, Z.; Zheng, Z.; Huang, Y. Discrete element modelling (DEM) of fertilizer dual-banding with adjustable rates. Comput. Electron. Agric. 2018, 152, 32–39. [Google Scholar] [CrossRef]
  9. Dun, G.; Gao, Z.; Liu, Y.; Ji, W.; Mao, N.; Wu, X.; Liu, W. Optimization design of fertilizer apparatus owned arc gears based on discrete element method. Int. J. Agric. Biol. Eng. 2021, 14, 97–105. [Google Scholar] [CrossRef]
  10. Xue, Z.; Zhao, L.; Wang, F.; Wang, S.; Wang, G.; Pan, R. Performance simulation test of the spiral fertilizer distributor based on discrete element method. J. Hunan Agric. Univ. 2019, 45, 548–553. [Google Scholar]
  11. Sun, C.; Cao, L.; Shi, Z.; Chen, X.; Huang, S. Analysis on fertilizer performance of fertilizer machine based on discrete element method. Chin. J. Agric. Chem. 2019, 40, 44–50, 127. [Google Scholar]
  12. Dun, G.; Yu, C.; Yang, Y.; Chen, H.; Ji, W.; Ye, J. Discharging characteristic test of outer–groove wheel fertilizer and parameter optimization of fertilizer tongue by discrete element simulation. J. Hunan Agric. Univ. 2018, 44, 661–665. [Google Scholar]
  13. Cao, Y. Simulation Analysis and Experimental Research of Spiral Fertilizer Discharger Based on Discrete Element Method; Jilin Agricultural University: Changchun, China, 2017. [Google Scholar]
  14. Wang, B. Simulation and Parameter Optimization of the Working Process of External Slotted Wheel Fertilizer Discharger Based on Discrete Element Method; Northwest Agriculture and Forestry University: Xianyang, China, 2017. [Google Scholar]
  15. Zhang, H.; Li, Y.; Wang, J.; Zhang, K.; Liu, S.; Wang, Z.; Chu, G.; Quan, Z. Optimization Research of Fertilizer Guiding Mechanism Based on the Discrete Element Method. Food Nutr. Sci. Int. J. 2019, 3, 18–29. [Google Scholar]
  16. Xie, C.; Yang, J.; Wang, B.; Zhuo, P.; Li, C.; Wang, L. Parameter calibration for the discrete element simulation model of commercial organic fertilizer. Int. Agrophys. 2021, 35, 107–117. [Google Scholar] [CrossRef]
  17. Hlosta, J.; Jezerská, L.; Rozbroj, J.; Žurovec, D.; Nečas, J.; Zegzulka, J. DEM investigation of the influence of particulate properties and operating conditions on the mixing process in rotary drums: Part 1—Determination of the DEM parameters and calibration process. Processes 2020, 8, 222. [Google Scholar] [CrossRef] [Green Version]
  18. Blake, O.O.; Faulkner, D.R.; Tatham, D.J. The role of fractures, effective pressure and loading on the difference between the static and dynamic Poisson’s ratio and Young’s modulus of Westerly granite. Int. J. Rock Mech. Min. Sci. 2019, 116, 87–98. [Google Scholar] [CrossRef]
  19. American Society of Agricultural and Biological Engineers. ASAE S368.4 DEC2000 (R2017) Compression Test of Food Materials of Convex Shape; American Society of Agricultural and Biological Engineers: Michigan, MI, USA, 2017. [Google Scholar]
  20. Carrillo, J.; Ramirez, J.; Lizarazo-Marriaga, J. Modulus of elasticity and Poisson’s ratio of fiber-reinforced concrete in Colombia from ultrasonic pulse velocities. J. Build. Eng. 2019, 23, 18–26. [Google Scholar] [CrossRef]
  21. Li, T.; Chen, Y.; Hu, X.; Li, Y.; Wang, L. Exploiting negative Poisson’s ratio to design 3D-printed composites with enhanced mechanical properties. Mater. Des. 2018, 142, 247–258. [Google Scholar] [CrossRef]
  22. Dong, M.; Mei, Y.; Li, X.; Shang, Y.; Li, S. Experimental measurement of the normal coefficient of restitution of micro-particles impacting on plate surface in different humidity. Powder Technol. 2018, 335, 250–257. [Google Scholar] [CrossRef]
  23. Feng, B.; Sun, W.; Shi, L.; Sun, B.; Zhang, T.; Wu, J. Determination of restitution coefficient of potato tubers collision in harvest and analysis of its influence factors. Trans. Chin. Soc. Agric. Eng. 2017, 33, 50–57. [Google Scholar]
  24. Hlosta, J.; Žurovec, D.; Rozbroj, J.; Ramírez-Gómez, Á.; Nečas, J.; Zegzulka, J. Experimental determination of particle–particle restitution coefficient via double pen-dulum method. Chem. Eng. Res. Des. 2018, 135, 222–233. [Google Scholar] [CrossRef]
  25. Ye, Y.; Zeng, Y.; Thoeni, K.; Giacomini, A. An experimental and theoretical study of the normal coefficient of restitution for marble spheres. Rock Mech. Rock Eng. 2019, 52, 1705–1722. [Google Scholar] [CrossRef]
  26. Jiang, Z.; Du, J.; Rieck, C.; Bück, A.; Tsotsas, E. PTV experiments and DEM simulations of the coefficient of restitution for irregular particles impacting on horizontal substrates. Powder Technol. 2020, 360, 352–365. [Google Scholar] [CrossRef]
  27. Wang, L.; Li, R.; Wu, B.; Wu, Z.; Ding, Z. Determination of the coefficient of rolling friction of an irregularly shaped maize particle group using physical experiment and simulations. Particuology 2018, 38, 185–195. [Google Scholar] [CrossRef]
  28. Ciornei, M.C.; Alaci, S.; Ciornei, F.C.; Romanu, I.C. A method for the determination of the coefficient of rolling friction using cycloidal pendulum. In IOP Conference Series: Materials Science and Engineering; IOP Publishing: Bristol, UK, 2017; Volume 227, p. 012027. [Google Scholar]
  29. Shi, L.; Yang, X.; Zhao, W.; Sun, W.; Wang, G.; Sun, B. Investigation of interaction effect between static and rolling friction of corn kernels on repose formation by DEM. Int. J. Agric. Biol. Eng. 2021, 14, 238–246. [Google Scholar] [CrossRef]
  30. Ferreira, I.S.B.; Peruchi, R.S.; Fernandes, N.J.; Junior, P.R. Measurement system analysis in angle of repose of fertilizers with distinct granulometries. Measurement 2021, 170, 108681. [Google Scholar] [CrossRef]
  31. Roessler, T.; Katterfeld, A. DEM parameter calibration of cohesive bulk materials using a simple angle of repose test. Particuology 2019, 45, 105–115. [Google Scholar] [CrossRef]
  32. Wen, X.; Jia, H.; Zhang, S.; Yuan, H.; Wang, G.; Chen, T. Test of Suspension Velocity of Granular Fertilizer Based on EDEM-Fluent Coupling. J. Agric. Mach. 2020, 51, 69–77. [Google Scholar]
  33. Chen, H.; Zhao, S.; Zhou, X. DEM investigation of angle of repose for super-ellipsoidal particles. Particuology 2020, 50, 53–66. [Google Scholar] [CrossRef]
  34. Wu, M.; Cong, J.; Yan, Q.; Zhu, T.; Peng, X.; Wang, Y. Calibration and experiments for discrete element simulation parameters of peanut seed particles. J. Agric. Eng. 2020, 36, 30–38. [Google Scholar]
Figure 1. Geometric model and particle size distribution of urea particles: (a) Geometric model; (b) Particle size distribution.
Processes 10 00511 g001
Figure 2. E1000 universal material testing machine.
Processes 10 00511 g002
Figure 3. Diagram of the test compression.
Processes 10 00511 g003
Figure 4. Schematic diagram of the restitution coefficient test device and test principle. 1, Legs; 2, support rod; 3, locking screw; 4, feeding frame; 5, material particles; 6, collision plate; 7, buffer box; 8, material collection plate; 9, retractable column; 10, fixed base. Note: P—Feeding reference point; Q—Collision point; O—Particle drop point on the buffer box; H—Particle drop height before collision, mm; h—vertical height from collision point Q to particle drop point, mm; S—The average horizontal throwing distance of the particle after collision, mm; vx—The partial velocity of the particle in the horizontal direction after collision, m/s; vy—The partial velocity of the particle in the vertical direction after collision, m/s.
Processes 10 00511 g004
Figure 5. Test of the static friction coefficient of urea particles.
Processes 10 00511 g005
Figure 6. Schematic diagram of the principle of static friction coefficient test.
Processes 10 00511 g006
Figure 7. Measurement test of the repose angle.
Processes 10 00511 g007
Figure 8. Measurement of the repose angle of urea particles.
Processes 10 00511 g008
Figure 9. Urea particles and their discrete element model: (a) urea particles; (b) discrete element model for urea particles.
Processes 10 00511 g009
Figure 10. Repose angle test verification: (a) test repose angle; (b) simulated repose angle.
Processes 10 00511 g010
Figure 11. Packing test.
Processes 10 00511 g011
Figure 12. Fertilizer drainage simulation process: (a) filling process; (b) fertilization process.
Processes 10 00511 g012
Figure 13. Fertilizer discharge test bench: 1, fertilizer tank; 2, mounting frame; 3, electric fertilizer discharger.
Processes 10 00511 g013
Figure 14. Comparison of results.
Processes 10 00511 g014
Table 1. Basic physical characteristic parameters of urea particles.
ParameterValue
Particle size/mm1.2–3.0
Thousand particles quality/kg3.76 × 10−3
Density/(kg·m−3)1341
Moisture content/%0.38
Bulk density/(kg·m−3)803.7
Poisson’s ratio0.3
Modulus of elasticity/Pa6.72 × 107
Table 2. Different cos θ values corresponding to the K value (dimensionless).
θcos θC1C2K
500.64281.7540.6411.198
550.57361.6110.6781.235
600.50001.4680.7171.267
650.42261.3780.7591.293
700.34201.2840.8021.314
750.25881.2020.8461.331
800.17361.1280.8931.342
850.08721.0610.9441.349
900.01.0001.0001.351
Table 3. Experimental design.
NumberInterparticle Static Friction
Coefficient
Interparticle Rolling Friction
Coefficient
10.180.04
20.260.09
30.340.14
Table 4. Simulation test results of the repose angle.
Interparticle Static
Friction Coefficient
Interparticle Rolling
Friction Coefficient
Simulated Repose Angle (°)
0.180.0415.47
0.0917.79
0.1418.83
0.260.0419.04
0.0921.72
0.1423.48
0.340.0419.82
0.0923.46
0.1427.02
0.0419.82
Table 5. Material parameters required for simulation.
ParameterValue
Poisson’s ratio of rigid PVC0.32
Modulus of elasticity of rigid PVC (Pa)4.22 × 10⁹
Density of rigid PVC (kg·m−3)1418
Poisson’s ratio of urea particles0.3
Modulus of elasticity of urea particles (Pa)6.72 × 10⁷
Density of urea particles (kg·m−3)1341
Restitution coefficient between urea particles and PVC0.35
Static friction coefficient between urea particles and PVC0.32
Rolling friction coefficient between urea particles and PVC0.04
Restitution coefficient between urea particles and particles0.26
Static friction coefficient between urea particles and particles0.27
Rolling friction coefficient between urea particles and particles0.11
Publisher’s Note: MDPI stays neutral with regard to jurisdictional claims in published maps and institutional affiliations.

