Abstract
This paper exploits, through modeling and optimization, the experimental laboratory data on the biosorption of heavy metal ions Pb(II), Cd(II), and Zn(II) from aqueous media using soybean and soybean waste biomasses. The biosorption modeling was performed using the Response Surface Methodology, followed by optimization based on numerical methods. The aim of the modeling was to establish the most probable mathematical relationship between the dependent variables (the biosorption efficiency of the biosorbents when adsorbing metal ions, R(%), and the biosorption capacity of sorbents, q(mg/g)) and the process parameters (pH; sorbent dose, DS (g/L); initial metal ion concentration in solution, c0 (mg/L); contact time, tc (min); temperature, T (°C)), validated by methodologies specific to the multiple regression analysis. Afterward, sets of solutions were obtained through optimization that correlate various values of the process parameters to maximize the objective function. These solutions also confirmed the performance of soybean waste biomass in the removal of heavy metal ions from polluted aqueous effluents. The results were validated experimentally.
1. Introduction
Environmental quality has deteriorated, mainly as a consequence of the diversification of anthropogenic activities, population growth, unplanned urbanization, rapid industrialization, and the irrational exploitation of resources. That is why, in recent decades, efforts to improve some innovative and ground-breaking processes have been intensified so as to make it possible to eliminate the pollutants from the environment with increased efficiencies. These processes should be capable of removing pollutants from the environment and, at the same time, protect human health by combining the two major challenges, resource consumption and pollution, by harnessing natural resources and, in particular, waste, and by using waste to improve the quality of the environment by decontaminating its components [1,2,3].
In parallel with environmental pollution, our current patterns of resource use, production, consumption, and prevention of waste generation and pollution are unsustainable. The Earth has finite resources, and the extensive use of these resources increases the pressure on the natural environment, resulting in global warming, pollution, and the degradation of ecosystems and biodiversity. Natural resources are fundamental to any economy and for ensuring human prosperity. They provide raw materials, energy, food, water, and soil, as well as environmental and social services. Therefore, humanity is faced with two challenges: ensuring the sustainable consumption of natural resources and preventing the pollution of the environment [4,5,6].
The increased awareness of the link between generating environmental impacts (with short-, medium-, and long-term consequences) and current environmental strategies has led the scientific community to focus on developing sound, economically viable, and environmentally friendly processes. This requires stepping up efforts to integrate pollution prevention and control and the application of the principles of the circular economy. One of the appropriate ways to achieve these requirements for ensuring sustainability involves the use of waste in the depollution of some environmental components [7,8,9].
The harmful effects of organic and inorganic pollutants on ecosystems and on human health are well known, which is why sustained efforts are being made to develop treating methods to prevent or limit pollution. Heavy metal pollution is one of the most important environmental problems today [10,11,12,13]. Various fields of activity, such as mining and steel, the metallurgical industry, the metal surface finishing industry, energy and fuel production, the fertilizer and pesticide industry, galvanizing, electrolysis, electro-osmosis, leather processing, the photographic industry, the electrical equipment industry and electronics, metal surface treatment, aerospace industry, etc., produce and discharge into the environment various industrial wastes and effluents containing heavy metals. Thus, metals, although usually regarded as resources, also become important pollutants of the environment, endangering the health of humans and the ecosystem [14,15]. The intensification of the use of metals and their various chemical compounds in industrial processes has the consequence of generating large amounts of effluents containing high levels of toxic metals. The presence of heavy metals in these effluents can induce major environmental impacts and risks, mainly due to the toxicity of most heavy metals and their persistence in the environment [16,17]. Environmental and management specialists and decision makers are faced with a constant challenge associated with the research and development of advanced but inexpensive technologies for the removal of heavy metals from industrial and municipal effluents.
The range of conventional methods for removing heavy metals from aqueous solutions may include techniques such as [18,19,20,21,22,23]: chemical precipitation, oxidation or chemical reduction, ion exchange, filtering, membrane techniques, etc. The literature considers that processes based on these techniques are usually expensive and inefficient, especially for solutions containing ions with concentrations between 1 and 100 mg/L [24,25,26]. Another major disadvantage of conventional techniques for removing metals from industrial effluents is associated with the production of toxic chemical sludge, the treatment and storage of which involves a number of additional costs and major environmental impacts.
Adsorption is considered to be a feasible alternative for drinking and industrial water treatment and wastewater treatment because it is usually a suitable operation that is easy to apply, and the design of adsorption systems is relatively simple, although the costs are relatively high [27,28,29,30]. The properties of adsorbates and adsorbents (solids) are relatively specific and depend on the components in their structure. The interaction between the solid surface and the adsorbed molecules can be of physical (physisorption) or chemical (chemisorption) in nature. Activated carbon is currently considered to be the most commonly used and most effective adsorbent for the removal of various pollutants from water, such as dyes and heavy metals, although there are some issues related to the regenerative capacity of the adsorbent or its elimination at the end of its life, based on different disposal strategies other than storage [31,32,33]. In addition to activated carbon, a wide variety of approved adsorbents to date have been examined for both low-cost (low-cost sorbents) and their ability to remove various types of pollutants from liquid effluents. The general trend is to replace activated carbon—which is the so-called state of the art—with natural materials or waste/by-products from various fields of activity, such as agriculture and industry. Based on literature studies, low-cost sorbents from natural sources have been classified into the following groups [34,35,36,37]: (i) agricultural and household waste, (ii) waste and by-products, (iii) sludges, (iv) marine materials, (v) soils and ore tailings, and (vi) new low-cost adsorbents.
Biosorption is a particular alternative in the group of sorption processes that is based on the ability of certain categories of biomass (active–viable, or non-viable) to bind/retain and concentrate heavy metals or organic pollutants, even from dilute solutions. Biomass capitalizes on this property, acting as a chemical or as an ion exchanger of biological (vegetable) origin. This technique does not necessarily have to replace existing treatment processes, but it can be a complementary alternative. Some studies have shown that using biosorption as a technique to remove pollutants from contaminated environments (aqueous effluents) can reduce capital costs by about 20%, operating costs by 36%, and total costs by about 28% compared to conventional systems [38,39]. The first work in the field of biosorption was published in 1951 [40]. Since then, substantial efforts have been made to discover cost-effective materials that can be applied as biosorbents to treat wastewater and other aqueous solutions contaminated with pollutants.
Many researchers have found that by using this new method, in which different categories of biomass can be used as biosorbents, toxic pollutants can be selectively removed from aqueous solutions at desired residual concentration levels [18,39,41,42,43,44]. As a broader spectrum of properties suitable for biosorbent requirements has been discovered for biomass, the concept of biosorption has become increasingly attractive in various fields. Bulgariu et al. have reported on the use of soybean waste biomass resulting from oil extraction and modified during alkaline treatment as a biosorbent for the removal of Pb(II), Cd(II), and Zn(II) ions from aqueous media, with very promising results [45].
The biosorption studies in the literature analyze, for the most part, the elimination efficiency of some heavy metals, such as cadmium (Cd), chromium (Cr), mercury (Hg), nickel (Ni), lead (Pb), and zinc (Zn), since they may pose significant risks to public health and the environment. Of these metals, we have selected three, lead, cadmium, and zinc, for biosorption studies, both due to their toxicity and to highlight differences in the biosorption capacity of soybean biomass and soybean waste biomass, and particularly due to their different electronegativity. Thus, Pb(II), which has the highest electronegativity (1.87), can participate more easily in ion exchange interactions than Cd(II) (1.69) and Zn(II) (1.65). Moreover, the hydrated radii of these metal ions have different sizes (Pb(II) = 4.01 Å < Cd(II) = 4.26 Å < Zn(II) = 4.30 Å), while their hydration energies also have different values (Pb(II) = −1481 kJ/mol, Cd(II) = −1807 kJ/mol, Zn(II) = −2046 kJ/mol), and these lead to differences in the sorption abilities of these metal ions [46,47,48]. This context offers the opportunity for a comparative study of biosorbents’ retention capacities and efficiencies, and their preferences for these metals. Additionally, these differences make possible a worthy comparison of the biosorption capacity and the biosorption efficiency of some biosorbents.
Although several publications have studied biosorption for the removal of heavy metals in batch systems, fewer studies have focused on modeling and optimizing this process for scaling-up purposes [49,50,51,52]. The biosorption capacity of copper by dried Chlorella pyrenoidosa was modelled by Rezende Moreira et al. using Response Surface Methodology (RSM) built based on a Box–Behnken design and artificial neural networks (ANN) [53]. A parallel sigmoidal (PS) model was applied by Blagojev et al. to describe the biosorption process and confirm its applicability to different types of biomass and various types of heavy metal ion [54]. Selva Filho et al. developed a two-parameter model based on a central composite rotatable design to find the optimal oil–water separation efficiency, involving floating macrophytes of the species Eichhornia crassipes in constructed wetlands [55]. The Box–Behnken experimental design model was applied by Jaafari and Yaghmaeian to plan biosorption experiments with heavy metals adsorbing onto the freshwater algae Chlorella coloniales to determine the effects of independent parameters, such as metal concentration, time of reaction, and algae dose, as well as to optimize these variable [56].
In this paper, the empirical mathematical modeling of the biosorption process of Pb(II), Cd(II), and Zn(II) ions from aqueous media on soybean and soybean waste biomasses was performed using Response Surface Methodology, followed the optimization using numerical methods. The aim of the modeling was to establish the most probable mathematical relationship between the dependent variables, including the biosorption efficiency of the biosorbent when adsorbing the metal ion, R(%), and the biosorption capacity of the sorbent, q(mg/g), and the process parameters (i.e., the independent variables: pH; sorbent dose, DS (g/L); initial metal ion concentration in solution, c0 (mg/L); contact time, tc (min); temperature, T (°C)), validated by using a methodology specific to multiple regression analysis. Subsequently, through optimization, sets of solutions were obtained that correlate various values of the process parameters to maximize the objective function and demonstrate the performance of waste biomass in biosorption process. The results were validated experimentally.
2. Materials and Methods
2.1. Experimental Context
This paper discusses the removal of heavy metals, namely, Pb(II), Cd(II), and Zn(II) ions, from simulated wastewater samples through biosorption, using soybean and soybean waste biomasses as biosorbents [45]. The experimental studies aimed to describe the biosorptive potential of these biosorbents for the removal of Pb(II), Cd(II), and Zn(II) ions from aqueous solutions, assessed based on the most relevant biosorption parameters: the biosorption capacity of the sorbent, q(mg/g), and the biosorption efficiency, R(%).
2.2. Preparation and Characterization of Biosorbents
The soybeans used to obtain the biosorbent needed for experimental studies were selected from a local farm in Iasi, Romania. After harvesting, the soybeans (1 kg) were washed with distilled water (5–6 times) to remove macroscopic impurities, dried in air at room temperature (22 ± 0.5 °C) for 5 days, and then ground. The material obtained from these operations was prepared further in the following modes: (1) dried at 65 °C for 6 h, then mechanically sieved so that the particle size was less than 1.5 mm, and stored in the desiccator to maintain a constant humidity, thus resulting in a soybean biosorbent; (2) through extraction with n-hexane for 30 h in a Soxhlet extractor, followed by washing with distilled water and drying at 65 °C for 6 h and then grinding, thus resulting in a soybean waste biosorbent.
In order to highlight the structural and morphological features, which are in direct correlation with the biosorptive properties, it was necessary to characterize the materials used as biosorbent in this study. The characterization was performed using the following methods of analysis by applying standard procedures for samples preparation:
- X-ray dispersive spectrometry (EDX)—with an EDAX-TSL 32 spectrometer—which allows the determination of the elemental composition of the analyzed material. The samples were prepared and analyzed according to the protocol described in [57].
- IR spectrometry—with a Bio-Rad Spectrometer with Fourier transform—which revealed the main types of functional groups that were found on the surface of each biosorbent used. For sample preparation, a small quantity of finely powdered solid sample was mixed with 100 times its weight of KBr and compressed into a thin transparent tablet using a hydraulic press. These tablets are transparent to IR radiation, and they were used for analysis.
- Scanning Electronic Microscopy (SEM) (performed using an S-3000 N HITACHI microscope with 15 UV). Microscopic images were recorded in low vacuum conditions, with several orders of magnitude, and their analysis allows the appreciation of the roughness of the material surface adsorbent. The samples were prepared and analyzed following the procedure described in [58,59].
2.3. Preparation and Analysis of the Studied Metal Ions
The aqueous solutions of the selected metal ions considered as the polluting species in this study were freshly prepared with exactly known concentrations for each experiment by diluting a given volume of the corresponding stock solution with distilled water. The solutions used in experiments were analyzed using an appropriate spectrophotometric analysis method to ensure the selectivity and accuracy of the determinations (Digital Spectrophotometer S 104 D, glass cuvettes thickness = 1 cm) according to the specific analysis method (Table 1).

Table 1.
Analytical characteristics of the spectrophotometric methods used to determine the concentration of metal ions.
The concentration of metal ions in the analyzed solutions was calculated from the regression equation of the corresponding calibration curve.
2.4. Experimental Methodology Used for Batch Biosorption Studies
Although the use of batch techniques for biosorption studies is sometimes considered in the literature to be an empirical method that does not accurately present the existing conditions in the treatment of industrial effluents, it is important, especially, in the evaluation of the biosorptive potential of a material for certain polluting species in aqueous solutions.
On a laboratory scale, the use of batch systems for the study of biosorption processes involved contacting a given volume of aqueous solution containing the polluting species (25 mL solution containing Pb(II), Cd(II), or Zn(II) ions of the given concentration) with an exactly weighed amount of biosorbent (soybean biomass or soybean waste). The mixture is stirred intermittently for a certain period of time (which is well established), after which the two phases are separated by filtration (using a quantitative filter paper with large pores), followed by the analysis of the two phases (filtrate—aqueous solution, and solid phase—biosorbent loaded with metals) using the specific methods of analysis discussed above.
2.5. Establishing the Experimental Conditions and Parameter Variation Ranges
Sets of preliminary tests facilitated the selection of a variation range of independent parameters for further working, considering also information from the literature. The best experimental conditions were established for each type of metal ion separately, both for biosorption on soybean biomass and soybean waste, using several sets of experiments that followed the influence of the most important experimental parameters, such as the pH of the initial solution, the dose of biosorbent (DS), the initial concentration of metal ion (c0), the contact time (tc), and the temperature (T), on the efficiency of the biosorption process. The evaluation of the influence of each experimental parameter was performed keeping constant the values of the other parameters considered in the experimental program.
2.5.1. pH
To determine the suitable pH value of the initial solution for the biosorption of Pb(II), Cd(II), and Zn(II) ions on the two types of soy-based biosorbents, two sets of experiments were performed (for each biosorbent), in which the pH of the aqueous solution (25 mL) containing metal ions varied between 1.0 and 6.5, while the values of the other experimental parameters were kept constant (Table 2). This pH range was chosen so that the studied metal ions could exist in solution predominantly in the form of free ions, and their precipitation in the form of hydroxides could be excluded. The required pH values were adjusted using solutions of different concentrations of HNO3 (to avoid the introduction into the solution of another anion that could influence the biosorption process).
Table 2.
Values of working parameters used in the experimental study on the influence of the initial pH of aqueous solution on the biosorption process.
pH values were measured exactly with the help of a pH/ion-meter MM + 873, equipped with a combined glass electrode. The pH value for which the biosorption efficiency is at its maximum was considered suitable for the biosorption of metal ions considered for the two types of soy-based biosorbents and was kept constant in all other experiments.
2.5.2. Dose of Biosorbent
The experimental study on the influence of this parameter on biosorption was performed as follows: a volume of 25 mL aqueous solution of a metal ion of an exactly known concentration was brought into contact with the biosorbent (soybean biomass and soybean waste biomass) at a particular pH, contact time, and constant temperature (Table 3). After the required time had elapsed, the two phases were separated and analyzed. The optimal amount of biosorbent was established for each case (metal ion and type of biosorbent) based on the value of the quantitative parameters of the biosorption process, with the best value being considered the one for which the efficiency of the process is maximum.
Table 3.
Values of working parameters used in the experimental study of the influence of biosorbent dose on the biosorption process.
2.5.3. Initial Concentration of Metal Ions
The influence of this parameter was studied by varying the concentration of each metal ion in a range of at least two orders of magnitude (Table 4), and keeping constant the values of the other parameters corresponding to the suitable values. Metal ion concentrations were obtained by accurately measuring volumes of the metal ion stock solution, which were then diluted to a 25 mL volumetric flask.
Table 4.
Values of working parameters used in the experimental study of the influence of the initial concentration of the metal ions on the biosorption process.
The results of these experiments allowed, on the one hand, the evaluation of the maximum amount of metal ion that can be retained in the most suitable experimental conditions on each type of biosorbent and, on the other hand, the concentration range for which the two biosorbents studied can be considered to be effective in removing Pb(II), Cd(II), and Zn(II) ions from aqueous solutions.
2.5.4. Contact Time
For these experimental studies, exactly weighed amounts of biosorbent (corresponding to the suitable values) were contacted with 25 mL of aqueous solution containing a metal ion (the concentration being chosen from the studied concentration range), at the most suitable pH value of the initial solution and at a constant temperature (Table 5). After well-defined periods of time (between 5 and 180 min), with intermittent stirring, the two phases were separated by filtration and the concentration of the metal ions in the solution was determined. This way, it was possible to establish the minimum contact time of the two phases necessary to achieve the balance of the biosorption process for each type of biosorbent and metal ion studied.
Table 5.
The values of the working parameters used in the experimental study of the influence of the contact time on the biosorption process.
2.5.5. Temperature
The study of temperature influence on the biosorption efficiency for Pb(II), Cd(II), and Zn(II) ion retention of the selected biosorbents encompassed the analysis of their performance, which was assessed in three sets of experiments at three different temperatures for each biosorbent and metal ion for every possible combination, when the pH of the initial solutions and the dose of biosorbent were kept constant at the most suitable values, determined during the previous experiments, while the concentration of metal ions varied for the entire concentration range studied (Table 6).
Table 6.
The values of the working parameters used in the experimental study of the influence of temperature on the biosorption process.
In this case, the phase separation was performed after 3 h, a period of time considered to be sufficient to reach equilibrium, and the solutions obtained after filtration were analyzed in order to determine the concentration of metal ions.
The experimental results from each set of experiments were used to quantitatively evaluate the biosorptive performance of the studied biosorbents, using the following quantitative indicators [45]:
- Biosorption capacity, q(mg/g), which represents the amount of metal ion retained per unit mass of biosorbent under given experimental conditions, and which is calculated using Equation (1).
- Biosorption efficiency, R(%), which represents the percentage of metal ion retained in the biosorption process, and which is given by Equation (2).
3. Application of Response Surface Methodology for Modeling and Optimization of the Biosorption Process Using Natural Soy-Based Biosorbents
3.1. Preliminary Assessment of Variation Intervals for Independent Variables
The set of preliminary experiments facilitated the evaluation of the suitability of soybean biomass and soybean waste as biosorbents for the selected heavy metal ions (Pb(II), Cd(II), and Zn(II)) and the process efficiency, and also helped to determine the variation intervals of the process parameters. In this context, the following process parameters were chosen as independent variables for modeling: pH, sorbent dose (DS, g/L), metal ion concentration (c0, mg/L), contact time (tc, min), and temperature (T, °C). The variation intervals are shown in Table 7 [60].
Table 7.
Independent variables of the biosorption process and variation intervals.
3.2. Experiments Design
The experimental program aimed to identify the conditions in which the best response of the analyzed system is obtained. The design of the experiments in an appropriate manner was used to optimize the processes based on the analysis of the individual and interactive effects of the independent variables, simultaneously, on the entire designed experimental space. From among the most relevant multivariate statistical analysis techniques, Response Surface Methodology (RSM) has been frequently applied as a technique for programming experiments. As mentioned above, RSM is a combination of mathematical and statistical techniques that describe the relationship between a series of independent variables and one or more responses of the investigated experimental system. In this sense, the answer is examined on the whole space of the independent variables, where the answer has the best value [61]. The behavior of the system is usually described by a second-degree polynomial function (Equation (3)).
where yi is the predicted system response, xi and xj are independent variables, A0 is the constant coefficient (free term), Ai, Aii, and Aij are linear, square (second order) interaction coefficients, n is the number of independent variables, and ε is a random error.
The concordance of the model was evaluated using the correlation coefficient (R2). The Fisher (F) test and the probability value (Prob > F) were applied to evaluate the significance of the model terms. In this paper, RSM was applied for modeling the biosorption efficiency (R, %) of heavy metal ions Pb(II), Cd(II), and Zn(II) from aqueous solutions using soybean biomass and soybean waste biomass from the industrial process of extracting soybean oil (for biodiesel). Additionally, we modelled the biosorption capacity of the studied biosorbents (q, mg/g). In the second part, the optimization of the biosorption efficiency (R, %) as well as the biosorption capacity (q, mg/g), was performed. The five independent variables (Table 7) were studied at five levels, designated as −α, −1, 0, 1, α. The matrix of the experimental program was the one corresponding to a full rotatable central composite design 25, with 45 experiments, of which 3 were in the central point (Table 8). Experimental data processing was performed in the Design-Expert software environment.
Table 8.
Experimental matrix of the full rotatable central composite design 25 (coded values) (independent variables are presented in Table 7).
4. Results and Discussions
The removal of metal ions from aqueous solutions via biosorption takes place with maximum efficiency only under certain well-specified experimental conditions, regardless of the nature of the metal ion or biosorbent used. Consequently, in the evaluation of the biosorption performance of a material for certain metal ions, the first step is to establish the optimal experimental conditions with which to achieve the biosorption process.
The fulfillment of this desideratum involves the study of the influence of the main experimental parameters (such as the initial pH of the solution containing metal ions, the biosorbent dose, the initial concentration of metal ions in aqueous solution, the contact time, and the temperature) on the biosorption capacity of the material used as a biosorbent for each metal ion separately. The paramount conditions for the development of the studied process are obtained experimentally and correspond to those values of the parameters for which the retention of metal ions from aqueous solutions takes place with the highest efficiency.
4.1. Characterization of Biosorbents
The results of the EDX analysis (Figure 1) showed that both soybean and soybean waste biomasses contain large amounts of organogenic elements (C, O, P, and S) in their structure, and also a series of ions of alkaline and alkaline earth metals (K, Mg, and Al) which, due to their high mobility, can easily participate in ion exchange processes. On the other hand, the comparison of the values obtained from the EDX analysis shows that, unlike soybean biomass, in the case of soybean waste, the C, P and S content is significantly lower, while the values of oxygen percentages and mobile ions (K and Al) are higher. These differences allow us to say that, following the n-hexane extraction step, there are still many functional groups in the composition of soybean waste, even if some of the organic compounds (most likely lipids and fatty acid salts) have been removed.
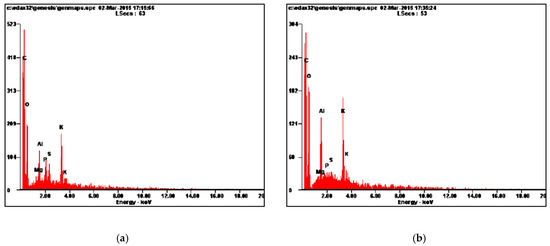
Figure 1.
EDX spectra recorded for soybean biomass (a) and soybean waste biomass (b).
The nature of the functional groups on the surface of these biosorbents and the differences that appear in the structure of the soybean biomass after the extraction stage were highlighted with the help of IR spectrometry. A detailed analysis of the IR spectra recorded on the dry matter (Figure 2) showed that, in the soybean biomass spectrum (spectrum 1), the most important absorption bands correspond to the functional groups of proteins and polysaccharides in the cell walls. Thus, the absorption band at 3407 cm−1 (which corresponds to the stretching vibration of the O–H bond from aliphatic alcohols and water molecules), the bands at 1652 and 1543 cm−1 (attributed to the stretching vibration of the C=O bond of carbonyl compounds), the bands of 1244 and 1053 cm−1 (corresponding to the symmetrical and asymmetric tensile vibration of the P=O bond in the phosphate groups), and the bands between 1200 and 690 cm−1 (which can be attributed to the vibrations of the C–OH bonds and C–O–C in polysaccharides) [45] indicate the presence of functional groups, such as hydroxyl, carbonyl, carboxyl, phosphate groups, etc., which may play an important role in the retention processes of the studied metal ions.
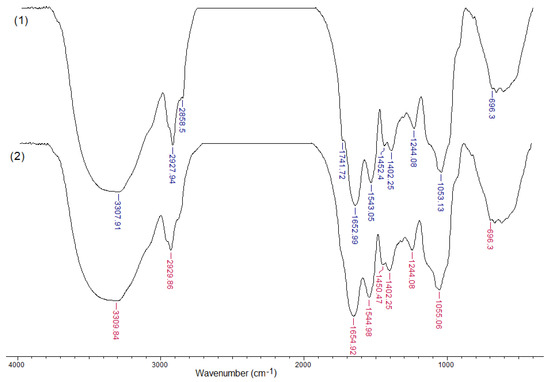
Figure 2.
IR spectra recorded for soybean biomass (1) and soybean waste (2).
After the extraction stage, in the IR spectrum of soybean waste (Figure 2, spectrum 2), most of the absorption bands are slightly shifted towards higher wave numbers (2–3 cm−1), while the absorption bands at 2858 cm−1, 1741 cm−1, 1402 cm−1 and 1244 cm−1, which are characteristic of lipids, have disappeared or decreased in intensity (without changing too much the position of the maximum absorption). These differences show that, at the extraction stage, only this type of component (lipids) was removed from the soybean biomass composition, while most proteins and polysaccharides remained in the soybean biomass composition, and their functional groups will be binding centers for metal ions in the aqueous solution.
The SEM images (Figure 3) show that, from a morphological point of view, both soybean biomass and soybean waste have a rough and irregular surface, which presents numerous non-uniformities. However, it can be seen that, after the extraction stage, the surface of the soybean biomass (Figure 3b) becomes more porous and has more “breaks”, and this is probably determined by the rupture of the cell walls that takes place during extraction time. This increase in the roughness of the biosorbent surface after the solvent extraction step can greatly influence the efficiency of the biosorption process in the case of soybean waste, as it causes an increase in its specific surface area.
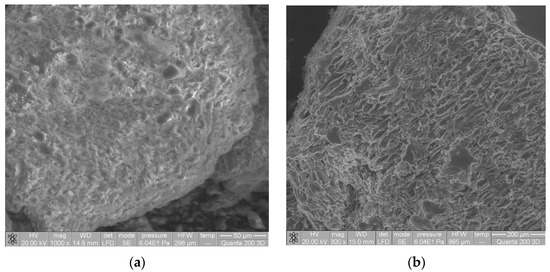
Figure 3.
SEM images recorded for soybean biomass (a) and soybean waste (b).
All this experimental evidence, namely, (i) the presence of mobile ions in the composition of the two soy-based biosorbents, (ii) the presence of a large number of various functional groups on the surface of soybean biomass and soybean waste, but also (iii) the morphological non-uniformity of the surface, recommends the use of soybean biomass and soybean waste as biosorbents in the processes of the decontamination of environmental components.
4.2. Influence of Process Parameters on Biosorption Efficiency
4.2.1. Initial pH of the Solution Containing Heavy Metal Ions
One of the most important experimental parameters that can significantly influence the biosorptive characteristics of a given material is the initial pH of the aqueous solution, since it affects both the form of speciation and the solubility of the metal ions present in the solution, as well as, especially, the degree of dissociation of the functional groups on the surface of the biosorbent.
The considered pH range (Table 2) was selected because: (i) it covers the acidic and slightly acidic to neutral range, which results in a significant variation in the degree of dissociation of the functional groups on the surface of the two biosorbents; (ii) the speciation change of the studied metal ions (Pb(II), Cd(II), and Zn(II)) is avoided, because in this interval they are present predominantly in the form of free divalent ions. The variation of the biosorption capacity of soybean biomass and soybean waste as a function of the initial pH of the aqueous solution, for each metal ion separately, is shown in Figure 4.
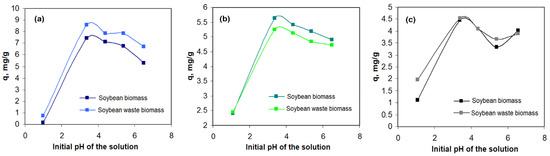
Figure 4.
Variation of the biosorption capacity of the two biosorbents (soybean biomass and soybean waste biomass) with the initial pH of the solution in the case of the retention of (a) Pb(II), (b) Cd(II), and (c) Zn(II) ions.
As can be seen from Figure 4, the biosorption capacity of the two materials depends significantly on the value of the initial pH of the solution, although the variation is not uniform. Thus, the biosorption capacity of soybean biomass and soybean waste biomass intensifies considerably with the increasing initial pH of the solution in the pH range between 1.09 and 3.39 and then decreases for all studied metal ions. The highest values of the biosorption parameters are obtained at a pH of the initial solution of 3.39, where more than 50% of Pb(II), 60% of Cd(II), and 45% of Zn(II) can be removed from the aqueous solution using these two biosorbents. It should also be noted that when using soybean waste, the efficiency of the biosorption process increases only in the case of Pb(II) ions (from 50% to 60%), while Cd(II) (from 61% to 60%) and Zn(II) ions (from 45% to 46%) remain approximately constant compared to the use of soybean biomass as a biosorbent.
Other research found that the initial pH of a metal ion solution influences significantly the binding sites on biosorbent surfaces and metal ion behavior [62,63,64]. These remarks are also related to those reported by other authors for the biosorption of some heavy metals on algae [65,66,67]. Studies on the important role pH plays in the biosorption process highlighted the mechanisms responsible for biosorption in relation with pH value, namely, complexation, oxidation reduction, and separation by hydrolysis, considering that the pH determines the charge of the biosorbent surface, the degree of ionization, etc. [45,68,69,70,71,72]. Choloco-Gonzales et al. found that the biosorption capacity of Pb(II), Cd(II), and Zn(II) on agave bagasse reaches a maximum at around pH 5.5, beyond the point of zero charge (pHPZC) [73]. Salem et al. studied the biosorption of Pb(II), Cd(II), and Zn(II) on loquat bark (Eriobotrya japonica) and observed the maximum adsorption around pH 4.0 [74]. The researchers found that the surface area of the biosorbent they used was negatively charged as the pH increased from 2 to 4, whereby the functional groups became deprotonated and became available for Pb(II), Zn(II), and Cd(II) ions. Lezcano et al. used different categories of biomass as biosorbents identified from eutrophic ecosystems and tree leaves [75]. For initial pH values between 3 and 5, the biomass behaved like a proton acceptor and the biosorption capacity reached maximum values, but at initial pH values higher than 6, the biomass behaved like a proton donor.
Unlike most of the biosorbents used to remove metal ions from aqueous solutions, where the maximum biosorption capacity is obtained in the weak acid to neutral range (pH = 4.0–6.0), in the case of soybean biomass and soybean waste, this maximum is obtained at much lower pH values (pH = 3.39). This is probably due to the high buffering capacity of the two biosorbents and offers the possibility to use these biosorbents in acidic wastewater treatment processes (such as those from the metal coating industry). Based on these observations, it can be said that the biosorption of the selected ions on soybean biomass and soybean waste biomass takes place with the highest efficiency at a pH of 3.39, and this value was considered to be the most suitable and was used in all other experimental studies.
4.2.2. Dose of Biosorbent
The experimental results on the influence of biosorbent dose on the biosorption capacity of soybean biomass and soybean waste biomass for Pb(II), Cd(II), and Zn(II) ions, tested using different amounts of biosorbent (Table 3), are shown in Figure 5. The increase in the amount of biosorbent in the studied range (4.0–40.0 g/L) caused a slightly significant increase in the percentages of removal of metal ions from 44% to 90% in the case of Pb(II), from 57% to 73% in the case of Cd(II), and from 40% to 56% in the case of Zn(II), which does not differ significantly according to the nature of the biosorbent. At the same time, the biosorption capacity decreases significantly with the increase in the amount of biomass added, from 10.62 to 1.81 for Pb(II), from 6.56 to 0.83 for Cd(II), and from 5.76 to 0.67 for Zn(II), values that are insignificantly influenced by the type of biosorbent (soybean biomass or soybean waste).
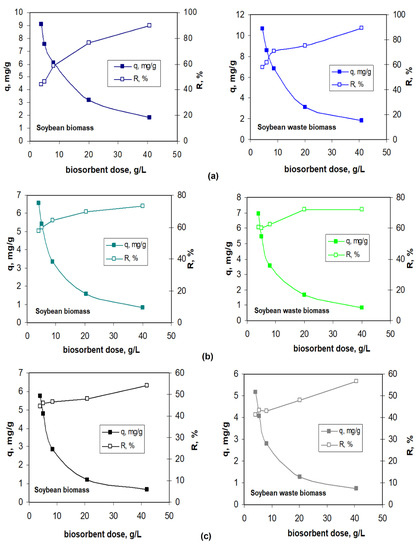
Figure 5.
Influence of biosorbent dose on the biosorption efficiency of (a) Pb(II), (b) Cd(II), and (c) Zn(II) ions on soybean biomass and soybean waste (pH = 3.39; c0 = 46.11 mg/L; contact time = 24 h; temperature = 22 °C).
Comparing the biosorption capacity (q, mg/g) and the biosorption efficiency (R, %), it was established that a dose of biosorbent of 5 g/L can be considered to be the best for the retention of Pb(II), Cd(II), and Zn(II) ions in aqueous solutions for both soybean biomass and soybean waste, and this value was used in subsequent experimental studies.
4.2.3. Initial Concentration of Metal Ions
The dependence of the biosorption capacity of the two biosorbents on the initial concentration of Pb(II), Cd(II), and Zn(II) ions was studied in concentration ranges described in Table 4, at the selected values of solution pH (3.39) and biosorbent dose (5 g/L). The experimental results obtained in this case for each metal ion are shown in Figure 6. From these graphical representations, it can be seen that, as the concentration of metal ions increases in the studied concentration range, the biosorption capacity q values increase, while the values of the biosorption efficiency R decrease. This variation in opposite direction of q and R is valid for all studied metal ions and for both biosorbents, although the limits of variation of the two parameters depend on the nature of the metal ion and the biosorbent used in the biosorption process.
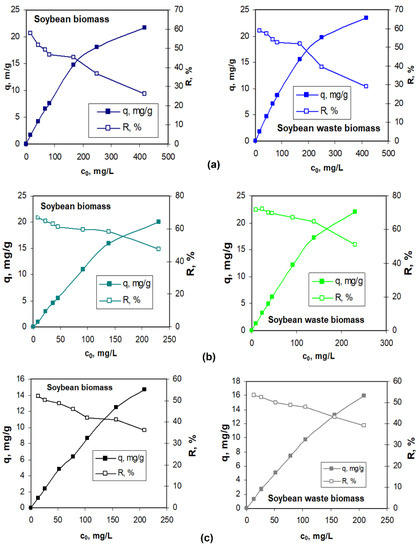
Figure 6.
Influence of the initial concentration of metal ions on the biosorption capacity and biosorption efficiency of (a) Pb(II), (b) Cd(II), and (c) Zn(II) ions on soybean biomass and soybean waste (pH = 3.39; biosorbent dose = 5.0 g/L; contact time = 24 h; temperature = 22 °C).
When the concentration of metal ions in the aqueous solution is high, most of the functional groups on the biosorbent surface are already occupied and, therefore, their transition to free (unreacted) functional groups, which are found in the inner planes or even inside the particles of the biosorbent, is hampered by diffusion resistances.
Amer et al. attributed the increase in biosorption efficiency as the metal ion concentration increases to the more intense interaction between metal ions and sequestration sites [76]. They used different initial metal concentrations (Cu (II), Ni(II), Zn(II), and Pb(II) ions) of 5, 20, 40, 60, 80, and 100 mg/L, with Sophora japonica pods powder as the biosorbent. Kamar et al. analyzed the effect of initial metal ion concentration on the biosorption of Pb(II), Cu(II), and Cd(II) onto cabbage leaves powder, and found that absorption efficiency decreased slightly with increasing initial concentrations from 10 to 50 mg/L, and a rapid decrease in the initial concentrations ranging from 50 to 100 mg/L [77]. They attributed this behavior to the decrease in the number of available sorption sites on the surface area of the sorbent as the initial concentration of metal ions in the solution increased. Similar behaviors were reported in other works, as well [78,79].
The retention of Pb(II), Cd(II), and Zn(II) ions by biosorption on soybean biomass and soybean waste biomass, respectively, can be predominantly caused by electrostatic interactions. Similar assumptions were made by [80,81]. The efficiency of the biosorption process is moderate, because the electrostatic interactions responsible for the retention of metal ions are non-selective, and the metal ions will interact with the functional groups that have the highest availability. After occupying these available groups on the surface, spatial obstructions are generated, which limit the penetration of other ions from the solution into the free functional groups. Consequently, the biosorption efficiency has moderate values following the series Cd(II) > Pb(II) > Zn(II) for both biosorbents. However, the biosorption efficiency values for all studied metal ions are higher in the case of soybean waste than in the case of soybean biomass up to 6%, which shows that the breaking of cell walls in soybean biomass during the oil extraction process is important for biosorption intensification. Following the solvent extraction step, an increase in the availability of surface functional groups to interact with metal ions in the aqueous solution can be assumed.
4.2.4. Contact Time
The contact time between the two phases necessary to reach the equilibrium state is another important parameter of the biosorption process, especially when the implementation of such a process, e.g., for the treatment of industrial wastewater, is pursued. Too long a contact time increases the costs of the biosorption process, while too low a value of this parameter leads to a drastic decrease in the efficiency of the process as such. The influence that the contact time between the two phases (solid phase—biosorbent, and liquid phase—aqueous solution containing the studied metal ions) has on the efficiency of the biosorption under the considered experimental conditions is shown in Figure 7. As the contact time between phases increases, so does the biosorption capacity (q) for both biosorbents. This increase is more evident in the initial stage, in the first 30 min, when more than 66% of the total amount of Pb(II), 60% of the total amount of Cd(II), and 57% of the total amount of Zn(II) are retained on soybean biomass, and 67% of the total amount of Pb(II), 61% of the total amount of Cd(II), and 64% of the total amount of Zn(II) are retained on soybean waste biomass.

Figure 7.
Influence of contact time on sorption capacity of Pb(II), Cd(II), and Zn(II) ions in aqueous solutions by soybean biomass and soybean waste (pH = 3.39; DS = 5 g/L; c0 = 83.29 mg Pb(II)/L; 46.11 mg Cd(II)/L; 52.31 mg Zn(II)/L; temperature T = 24 °C).
Such a variation is most likely determined by the number and availability of active centers able to interact with metal ions in the solution. Thus, when the number of active centers is high (the first moments of the biosorption process) and more geometrically and spatially available (the case of soybean waste compared to soybean biomass), the interaction between functional groups at the surface and metal ions in aqueous solution is easier to achieve and the biosorption rate is high. On the other hand, the close values of the biosorption efficiency obtained for the three metal ions studied, both in the case of soybean biomass and soybean waste (with differences of up to 7%) is another argument in favor of the hypothesis that the biosorption process is achieved via non-selective electrostatic interactions, and that the process rates do not depend on the nature of the metal ion in the aqueous solution. After the initial stage, the biosorption rate decreases significantly near the steady state, which is obtained practically after 60 min in the case of Pb(II) and Zn(II) ions and after 30 min in the case of Cd(II) ions for both types of biosorbents. Based on these experimental observations, it can be concluded that a contact time of 3 h is sufficient to reach equilibrium in the case of biosorption of the three metal ions, both on soybean biomass as well as on soybean waste biomass.
4.2.5. Temperature
The influence of temperature on the biosorption capacity of soybean biomass and soybean waste for Pb(II), Cd(II), and Zn(II) ions was studied, as mentioned before, at three different temperature values, ranging from 5 to 50 °C for different concentrations of each metal ion separately, considering a contact time of 3 h (Table 6). The experimental results of these studies are presented in Figure 8 and show that temperature has a relatively small influence on the biosorption capacity, both in the case of soybean biomass and in the case of soybean waste, for all metal ions studied. Increasing the temperature at 45 °C causes an increase in the biosorption capacity of the two biosorbents, but only with a few units, and this is visible especially at high values of the initial concentration of metal ions in the aqueous solution. Depending on the nature of the metal ion, it can be seen that the major variation in biosorption capacity resulted in the case of Pb(II), followed by Cd(II), and then Zn(II). This hierarchy is observed for both soybean biomass and soybean waste, although it should be noted that in the case of soybean waste, the variation in biosorption capacity is higher than in the case of soybean biomass for all studied metal ions.
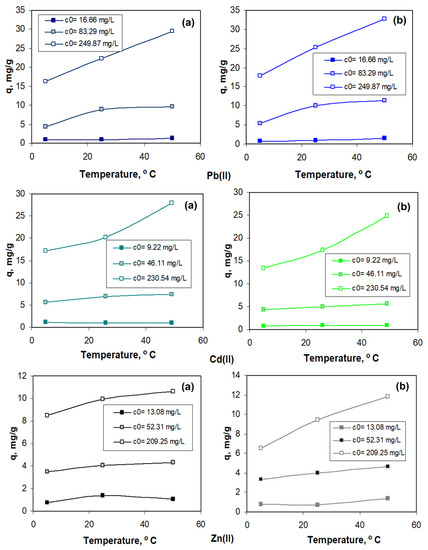
Figure 8.
Influence of temperature on the biosorption capacity of soybean biomass (a) and soybean waste (b) for the retention of the metal ions (pH = 3.39; 5 g biosorbent/L; 3 h).
The increase in the biosorption capacity of soybean biomass and soybean waste with increasing temperatures is suggestive of the endothermic nature of the biosorption processes of Pb(II), Cd(II), and Zn(II) ions on the two biosorbents. However, the relatively small variation of q values at relatively large temperatures (45 °C) shows that performing the biosorption process at high temperatures is not necessarily an advantage. The biosorption efficiency of the studied ions on soybean biomass and soybean waste can be successfully achieved at ambient temperatures, and these conditions are advantageous considering both the costs and the efficiency of the biosorption process.
4.3. Modeling and Optimization of Biosorption Process by Response Surface Methodology
4.3.1. Model Development and Validation
Equations of the model generated in Design-Expert software environment after the interpretation of the experimental data for the biosorption of Pb(II), Cd(II), and Zn(II) ions by soybean biomass and soybean biomass waste following the variables and experimental matrix showed in Table 7 and Table 8 are presented in Table S1 (Equations (1)–(12) (a, b)). It is found that these Equations are second-degree polynomial functions, which contain significant terms, the rest being eliminated in the process of verifying the concordance of the model and the significance of the coefficients because, following the statistical analysis for a 95% confidence interval, some of the coefficients were considered to be insignificant.
Equations (4)–(15) (a, b) (Table S1) show the extent to which the individual independent variables or the interactions between them affect the biosorption efficiency (R, %) and the biosorption capacity (q, mg/g). Negative coefficient values indicate that individual factors and/or interactions between them negatively affect dependent variables (R, q), while positive coefficients suggest that dependent variables are positively influenced (increase) under the action of those independent variables. The compatibility of the developed models, of a polynomial type (second order—quadratic), is justified in Table S2 (after adequacy testing, which consists of comparing the set of performances obtained with the help of the model with the performances collected experimentally).
Based on this information, the suitability of the selection of the recommended polynomial (quadratic) model for all six experimental cases (three metal ions and two tested biosorbents) was confirmed. Additionally, the independent variables were selected to find the best set of predictors in each case and, therefore, the simplest form of the mathematical model that was in good agreement with the experimental data. This selection was made in order to reduce random errors in estimating the dependent variables and to ensure the accuracy of the degrees of freedom. In selecting the variables of the model, the compliance of their hierarchy was taken into account (lower order terms were possibly excluded from the model) after the higher order ones (for the same variable). The elimination of insignificant predictors was performed using the “backward” procedure because this is recommended in models with collinear variables as the most robust compared to the “forward” or “stepwise” techniques, with only those factors that have a significant influence of the response variable being retained in the model. By applying the “backward” procedure to a critical threshold αcrit = 0.05, modeling was started with all the predictors (independent variables) in the model; the predictors for which the highest values of Prob > αcrit have been eliminated; the model was then reconsidered and the iteration continued until the Prob < αcrit values.
4.3.2. ANOVA Analysis
ANOVA analysis was performed for the biosorption efficiency R and the biosorption capacity q of the metal ions Pb(II), Cd(II), and Zn(II) models (Tables S3 and S4). Significance tests for second-order polynomial models—with RSM reduced according to the results of the ANOVA analysis for R and q—are presented in Table 9. In the case of Pb(II) biosorption on soybean biomass, the model is characterized by the value F = 53.11, which indicates that the model is significant (Equations (1) a, b, Table S1), and there is only a 0.01% probability that the system answer may be affected by accidental errors. “Prob > F” values less than 0.05 indicate that the terms of the model are significant. In this case, A, B, C, D, A2, and B2 are significant terms. The value 76.25 for “lack of correlation” for F implies that it is significant, meaning that there is a chance of only 1.3% that the answer will be affected by random errors. In the case of Pb(II) biosorption on soybean waste biomass, the F value of 68.37 implies that the model is significant and that there is a probability of only 0.01% that the system response may be affected by random errors. As with the soybean biomass biosorbent, “Prob > F” values less than 0.05 indicate that the model terms (A, B, C, D, A2, and B2) are significant. Similar situations were found in the case of the models for Cd(II) and Zn(II) biosorption on soybean biomass and soybean waste biomass, respectively.
Table 9.
Significance tests for RSM models developed for R(%) and q(mg/g) during biosorption of metal ions Pb(II), Cd(II), and Zn(II) on soybean biomass and soybean waste biomass.
The ANOVA confirms the adequacy of the developed models because Prob > F is less than 0.05. The developed models have small standard deviations and values of the coefficient of determination R2 generally over 0.9. The high values of R2adj show that the total variations of R(%) and q(mg/g) can be described by the selected model type. The value of the signal-to-chance ratio (adequate accuracy) is greater than 4, which indicates that the measurement results are not random, but are consistent with the actual values. The values of R2pred are in good agreement with R2adj (which appreciates the correctness of the model by the fact that it is well selected and not due to the large number of variables). R2pred indicates the extent to which the regression model predicts the response for new observations (measurements). This statistical measure supports the assessment of the model in the sense that it is consistent with experimental data.
Details on the diagnosis of the statistical properties of the developed models were obtained from the analysis of some graphical representations (not presented here). The so-called adjustment errors and residuals are estimates of errors. Small residues expressed the goodness of fit of the experimental data. The graphical representation of the probability as a function of the error scattering estimate (σ2) has shown that it is approximately linear, demonstrating the normal distribution hypothesis for the chosen 95% confidence interval. The residue limit is a maximum of ±3σ. From the diagrams residual values vs. calculated values for all the analyzed experimental situations, there is no deviation from normality or from the hypothesis that the errors have a relatively constant dispersion. Since the residues are in the range (−3, 3) it means that there are no aberrant observations associated with the developed models. The diagrams’ residual values—independent variables—have revealed that there are no aberrant observations regarding each independent variable that can be induced in the experimental program and the elaborated models, respectively. Extreme observations, which do not fall within the general trend of the outliers are absent, as all observations fall within the range of a maximum of three standard deviations from the average.
To identify the points that significantly influence the regression, the Cook distance was analyzed (as defined in the specialized works) and which is a measure of the influence of the ith observation on the predicted values. This distance is another variable for which the aberrant values are determined according to the rule of the three standard deviations. It was found that for all the elaborated models, this condition is fulfilled. The identification of possible aberrant values was also performed by analyzing the standardized residual values, to identify possible extreme values in the y-space without changing the position of the regression curve to the extreme value—the so-called leverage points. The extreme points y associated with the mean values x do not change the regression curve, with the values being located in the range of 0–1, usually below the value of the standard deviation. In this context, it is found that there is a good concordance between the experimental values of the variables R and q and those estimated using the RSM model (Figure 9 and Figure 10).
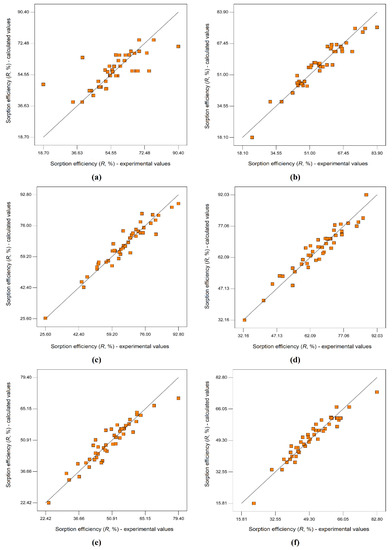
Figure 9.
Graphical representation of the concordance between experimental and calculated (predicted) values using the mathematical models developed for biosorption efficiency (R, %) of Pb(II), Cd(II), and Zn(II) on soybean biomass and soybean waste biomass: (a) Pb(II) on soybean biomass; (b) Pb(II) on soybean waste biomass; (c) Cd(II) on soybean biomass; (d) Cd(II) on soybean waste biomass; (e) Zn(II) on soybean biomass; (f) Zn(II) on soybean waste biomass.
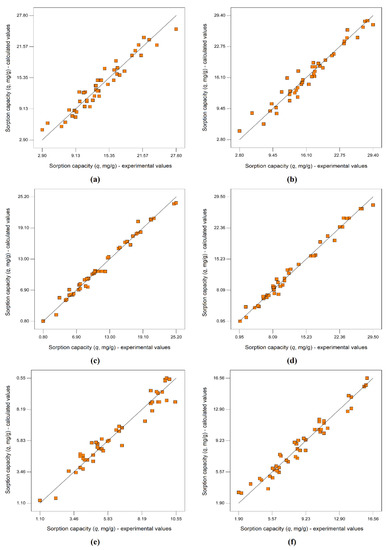
Figure 10.
Graphical representation of the concordance between the experimental values and those calculated (predicted) with the mathematical models developed for the biosorption capacity (q, mg/g) of soybean biomass and soybean waste biomass when adsorbing metal ions (a) Pb(II) on soybean biomass; (b) Pb(II) on soybean waste biomass; (c) Cd(II) on soybean biomass; (d) Cd(II) on soybean waste biomass; (e) Zn(II) on soybean biomass; (f) Zn(II) on soybean waste biomass.
To verify the collinearity/multicollinearity of the independent variables (possibly the overestimation of the correlation or determination coefficient as well as the dispersion of the estimated coefficients), the tolerance of the variables xi was tested by the relation (4) and the variance inflation factor, denoted by VIF (relation 5), which shows the extent to which the variance of the model coefficients may increase due to the lack of orthogonality (multicollinearity) of the independent variables.
The standard error of the coefficient of a model increases proportionally to the square root of VIF. If a coefficient of a parameter is orthogonal to the other terms of the model, the VIF value is unitary. We found that, in most of the cases studied, VIF = 1. In no case is VIF greater than or equal to 10 (which would indicate the existence of multicollinearity, which occurs when a group of independent variables are strongly correlated with each other, and the rest no longer provide significant information, with an overestimation of the coefficient of determination R2) [81,82].
4.3.3. Sensitivity Analysis
A comparison of the effects of all the factors influencing the independent variables can be seen in Figure 11 and Figure 12. The answer is represented graphically by changing the value of one factor on the chosen range of variation (generating a disturbance) and keeping the other factors constant. The slope or curvature associated with a factor suggests that the response is sensitive to that factor. A relatively flat line suggests that this factor does not significantly influence the response. In this way, the sensitivity analysis of the elaborated mathematical models was performed.
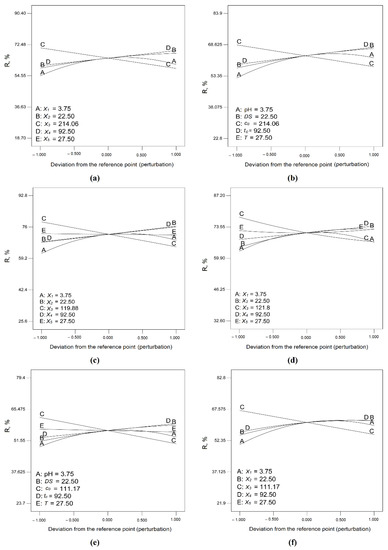
Figure 11.
Perturbation diagrams resulting from the sensitivity analysis for the mathematical models developed for biosorption efficiency of heavy metal ion on soybean biomass and soybean waste biomass (the meaning of the notations (a–f) is the same as those from Figure 9).
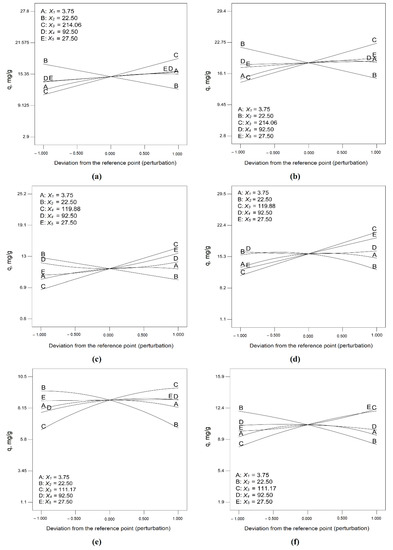
Figure 12.
Perturbation diagrams resulting from the sensitivity analysis for the mathematical models developed for biosorption capacity of soybean biomass and soybean waste biomass (the meaning of the notations (a–f) is the same as those from Figure 9).
It can be seen that in the case of Pb(II) biosorption on soybean biomass, the change in pH and initial metal concentration significantly influences the system response (R,%). The same finding is true for Pb(II) biosorption on soybean waste biomass, but the sensitivity of the response is higher with the variation of these two parameters. In the case of Cd(II) biosorption on soybean biomass, the pH and concentration of the metal in the initial solution, and also the sorbent dose and the contact time, significantly influence the biosorption efficiency. Temperature has little influence. In the case of Cd(II) biosorption on soybean waste biomass, the pH, sorbent dose, and contact time significantly influence the system response, especially to values of these factors to the left of the reference point. Temperature also plays an important role in the biosorption efficiency of Cd(II) soybean waste biomass.
When Zn(II) is retained on soybean biomass, it is significantly influenced by pH (upwards, especially in the area to the left of the reference point) and metal ion concentration in the initial solution (downwards). The sensitivity of the R(%) response to the variation in sorbent dose, contact time, and temperature around the reference point is relatively small. However, in the case of Zn(II) biosorption on soybean biomass waste, the sensitivity of the system to changes in pH and the initial concentration of the metal ions are significant. The influence of temperature is not significant. The biosorption capacity q is sensitive to variations in pH, sorbent dose, and initial concentration of Pb(II) during biosorption on soybean biomass, but the sensitivity is higher in the case of biosorption capacity values of Pb(II) on soybean waste biomass. The biosorption capacity of soybean biomass for Cd(II) is sensitive to changes in ion concentration in the initial solution and sorbent dose. The pH, contact time, and temperature have a less significant influence on the system response (q, mg/g). In the case of the analysis of the sensitivity of biosorption capacity of soybean waste biomass for Cd(II), it can be seen that the sorbent dose and the initial ion concentration in the solution significantly influence q, especially in the right field of the reference point. Additionally, q is relatively sensitive to changes in pH, contact time, and temperature.
In the case of Zn(II) biosorption on soybean biomass, the biosorption capacity q is strongly sensitive to variations in sorbent dose and ion concentration in the solution, relatively sensitive to changes in pH and contact time, and a little sensitive to temperature variation. In the case of Zn(II) biosorption on soybean waste biomass, the biosorption capacity is significantly influenced by the sorbent dose and the ion concentration in the solution followed by pH and contact time, as in the case of soybean biomass. Temperature has a significantly higher effect on q than in the case of soybean biomass.
4.3.4. Analysis of Response Surfaces and Optimization of the Biosorption Process
Both the contour curves (not shown) and the response surfaces presented in Figure 13 and Figure 14 demonstrate that there is a close correlation between process parameters (pH, DS, c0, tc, and T) and system responses (biosorption efficiency of Pb(II), Cd(II), and Zn(II) (R, %) and the biosorption capacity of the biosorbents (q, mg/g)). In order to analyze the best applicable variants of the biosorption process in a sustainable way, it is necessary to optimize the process by finding the most favorable combination of process parameters that maximizes the system response, followed by the experimental validation of the solution or group of solutions.
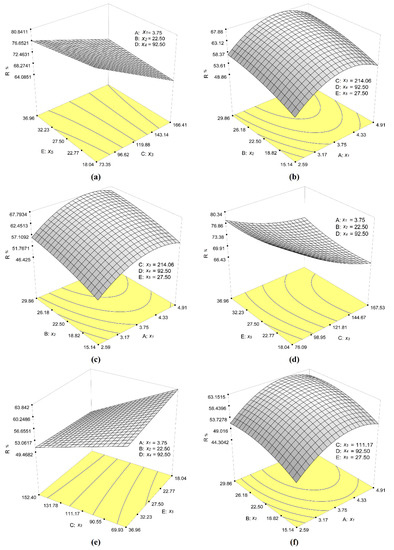
Figure 13.
Response surfaces for mathematical models developed for biosorption efficiency of metal ions (R, %) (the meaning of the notations (a–f) is the same as those from Figure 9).
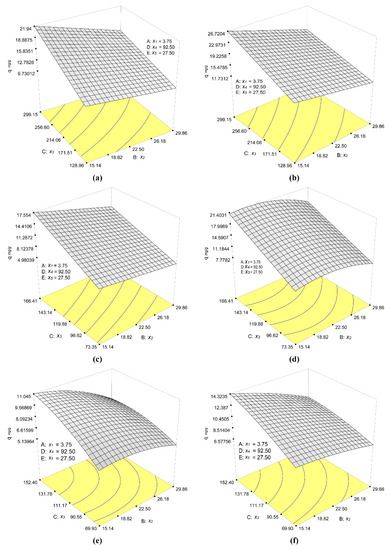
Figure 14.
Response surfaces for mathematical models developed for biosorption capacity of metal ions (q, mg/g) (the meaning of the notations (a–f) is the same as those from Figure 9).
In this context, the following optimization alternatives can be considered: maximizing the response; minimizing the response; achieving a certain imposed target in the experimental field; establishing sets of values of independent variables to obtain a certain value of the system response (which may minimize costs and environmental impacts) or a certain amount of desirability. To analyze the objective or performance functions in relation to the optimal operating variants of the biosorption system, we considered the variation of the process parameters (independent variables) and the influence thereof on the previously established experimental field, provided that the biosorption efficiency (R, %) and biosorption capacity (q, mg/g) are maximized. The optimization procedure was applied to obtain the maximum for each of the purpose functions associated with Equations (1–12, a, b) (Table S1).
From the graphical representation in three-dimensional coordinates (response surfaces, Figure 13 and Figure 14), it can be seen that the optimal values of the parameters to be optimized are either in the experimental field or on its borders, or they may differ from the global optimum of the target function [82,83]. In the context of this paper, optimization means establishing the best decision (solution), called the optimal decision (optimal solution), by maximizing the objective function (desirability). To determine the optimal (most favorable) solution for system operation from the individual point of view of the two dependent variables (R, q), the minimum and maximum levels of each independent variable were established and a weight was associated to adjust the shape of the objective (desirability) function. This function is zero outside the system limits and one when the optimization goal is reached.
For each answer yi(x), the desirability function di(yi) assigns numbers between 0 and 1 to the possible values of yi: when di(yi) = 0, this represents a completely undesirable value of yi; when di(yi) = 1, this represents an ideal (desirable) response value. The individual desirable values are then combined using the geometric mean, which gives the general desirability D (Equation (6)):
where k is the number of possible answers.
Our purpose was to maximize these objective functions, beginning with a starting point to search for the maximum, going step by step through the experimental field on a suitable slope until the maximum value was reached. There may be several variants of favorable solutions, since the response surface does not have a constant curvature, but this varies depending on the starting point and the slope traveled step by step. This variant of identifying a set of favorable solutions was chosen to maximize the chances of finding the “best local maximum” [84,85]. Therefore, we applied a multi-response method to optimize the combinations of the five independent variables (pH, DS, c0, tc, and T). In each case, the optimization was started from 10 starting points chosen in the experimental field, resulting in 10 solutions for each experimental variant (three heavy metals and two biosorbents), presented in Table 10 and Table 11.
Table 10.
Solutions for the operation in favorable conditions for reaching the maximum value of the biosorption efficiency (R, %) on soybean biomass and soybean waste biomass.
Table 11.
Solutions for the operation in favorable conditions for reaching the maximum value of the biosorption capacity (q, mg/g) on soybean biomass and soybean waste biomass.
The best values for biosorption efficiency (R, %) are obtained for Cd(II), both for the biosorption on soybean biomass and waste biomass (85–89%), while the initial concentration of the metal ions is 73–76 mg/L. The Pb(II) ion is absorbed with a maximum biosorption efficiency of 77–78%, both on soybean biomass and soybean waste biomass, starting from an initial concentration of Pb(II) in a solution of 128–129 mg/L. Zn(II) ions are absorbed with the lowest efficiency (R~69%), the initial concentration of the metal ions in the solution being around 70 mg/L. Therefore, it is found that soybean waste biomass can ensure a maximum biosorption efficiency equivalent to that demonstrated in the case of soybean biomass. In all cases the working pH values are in the range of 3–4.5 and the contact time is 120–130 min, while temperature influences to a relatively small extent the optimum for R(%).
Regarding the best values for the biosorption capacity of metal ions (q, mg/g), it is found that the maximum value of q for soybean waste biomass is higher than that obtained for soybean biomass (with 12% for Pb(II); 16% for Cd(II); about 45% for Zn(II)). The initial concentration of the metal ions in the solution for which a maximum q is obtained is 72% of the maximum limit of the experimental range in the case of Pb(II) (c0 = 416.45 mg Pb(II)/L); 72% for Cd(II) (c0 = 230.54 mg Cd(II)/L); 70% for Zn(II) (c0 = 209.25 mg Zn(II)/L). The dose of sorbent is about 15–20 g/L (lower than the maximum value of R of ~30 mg/L).
The optimization goal is reached with a probability higher than 0.89.
The optimal solutions that consider some economic constraints (for example: the minimum amount of sorbent and the maximum initial concentration of the metal ions in the solution, which ensures maximum biosorption efficiency (R) and maximum biosorption capacity (q)) while maintaining the other parameters in the experimental field are presented in Table 12 and Table 13.
Table 12.
Solutions for the operation in favorable conditions for reaching the maximum value of the biosorption efficiency (R, %) of soybean biomass and soybean waste biomass considering a series of constraints (minimum dose of sorbent and maximum concentration of metal ion in solution).
Table 13.
Solutions for the operation in favorable conditions for reaching the maximum value of the biosorption capacity (q, mg/g) of soybean biomass and soybean waste biomass considering a series of constraints (minimum dose of sorbent and maximum concentration of the metal ions in solution).
Comparing the data in Table 10 and Table 12, the following aspects can be seen when constraints are imposed:
- The optimization of the Pb(II) biosorption process using soybean biomass as the biosorbent when considering two constraints, the minimum dose of biosorbent and the maximum Pb(II) concentration in the initial solution (the other parameters taking appropriate values in the experimental field), will result in a 49% decrease in the sorbent dose, a 120% increase in the initial concentration of the metal ions in the solution, and a 40% decrease in the operating temperature. However, the maximum separation efficiency will decrease by about 26%.
- The optimization of the Pb(II) biosorption process using soybean waste biomass as a biomass, considering the two constraints presented above, will result in a decrease in the required amount of sorbent and an increase in the initial concentration of the ion in the solution, as in the case of Pb(II) biosorption on soybean biomass. The maximum separation efficiency will also decrease by 26%.
Therefore, soybean biomass and soybean waste biomass can ensure the same biosorption efficiency of Pb(II) under the same operating conditions.
- The optimization of the Cd(II) biosorption process on soybean biomass when considering two constraints, the minimum dose of biosorbent and the maximum Cd(II) concentration in the initial solution (the other parameters taking appropriate values in the experimental field), results in a decrease in the required amount of sorbent by 49%, increase the initial ion concentration by almost 119%, and also the operating temperature by almost 89%. Under these conditions, the maximum biosorption efficiency decreases by almost 26%.
- A similar situation is obtained in the case of Cd(II) biosorption on soybean waste biomass, in which case, for the two constraints imposed on those in Table 10, the efficiency of Cd(II) biosorption decreases by almost 22%.
- The optimization of the Zn(II) biosorption process on soybean biomass, when imposing the constraints of minimum sorbent dose and maximum Zn(II) concentration in the initial solution (similar to the previous situations), results in reducing the sorbent dose by almost 47%, an increase in the initial concentration of the metal ions in solution by about 116%, and also an increase in the operating temperature by almost 40%, as well as the reduction of the maximum value of the biosorption efficiency by almost 28%.
- The optimization of the Zn(II) biosorption process on soybean waste biomass under the abovementioned constraints results in a reduction of the biosorbent dose by almost 44%, an increase in the initial concentration of Zn(II) in the initial solution by 118%, and a decrease in the operating temperature by nearly 43%.
If the biosorption process is to be scaled-up, a cost–benefit analysis of the two optimization alternatives is required. Additionally, under these operating conditions with the constraints imposed, the values imposed by the regulations in force regarding the concentrations of heavy metal ions in the treated effluents can be reached, because the saved sorbent can be used in an additional biosorption cycle, ensuring an increased biosorption efficiency to comply with the regulations on the quality of liquid effluents in economic operating conditions.
Imposing these constraints in the process of optimizing the biosorption capacity q (minimization of the sorbent dose and maximization of the initial concentration of metal ions in solution) results in the same optimal values of parameters and the maximum biosorption capacity as in the case of optimization without the two constraints (see Table 13 vs. Table 11). The maximum values of R and q under the operating conditions presented in Table 10, Table 11, Table 12 and Table 13 were verified experimentally (for the highest probability of achieving the purpose of the objective function—solution 1) (Table 14 and Table 15).
Table 15.
Experimental values of R(%) during the validation of the optimal solutions in Table 12.
The experimental data presented in Table 14 and Table 15, which confirmed the solutions obtained from the optimization process, demonstrate a very important matter, i.e., that soy waste biomass can ensure a biosorption efficiency of the three metal ions similar to that obtained when using soybean biomass as a biosorbent, with great potential for scaling-up. All this information shows that both soybean biomass and soybean waste biomass can be used effectively as biosorbents to remove heavy metal ions from aqueous effluents under certain operating conditions, making it possible to exploit industrial soybean waste biomass, which cannot be used in animal feed due to the content of the extraction solvent.
5. Conclusions
The sustainable use of natural materials and their waste for the removal of heavy metal ions from aqueous effluents via biosorption requires the knowledge of the most favorable combinations of independent variables that determine the performance of the biosorption process to maximize the biosorption efficiency and biosorption capacity of biosorbents used. To this end, in this paper, the empirical mathematical modeling of the biosorption process of Pb(II), Cd(II), and Zn(II) ions on soybean-based biosorbents was performed by applying the Response Surface Methodology, followed by the optimization of the biosorption process, as prerequisites for scale-up. Two categories of natural biosorbents were used: soybean biomass and soybean waste biomass resulting from oil the extraction process of soy seeds.
The purpose of the modeling was to find the most probable mathematical relationships between the dependent variables (biosorption efficiency, R(%), and biosorption capacity, q(mg/g), and the residual concentration of metal ion in the solution) and process parameters (pH; sorbent dose, DS (g/L); initial concentration of metal ion in the solution, c0 (mg/L); contact time, tc (min); temperature, T (°C)) in order to find sets of solutions to maximize biosorption efficiency and biosorption capacity by applying specific optimization techniques. The models were validated using methods specific to multiple regression analysis and the results of the optimization process were validated experimentally.
An ANOVA confirmed the adequacy of the developed models ((Prob > F) < 0.05). The standard deviations are small and the values of the coefficient of determination (R2) are usually over 0.9. The high values of R2adj show that the total variations of R and q can be described by the elaborated models. Additionally, the values R2pred are in good agreement with R2adj, which demonstrates the correctness of the models in that they are well selected (and not as a consequence of the large number of variables). The sensitivity analysis of the models shows that the change in pH and the initial concentration of the metal in the solution significantly influences the biosorption process.
All this information showed that both soybean biomass and soybean waste biomass can be used effectively as biosorbents to remove heavy metal ions from aqueous effluents under certain operating conditions. Finally, a comparison was performed between the performances of the two biosorbents in terms of biosorption efficiency and biosorption capacity, which demonstrated, based on confirmed experimental data and through modeling and optimization, that soybean biomass waste performs similarly to soybean biomass.
Response Surface Methodology (RSM) was used as a mathematical and statistical tool to evaluate the effects of some factors on the performance of the process, namely, biosorption capacity and biosorption efficiency, and has proven to be a powerful tool for measuring optimal regional responses by analyzing a sequence of designed experiments. RSM was particularly useful because it reduced the number of tests required to find the optimal conditions, which were then validated experimentally.
The experimental program fulfilled in this paper demonstrates that biomass waste from the biofuel production industry can be used as a very efficient, low-cost biosorbent with which to remove heavy metals from water effluents in a sustainable way. The waste biomass can be exploited in environmental cleaning processes in accordance with the principles of the circular economy. These results require further research by conducting a cost–benefit analysis of optimized alternatives in order to scale-up the biosorption process to a larger scale.
Supplementary Materials
The following supporting information can be downloaded at: https://www.mdpi.com/article/10.3390/pr10030523/s1, Table S1. Equations of mathematical model for metal ion biosorption efficiency R(%) (a) and biosorption capacity q(mg/g) in coded (a) and real (b) coordinates. Table S2. Results of tests for model adequacy. Table S3. ANOVA for the polynomial (quadratic) model for R(%) in case of Pb(II) retention on soybean biomass and soybean waste biomass, respectively. Table S4. ANOVA for the polynomial (quadratic) model for q(mg/g) in case of Pb(II) retention on soybean biomass and soybean waste biomass, respectively.
Author Contributions
Conceptualization, L.B. and M.G.; methodology, L.B. and D.I.F.; formal analysis, L.B.; investigation, D.I.F. and L.B.; resources, L.B. and D.I.F.; data curation, L.B. and D.I.F.; writing—original draft preparation, L.B. and M.G.; writing—review and editing, L.B. and M.G.; visualization, D.I.F. and L.B.; supervision, L.B. and M.G.; project administration M.G.; funding acquisition, M.G. All authors have read and agreed to the published version of the manuscript.
Funding
This work was supported by a grant of the Romanian Ministry of Education and Research, CCCDI—UEFISCDI, project number PN-III-P2-2.1-PED-2019-5239, Contract no. 269PED/2020, within PNCDI III.
Institutional Review Board Statement
Not applicable.
Informed Consent Statement
Not applicable.
Data Availability Statement
Not applicable.
Conflicts of Interest
The authors declare no conflict of interest.
References
- Minelgaitė, A.; Liobikienė, G. Waste problem in European Union and its influence on waste management behaviours. Sci. Total Environ. 2019, 667, 86–93. [Google Scholar] [CrossRef] [PubMed]
- Cappellaro, F.; Fantin, V.; Barberio, G.; Cutaia, L. Circular economy good practices supporting waste prevention: The case of Emilia-Romagna region. Environ. Eng. Manag. J. 2020, 19, 1701–1710. [Google Scholar] [CrossRef]
- Ewijk, S.; Stegemann, J.A. Recognising waste use potential to achieve a circular economy. Waste Manag. 2020, 105, 1–7. [Google Scholar] [CrossRef]
- Ma, B.; Li, X.; Jiang, Z.; Jiang, J. Recycle more, waste more? When recycling efforts increase resource consumption. J. Clean. Prod. 2018, 206, 870–877. [Google Scholar] [CrossRef]
- Gavrilescu, M.; Fortuna, M.E.; Simion, I.M.; Ghinea, C.; Petraru, M.; Cozma, P.; Apostol, L.C.; Hlihor, R.M.; Fertu, D.T. Analysis and management of specific processes from environmental engineering and protection based on sustainability indicators. Environ. Eng. Manag. J. 2012, 11, 333–350. [Google Scholar] [CrossRef]
- Bian, Y.; Song, K.; Bai, J. Market segmentation, resource misallocation and environmental pollution. J. Clean. Prod. 2019, 228, 376–387. [Google Scholar] [CrossRef]
- Premarathna, K.; Rajapaksha, A.U.; Sarkar, B.; Kwon, E.E.; Bhatnagar, A.; Ok, Y.S.; Vithanage, M. Biochar-based engineered composites for sorptive decontamination of water: A review. Chem. Eng. J. 2019, 372, 536–550. [Google Scholar] [CrossRef]
- Dai, Y.; Sun, Q.; Wang, W.; Lu, L.; Liu, M.; Li, J.; Yang, S.; Sun, Y.; Zhang, K.; Xu, J.; et al. Utilizations of agricultural waste as adsorbent for the removal of contaminants: A review. Chemosphere 2018, 211, 235–253. [Google Scholar] [CrossRef]
- Filote, C.; Roșca, M.; Hlihor, R.M.; Cozma, P.; Simion, I.M.; Apostol, M.; Gavrilescu, M. Sustainable Application of Biosorption and Bioaccumulation of Persistent Pollutants in Wastewater Treatment: Current Practice. Processes 2021, 9, 1696. [Google Scholar] [CrossRef]
- Vareda, J.P.; Valente, A.J.M.; Durães, L. Assessment of heavy metal pollution from anthropogenic activities and remediation strategies: A review. J. Environ. Manag. 2019, 246, 101–118. [Google Scholar] [CrossRef]
- Zhang, L.; Zhu, G.; Ge, X.; Xu, G.; Guan, Y. Novel insights into heavy metal pollution of farmland based on reactive heavy metals (RHMs): Pollution characteristics, predictive models, and quantitative source apportionment. J. Hazard. Mater. 2018, 360, 32–42. [Google Scholar] [CrossRef] [PubMed]
- Jacob, J.M.; Karthik, C.; Saratale, R.G.; Kumar, S.S.; Prabakar, D.; Kadirvelu, K.; Pugazhendhi, A. Biological approaches to tackle heavy metal pollution: A survey of literature. J. Environ. Manag. 2018, 217, 56–70. [Google Scholar] [CrossRef] [PubMed]
- Zhang, L.; Zhao, B.; Xu, G.; Guan, Y. Characterizing fluvial heavy metal pollutions under different rainfall conditions: Implication for aquatic environment protection. Sci. Total Environ. 2018, 635, 1495–1506. [Google Scholar] [CrossRef] [PubMed]
- EL Hammoudani, Y.; Dimane, F.; El Ouarghi, H. Removal efficiency of heavy metals by a biological wastewater treatment plant and their potential risks to human health. Environ. Eng. Manag. J. 2021, 20, 995–1002. [Google Scholar] [CrossRef]
- Gavrilescu, M. Microbial recovery of critical metals from secondary sources. Bioresour. Technol. 2021, 344, 126208. [Google Scholar] [CrossRef]
- Nakagawa, K.; Imura, T.; Berndtsson, R. Distribution of heavy metals and related health risks through soil ingestion in rural areas of western Japan. Chemosphere 2021, 290, 133316. [Google Scholar] [CrossRef] [PubMed]
- Hu, G.; Bakhtavar, E.; Hewage, K.; Mohseni, M.; Sadiq, R. Heavy metals risk assessment in drinking water: An integrated probabilistic-fuzzy approach. J. Environ. Manag. 2019, 250, 109514. [Google Scholar] [CrossRef]
- Ahluwalia, S.S.; Goyal, D. Microbial and plant derived biomass for removal of heavy metal from wastewater. Bioresour. Technol. 2007, 98, 2243–2257. [Google Scholar] [CrossRef]
- Povar, I.; Zinicovscaia, I.; Ubaldini, S.; Spinu, O.; Pintilie, B.; Lupascu, T.; Duca, G. Thermodynamic analysis of heavy metals precipitation for their recovery from industrial wastewaters. Environ. Eng. Manag. J. 2020, 19, 281–288. [Google Scholar] [CrossRef]
- Rebello, S.; Sivaprasad, M.; Anoopkumar, A.; Jayakrishnan, L.; Aneesh, E.M.; Narisetty, V.; Sindhu, R.; Binod, P.; Pugazhendhi, A.; Pandey, A. Cleaner technologies to combat heavy metal toxicity. J. Environ. Manag. 2021, 296, 113231. [Google Scholar] [CrossRef]
- Thasneema, K.; Dipin, T.; Thayyil, M.S.; Sahu, P.K.; Messali, M.; Rosalin, T.; Elyas, K.; Saharuba, P.; Anjitha, T.; Ben Hadda, T. Removal of toxic heavy metals, phenolic compounds and textile dyes from industrial waste water using phosphonium based ionic liquids. J. Mol. Liq. 2020, 323, 114645. [Google Scholar] [CrossRef]
- Choumane, R.; Peulon, S. Development of an efficient electrochemical process for removing and separating soluble Pb(II) in aqueous solutions in presence of other heavy metals: Studies of key parameters. Chem. Eng. J. 2021, 423, 130161. [Google Scholar] [CrossRef]
- Daąbrowski, A.; Hubicki, Z.; Podkoscielny, P.; Robens, E. Selective removal of the heavy metal ions from waters and industrial wastewaters by ion-exchange method. Chemosphere 2004, 56, 91–106. [Google Scholar] [CrossRef] [PubMed]
- Rajivgandhi, G.; Gnanamangai, B.M.; Ramachandran, G.; Chackaravarthy, G.; Chelliah, C.K.; Maruthupandy, M.; Alharbi, N.S.; Kadaikunnan, S.; Li, W.-J. Effective removal of heavy metals in industrial wastewater with novel bioactive catalyst enabling hybrid approach. Environ. Res. 2021, 204, 112337. [Google Scholar] [CrossRef] [PubMed]
- Bilal, M.; Ihsanullah, I.; Younas, M.; Shah, M.U.H. Recent advances in applications of low-cost adsorbents for the removal of heavy metals from water: A critical review. Sep. Purif. Technol. 2021, 278, 119510. [Google Scholar] [CrossRef]
- Shrestha, R.; Ban, S.; Devkota, S.; Sharma, S.; Joshi, R.; Tiwari, A.P.; Kim, H.Y.; Joshi, M.K. Technological trends in heavy metals removal from industrial wastewater: A review. J. Environ. Chem. Eng. 2021, 9, 105688. [Google Scholar] [CrossRef]
- Bhatnagar, A.; Sillanpää, M. Utilization of agro-industrial and municipal waste materials as potential adsorbents for water treatment—A review. Chem. Eng. J. 2010, 157, 277–296. [Google Scholar] [CrossRef]
- Tudorache, D.I.F.; Gavrilescu, M. Application of natural zeolites as sorbents in the clean-up of aqueous streams. Environ. Eng. Manag. J. 2012, 11, 867–878. [Google Scholar]
- Gautam, R.K.; Mudhoo, A.; Lofrano, G.; Chattopadhyaya, M.C. Biomass-derived biosorbents for metal ions sequestration: Adsorbent modification and activation methods and adsorbent regeneration. J. Environ. Chem. Eng. 2014, 2, 239–259. [Google Scholar] [CrossRef]
- Zhou, Z.; Sun, Y.; Wang, Y.; Yu, F.; Ma, J. Adsorption behavior of Cu(II) and Cr(VI) on aged microplastics in antibiotics-heavy metals coexisting system. Chemosphere 2021, 291, 132794. [Google Scholar] [CrossRef]
- Apostol, L.C.; Gavrilescu, M. Application of natural materials as sorbents for persistent organic pollutants. Environ. Eng. Manag. J. 2009, 8, 243–252. [Google Scholar] [CrossRef]
- Shahrokhi-Shahraki, R.; Benally, C.; El-Din, M.G.; Park, J. High efficiency removal of heavy metals using tire-derived activated carbon vs commercial activated carbon: Insights into the adsorption mechanisms. Chemosphere 2020, 264, 128455. [Google Scholar] [CrossRef] [PubMed]
- Cao, F.; Lian, C.; Yu, J.; Yang, H.; Lin, S. Study on the adsorption performance and competitive mechanism for heavy metal contaminants removal using novel multi-pore activated carbons derived from recyclable long-root Eichhornia crassipes. Bioresour. Technol. 2019, 276, 211–218. [Google Scholar] [CrossRef]
- Ali, I.; Asim, M.; Khan, T.A. Low cost adsorbents for the removal of organic pollutants from wastewater. J. Environ. Manag. 2012, 113, 170–183. [Google Scholar] [CrossRef] [PubMed]
- De Gisi, S.; Lofrano, G.; Grassi, M.; Notarnicola, M. Characteristics and adsorption capacities of low-cost sorbents for wastewater treatment: A review. Sustain. Mater. Technol. 2016, 9, 10–40. [Google Scholar] [CrossRef] [Green Version]
- Esfandiar, N.; Suri, R.; McKenzie, E.R. Competitive sorption of Cd, Cr, Cu, Ni, Pb and Zn from stormwater runoff by five low-cost sorbents; Effects of co-contaminants, humic acid, salinity and pH. J. Hazard. Mater. 2021, 423, 126938. [Google Scholar] [CrossRef] [PubMed]
- Godage, N.H.; Gionfriddo, E. Use of natural sorbents as alternative and green extractive materials: A critical review. Anal. Chim. Acta 2020, 1125, 187–200. [Google Scholar] [CrossRef] [PubMed]
- Ata, A.; Nalcaci, O.O.; Ovez, B. Macro algae Gracilaria verrucosa as a biosorbent: A study of sorption mechanisms. Algal Res. 2012, 1, 194–204. [Google Scholar] [CrossRef]
- Demirbas, A. Heavy metal adsorption onto agro-based waste materials: A review. J. Hazard. Mater. 2008, 157, 220–229. [Google Scholar] [CrossRef] [PubMed]
- Ullrich, A.H.; Smith, M.W. The biosorption process of sewage and waste treatment. Sew. Ind. Wastes 1951, 23, 1248–1253. [Google Scholar]
- Kratochvil, D.; Volesky, B. Advances in the biosorption of heavy metals. Trends Biotechnol. 1998, 16, 291–300. [Google Scholar] [CrossRef]
- Lesmana, S.O.; Febriana, N.; Soetaredjo, V.; Sunarso, J.; Ismadji, S. Studies on potential applications of biomass for the separation of heavy metals from water and wastewater. Biochem. Eng. J. 2009, 44, 19–41. [Google Scholar] [CrossRef]
- Demey, H.; Melkior, T.; Chatroux, A.; Attar, K.; Thiery, S.; Miller, H.; Grateau, M.; Sastre, A.M.; Marchand, M. Evaluation of torrefied poplar-biomass as a low-cost sorbent for lead and terbium removal from aqueous solutions and energy co-generation. Chem. Eng. J. 2018, 361, 839–852. [Google Scholar] [CrossRef]
- Guérin, T.; Ghinet, A.; Hossart, M.; Waterlot, C. Wheat and ryegrass biomass ashes as effective sorbents for metallic and organic pollutants from contaminated water in lab-engineered cartridge filtration system. Bioresour. Technol. 2020, 318, 124044. [Google Scholar] [CrossRef]
- Bulgariu, L.; Ferţu, D.I.; Cara, I.G.; Gavrilescu, M. Efficacy of Alkaline-Treated Soy Waste Biomass for the Removal of Heavy-Metal Ions and Opportunities for Their Recovery. Materials 2021, 14, 7413. [Google Scholar] [CrossRef]
- Mobasherpour, I.; Salahi, E.; Pazouki, M. Comparative of the removal of Pb(II), Cd(II) and Ni(II) by nano crystallite hydroxyapatite from aqueous solutions: Adsorption isotherm study. Arab. J. Chem. 2012, 5, 439–446. [Google Scholar] [CrossRef]
- Al Hamouz, O.C.S.; Ali, S.A. Removal of Zinc and Cadmium ions using a cross-linked polyaminophosphonate. J. Macromol. Sci. Part A 2013, 50, 375–384. [Google Scholar] [CrossRef]
- Bashir, A.; Manzoor, T.; Malik, L.A.; Qureashi, A.; Pandith, A.H. Enhanced and Selective Adsorption of Zn(II), Pb(II), Cd(II), and Hg(II) Ions by a Dumbbell- and Flower-Shaped Potato Starch Phosphate Polymer: A Combined Experimental and DFT Calculation Study. ACS Omega 2020, 5, 4853–4867. [Google Scholar] [CrossRef]
- He, J.; Chen, P.A. A comprehensive review on biosorption of heavy metals by algal biomass: Materials, performances, chemistry, and modeling simulation tools. Bioresour. Technol. 2014, 160, 67–78. [Google Scholar] [CrossRef]
- Suzaki, P.Y.R.; Munaro, M.T.; Triques, C.C.; Kleinübing, S.J.; Klen, M.R.F.; Bergamasco, R.; Jorge, L.M.D.M. Phenomenological mathematical modeling of heavy metal biosorption in fixed-bed columns. Chem. Eng. J. 2017, 326, 389–400. [Google Scholar] [CrossRef]
- Laurent, J.; Casellas, M.; Dagot, C. Heavy metals biosorption on disintegrated activated sludge: Description of a new equilibrium model. Chem. Eng. J. 2010, 164, 63–69. [Google Scholar] [CrossRef]
- Özen, R.; Sayar, N.A.; Durmaz-Sam, S.; Sayar, A.A. A sigmoidal model for biosorption of heavy metal cations from aqueous media. Math. Biosci. 2015, 265, 40–46. [Google Scholar] [CrossRef] [PubMed]
- Moreira, V.R.; Lebron, Y.A.R.; Santos, L.V.D.S. Predicting the biosorption capacity of copper by dried Chlorella pyrenoidosa through response surface methodology and artificial neural network models. Chem. Eng. J. Adv. 2020, 4, 100041. [Google Scholar] [CrossRef]
- Blagojev, N.; Vasić, V.; Kukić, D.; Šćiban, M.; Prodanović, J.; Bera, O. Modelling and efficiency evaluation of the continuous biosorption of Cu(II) and Cr(VI) from water by agricultural waste materials. J. Environ. Manag. 2021, 281, 111876. [Google Scholar] [CrossRef] [PubMed]
- Sarubbo, L.A.; Filho, A.A.P.S.; Nascimento, L.A.D.; Rufino, R.D.; de Luna, J.M.; Brasileiro, P.P.F.; da Silva, C.F.S.; Benachour, M.; dos Santos, V.A. Study of an oily water treatment process in a pilot hybrid system combining air flotation and a constructed wetland: Data analysis, efficiency optimization and scale-up. Environ. Eng. Manag. J. 2021, 20, 247–256. [Google Scholar] [CrossRef]
- Jaafari, J.; Yaghmaeian, K. Optimization of heavy metal biosorption onto freshwater algae (Chlorella coloniales) using response surface methodology (RSM). Chemosphere 2018, 217, 447–455. [Google Scholar] [CrossRef]
- Khan, A.; Khan, M.S.; Hadi, F.; Saddiq, G.; Khan, A.N. Energy-Dispersive X-ray (EDX) fluorescence based analysis of heavy metals in marble powder, paddy soil and rice (Oryza sativa L.) with potential health risks in District Malakand, Khyber Pakhtunkhwa, Pakistan. Environ. Pollut. Bioavailab. 2021, 33, 301–316. [Google Scholar] [CrossRef]
- Lu, Z.; Hu, X.; Lu, Y. Particle Morphology Analysis of Biomass Material Based on Improved Image Processing Method. Int. J. Anal. Chem. 2017, 2017, 5840690. [Google Scholar] [CrossRef]
- UK College of Engineering. Sample Preparation for Electron Microscopy; University of Kentucky: Lexington, KY, USA; Available online: http://emc.engr.uky.edu/equipment/sample-preparation-electron-microscopy (accessed on 20 January 2022).
- Box, G.E.P.; Wilson, K.B. On the experimental attainment of optimum condition. J.R. Stat. Soc. Ser. B. Methods 1951, 13, 1–45. [Google Scholar] [CrossRef]
- Witek-Krowiak, A.; Chojnacka, K.; Podstawczyk, D.; Dawiec, A.; Pokomeda, K. Application of response surface methodology and artificial neural network methods in modelling and optimization of biosorption process. Bioresour. Technol. 2014, 160, 150–160. [Google Scholar] [CrossRef]
- Leupin, O.X.; Hug, S.J. Oxidation and removal of arsenic (III) from aerated groundwater by filtration through sand and zero-valent iron. Water Res. 2005, 39, 1729–1740. [Google Scholar] [CrossRef] [PubMed]
- Sheikh, Z.; Amin, M.; Khan, N.; Khan, M.N.; Sami, S.K.; Khan, S.B.; Hafeez, I.; Khan, S.A.; Bakhsh, E.M.; Cheng, C.K. Potential application of Allium Cepa seeds as a novel biosorbent for efficient biosorption of heavy metals ions from aqueous solution. Chemosphere 2021, 279, 130545. [Google Scholar] [CrossRef] [PubMed]
- Zhang, C.; Ren, H.X.; Zhong, C.Q.; Wu, D. Biosorption of Cr(VI) by immobilized waste biomass from polyglutamic acid production. Sci. Rep. 2020, 10, 3705. [Google Scholar] [CrossRef] [PubMed] [Green Version]
- Sheng, P.X.; Ting, Y.P.; Chen, J.P.; Hong, L. Sorption of lead, copper, cadmium, zinc, and nickel by marine algal biomass: Characterization of biosorptive capacity and investigation of mechanisms. J. Colloid Interface Sci. 2004, 275, 131–141. [Google Scholar] [CrossRef] [PubMed]
- Jalali, R.; Ghafourian, H.; Asef, Y.; Davarpanah, S.; Sepehr, S. Removal and recovery of lead using nonliving biomass of marine algae. J. Hazard. Mater. 2002, 92, 253–262. [Google Scholar] [CrossRef]
- Isam, M.; Baloo, L.; Kutty, S.R.M.; Yavari, S. Optimisation and Modelling of Pb(II) and Cu (II) Biosorption onto Red Algae (Gracilaria changii) by Using Response Surface Methodology. Water 2019, 11, 2325. [Google Scholar] [CrossRef] [Green Version]
- Gavrilescu, M. Removal of Heavy Metals from the Environment by Biosorption. Eng. Life Sci. 2004, 4, 219–232. [Google Scholar] [CrossRef]
- Gavrilescu, M. Biosorption in environmental remediation. In Bioremediation Technology; Fulekar, M.H., Ed.; Springer: Dordrecht, The Netherlands, 2010; pp. 35–99. [Google Scholar]
- Beni, A.A.; Esmaeili, A. Biosorption, an efficient method for removing heavy metals from industrial effluents: A Review. Environ. Technol. Innov. 2019, 17, 100503. [Google Scholar] [CrossRef]
- Sibi, G. Biosorption of chromium from electroplating and galvanizing industrial effluents under extreme conditions using Chlorella vulgaris. Green Energy Environ. 2016, 1, 172–177. [Google Scholar] [CrossRef] [Green Version]
- Dhanarani, S.; Viswanathan, E.; Piruthiviraj, P.; Arivalagan, P.; Kaliannan, T. Comparative study on the biosorption of aluminum by free and immobilized cells of Bacillus safensis KTSMBNL 26 isolated from explosive contaminated soil. J. Taiwan Inst. Chem. Eng. 2016, 69, 61–67. [Google Scholar] [CrossRef]
- Cholico-González, D.; Lara, N.O.; Macedo, A.M.F.; Salas, J.C. Adsorption Behavior of Pb(II), Cd(II), and Zn(II) onto Agave Bagasse, Characterization, and Mechanism. ACS Omega 2020, 5, 3302–3314. [Google Scholar] [CrossRef] [PubMed]
- Salem, N.D.; Awwad, A.; Al-Dujaili, A. Biosorption of Pb(II), Zn(II), and Cd(II) from aqueous solutions by (Eriobotrya japonica) loquat bark. Int. J. Environ. Prot. 2002, 2, 1–7. [Google Scholar]
- Lezcano, J.M.; Gonzalez, F.; Ballester, A.; Blázquez, M.L.; Muñoz, J.A.; García-Balboa, C. Biosorption of Cd(II), Cu(II), Ni(II), Pb(II) and Zn(II) using different residual biomass. Chem. Ecol. 2010, 26, 1–17. [Google Scholar] [CrossRef]
- Amer, M.; Ahmad, R.A.; Awwad, A.M. Biosorption of Cu(II), Ni(II), Zn(II) and Pb(II) ions from aqueous solution by Sophora japonica pods powder. Int. J. Ind. Chem. 2015, 6, 67–75. [Google Scholar] [CrossRef] [Green Version]
- Kamar, F.H.; Nechifor, A.C.; Nechifor, G.; Al-Musawi, T.J.; Mohammed, A.H. Aqueous phase biosorption of Pb(II), Cu(II), and Cd(II) onto cabbage leaves powder. Int. J. Chem. React. Eng. 2016, 15, 20150178. [Google Scholar] [CrossRef]
- Sulaymon, A.; Mohammed, A.A.; Al-Musawi, T.J. Removal of lead, cadmium, copper, and arsenic ions using biosorption: Equilibrium and kinetic studies. Desalination Water Treat. 2013, 51, 4424–4434. [Google Scholar] [CrossRef]
- Anwar, J.; Shafique, U.; Zaman, W.U.; Salman, M.; Dar, A.; Anwar, S. Removal of Pb(II) and Cd(II) from water by adsorption on peels of banana. Bioresour. Technol. 2010, 101, 1752–1755. [Google Scholar] [CrossRef]
- Ezeonuegbu, B.A.; Machido, D.A.; Whong, C.M.; Japhet, W.S.; Alexiou, A.; Elazab, S.T.; Qusty, N.; Yaro, C.A.; Batiha, G.E.-S. Agricultural waste of sugarcane bagasse as efficient adsorbent for lead and nickel removal from untreated wastewater: Biosorption, equilibrium isotherms, kinetics and desorption studies. Biotechnol. Rep. 2021, 30, e00614. [Google Scholar] [CrossRef]
- Ozdemir, S.; Kılınç, E.; Acer, Ö.; Soylak, M. Simultaneous preconcentrations of Cu(II), Ni(II), and Pb(II) by SPE using E. profundum loaded onto Amberlite XAD-4. Microchem. J. 2021, 171, 106758. [Google Scholar] [CrossRef]
- MacFarland, T.W. Two-Way Analysis of Variance: Statistical Tests and Graphics Using R; Springer Nature: Cham, Switzerland, 2012. [Google Scholar]
- Myers, R.H.; Montgomery, D.C.; Anderson-Cook, C.M. Response Surface Methodology: Process and Product Optimization Using Designed Experiments, 4th ed.; Wiley: Hoboken, NJ, USA, 2016; ISBN 9781118916025. [Google Scholar]
- Chattoraj, N.K.; Mondal, B.; Das, P.; Roy, B.; Sadhukan, B. Biosorption of carbaryl from aqueous solution onto Pistia stratiotes biomass. Appl. Water Sci. 2014, 4, 79–88. [Google Scholar] [CrossRef] [Green Version]
- Sadhukhan, B.; Mondal, N.K.; Chattoraj, S. Optimization using central composite design (CCD) and the desirability function for sorption of methylene blue from aqueous solutions onto Lemna major. Karbala Int. J. Mod. Sci. 2016, 2, 145–155. [Google Scholar] [CrossRef] [Green Version]
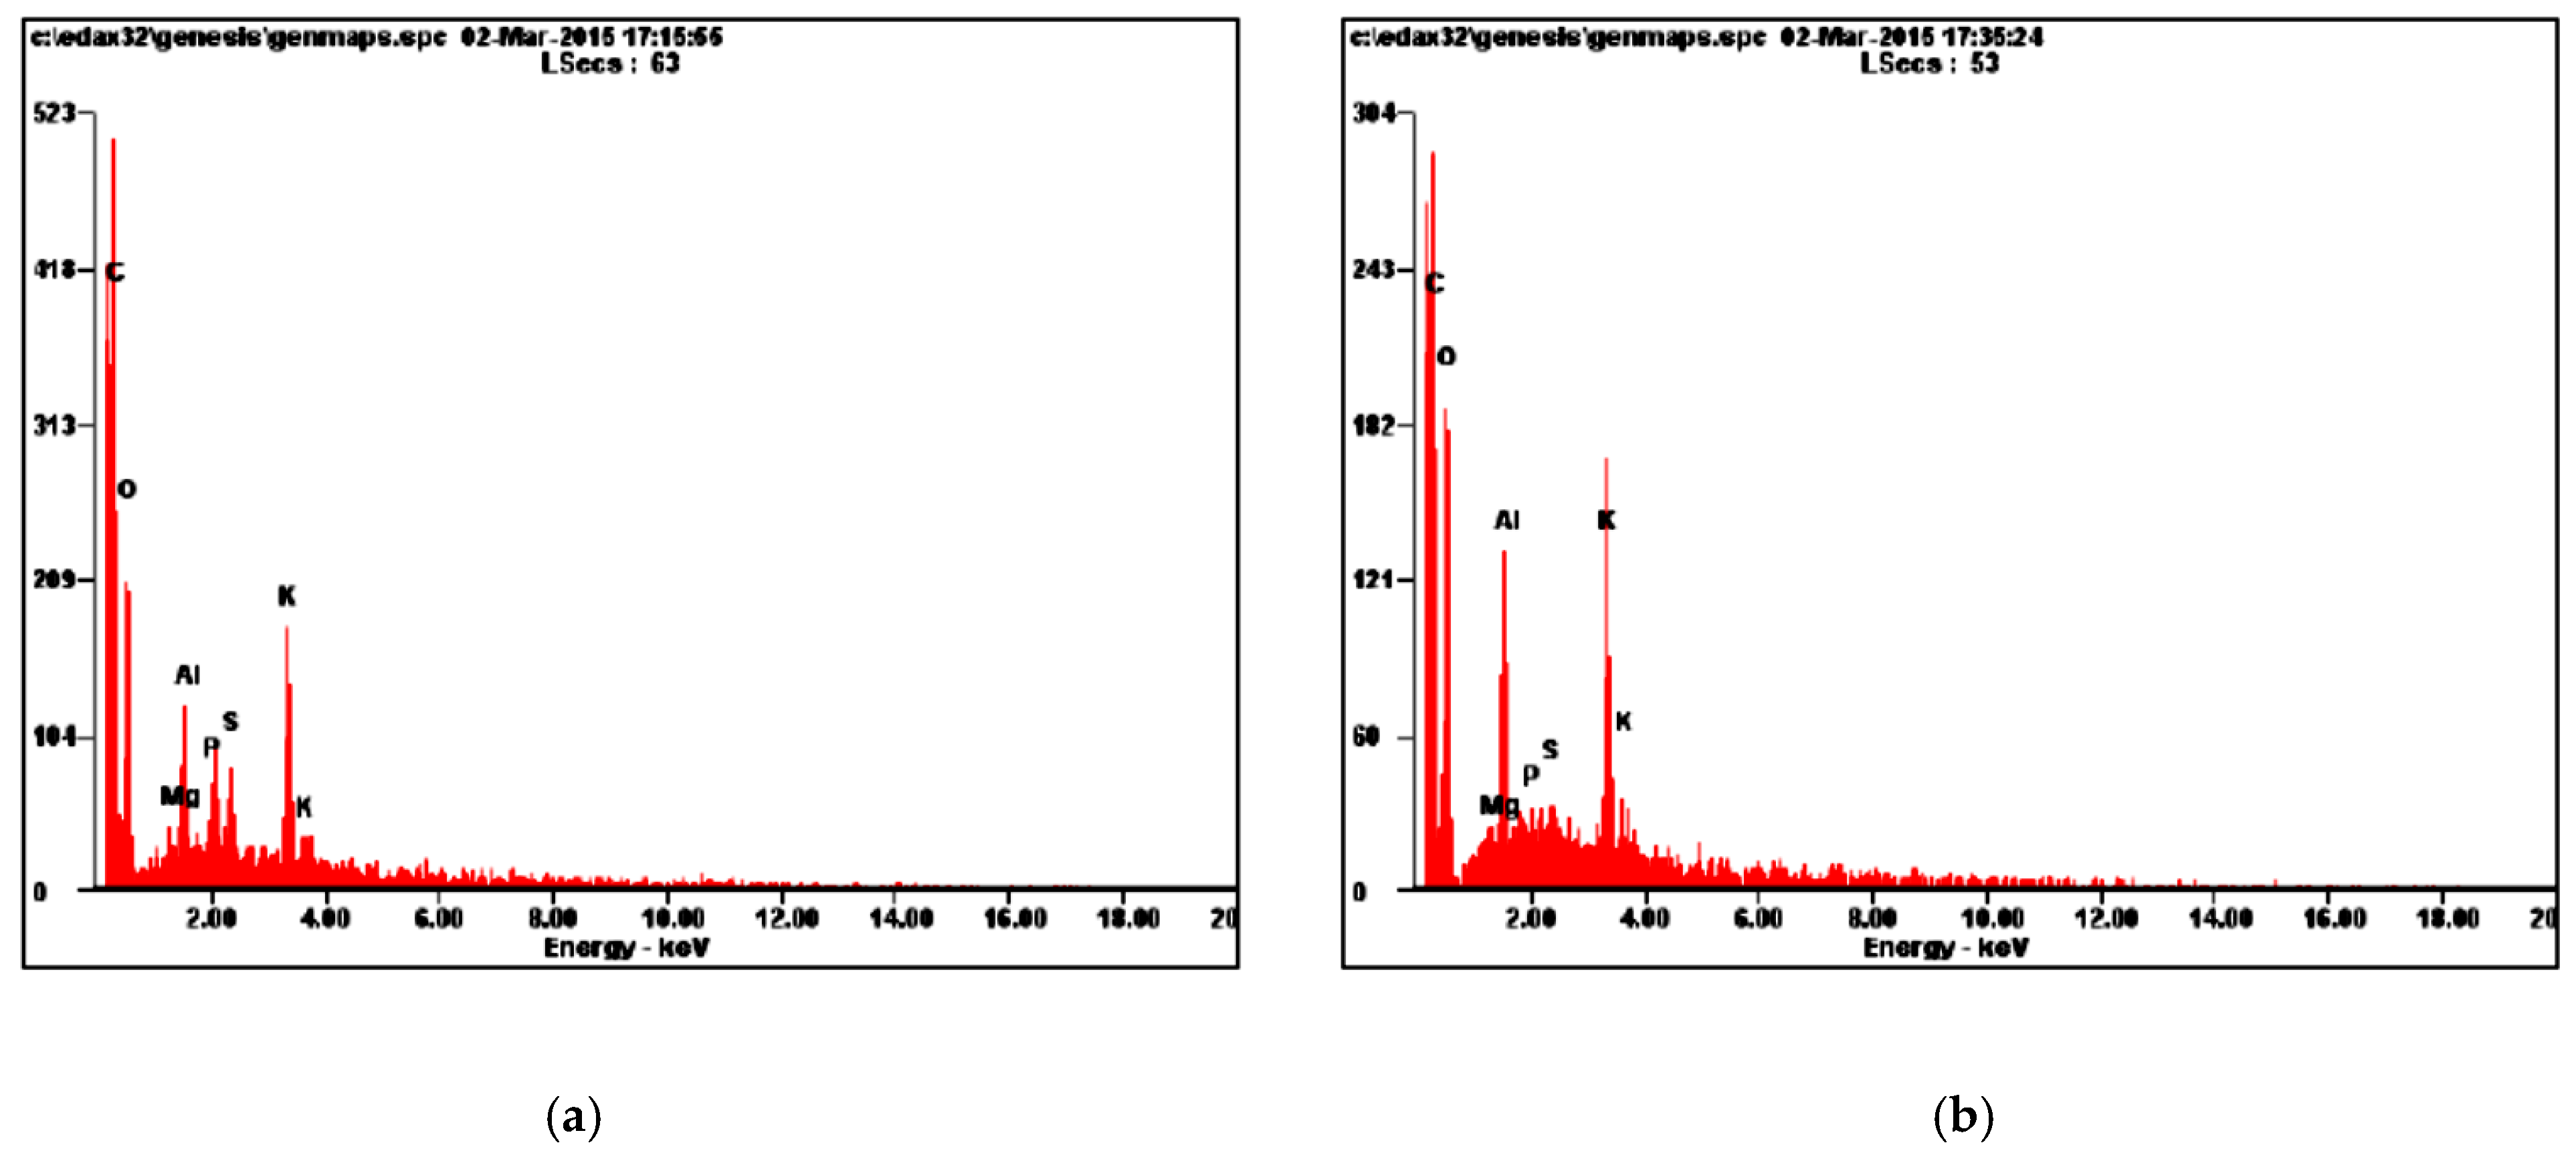
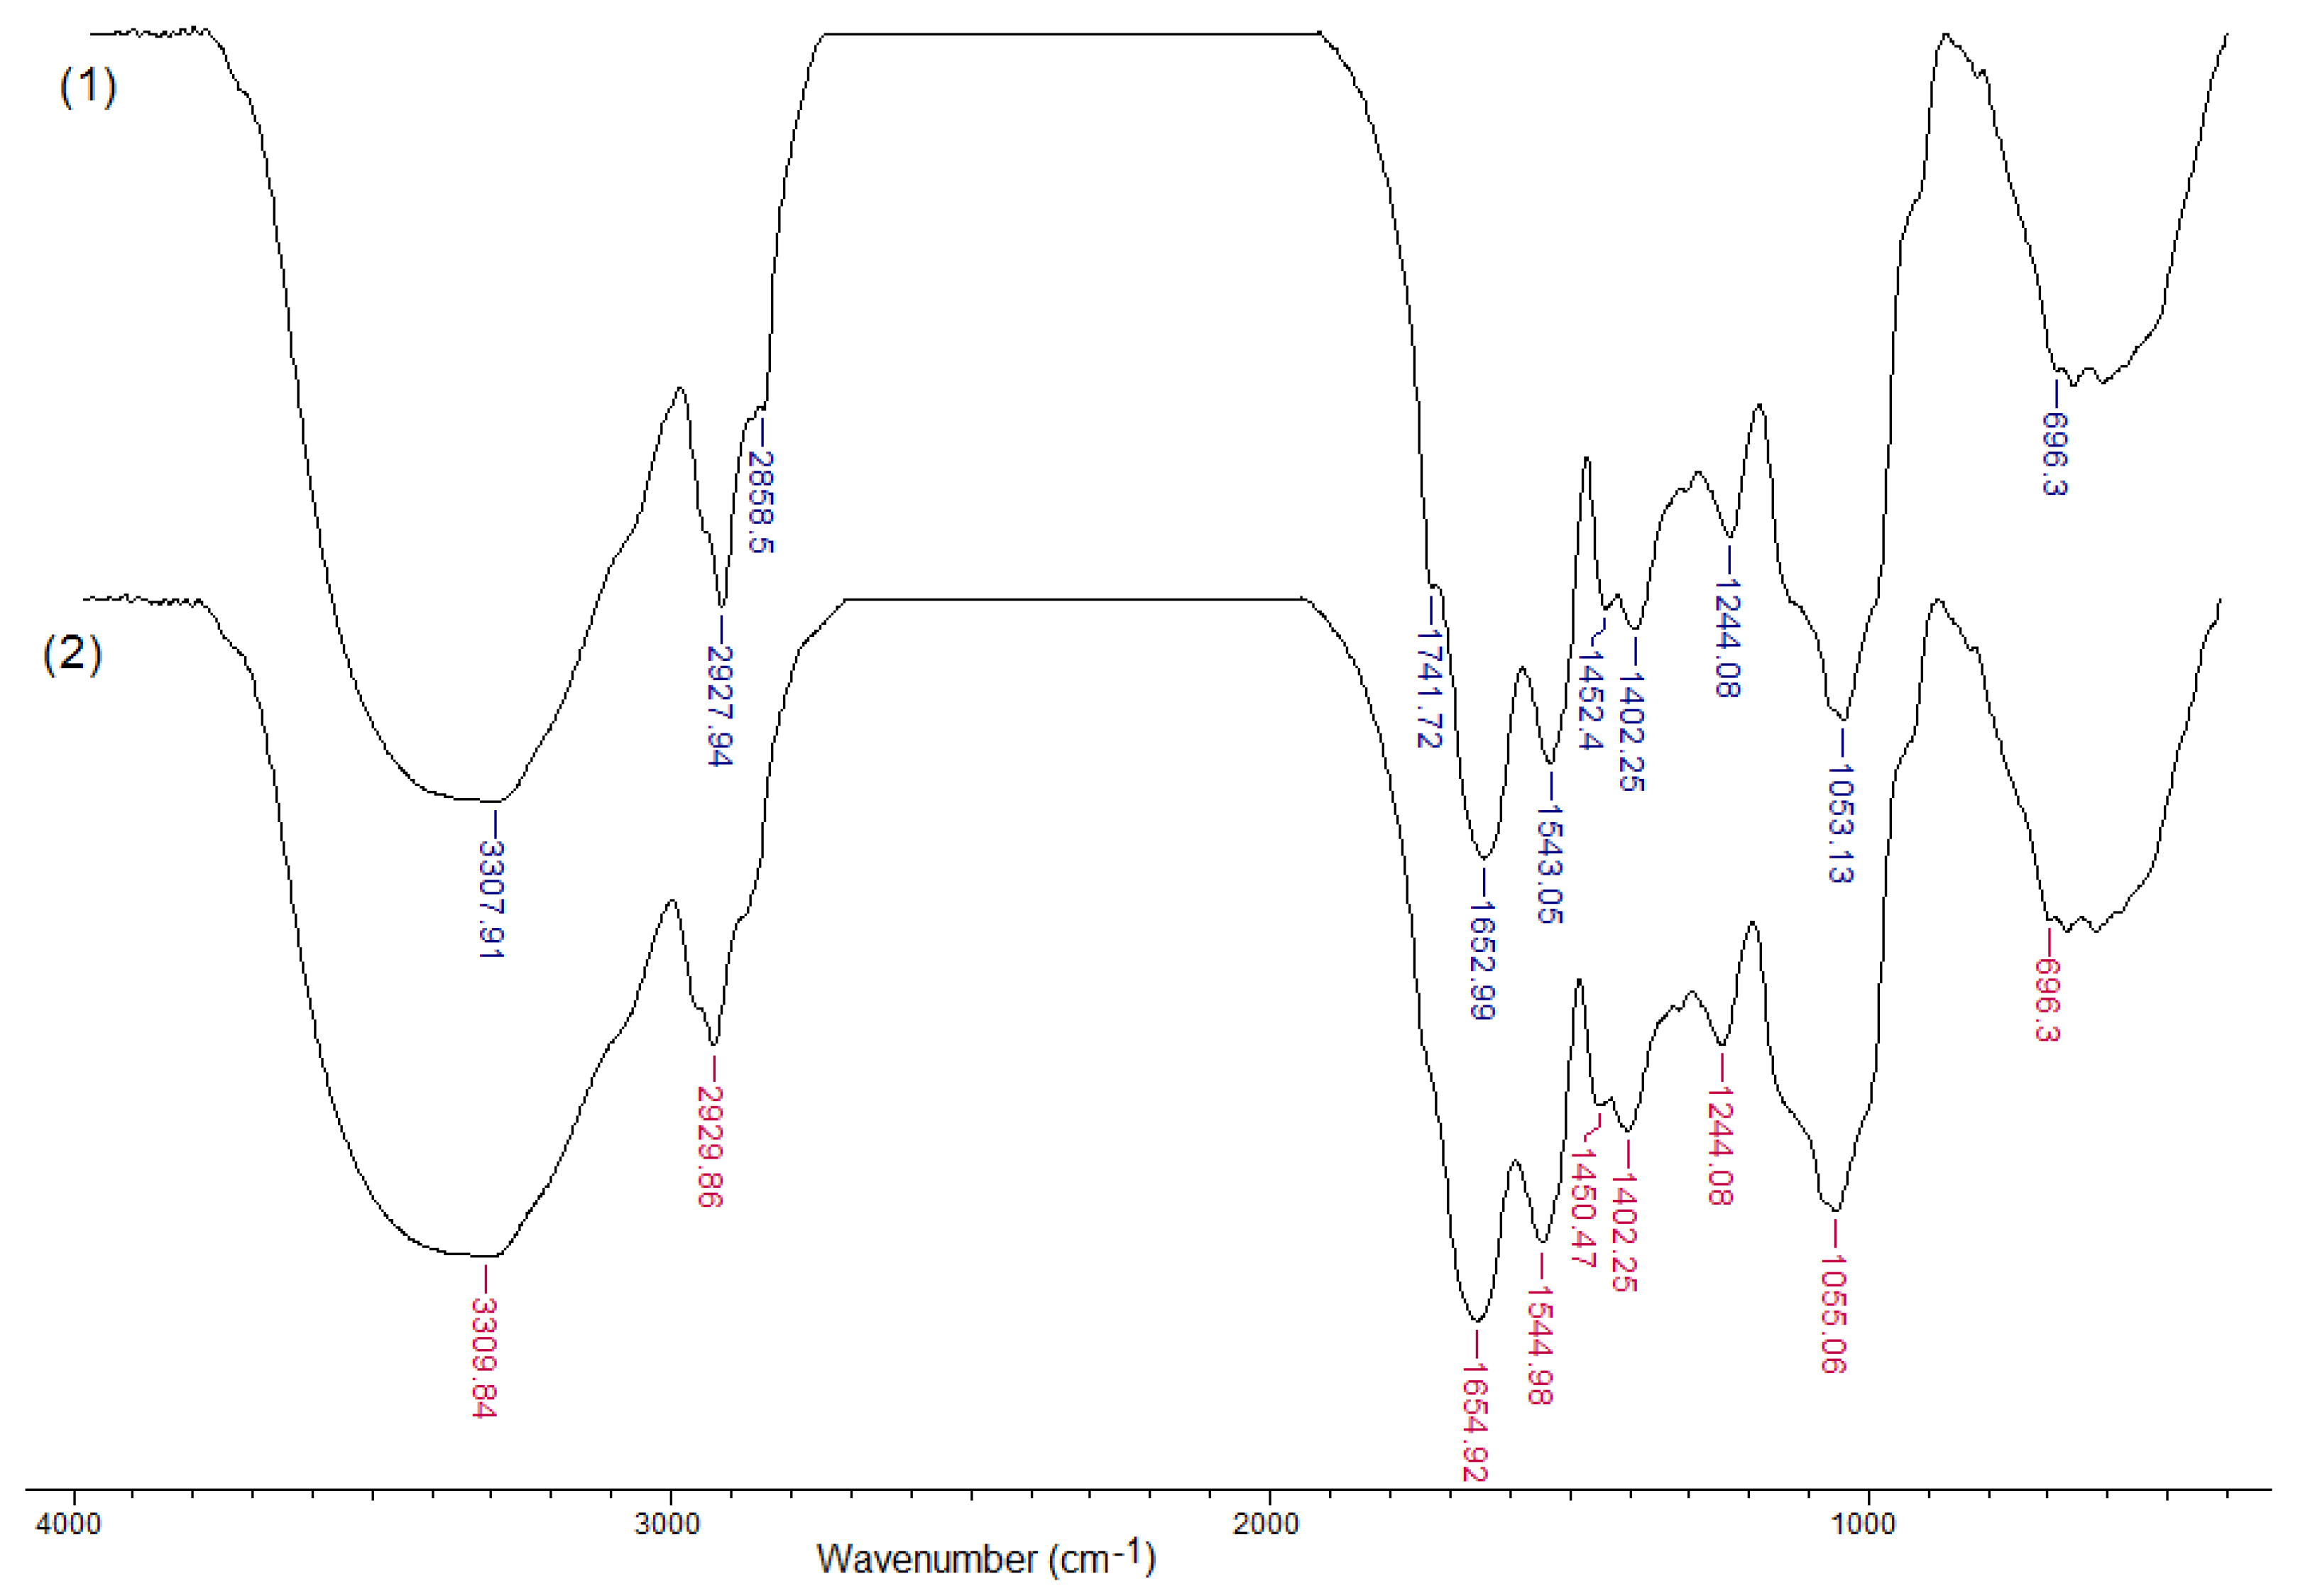

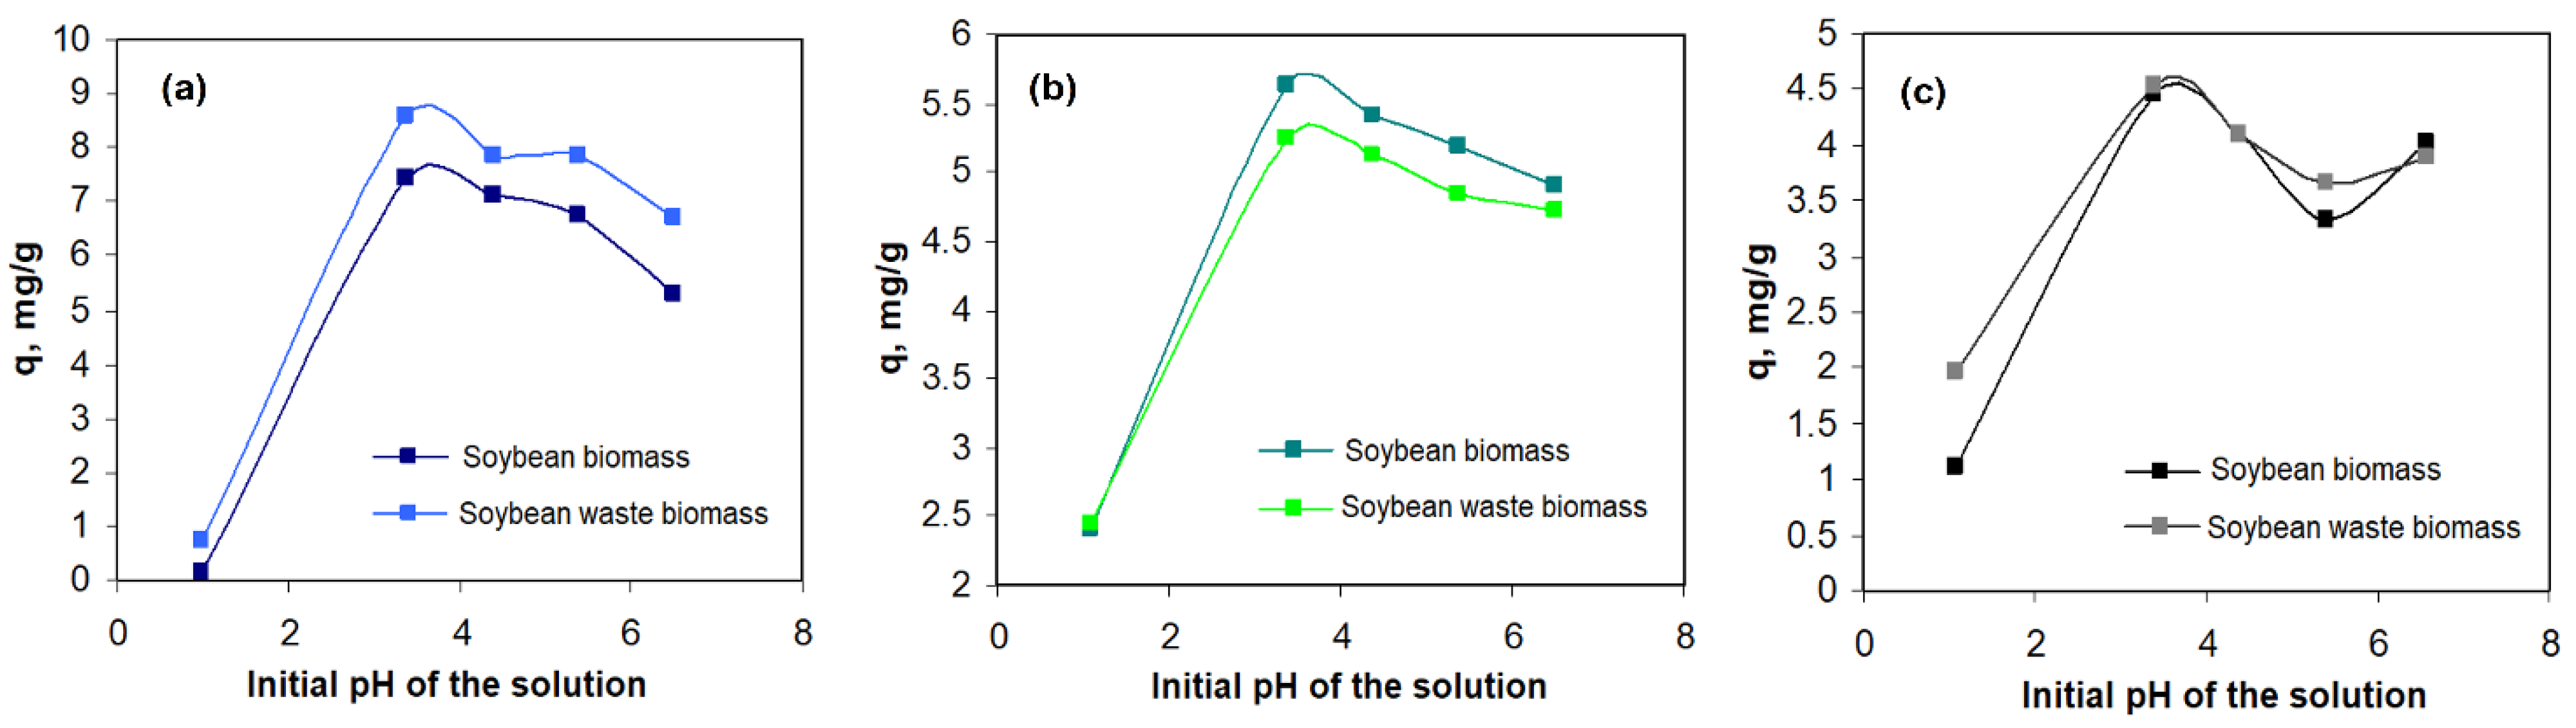
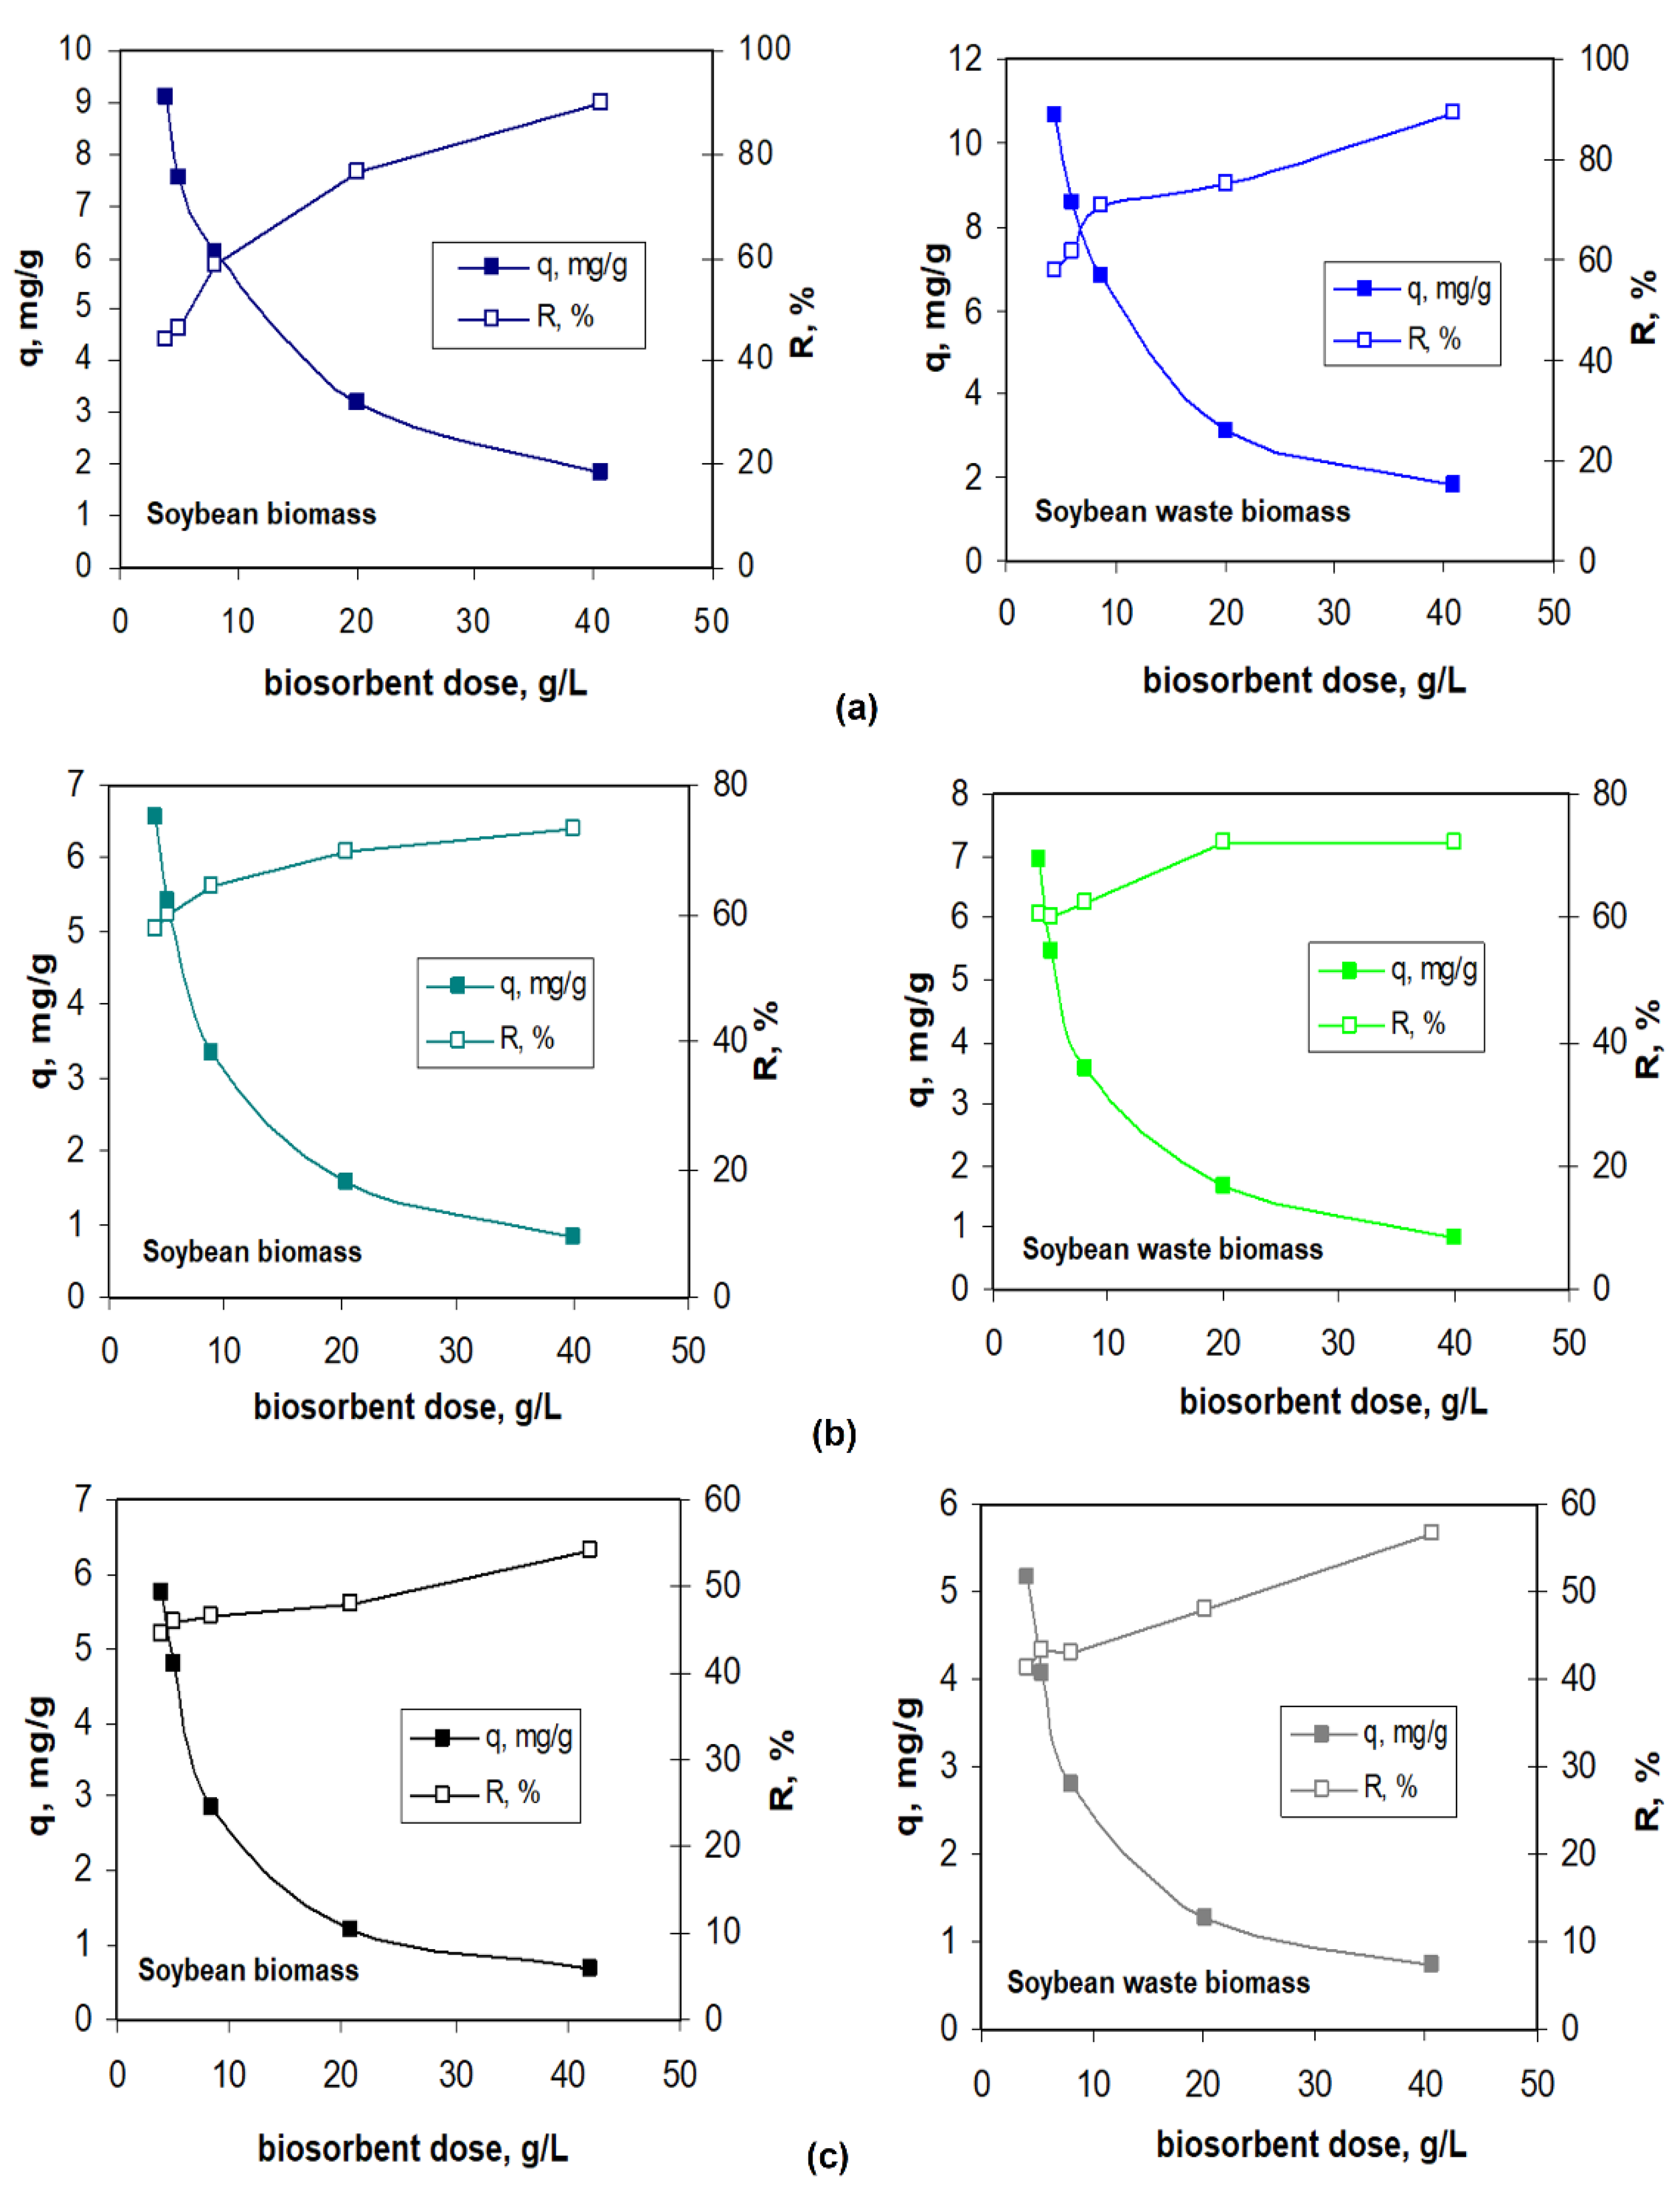
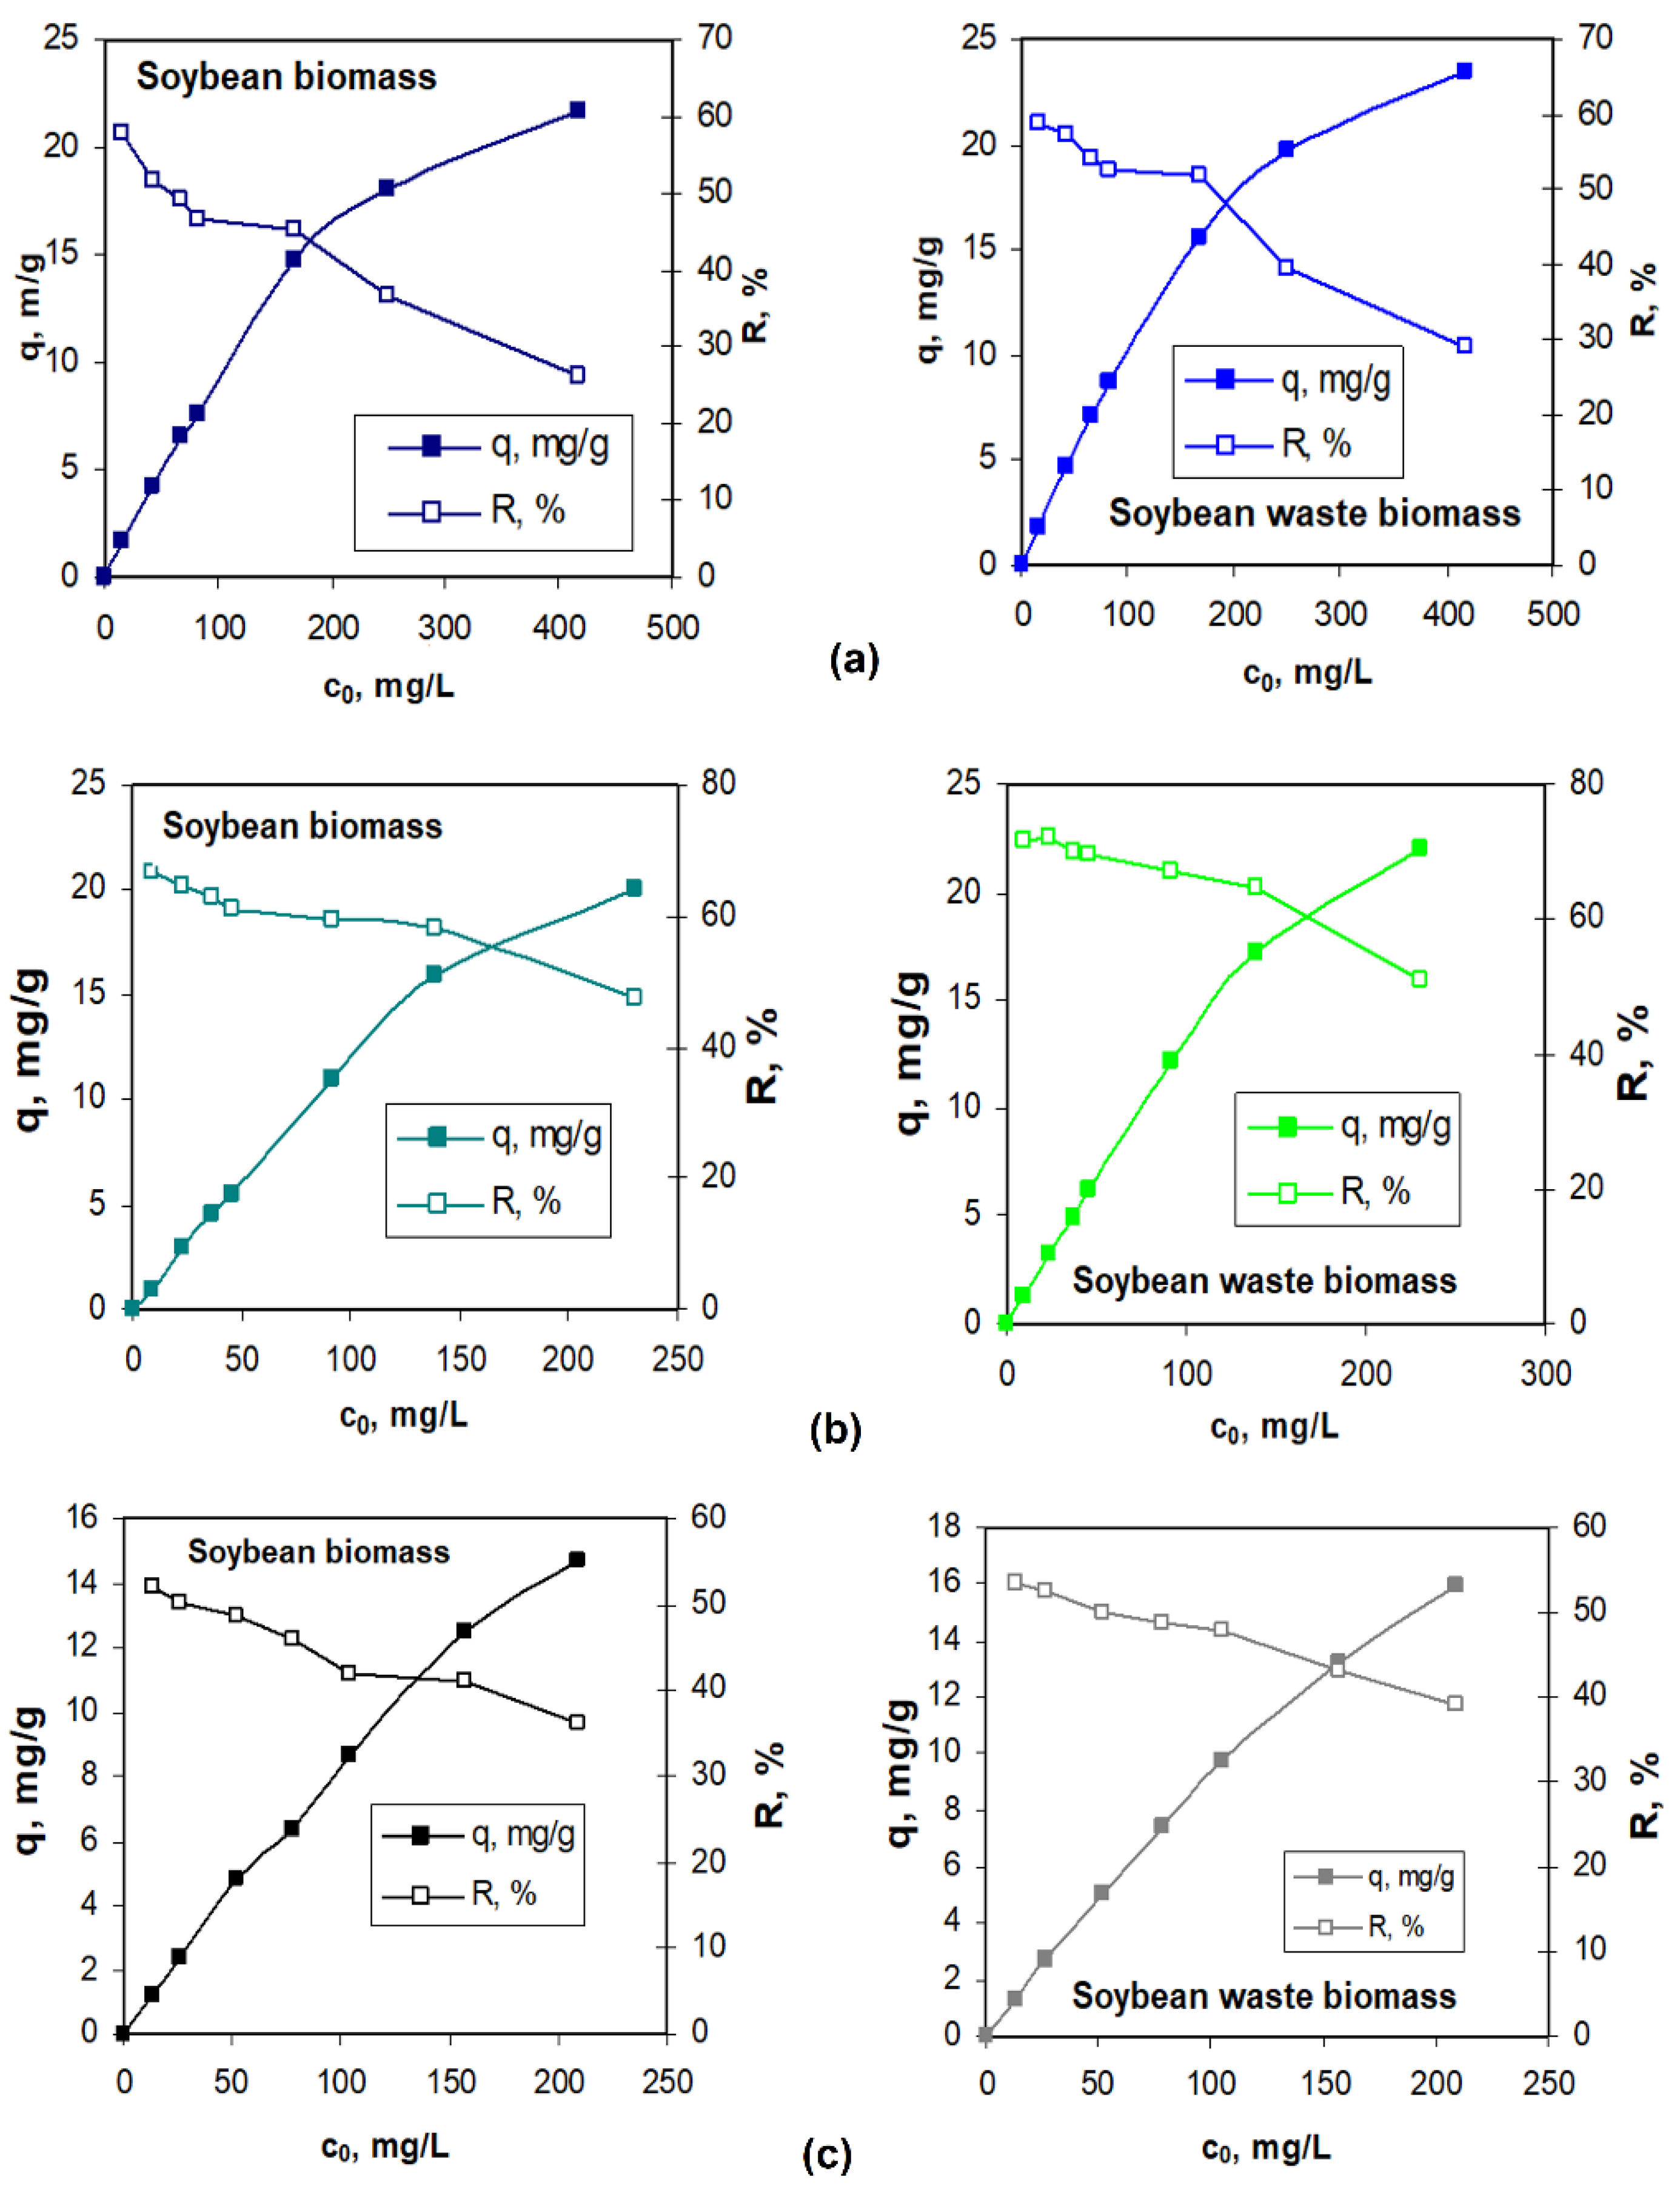
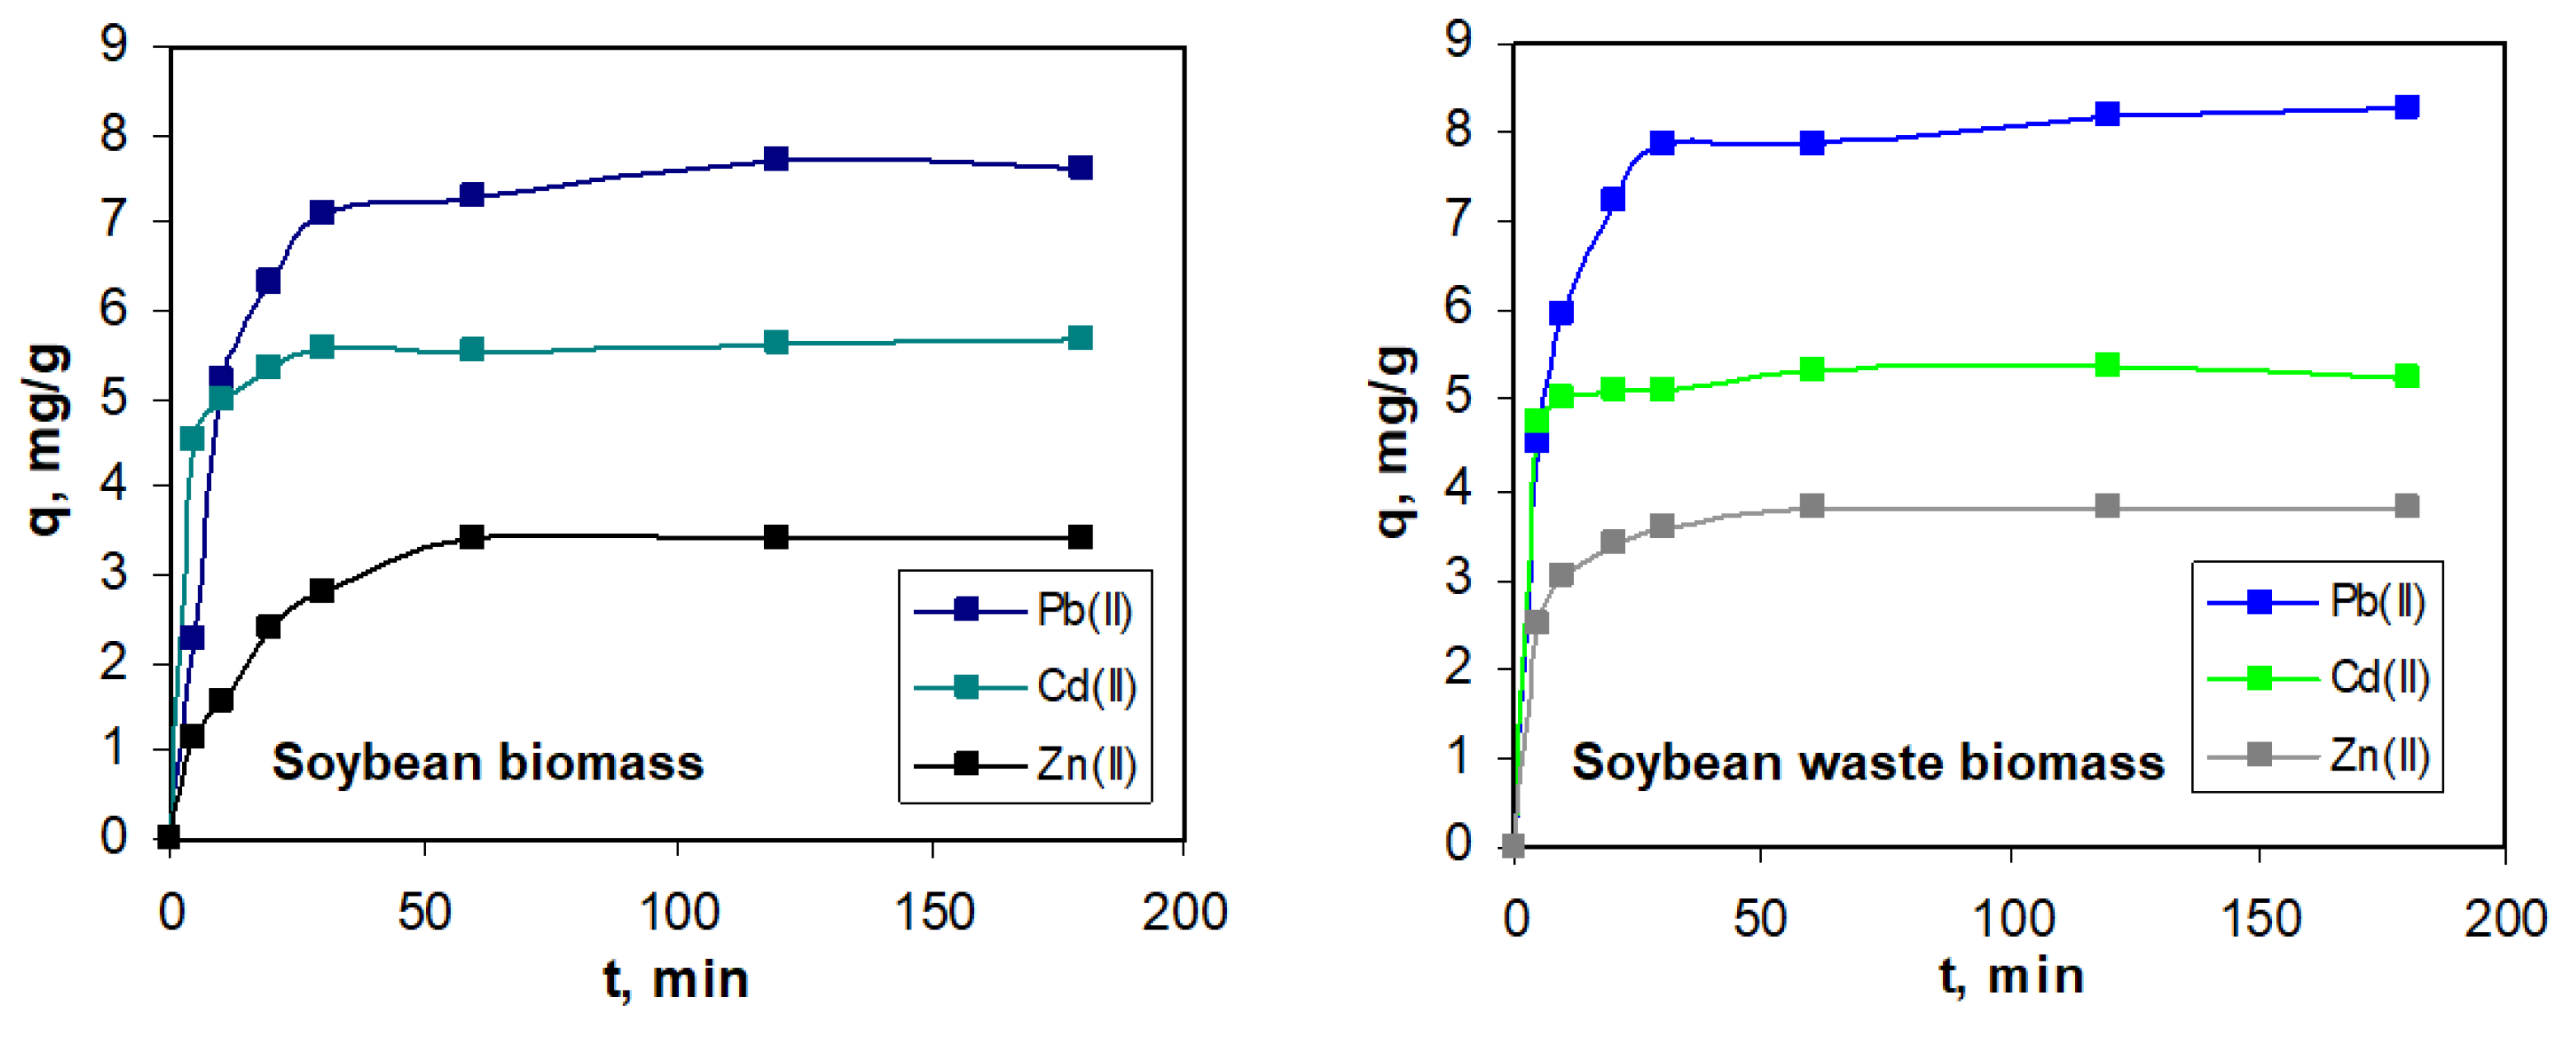
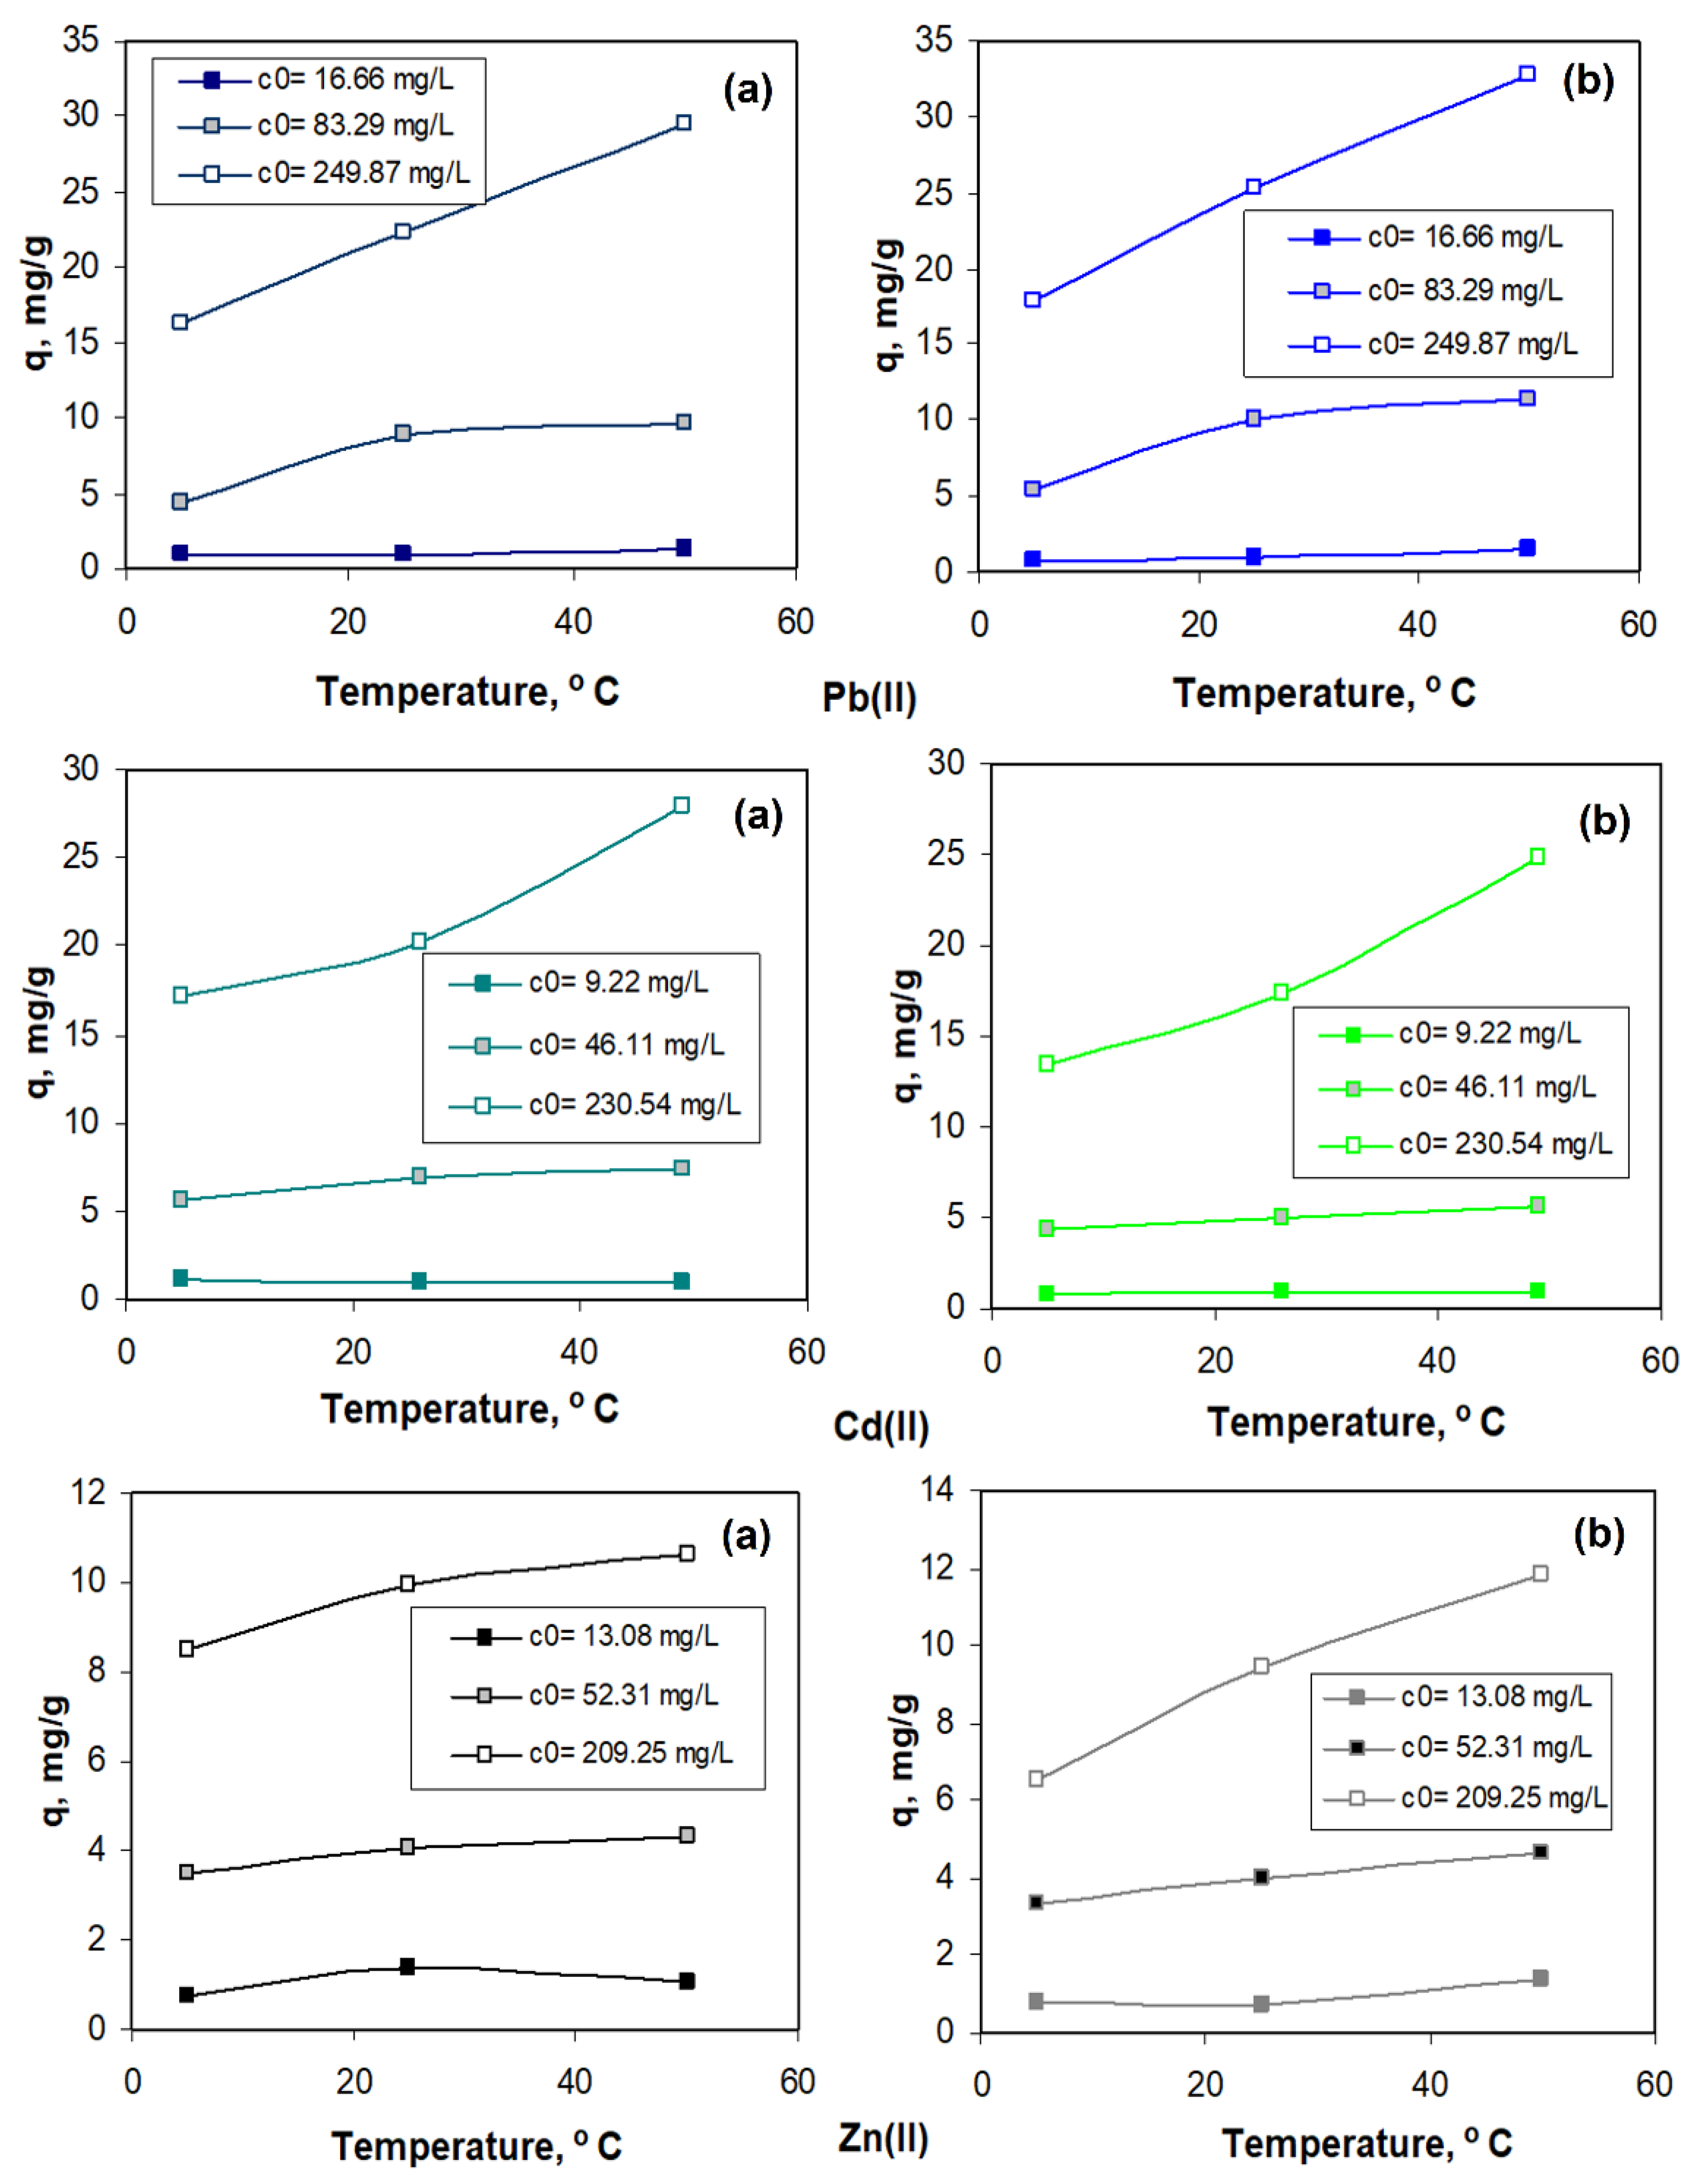
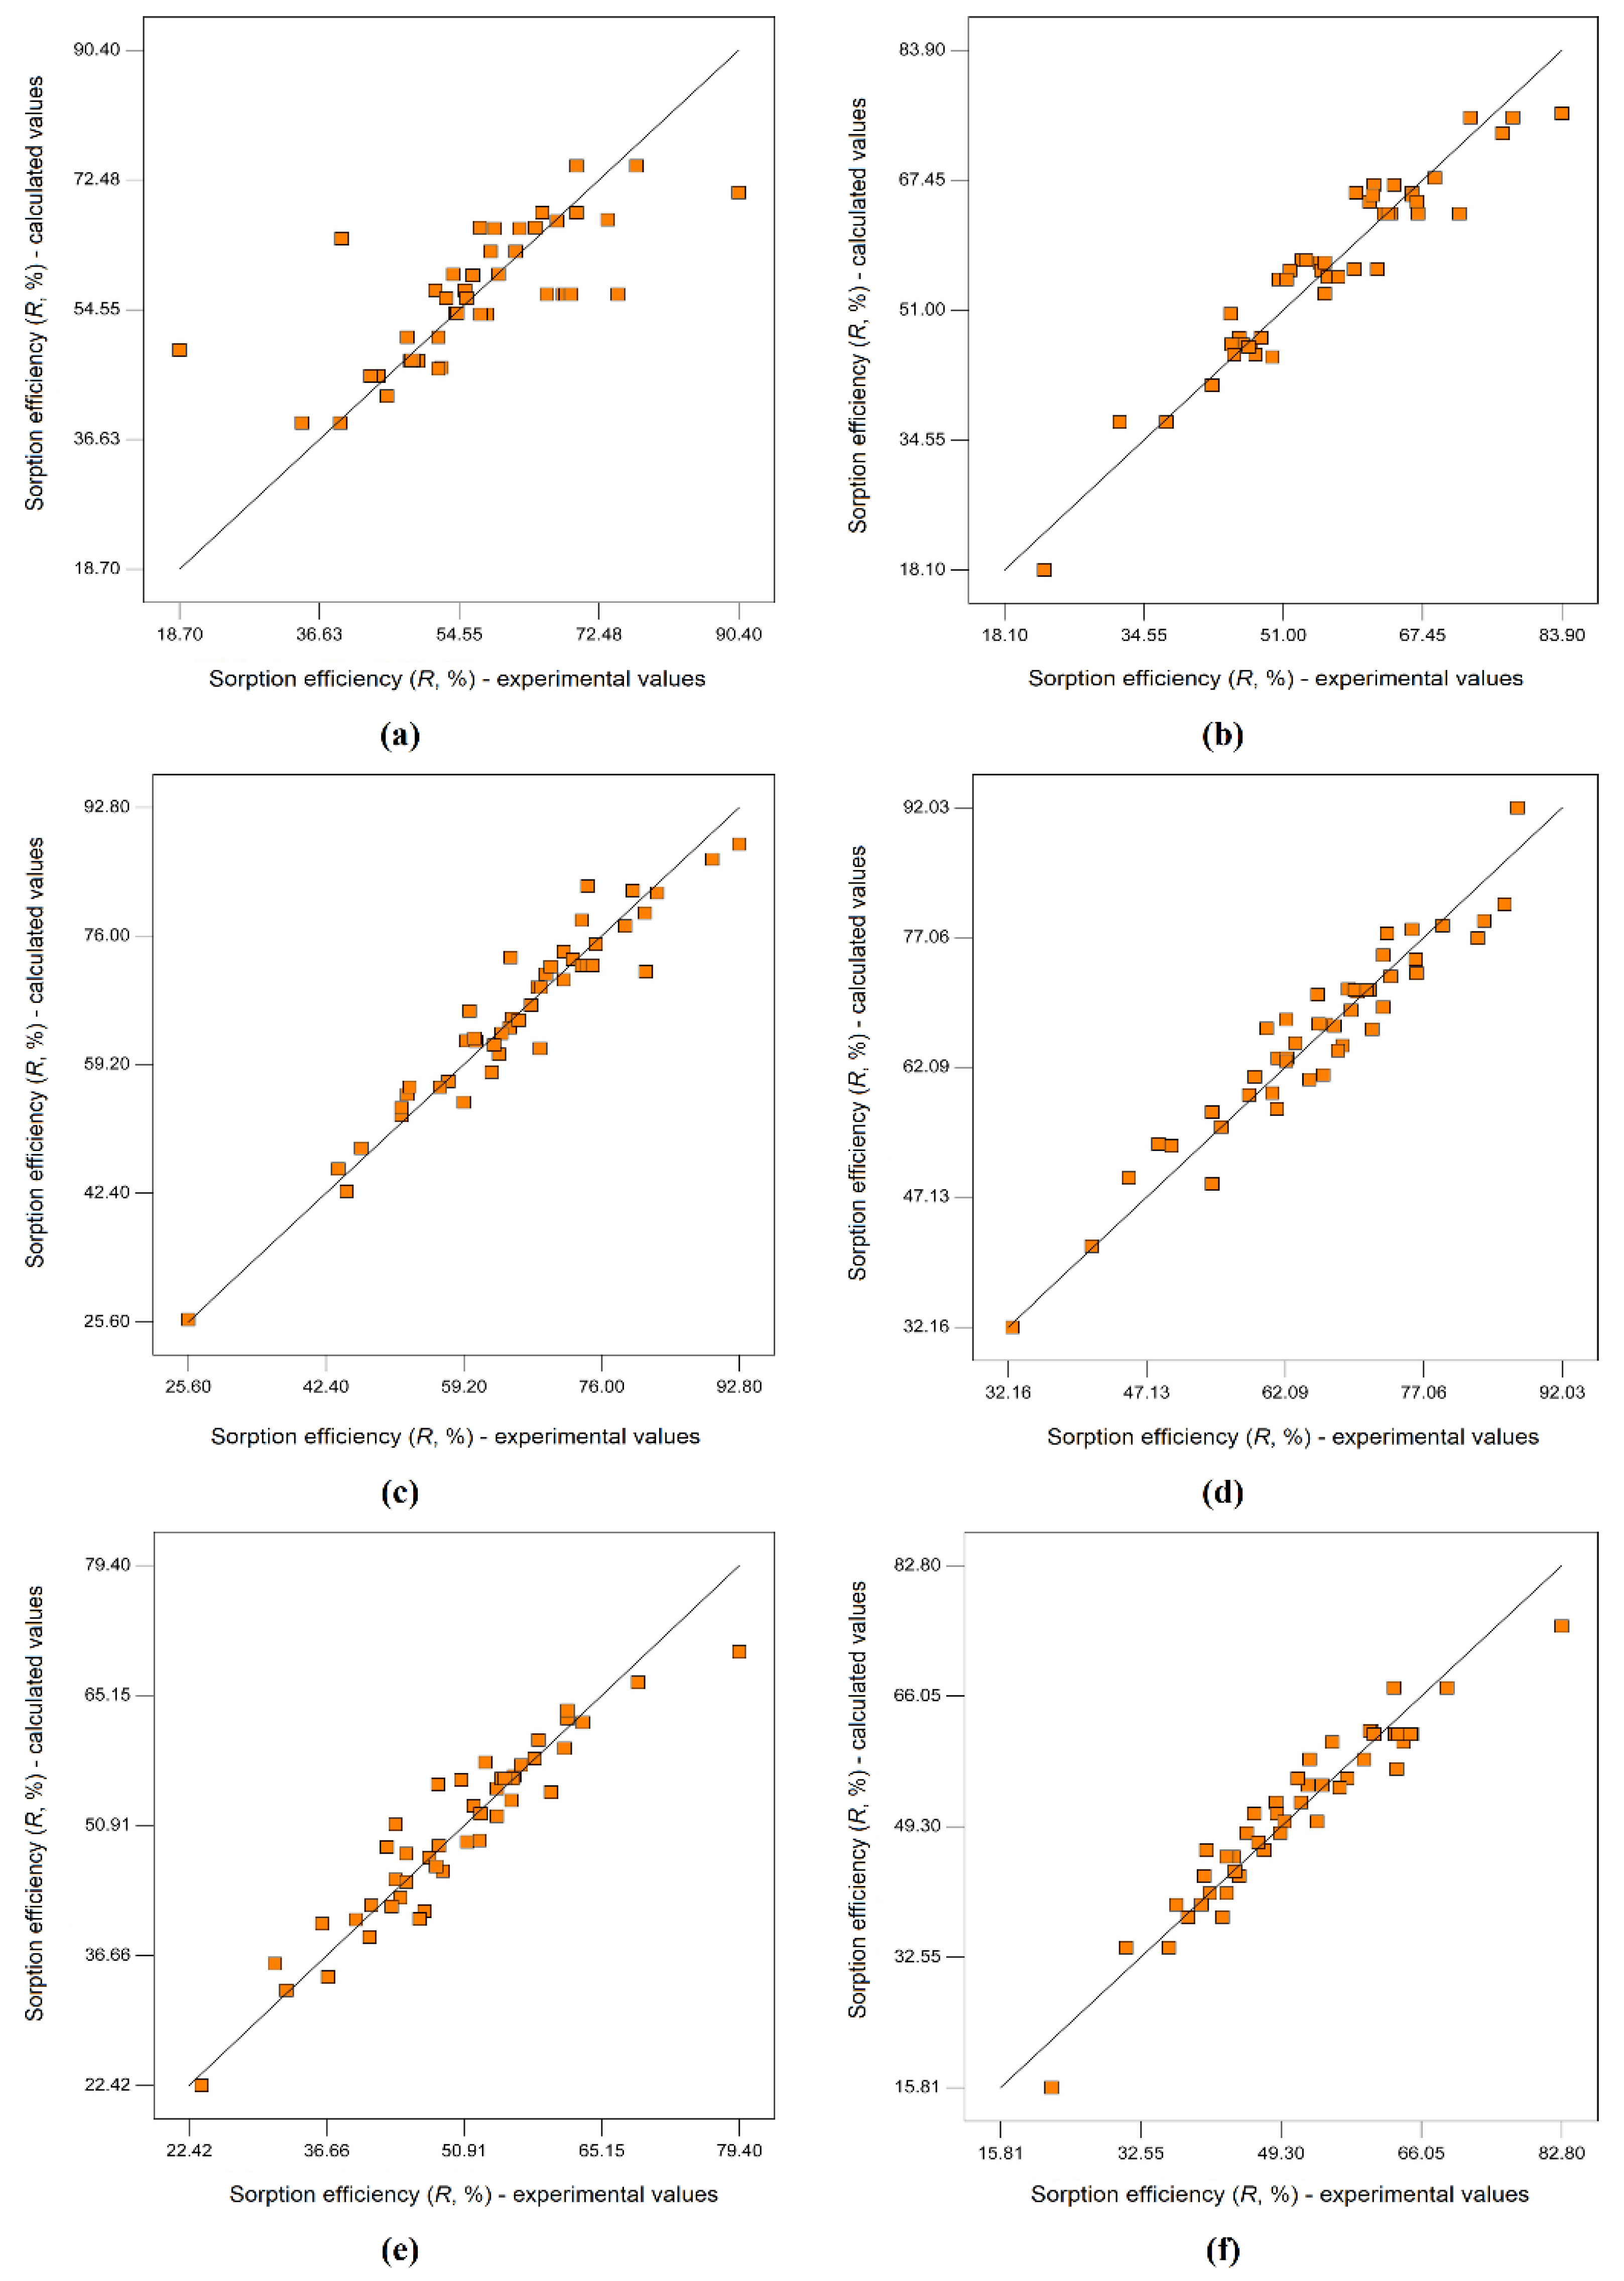
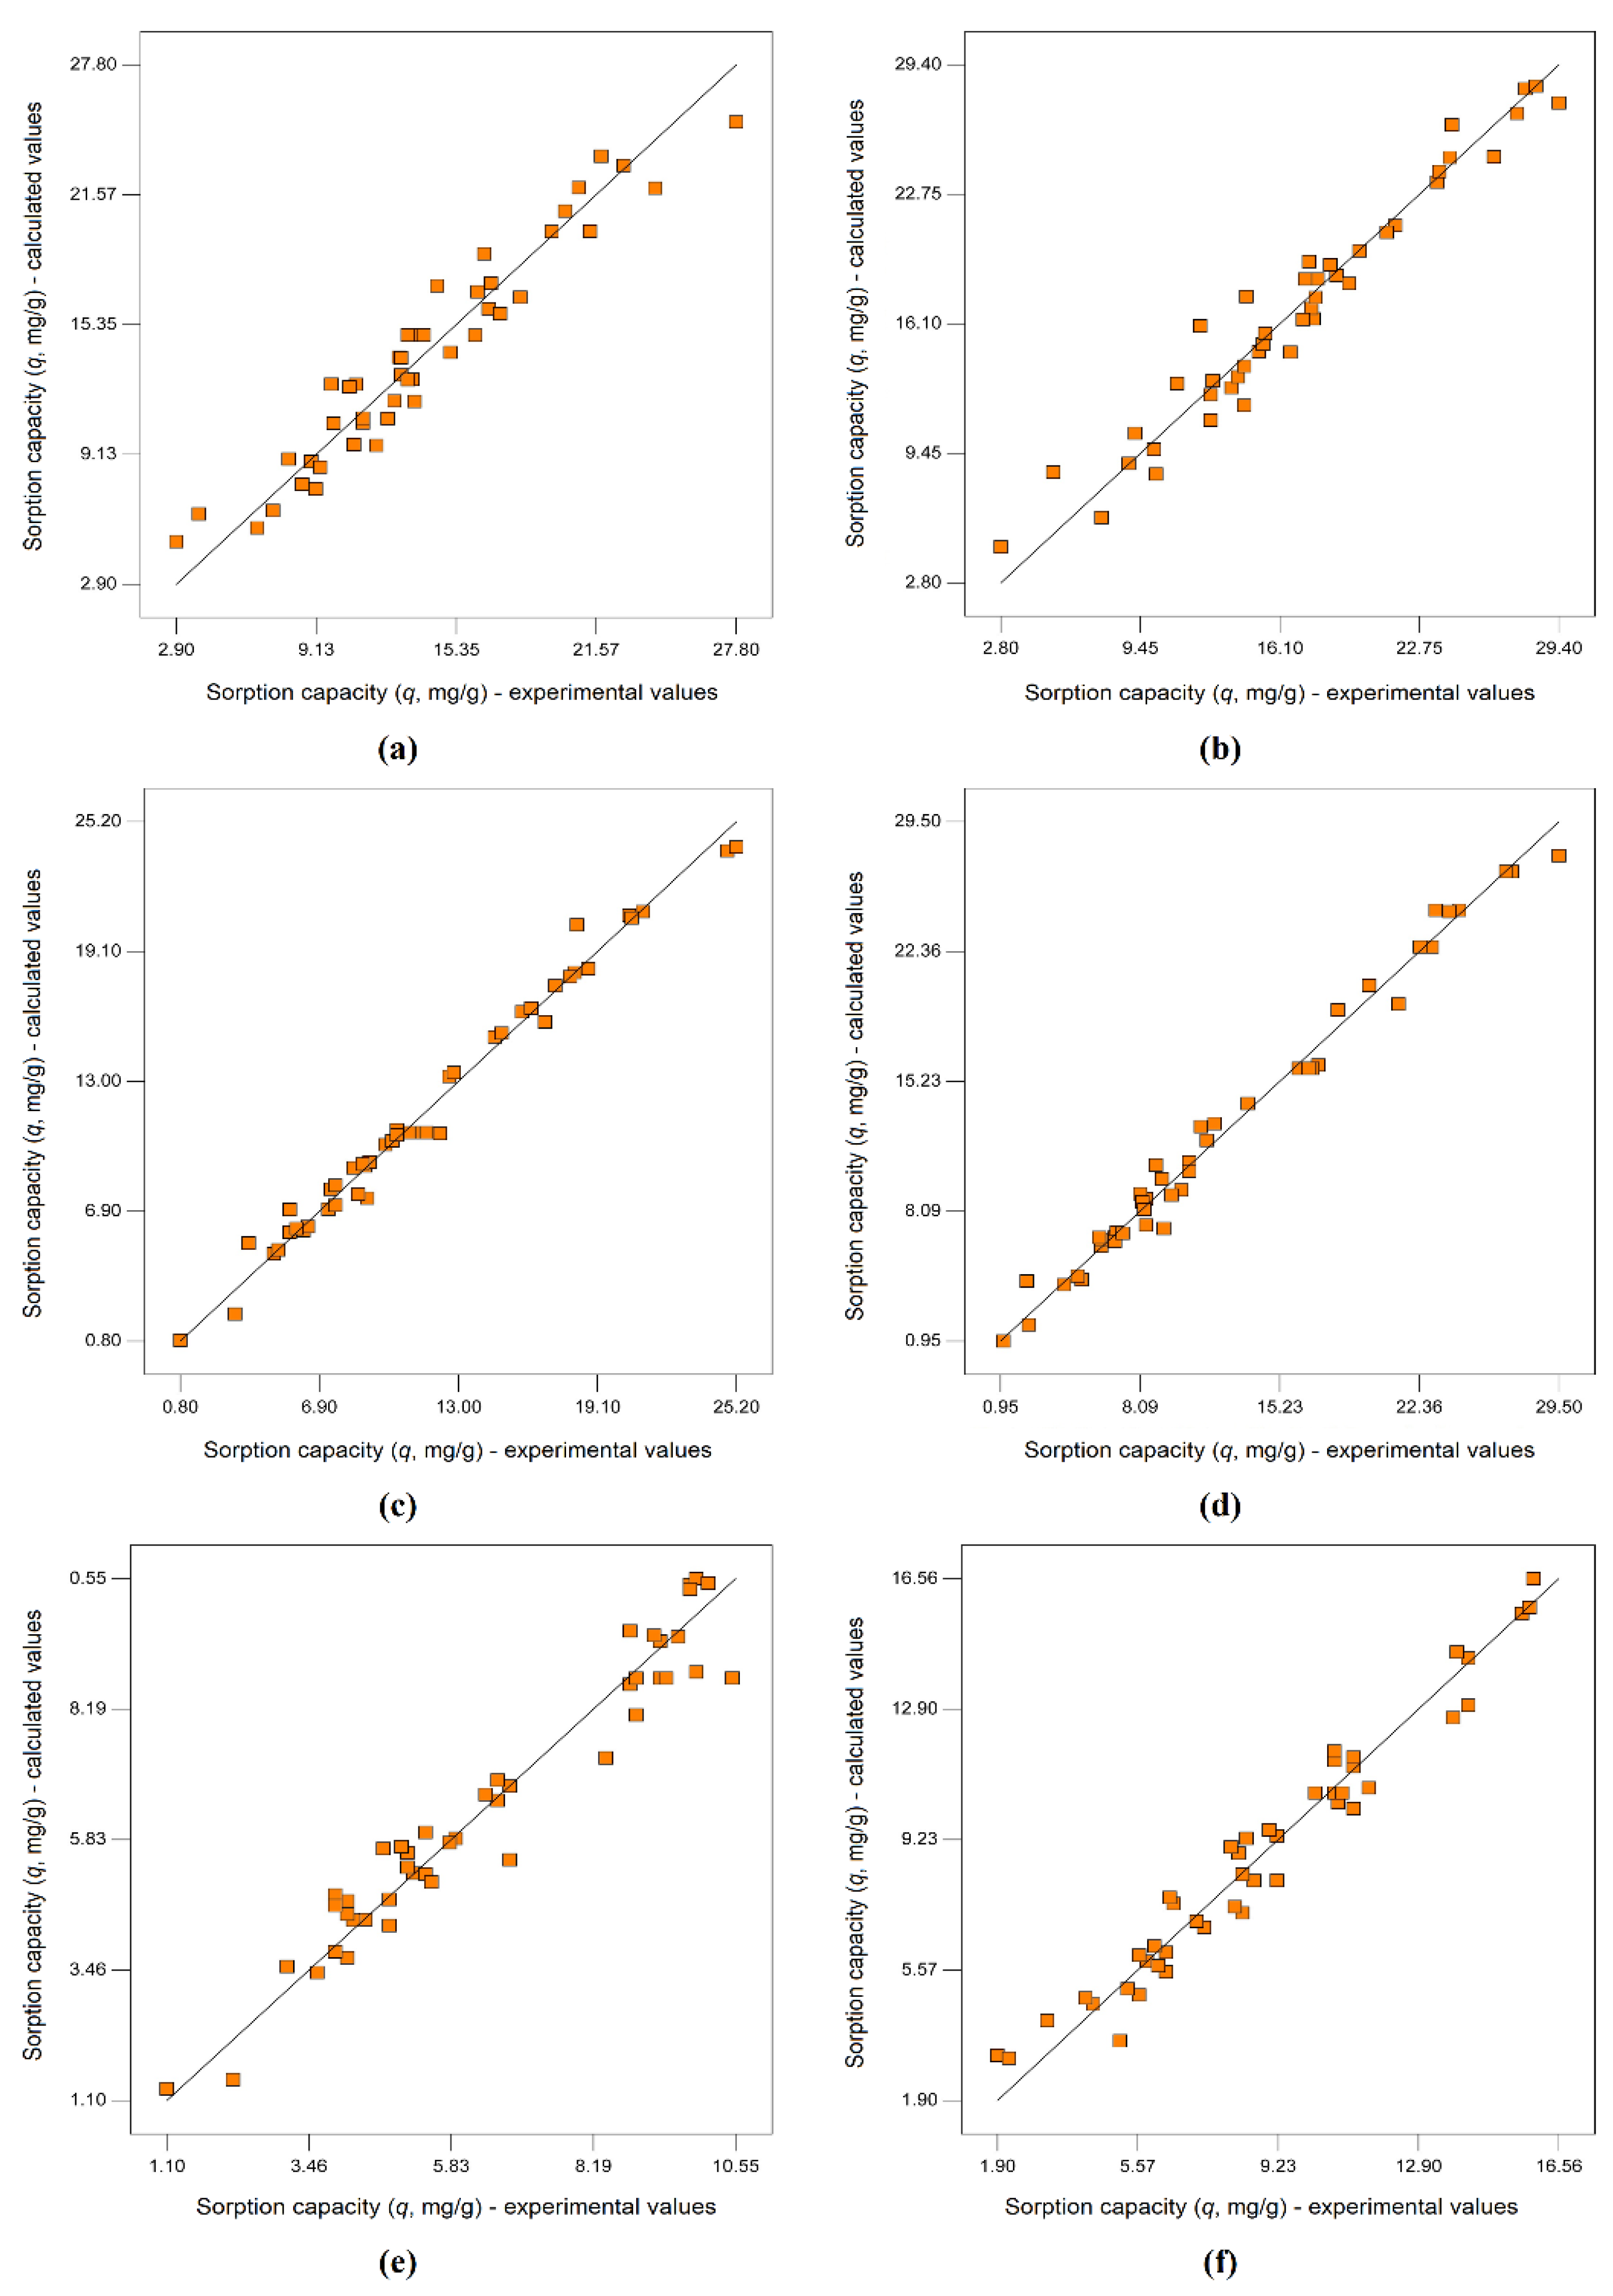
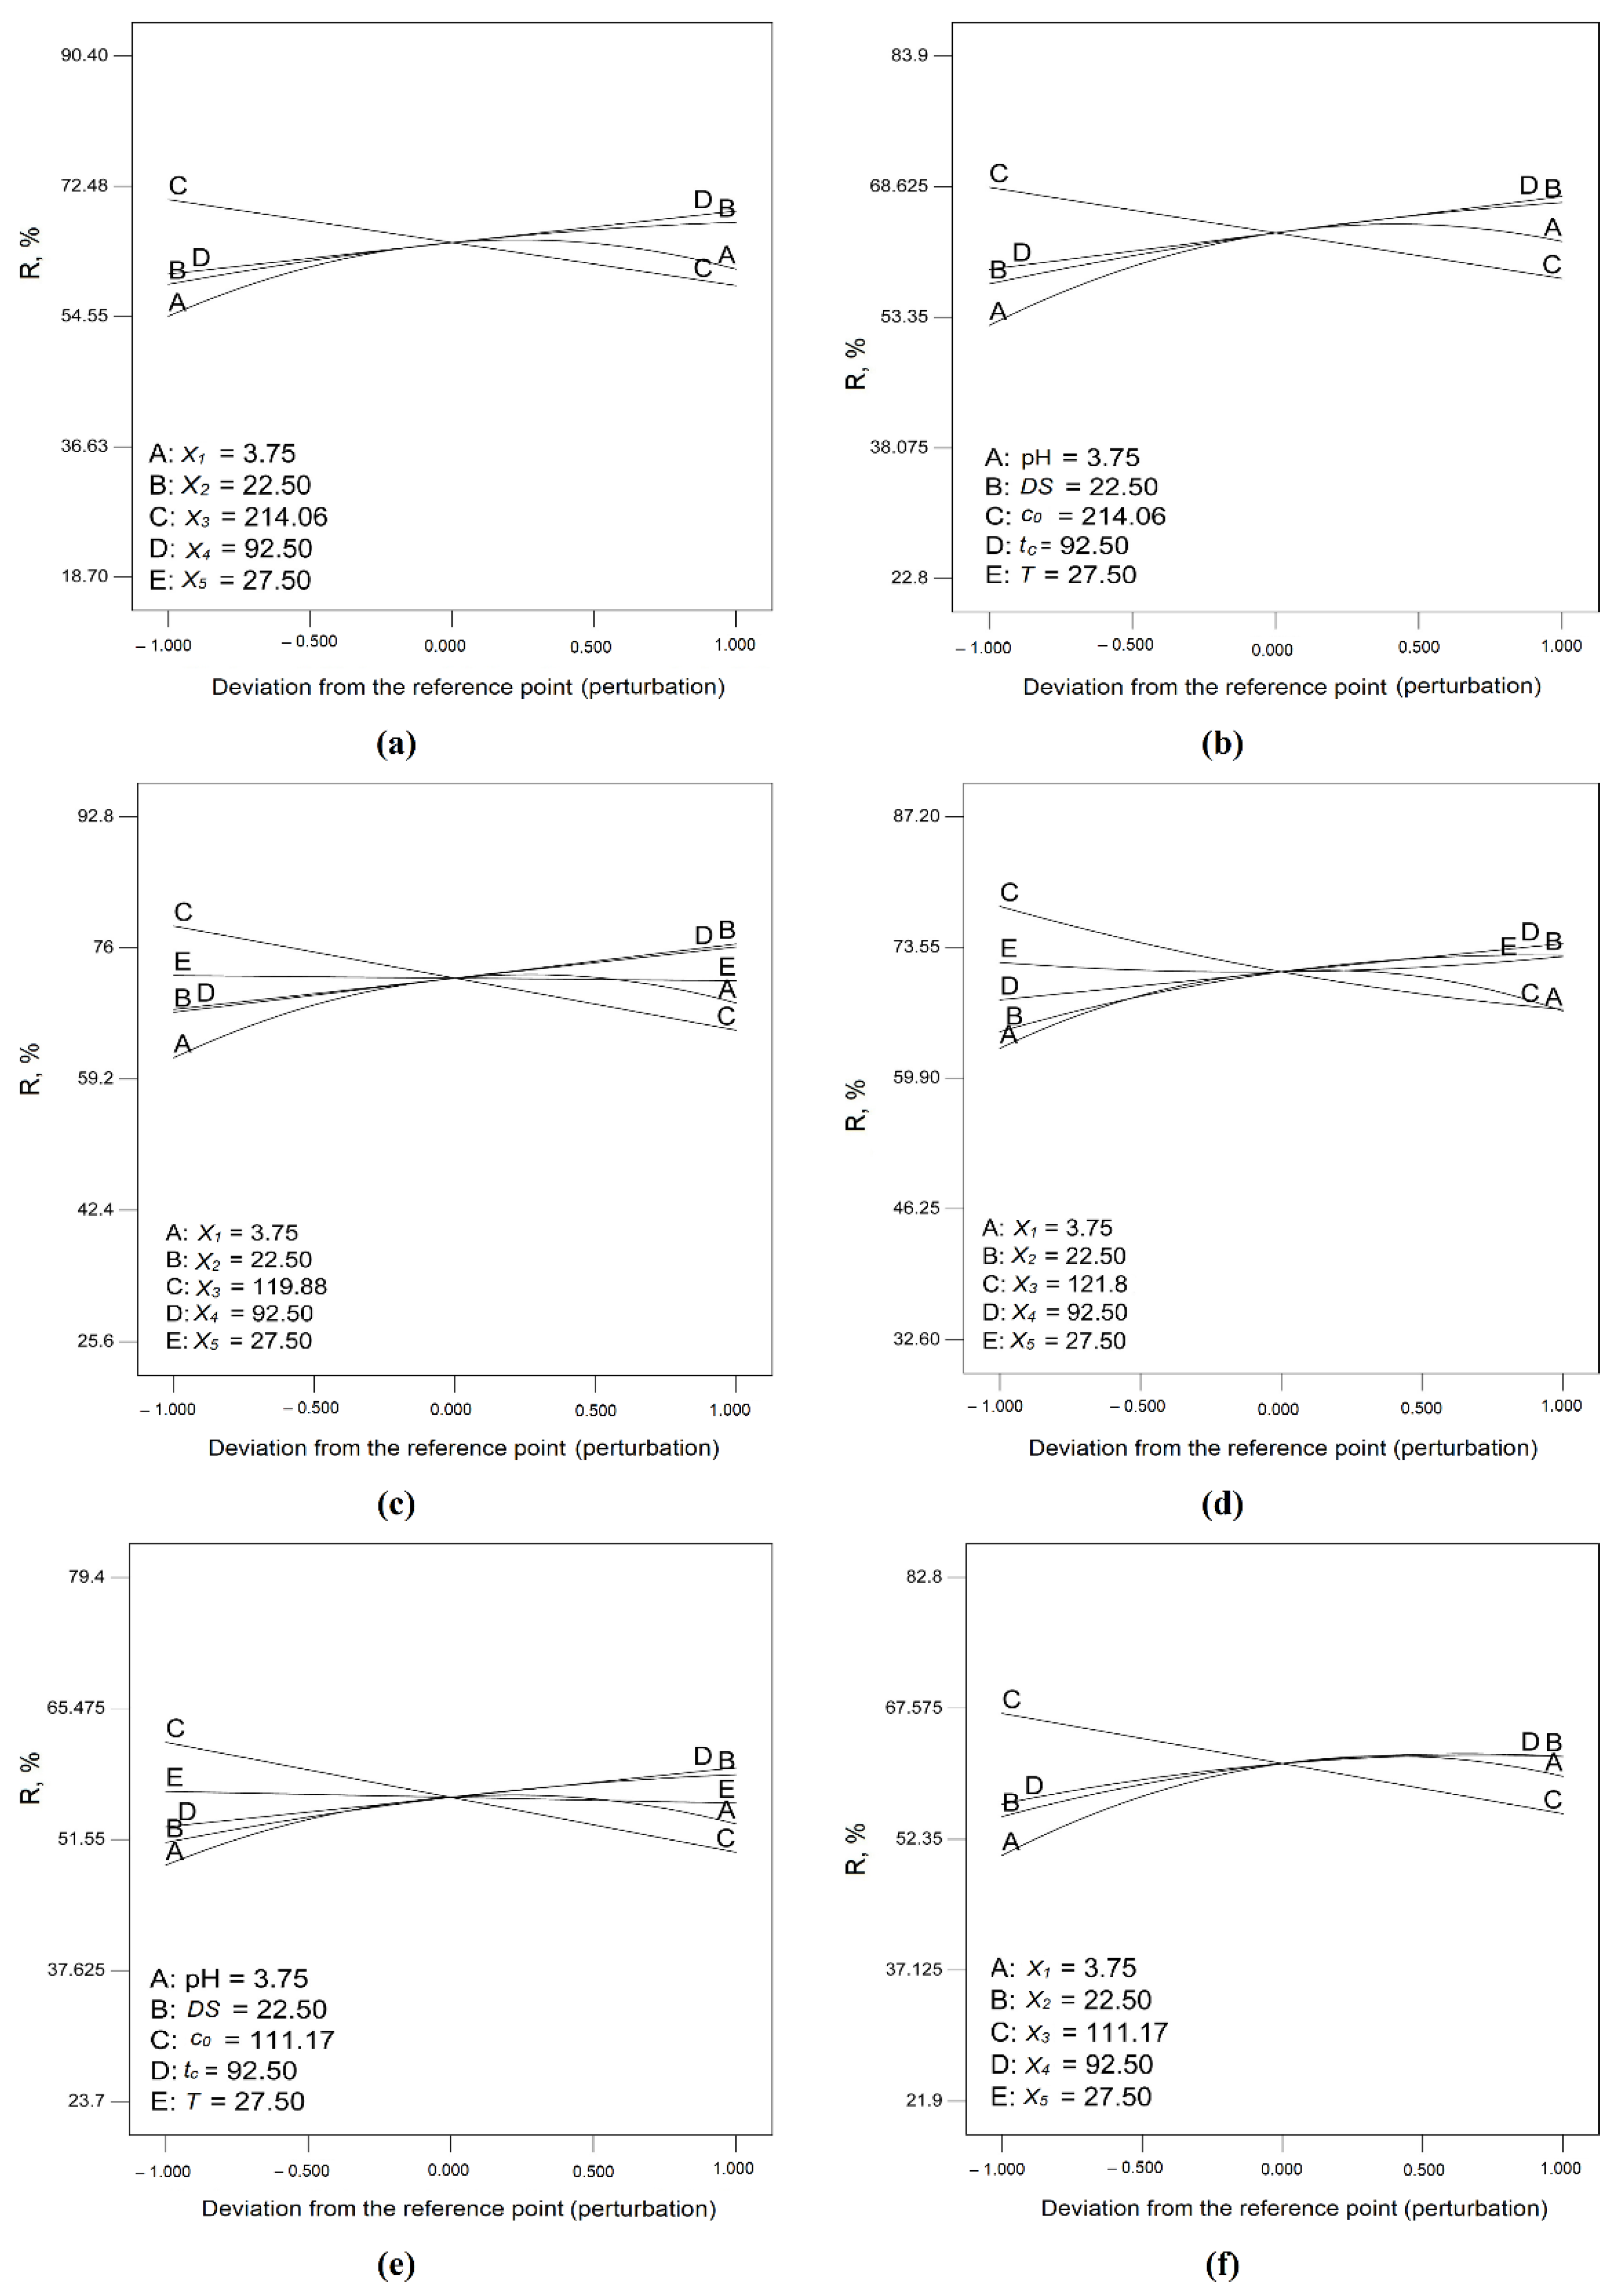

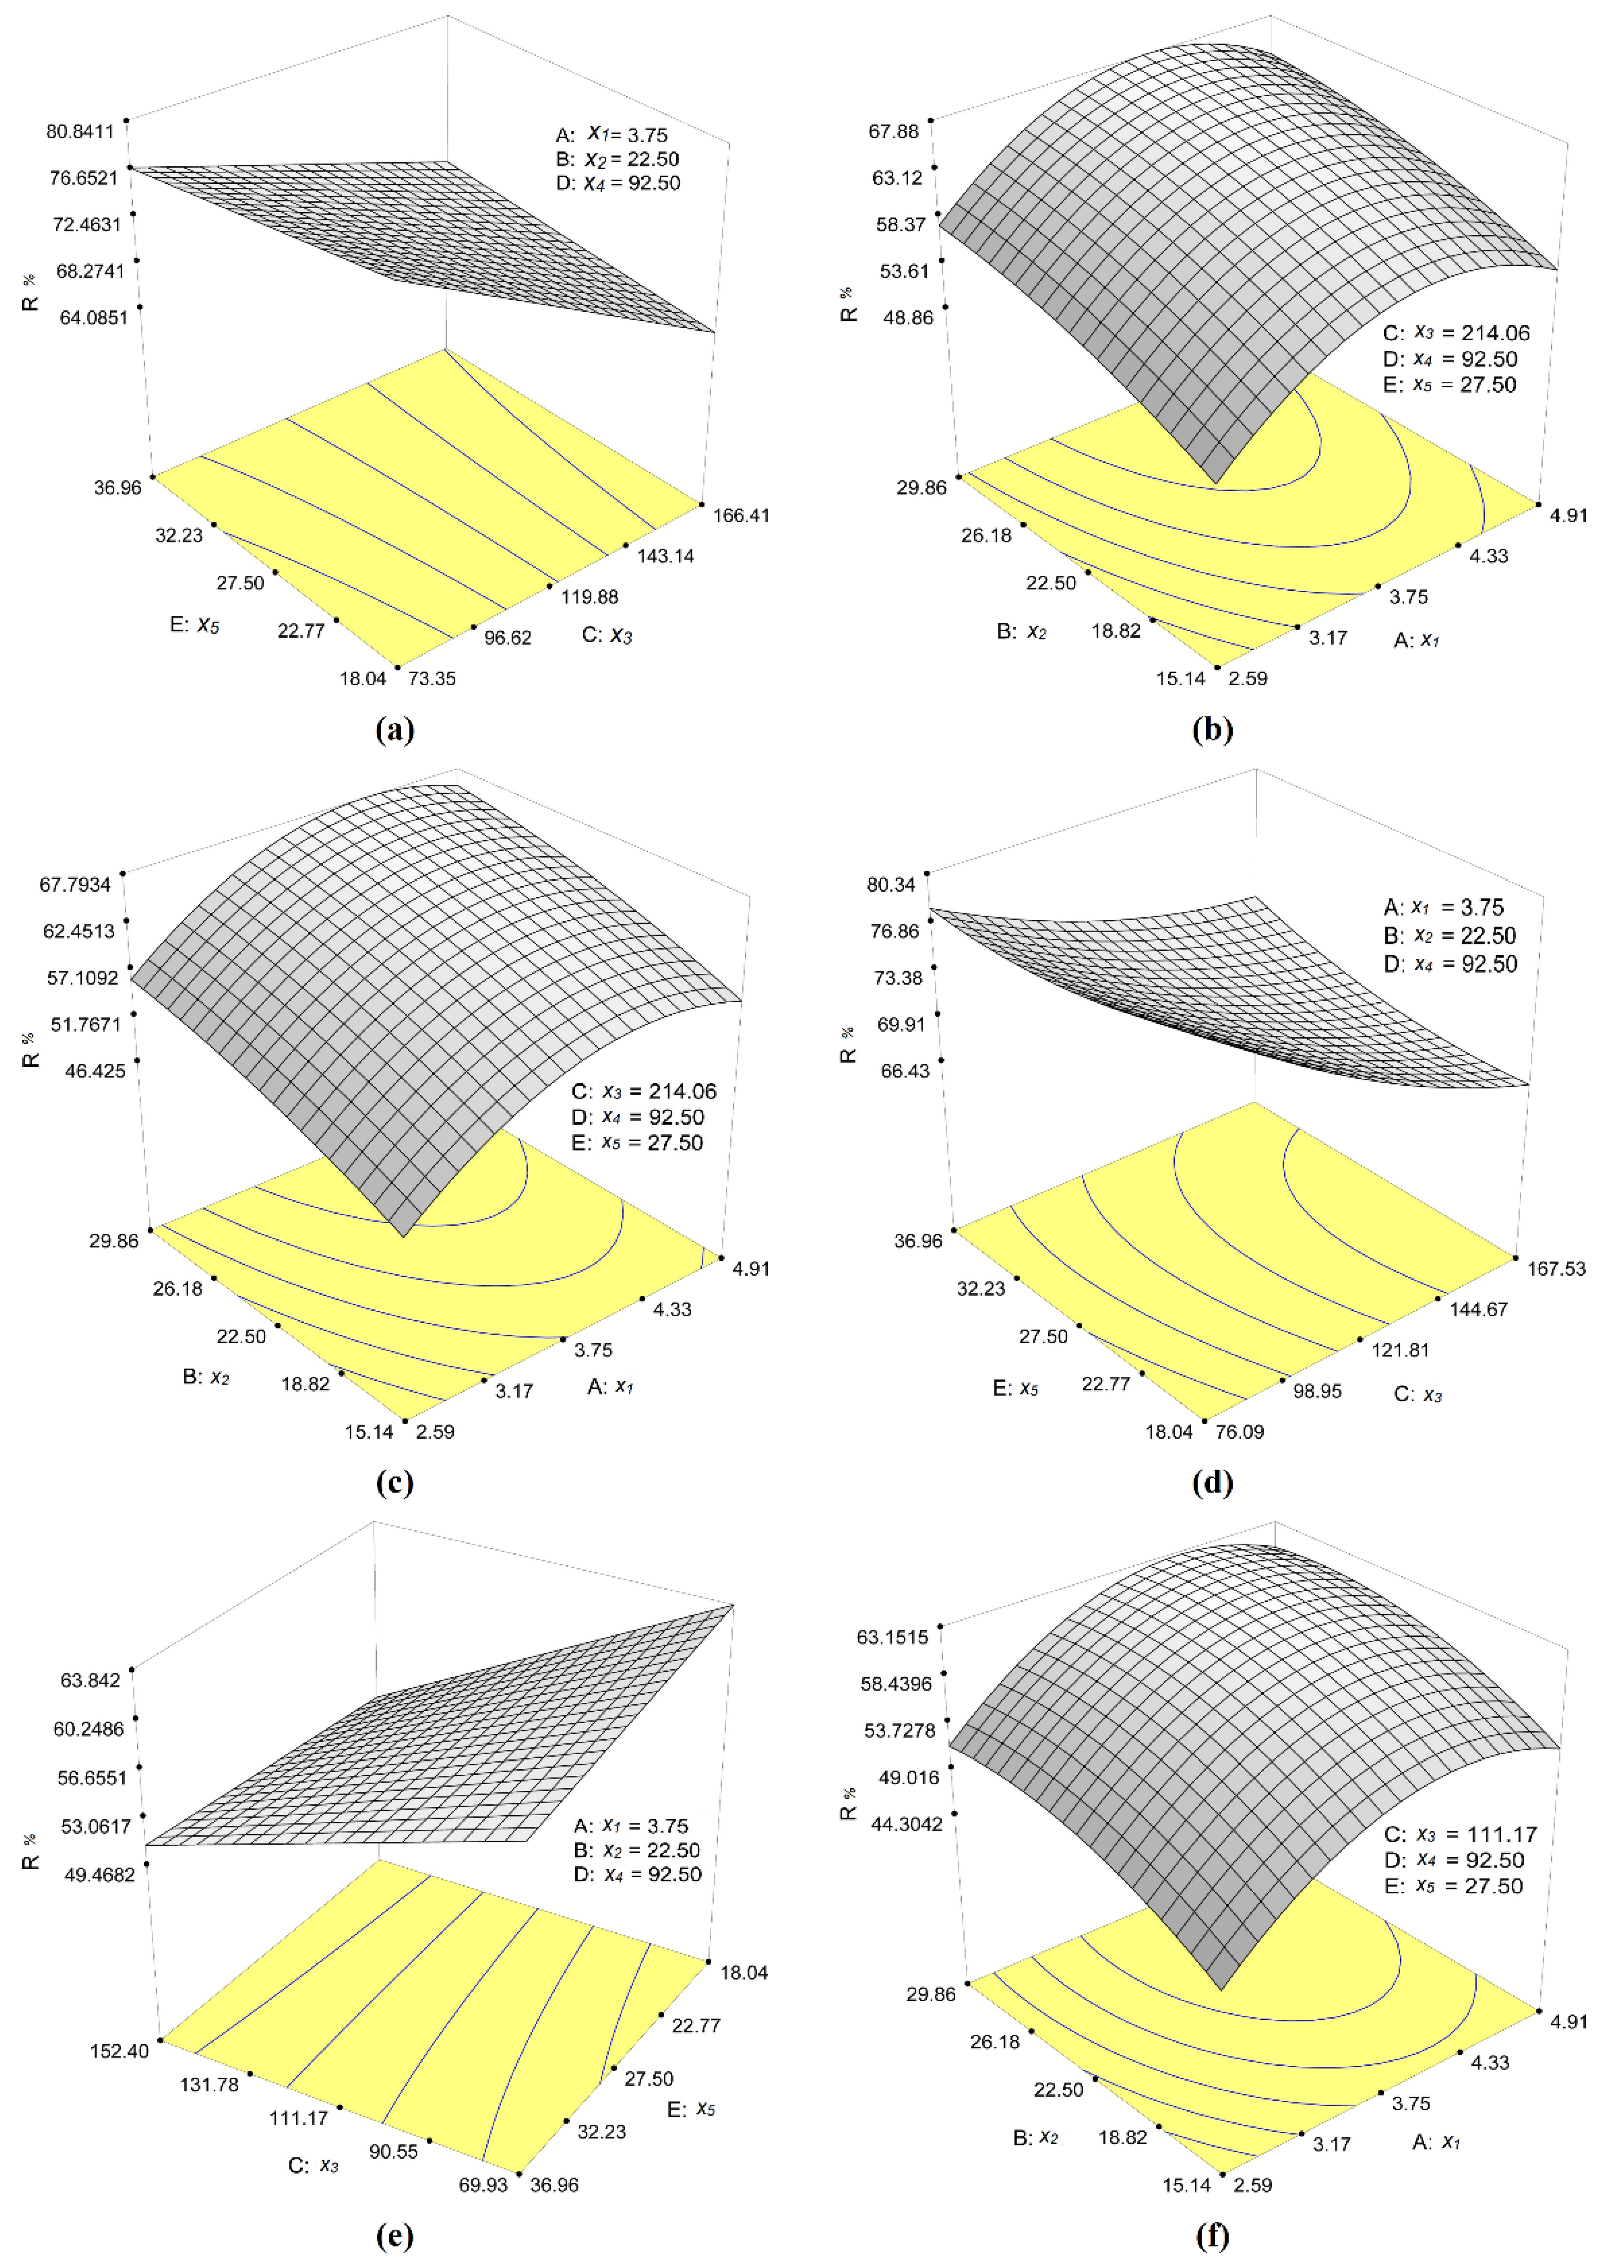
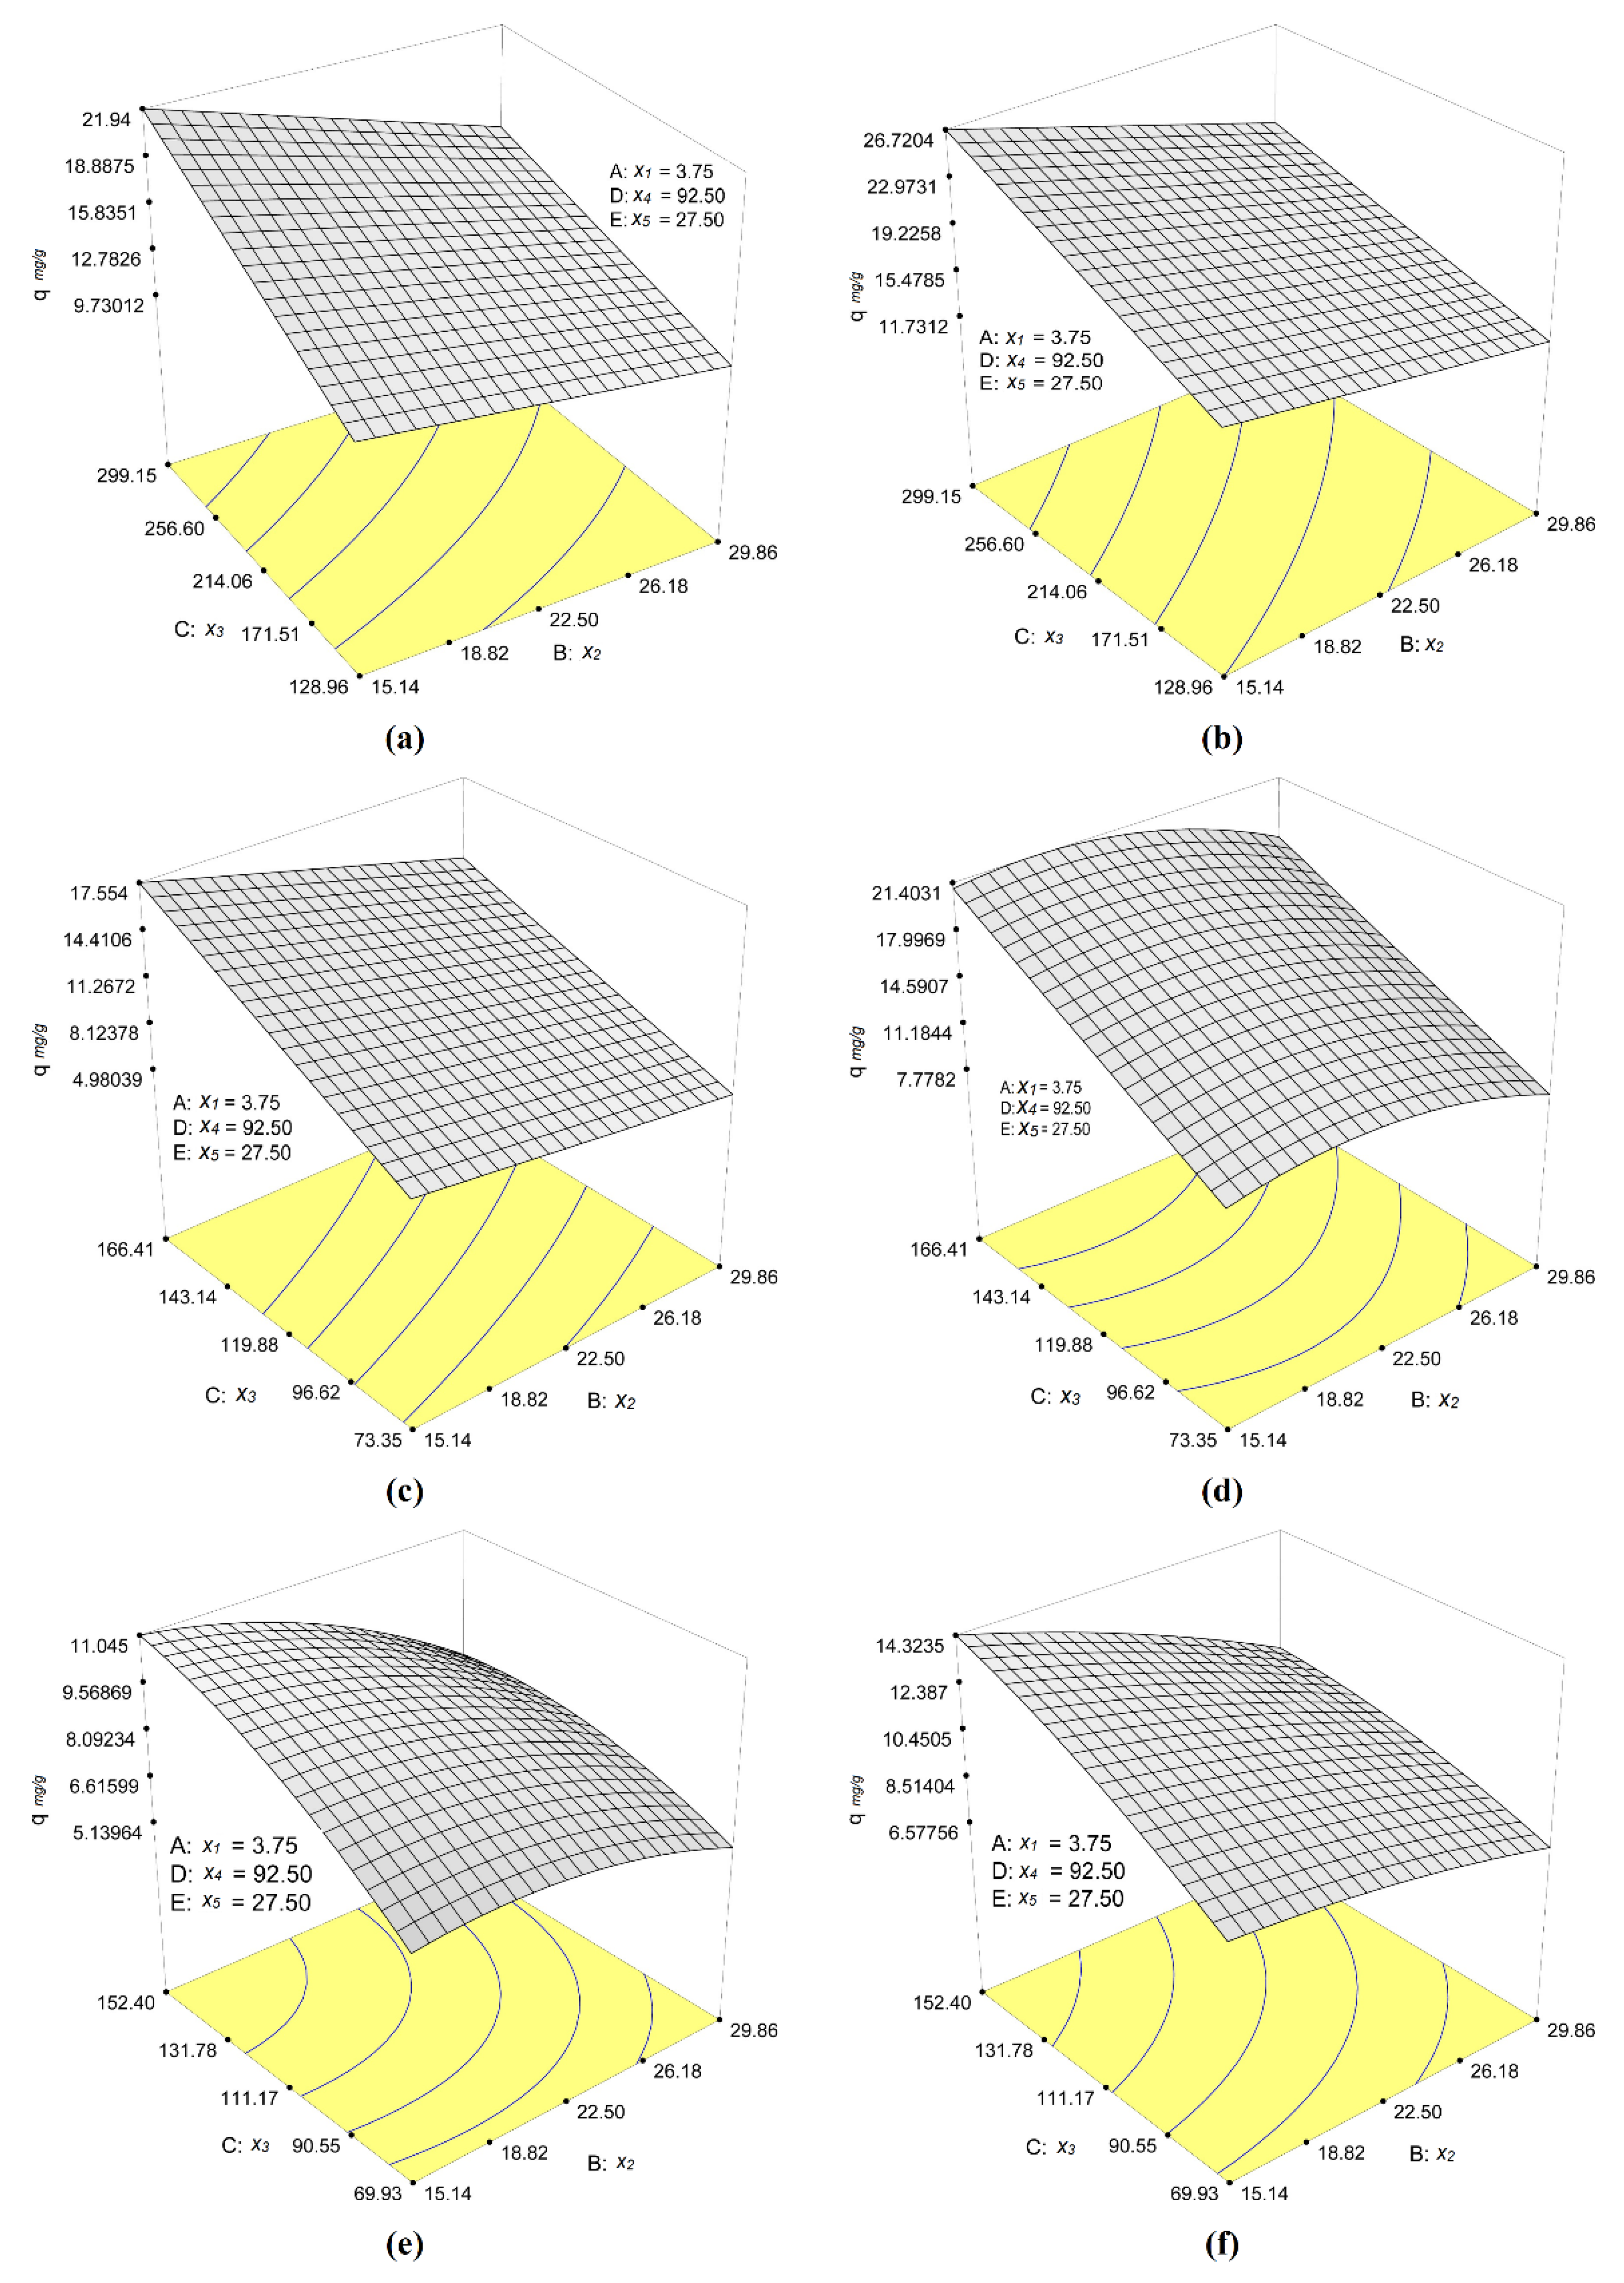
Publisher’s Note: MDPI stays neutral with regard to jurisdictional claims in published maps and institutional affiliations. |
© 2022 by the authors. Licensee MDPI, Basel, Switzerland. This article is an open access article distributed under the terms and conditions of the Creative Commons Attribution (CC BY) license (https://creativecommons.org/licenses/by/4.0/).