Article

The Product Customization Process in Relation to Industry 4.0 and Digitalization

Department of Management, Faculty of Economics, The University of South Bohemia in Ceske Budejovice, Studentska 13, 370 05 Ceske Budejovice, Czech Republic
*
Author to whom correspondence should be addressed.
Processes 2022, 10(3), 539; https://doi.org/10.3390/pr10030539
Submission received: 22 February 2022 / Revised: 4 March 2022 / Accepted: 8 March 2022 / Published: 9 March 2022
(This article belongs to the Special Issue Manufacturing Industry 4.0: Trends and Perspectives)

Abstract

:
Today’s customer no longer wants one-size-fits-all products but expects products and services to be as tailored as possible. Mass customization and personalization are becoming a trend in the digitalization strategy of enterprises and manufacturing in Industry 4.0. The purpose of the paper is to develop and validate a conceptual model for leveraging Industry 4.0 and digitalization to support product customization. We explored the implications and impacts of Industry 4.0 and digitalization on product customization processes and determine the importance of variables. We applied structural equation modeling (SEM) to test our hypotheses regarding the antecedents and consequences of digitalization and Industry 4.0. We estimated the process model using the partial least squares (PLS) method, and goodness of fit measures show acceptable values. The proposed model considers relationships between technology readiness, digitalization, internal and external integration, internal value chain, and customization. The results show the importance of digitalization and technology readiness for product customization. The results reveal that the variable of internal integration plays a crucial mediating role in applying new technologies and digitalization for customization. The paper’s main contribution is the conclusion that, for successful implementation of the customization process, models are required to focus on the internal and external factors of the business environment. Our findings are supported by various practical applications of possible product customization.

Graphical Abstract

1. Introduction

The business environment has become shaped by the emergence of modern digital infrastructures, platforms, and technologies that have changed the way people live and work [1]. Self-realization and the tendency to individualize consumers are gaining importance as living standards rise. Individual customer desires can no longer be satisfied by traditional mass production and require innovative process approaches in manufacturing. Enterprises in the digital and physical worlds are under enormous pressure to speed up the roll-out and marketing of their products [2]. The COVID-19 pandemic accelerated the development of e-commerce and forced enterprises to sell online, even though they had not originally planned to do so. As a result, competition is sharper, and companies need to focus on consumer experience and personalization as a factor of differentiation [3]. Customer satisfaction declined across the retail sector in 2020, and up to now, enterprises such as Amazon have seen a decline in the American Customer Satisfaction Index (ACSI) [4]. Moreover, to meet individual customer wishes while keeping costs within reasonable limits, they need to develop new customer-centric business models [5] and deploy intelligent, flexible manufacturing technologies—known as Industry 4.0.
The customization process has evolved—from tailored production across mass production and mass customization to mass personification production [6]. In his memoirs, Henry Ford [7] describes the market situation with the famous quote, “Any customer can have a car painted any colour that he wants so long as it is black”. It meant producing only one car model on a large scale with perfect design. Nowadays, enterprises offer many product variants, whose appearance or customers can often influence the function before or after production. In some categories (holidays, clothing, furniture, homeware and DIY, fashion accessories, jewelry, and footwear), more than 50% of consumers expressed interest in purchasing customized products or services [8]. Industry 4.0 is changing the paradigm of the Ford age. Today, new technologies allow us to meet customer demands and customize products, all on the same production line, through flexible processes, automation, robotics and artificial intelligence, the development of e-commerce, 3D printing, and flexible manufacturing.
The new trends in manufacturing in Industry 4.0 recently are mass personification production and smart customization. Mass personification considers each customer individually and allows them to customize the product through digital technologies and e-commerce [6]. The key to a workable solution is a high degree of standardization and automation of processes, allowing room for variations in product features required by individual customers. Smart customization means equipping consumer products with clever user toolkits for co-design to make them customizable items [9]. Enterprises have comprehensible sources of value. They evolve towards virtuous variety and offer worth at least equal to the cost [10]. Thus, according to Resco et al. [11], more and more products are characterized by the presence of digital components. Therefore, the customer can influence the development of the product before and after the purchase.
User-driven product or service customization is strongly influenced by recent trends and risks of automation, data management, and fourth-generation digitalization [12]. Building digital environments and managing their resources requires a unique understanding of how digitalization and customization create benefits and added value for different customers [13]. It is essential to integrate at the supply chain level, including internal integration, supplier integration, and customer integration [14]. The rapid development of information technology and data science opens the way to intelligent manufacturing based on big data [15]. Digitalization enables the interconnection and integration of all information systems [16]. This is the information flow of data in the enterprise for product design, modification, and innovation. Meanwhile, intelligent sensors in end products [17] are the key to transforming production flexibility and mass customization.
Most publications focus more on technical customization solutions [15,18,19,20]. These publications usually have a limited level of generalization due to the limited number of applied case studies. Validating these solutions for wider use would require empirical research in more enterprises. Another issue is the lack of direct research focused on the relationship between customization and digitalization or Industry 4.0 technologies [12,14,21,22]. A review [12] employs a mixed methodology of qualitative and quantitative research comparing online customization frameworks and solutions. A comparison between theoretical and practical levels is also addressed in Nwaiwu’s study [21]. It provides an overview and comparison of several conceptual and theoretical frameworks that have been identified as relevant to digital business transformation. However, these studies only use secondary data on digitization and customization in enterprises.
In contrast, research [22] focuses on external integration with customers and suppliers and internal integration. The research concludes that before external integration can be successfully implemented, organizations must be willing to integrate with external supply chain partners, which is manifested in their relational commitment. Similarly, a study [14] on 244 manufacturing enterprises focuses on the relationship between internal and external integration and firms’ competitive capabilities. The importance of integration positively affects innovation, product quality, and ultimately profitability. However, in both cases, the link to product customization, digitalization, and new technologies is missing. We try to address these research gaps by joining modern customization’s theoretical and practical concepts with digitalization and Industry 4.0 technologies.
We aim to develop and verify a conceptual model that investigates the importance of enterprise variables for digitalization, Industry 4.0 technology, and the customization of products. Furthermore, this model should generalize the relationships between the main variables affecting the business environment that supports the implementation of changes induced by digital transformation and new technologies. The purpose of the paper is to show how Industry 4.0 and digitalization can help product customization. The paper does not concentrate on a specific technical solution for product customization but instead describes the system’s features and characteristics that accompany successful organizations.
The paper is structured as follows: 1. Introduction and presentation of the topic; 2. Theoretical background, including the definition of main terms and description of the conceptual research model and hypotheses; 3. Data and methods with data sample, construct of variables and indicators, and used methods; 4. Results divided into the evaluation of measurement and structural model; 5. Discussion of results, including theoretical and practical implications, contributions, limitations, and future research; 6. Conclusions.

2. Theoretical Background

We present an overview of the literature relevant to the given work. We review the available definitions of the main concepts in the developed conceptual model. Then, we describe the research model and explain the associated hypotheses.

2.1. Definition of Terms

2.1.1. Industry 4.0 and Technology Readiness

Industry 4.0 is the digital transformation of manufacturing and related industries and value creation processes. Industry 4.0 is widely seen as the forthcoming fourth industrial revolution driven by the digitalization and automation of production and value chain processes [23]. The application of intelligent manufacturing, commonly referred to as Industry 4.0, is the most crucial application of digitalization in the industry [24]. The idea of Industry 4.0 encompasses the digital transformation of the entire manufacturing, service, and consumer markets, from the emergence of intelligent manufacturing to the digitalization of all channels necessary for the flow of all resources and values [25,26,27]. Increasingly, better management of energy and resources and avoiding waste is highlighted as the main benefit of Industry 4.0 in economic savings, which is provided by big data analysis and optimization based on customer-specific products [28]. However, the concept of Industry 4.0 is ubiquitous and affects the product, the process, and the entire production system in enterprises [29].
Key technological enablers of Industry 4.0 are industrial robots, wireless sensors and actuators (WSAN) for novel assembly lines, and machine-to-machine (M2M) communication, followed by networked control systems infrastructure and industrial cyber–physical systems [30]. Authors [31,32,33,34] generally agree on nine fundamental technological pillars that significantly impact industrial and service activities. These pillars include big data analytics, optimization and simulation, cloud technologies, virtual and augmented reality (VR/AR), horizontal and vertical system integration, Industrial Internet of Things (IIoT), incremental technologies (3D printing), autonomous robots, and cybersecurity. Similarly, Mavropoulos and Nilsen [35] selected ten general technologies driving the shift towards Industry 4.0: artificial intelligence (AI), Internet of Things (IoT), cyber security, simulation, blockchain, cloud computing, human–machine interaction (HMI), machine learning, autonomous robots, and additive manufacturing.
The level of Industry 4.0 in our concept is determined by the degree to which information technology (IT) and information systems (IS) infrastructure and linked data connected to sensors, robots, and mobile terminals are built. Vaidya et al. [36] and Wang et al. [37] present three basic integration concepts in the Industry 4.0 paradigm: (a) horizontal integration throughout the value network (we call this construct external integration in our research model), (b) vertical integration of management and manufacturing information systems (we examined it as a part of digitalization construct in the research model), (c) in-depth, end-to-end, complex engineering throughout the whole product lifecycle (we refer to this component as internal value chain in the model).

2.1.2. Digitalization

Digitalization integrates digital technologies into everyday life by digitizing everything that can be computerized to modify the business model [38]. In the literature, digitization and digitization concepts are perceived in different terms. According to the Oxford English Dictionary [39], digitization is the conversion of analog data (e.g., images, sounds, video, and text) into a digital form that can be easily read and processed by a computer. Brennen and Kreiss [40] define digitalization as the material process of converting individual analog streams of information into digital bits. Enterprises’ internal processes, product components, communication channels, and other key aspects of the supply chain are undergoing an accelerated digitalization process [41]. Digitalization, therefore, means the transformation of enterprise business processes into digital form.
Digital transformation is an ongoing process and journey [38]. According to Nwaiwu [21], digital transformation impacts various dimensions of enterprises and enables new business models triggered by changes through digital technologies. Digital transformation focuses on creating added value to the customer (servitization) through new technologies [18]. A digital transformation strategy is a plan that supports enterprises in managing the transformations that arise from the integration of digital technologies, changes in value creation, structural changes, and related financial aspects [42]. The digital transformation brings businesses the ability to control and manage machines, robots, and equipment by integrating information systems. It also enables devices to communicate with (M2M) or via the Internet in real time [43]. Digital transformation refers to the changes that digital technologies can bring to a company’s business model, leading to changes in products or organizational structures or the automation of processes [44].
Increasing industrial automation requires more IT systems to cope with the challenges arising from the complex processes of manufacturing systems. The automation pyramid has been developed as a reference model to structure the different applications functionally and hierarchically to reduce complexity [16]. The automation pyramid connects information systems in hierarchical levels [19]: sensors and actuators, control systems (PLC), monitoring and supervisory control (SCADA), manufacturing operations and execution systems (MES), management support systems (ERP). Vertical integration of systems is the term for the state where all information systems are integrated across hierarchical levels.

2.1.3. Internal Integration

Internal integration comprises the internal sharing of information and strategy coordination between departments [45]. Basnet [46] states that integration in organizations is seen as interaction and information exchange, coordination of activities across departments, and finally, a collaboration between departments. We consider an essential requirement for a functioning internal integration to ensure that independent functions (e.g., marketing, human resource management, finance, production, etc.) work together due to communication, interaction, integration, and cooperation between different departments. Different functions in a company should not work as separate units but as part of an integrated process [22]. Enterprises with well-developed interdepartmental communication and collaboration achieve greater operational efficiency. It means solving supplier quality problems through multi-functional teams [47]. Basnet [48] refers to the internal integration of activities across departmental boundaries to offer higher customer service and performance metrics.
In an enterprise, activities often require the coordination of many functions. We see the role of internal integration in coordinating the interconnection of organizational departments and processes, which supports the automatic execution of processes through IT. Furthermore, coordination enables information sharing between internal functions, strategic collaboration across parts, and departmental collaboration [22]. The purpose of internal coordination is to harmonize the communication of information flows, exchange and share strategic information, along with the integration and cooperation of different functional units to create value for customers [49]. Hillebrand et al. [50] discuss coordination as an internal interface for collaboration between other business functions, especially marketing and research and development, and marketing and production.
Without cross-functional integration, company processes are fragmented, disconnected, and closed in functional specializations [22]. Unfortunately, managers across functions often have divergent interests and fail to achieve corporate goals [51]. Management’s lack of coordination hinders cooperation between units and may even encourage competition between functional teams for scarce resources [52]. In addition, Wynstra, Axelsson, and Van Weele [53] show that many of the issues stem from a lack of enabling factors: functionally orientated, fragmented internal organizations; lack of access to information; lack of competence; and differences in personal attitudes between departments.

2.1.4. External Integration

External integration consists of strategic alliances with suppliers and customers [45], in which the enterprise forms strategic partnerships and jointly develops market-facing strategies [54]. The integration with suppliers and customers upstream and downstream of the production process has become an essential element of the manufacturing strategy in the new millennium [55]. Such a type of integration is only possible with long-term collaboration between enterprises. Externally, integration promotes efficient coordination between an enterprise and its suppliers and customers to efficiently support product design and development. There are three activities of external integration: supplier development, partnerships with suppliers, and closer relationships with customers [56]. Moreover, companies can take advantage of market data from third-party providers to provide manufacturers with valuable customer data in addition to this integration [57].
The external integration allows enterprises to cooperate with business partners and leverage their core competencies [58]. This collaboration is mainly manifested by the cooperation between the enterprise and its suppliers. Successful supplier management requires supply chain collaboration with a strategic focus on sourcing and technology in the management process [59]. Long-term collaboration gradually leads to supplier relationship management process integration to achieve higher performance [60]. Supplier relationship management’s core purpose is to manage suppliers’ relationships. The main goal is to enable enterprises to coordinate them across different enterprise systems [61]. Enterprise supplier integration is when two or more enterprises realize activities within a supply chain [62]. Supply chain management requires higher coordination of activities to achieve mutual benefits from business relationships through the strategic management of supplier relationships [63]. Supplier integration focuses on strategic collaboration between manufacturers and suppliers in managing internal business processes, including information sharing, strategic partnerships, project collaboration, and joint product development [64].
The integration of customers entails strategic information sharing and the cooperation between manufacturers and their customers to improve customer service. Customer integration refers to the process where enterprises collaborate and communicate with their customers to ensure the efficiency of the supply process [45]. However, since the 2000s, researchers have begun to embrace the concept of integrating customers into supply chains consciously. Hence, it is appropriate to think of integration as a process beyond a single enterprise. Thus, theories focusing on the servitization process [65] or demand chain [66] related to collaboration on the co-creation process of products [67] have come to the fore.
Consequently, customer integration can be seen in two perspectives: customer-oriented (dyadic relationships between customer and manufacturer as resources and possibilities for customization) and customer-oriented integration (co-creation of products in network relationships focused on product design) [68]. Integration concerns customer experience. It means how the customer perceives and evaluates the experience of working with an IT-based platform [69]. Furthermore, to attract customers to participate and integrate, organizations must ensure that customers have a positive experience of creating a product or service [70]. Supply chains need to develop specific capabilities and resources to become customer-centric integration: customization, product and service adaptation, shared information, flexibility, and alignment [68]. Customer relationship management is a tool and strategy developed to manage customer interactions using technology to automate business processes [71].

2.1.5. Internal Value Chain

The internal value chain relies on product lifecycle theory and value stream mapping (VSM). The product lifecycle was suggested in classical work by Dean [72] as a process beginning with market acceptance to market abandonment (i.e., phases before birth, at birth, in childhood, in adulthood, or senescence). Within the manufacturer’s perspective, the product lifecycle comprises the new product idea, design, procurement, development, manufacturing, utilization, and disposal [73]. Product lifecycle management is the business activity of managing a company’s products as efficiently as possible throughout its entire lifecycle, from the first idea for a product to its scrapping and disposal [20].
Porter [74] created the value chain as the primary tool to identify opportunities to create more value for the customer. The value chain reflects the total value and consists of value-creating activities: inbound logistics, operations, distribution, marketing and sales, service. Basnet [48] refers to the internal value chain-creating production, sales, and distribution activities. The internal value chain encompasses product and process integration capabilities through design for manufacturability. It means simplification and minimization), standardization, and computer-aided engineering practices [56].
We elaborated the value chain from three significant aspects of the internal product lifecycle: new product design [20] and development [75], production planning process [76], manufacturing and production control [77]. These processes build on each other, constitute the main stages of the product lifecycle within companies, and represent critical processes that add value to the customer. In contrast to the construct of internal integration uniting different business functions, we consider these processes as sequentially dependent processes. Product realization should meet various product lifecycle requirements. These include functionality, cost, schedule, reliability, manufacturability, marketability, and usability [78]. Creating new value is built on identifying customer needs by identifying business and internal processes in the existing company to determine whether or not the current system can meet the customer’s expectations. A critical activity in this phase is identifying one of the unfulfilled needs or those that have been better satisfied [79].

2.1.6. Customization

The production of products tailored to individual customer needs is known as product customization [80]. The purpose is to provide customers with products that meet their needs at a price they are willing to pay. The importance of the customer in this concept is emphasized in enterprises through customer orientation, segmentation [81], customer relationship management [71], and an emphasis on value added from the customer’s perspective [82]. From a customer value perspective, servitization is seen as a process in which customers are offered smoothing services facilitating the product sale (maintenance, financing), adapting services (customization of the product based on sharing knowledge), and substituting services [83]. Customization can be viewed from two perspectives. Customer to business (C2B) is primarily designed to meet the individual needs of the specific groups that constitute the model, with a robust target market orientation; typically, the success rate of marketing will be relatively high [84]. In contrast to C2B, business-to-business (B2B) customization is evolving based on emerging industry standards.
Wang et al. [6] distinguish four evolutionary stages of customization associated with each industrial revolution: craft (tailored, bespoke) production, mass production, mass customization, and mass personalization production. The first stage is transitioning from manual craft and manufactory production to factory production. It is powered by steam engines, where mechanized machines change production processes [35]. The second stage is characterized by mass production. It started with the emergence of electricity and the beginning of scientific management. Mass production was established in Ford’s factories due to standardization, rationalization principles, and the division of labor on production lines [7]. In the third stage, mass customization changed the view of the customer, and enterprises began to customize products using computers, automation, computer numerical control (CNC) machines, and robots. Increased flexibility created modern production systems allowing low to medium production volumes to fulfil customer needs [78]. Mass customization brings lean manufacturing, micromarketing (niche marketing), time-based competition, and a significant reduction in product lifecycle [85]. Wireless and Internet technology is beginning to be used nowadays to help with increased production volume and productivity [15].
Mass personification production is associated with intelligent operations in the context of Industry 4.0. Personalization is not new—it started as relationship marketing, which was considered an old idea in the 1990s [86]. For a long time, personalization was not very personal. Enterprises used technology to segment their customers and targeted each segment differently. The current personalization practice in sales and marketing aims to customize the buyer experience for each prospect or customer using artificial intelligence (AI). Mass personalization addresses the market of only one customer. Therefore, customers need to be actively involved in the product design process [6]. Customer-specific product profiling becomes vital for enterprises to ensure that the entire lifecycle offers personalized and customized services. Each customer will have a different experience according to their needs and interests [71]. These services are then provided online. Social networks are essential and have become an important communication channel between enterprises and their customers [87]. New directions in marketing facilitate personalization by email and social media personalization, campaign and custom homepage design, geographic location, Internet protocol address sharing, account and cookie usage, and related content offering [8].
Smart customization means that innovative user toolkits for co-design can be directly embedded into products via computer components or platforms [88]. Intelligent control enables intelligence of control rules that are adaptive, contingent, dynamic, and personalized through new technologies, digitalization, and artificial intelligence. However, with the emergence of big data, the Internet of Things, and cloud computing, information systems are moving to the cloud, which bridges the information gap between departments and organizations [15]. It consequently leads to customers having unique opportunities to customize their product for a specific situation [89]. Smart products reflect the emotional elements of users as they use them with storytelling for qualitative evaluation [90]. As products become more intelligent and more innovative over time in the context of the IoT, this requires solutions to realize smartness through additive manufacturing [91]. Emphasis must be placed on the importance of design, performance reliability, and practicality during the manufacturing process to produce smart products that users want [92].

2.2. Practical Applications of the Customization Process

Our conceptual model builds on the application of Industry 4.0 and digitalization for product customization. We found support for the proposed model in various case studies and research focused on product customization’s possibilities in its practical application. In different examples of best customization practices, we concentrate on how customization is offered to customers. Then, we organize these practical examples into two areas of customization: mass customization and mass personalization.
Mass customization. E-commerce linked with customization is a new business model built on the Internet as a business platform. Since its inception in the 1990s, customization and e-commerce have developed rapidly. E-commerce has incomparable advantages over the traditional business model [93]. Wang et al. [6] describe examples of Industry 4.0 for mass personification in Dell, Red Collar Group (RCG), Madshus, and Harley-Davidson. Interflora developed an online service where customers can build their bouquets by dragging and dropping more than 70 flowers and foliage options [8]. Nissan introduced the ability to choose the engine model and interior and exterior color, with connectivity, accessories, and personalization providing 25% of the company’s aftermarket sales by 2022 [94]. Nike leveraged a famous brand to customize (tailor) a pair of trainers to the customer’s design [8]. Susan Lanci Designs is a luxury online dog boutique that offers dog accessories featuring the perfect fit, highest quality, ultimate comfort, superior safety, and style. After customization, customers can choose every detail from the collar to the hook [94]. Product customization has also been used by household goods retailers such as Nutella. They have added customization to their marketing strategy and allowed their customers to add their names to the jar [94]. Similarly, it is possible to design and name your mix of muesli, crunchy and dried fruits, nuts, chocolate, etc., for Mixit brand products. Deloitte [8] describe the personalized packaging of the brand Absolut Vodka, where each of four million bottles has a slightly different design. Re-engineering in the production plant allows for various combinations of design to make each bottle unique.
Personalization. E-commerce is cheap and straightforward and therefore an excellent starting point for developing Industry 4.0 in developing countries and globally. A Japanese eyewear retailer uses a unique Eye Tailor system that automatically recommends a distinctive lens size and shape based on the customer’s face. The customer can further choose from a large number of nose bridge, hinges, and arms that make up the resulting glasses displayed on a digital image of the customer’s face [95]. The great potential of customization associated with AI was mentioned by Enext CEO Gabriel Lima [96], who pointed to the application of AI on the iFood platform. It provides customers with tailored restaurant recommendations and increases order approval efficiency. According to PSFK [97], the made-to-order building of Kennedy City Bicycles in their London workshop is possible thanks to the online personalization of purchases. The enterprise’s website allows consumers to create an entire product from the decision tree without visiting a brick-and-mortar store. Zhang et al. [15] give an example of digitalization, big data, and 3D printers through IoT and cyber–physical systems in the footwear industry. A unique interface based on customer data and the extraction process offers personalized configurations for customized design. Amazon provides customers with related content personalization, which refers to content recommendations and offers based on previous visits to the website [8]. Similarly, the Lutron Electronics Company of Coopersburg offers the creation of light switches in a home system for different desires and customer moods [95]. Moonpig has created a successful business model around an online greeting card business that allows the creation of more attractive products through personalized templates [8]. Stanford University [98] developed bottom-up software that extends industrial machines with Semantic Web technology to enable customization and automatic service discovery.

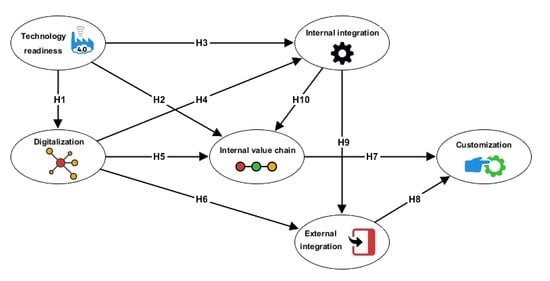
2.3. Conceptual Research Model and Hypotheses

Following the previous arguments, practical applications, and literature sources, the conceptual framework is presented in Figure 1. Nadkarmi and Prugl [2] consider two directions of digital transformation research: technology-centric and actor-centric aspects. We focused on both parts of the phenomenon. The technological part lies in digitalization and Industry 4.0 technologies variables, while the actor-centric side concerns managerial and organizational capabilities as variables for integrating internal and external processes. The considered model contains six latent variables (constructs), and relationships between them are drawn as arrows. We modeled the relationships between the variables through a structural equation model, and they are presented in the form of hypotheses. The individual hypotheses are further explained and described.
The first hypothesis focuses on the relationship between Industry 4.0 technology readiness and digitalization. Most definitions of Industry 4.0 imply that digitalization is an integral part of this term. Enterprises’ digitalization is understood as a transition from previous industrial stages. It is a connected, innovative enterprise of the Industry 4.0 era [99]. The technology perspective emphasizes the diffusion of digital technologies as an enabler for digital transformation [100]. This approach concentrates mainly on technology capability and integration, customer and other stakeholder interfaces, distributed value creation, market, time, and change consequences of digital transformation [2]. Therefore, we assume that enterprises with a higher level of technology (physically) implemented will gravitate towards a higher level of digitalization. It is mainly due to the philosophy of the fourth industrial revolution. As such, we propose the following Hypothesis 1:
Hypothesis 1 (H1).
Industry 4.0 technology readiness has a positive impact on digitalization.
Second, digital technologies generate more and more opportunities to support the product lifecycle [75], particularly data analysis and visualization (augmented/virtual reality). Industry 4.0 is permeating the entire enterprise value chain—although most value chains are interpreted through the lens of the manufacturing function, possibly supplemented by logistics operations [101]. The degree of autonomy of processes and decision-making in an organization is one of the fundamental characteristics of Industry 4.0 [102]. Available Industry 4.0 technologies increase the entire value creation process [103]. Big data drive smart manufacturing through association, prediction, and control [104]. Based on these findings and sources, we conclude Hypothesis 2:
Hypothesis 2 (H2).
Industry 4.0 technology readiness positively impacts the internal value chain.
Third, Industry 4.0 technologies and concepts allow machines and enterprise algorithms to make autonomous decisions and perform learning activities [105]. In this sense, internal integration and coordination drive independent communication between functional departments and process execution. Communication between departments takes place across management levels too. Thus, the implemented Industry 4.0 technologies can positively influence internal coordination within the enterprise [106]. Their role lies in facilitating communication between departments across the enterprise. It implies Hypothesis 3:
Hypothesis 3 (H3).
Industry 4.0 technology readiness positively impacts internal integration.
Fourth, we argue that digitalization should positively influence internal integration. Digitalization and technology are considered the main drivers of developing inter-functional coordination [106]. Leveraging digital operations suggests that the internal workflow is digitally supported [107]. Digitalization is a tool for developing customer relationships, work performance evaluation, and exploiting market opportunities. Cross-boundary digital technologies such as IoT devices [108] drive transformations of internal process optimization to changes in business strategy [109]. Digital interconnection improves the internal coordination of organizational units and processes [49] and provides data for automated process execution. A fully digitized and integrated approach in the horizontal (external integration) and vertical (integration of information systems in the sense of an automation pyramid) dimensions brings automation to the manufacturing process [110]. From the above, we derive Hypothesis 4:
Hypothesis 4 (H4).
Digitalization positively impacts internal integration.
Fifth, the internal value chain (i.e., a sequence of activities) is facilitated by new Industry 4.0 technologies, digitalization, and automatically managed, internally coordinated electronic processes [101]. The product development cycle is increasingly becoming standardized and automated due to the rise of Industry 4.0, which influences how organizations and humans could act as major industrial drivers in the future [75]. Digitalization assists in designing processes and services to support the dynamic capabilities of enterprises [111]. It includes product and service development, resource allocation practices, and knowledge creation processes. Digital twin technology improves the capacity for the real-time evaluation of production plans and schedules, more accurate forecasting, and faster exception handling during the production process, leading to more realistic production planning [76]. For these reasons, we support Hypothesis 5:
Hypothesis 5 (H5).
Digitalization positively impacts the internal value chain.
Sixth, digitalization provides a mechanism for electronically integrating suppliers [112] and customers [113] and external processes to manage the internal value chain. Instant access to data deduces information asymmetries between sellers and buyers [114]. Digitalization, mass customization, and flexible production strategies will bring companies closer to customers. It enables enterprises to establish a stronger direct connection with customers, strengthen their brand, build customer loyalty, improve customer and market knowledge, and ensure that they stay ahead of new trends, changing values, and evolving expectations. Digitalization creates new forms of interaction between enterprises and customers through new channels [115]. Multi-sided digital platforms and networks replace intermediaries to match sellers and buyers [116]. The real-time availability of information is a significant factor for supplier flexibility in the value chain [117]. Capturing the digitalization of processes and products is a major key factor for the availability of real-time information throughout the supply chain [118]. Ward and Zhou [119] found that information technology (IT) integration and inter-firm IT integration are positively correlated. For these reasons, we propose Hypothesis 6:
Hypothesis 6 (H6).
Digitalization positively impacts external integration.
Seventh, manufacturing flexibility and product customization are changing and transforming how businesses approach the customer. Through Industry 4.0 technologies and digitalization, the customer can influence the final form of products. Such operations are intelligent and allow for the mass personalization of products [6]. Manufacturing customization is predicated on integrated digital support of the entire product lifecycle from the development phase to the production and recycling processes and related customer services [23]. Digital technologies provide customers with the opportunity to co-create products with the manufacturer, e.g., through digital platforms [108]. The application of digital models and additive manufacturing for the internal value chain allows the tailoring of products whilst using the same resources to produce different goods [120]. We argue with Hypothesis 7 that the internal value chain has a
Hypothesis 7 (H7).
Total positive impact on production customization.
Eighth, integration with suppliers in supply chain and supply chain management (SCM) systems and customer relationship management (CRM) systems supports product customization. Christopher and Ryals [66] highlight the importance of the customer as a critical element in managing future supply chain networks through modern technology. In this concept, the customer is both the creator and the user of the personalized product. Business-to-business value is increasingly co-created and captured in many value network partnerships [121]. Digital technology’s substantial impact on the value chains of established companies implies a degree of diversion from core business [2]. We support Hypothesis 8 that:
Hypothesis 8 (H8).
External integration has a total positive impact on production customization.
Ninth, enterprises that already have well-established internal systems and capabilities for data integration and information sharing among their internal functional units can share information and data with external business partners [22]. Stank et al. [122] found that cross-departmental internal information sharing is related to external partner collaboration. Internal integration has a positive influence on both supplier integration [22] and customer integration [45]. Therefore, companies with higher levels of internal integration may potentially have an extraordinary ability to integrate with external partners [22]. In addition, internal departments seek to integrate with external actors who can provide important information necessary to reduce uncertainty. These internal departments can benefit from close collaboration with customers and suppliers [14]. In our view, Hypothesis 9 can be supported: Internal integration has a
Hypothesis 9 (H9).
Total positive impact on external integration.
Tenth, internal integration between functions and departments in the enterprise supports the internal value chain. When communication and collaboration between departments work well, enterprises can use their benefits to improve their internal processes related to value creation in design, development, planning, and production. Pagell [123] studied the integration of manufacturing, logistics, and purchasing functions within the value chain. The internal client, who initiates the demand, is a crucial player in general and financial matters, management, technical and operational, and cross-cutting departments [124]. The main factors are structure, culture, facility layout, job rotation, and cross-functional teams. It means variables related to the internal integration and coordination of firms. Internal coordination between marketing [125] and production [126] functions uses knowledge to achieve innovation goals. Coordination between marketing and production increases market knowledge, enabling firms to manage complex and customer preferences [127]. From an intro-organizational point of view, the purchasing department is a bridge to internal customers. A particular type of coordination is expressed in the area of multi-corporate companies with strategic business units [128]. We propose Hypothesis 10 that:
Hypothesis 10 (H10).
Internal integration has a total positive impact on the internal value chain.

3. Materials and Methods

The aim of the paper is to specify the importance of Industry 4.0 and digitalization for the product customization process. The model is designed and evaluated to explore the effects of Industry 4.0 technologies and digitalization in organizations. Our study points out the theoretical conceptualization of digitalization for product customization processes. We want to demonstrate the advantages and characteristics of the enterprise environment.

3.1. Data Sample

We conducted our research through a questionnaire survey from May 2019 to January 2021 in predominantly industrial enterprises. The planned number of enterprises surveyed stems from the total number of 180,520 enterprises in the manufacturing industry in the Czech Republic [129]. We contacted a total of 3000 industrial enterprises. The survey resulted in the removal of seven of the 320 questionnaires received due to incompleteness, duplicate responses, and inaccuracies in identifying subjects. The overall return rate of the questionnaires was around 9.38%. The calculations show that the estimated margin of error of the research sample is 5.54%. Thus, the research sample consists of a total of 313 enterprises, which were further processed for analysis and statistical processing.
Sample distribution is based on stratified random sampling related to the enterprise size according to Act No. 563/1991 Coll criteria, “On Accounting” and technological intensity based on the Czech Statistical Office methodology [130]. We aimed for an equal proportional representation of each category to ensure that the research sample is representative. The technology intensity of the enterprise sector is represented in 54.95% of enterprises operating in the higher technology intensity sector (n = 172) and 45.05% of enterprises (n = 141) in the lower technology intensity sector. Enterprises are further characterized by size in 35.46% (x = 111) of cases from large enterprises (250+ employees, assets > CZK 500 million, turnover > CZK 1000 million), in 29.07% (n = 91) of cases from medium-sized enterprises (50–249 employees, assets < CZK 500 million; turnover < CZK 1000 million), in 35.46% (n = 111) of cases from small enterprises (10–49 employees, assets < CZK 100 million; turnover < CZK 200 million).
We surveyed online or by visiting the enterprises in person. The research team included researchers and students of the University of South Bohemia in Ceske Budejovice. The structured questionnaire was developed with university researchers and 15 business managers using the Delphi method. The questionnaire was aimed at business managers, especially from production and management. The questionnaire contained partly questions related to calculating the VPi4 index of Industry 4.0 level in enterprises. The questionnaire also included 35 inquiries related to digitalization, but only those relevant to the study are described. The questions from the questionnaires were formulated based on the respondents’ experiences of digitalization in enterprises. They included a set of questions concerning the conceptual research model.

3.2. Construct of Variables and Indicators

All variables in the conceptual model are based on multi-item scales (see Appendix B; Table A2 and Table A3) and are described in the theoretical background.
Technology readiness. The technology level of Industry 4.0 is the input variable of the conceptual model. The chosen indicator that measures the level of technological readiness is derived from the VPi4 index founded on the results of exploratory factor analysis [131]. For technological readiness, only the second level of the VPi4 index was chosen, which links production with new technologies and enables the implementation of smart manufacturing. The resulting index value is determined by the extent to which information technology (weights = 0.5251) and systems infrastructure (weights = 0.7577), and linked data connected (weights = 0.5750) to sensors (weights = 0.5844), robots (weights = 0.5449), and mobile terminals (weights = 0.5448) are implemented. Cronbach’s alpha for the technology readiness construct was 0.7483. For simplicity, we expressed the model variable as a single-factor measurement and converted the index value based on the % rank to a five-point scale: 0–20%—1, 21–40%—2, 40–60%—3, 60–80%—4, 80–100%—5. This procedure simplifies the model and allows easy comparison of Industry 4.0 in enterprises using the VPi4 index.
Other variables such as digitalization, internal integration, external integration, and internal value chain were constructed through exploratory factor analysis. After eliminating indicators with lower factor loadings, the resulting factor analysis expresses 78% of the explained variance (Appendix A, Table A1).
Digitalization. The construct of digitalization is compiled based on a measured model by Yáñez [132] and includes the main parts of electronic communication between machines, robots, equipment via electronic connection, wireless, IoT, cloud [43], and vertical integration of information systems [19]. All indicators are measured on a 5-level scale, where 1 represents the lowest level (‘I totally disagree’) and 5 is the highest level (‘I totally agree’).
External integration. Similarly to the study [45], external integration consists of indicators of cooperation with suppliers and customers. However, we do not consider supplier development as an indicator of external integration because providing feedback is usually part of supplier partnering. As mentioned in Droge et al. [56], supplier partnering means supplier development activities on a strategic level and partnership can be viewed as a strategic collaboration. We used 5-point scales (‘1—totally disagree’, ‘5—totally agree’ with question claim).
Internal value chain. The internal value chain reflects three aspects of the inner product lifecycle: product design, planning process, and manufacturing. It is similar to the view described by Cao and Folan [73], i.e., product conception, design, production in the manufacturing phase. We did not include use and support/maintenance, reuse/recycling phases because they are not part of product customization and are related mainly to other services. Responses were recorded on 5-point scale, ‘1—totally disagree’ to ‘5—totally agree’.
Internal integration. Construct internal integration is the interconnection of business units and processes [22]. Such interconnection positively influences teamwork, information sharing, and strategic cooperation. We added to this construct the automatic execution of operations, which puts the collaboration between departments on a higher level due to the potential standardization of processes. A 5-point scale was used: ‘1—totally disagree’, ‘5—totally agree’.
Customization. Finally, customization is seen as the degree to which customers can flexibly modify products to meet the exact needs and interests of the customer [71]. The level of customization was measured on a 5-point scale: ‘1—totally disagree’, ‘5—totally agree’ with question sentence. This variable is taken as the output of the whole conceptual model. Here, we used only the single-indicator measurement variable, where the construct scores are identical to the standardized indicator values. We increase the validity of the responses by adding question explanations to the respondents through an additional description.
Preliminary face validity of the construct variables was obtained through expert review by the research team. Other forms of validity in the measurement model are further considered in Section 4 (Results). We used internal consistency (Cronbach’s alpha), construct validity, convergent validity, indicator multicollinearity, and discriminant validity (HTMT) measures. Reliability/consistency of construct variables was tested using Cronbach’s alpha. Dijkstra–Henseler rho (ρA), as a predictor of construct validity, should be greater than 0.7070 to be considered adequate [133]. Convergent validity is measured by the average variance extracted (AVE), and it is suggested to provide good empirical evidence when it is more significant than 0.5 [134]. We used the Heterotrait–Monotrait Ratio of Correlations (MTMT) for the discriminant validity of construct variables. Recommended values should be significantly lower than 0.8500 [135]. Indicator multicollinearity is calculated through the variance inflation factor (VIF) per set of indicators. However, the VIF values should not exceed 5.00 [136]. The coefficient of determination (R2) is used to measure explained variance in research and the originality of exogenous indicators in influencing each construct variable.

3.3. Methods

We used structural equation modeling (SEM) to test hypotheses related to the antecedents and consequences of digitalization and Industry 4.0. We estimated the model using partial least squares (PLS), which belongs to variance-based methods. The estimation of the PLS path model includes an iterative algorithm for determining the composite scores of each construct variable, a correction of factorial variables, parameter estimation, and bootstrapping for inference statistics [137]. We used a common factor-based model that hypothesizes about latent variables explained by a set of indicators [138]. Structural equation models are formally defined by two sets of linear equations: the measurement and the structural model. The measurement model specifies the relationships between a construct and its observed indicators (also called manifest variables), while the structural model specifies the relationships between observed variables [137].
We performed the calculations in the ADANCO software to estimate the measurement model based on latent variables that compose the common factor by a set of indicators [139]. We choose ‘the mode A consistent’ setting for the weighting scheme, which obtains consistent inter-construct correlations, path coefficients, and factor loadings. We chose this setting because the variables were obtained from exploratory factor analysis. This procedure and settings are typical for behavioral sciences, where latent variables are traditionally modeled using reflective measurement by a set of indicators. The advantage of this setting is that it can be applied to variables with an unknown frequency distribution. For PLS, the preferred option is using maximum likelihood methods [140].
The model’s goodness of fit relies on bootstrapping to determine the likelihood of obtaining a discrepancy between the empirical and the model-implied correlation matrix [141]. The ADANCO software provides the unweighted least squares discrepancy (dULS), geodesic discrepancy (dG), and standardized root mean squared residual (SRMR) for the determination of the goodness of fit. Traditional SRMR is based on the Euclidean distance between the two correlation matrices. In the literature, usually, recommended values are lower than 0.0500. However, Henseler and Sarstedt [142] pointed out that recent studies show correct models with a cut-off value of 0.06. Therefore, it is preferable for all measures of model fit to use the 95% and the 99% percentiles that prove that the theoretical model was true. If estimates exceed these values, the model is unlikely to be accurate [139].
The model evaluation further provides coefficient estimates for the structural paths. The results include direct, indirect, and total effects and several model evaluation measures. Indirect effects are elements of the mediation analysis and can explain the significance of the structural composition of the model. Cohen’s f2 indicates the effect size of these pathways, where higher values are attributed to direct effects and lower values to substantial effects. Cohen [143] states that a strong effect size f2 ≥ 0.35, a moderate effect size 0.15 ≤ f2 < 0.35, a weak effect size 0.02 ≤ f2 < 0.15, and f2 < 0.02 is an insignificant effect. Path coefficients (β) are evaluated for significance via inference statistics, which provide one-sided or two-sided tests [139].

4. Results

We divided the results into two parts: evaluation of the measurement model and assessment of the structural model.

4.1. Evaluation of Measurement Model

The measurement model specifies the relationships between construct variables and their indicators. The measurement model consists of a set of indicators that form latent variables. These common factor models are expected among indicators with high correlation patterns. The evaluation of the reflection measurement model includes reliability, validity, weights, loadings (Table 1), and overall model fit (Table 2).

4.1.1. Reliability and Validity

Reliability. The construct reliability is assessed based on the value of Dijkstra–Henseler’s rho (ρA), which should be larger than 0.7070. This condition is fulfilled for all constructs under study. The results show that Cronbach’s alpha (α) values for the defined variable constructs are satisfactory (digitalization = 0.8507, external integration = 0.8892, internal value chain = 0.8398, internal integration = 0.8066). As a single-factor variable, customization is not part of this evaluation, and technological readiness reliability is based on the results of related research of the VPi4 index.
Validity. The results show that AVE as the average indicator of convergent validity for all constructs exceeds the 0.5000 cut-off. It means that reflective constructs exhibit sufficient unidimensionality. The discriminant validity of variables based on Heterotrait–Monotrait Ratio of Correlations (HTMT) values varies between 0.2079 and 0.7350. It implies that these values are at acceptable levels below 0.8500.

4.1.2. Multicollinearity, Loadings, and Weights

Multicollinearity. The variance inflation factor (VIF) can affect the results due to questionable multicollinearity. The recommended values below five were observed for the indicators examined. Results suggest that multicollinearity is not a problem in the data.
Loadings and weights. Weights determine the construct scores as a weighted sum of their indicators. The results show that the highest values of weights are for internal and external integration. Standardized loadings reflect the correlation between an indicator and its construct, ranging from 0.6864 to 0.8906. These values reflect the degree of saturation of the latent variable by the individual factor loadings.

4.1.3. Overall Fit of the Saturated Measurement Model

The evaluation of the model’s overall fit evaluates the total validity of the measurement model. A saturated model corresponds to a model in which all constructs are loosely correlated [133], while a concept operationalization corresponds to a conceptual model. We used a factor weighting scheme for internal weighting. The statistical inferences for confirmatory factor analysis are based on a bootstrap procedure (5000 bootstraps). The overall fit results are captured in Table 2 through three measures: SRMR, dULS, dG. The value of the SRMR is very low and meets the cut-off condition of 0.0800 [144] and the more rigorous assessment with cut-off of 0.0500. The discrepancy measures show that the SRMR value of 0.0278 is below the 95% and 99% quantile of reference distribution (HI95, HI99). Therefore, we can conclude that the latent variables are incorporated in the model. Similar conclusions can be drawn for the dULS and dG measures, whose values are below the recommended reference distribution quantiles. Thus, the proposed conceptual measurement model should be consistent with the empirical one and evaluate its structure.

4.2. Evaluation of the Structural Model

We assessed the structural model for correlations between construct variables, path coefficient, direct/indirect/total effects, effect size (Cohen’s f2), coefficient of determination (R2), and goodness of model fit.

4.2.1. Overall Fit of the Saturated Measurement Model

The correlation matrix contains the estimated correlations between constructs. Table 3 shows that the highest level of correlation is between digitalization and technology readiness. Similarly, internal integration has a very close relationship with the internal value chain too. Higher correlation coefficients between constructs may be indicative of possible influences between them.

4.2.2. Evaluation of the Overall Fit of the Estimated Model

We evaluated the primary measures of the goodness of model fit of the estimated model through the bootstrap-based test of overall model fit. Our bootstrap sample had 5000 attempts, and the iterative algorithm converged after five iterations. Table 4 shows that all values of discrepancy measures were below the 95% and 99% quantile of their reference distribution. It means that the estimated model was not rejected at a 5% and 1% significance level. Moreover, the SRMR was lower than the recommended cut-off, reflecting a good model fit. The results conclude that the proposed model adequately fits the collected data. We can therefore conclude that the proposed conceptual model has been confirmed. We have further analyzed its structure in depth.

4.2.3. Results of the Structural Model Effects

The path coefficient (β) represents the direct relationship (effect) between the independent (exogenous) and dependent (non-exogenous) latent variable. The significance of this relationship is expressed through the empirical t value by bootstrapping and indicates the relevance of path relationships between variable constructs. Indirect effects describe the situation where variable A affects variable C through the other variable B (i.e., represented graphically as the path A → B → C). The total effect is the sum of all direct and indirect effects on one variable. The significance of the direct effect is then reflected by a measure of effect size (Cohen’s f2), which expresses the substantiality of the direct effect between variables. Table 5 provides an overview of all effects in the structural model, including an indication of their statistical significance.
Table 5 shows that the most significant direct effect is the relationship between technology readiness and digitalization variables. This strength of the effect is supported by taking the very high Cohen’s measure (f2 = 0.9911). The direct relationship between internal and external integration (f2 = 0.4258) can be considered highly significant. These two relationships both exceed the 0.3500 thresholds, indicating a strong effect. On the other hand, the relationship between the variable technology readiness and external, internal integration, and internal value chain can be described as a significant indirect effect. We can identify the most significant relationships between the variables technology readiness and internal integration, and technology readiness and internal value chain, regarding the overall effect.
Figure 2 captures the whole structure of the model, including the statistically significant paths indicated by the p-values. The coefficient of determination (R2) values provide insights into the model’s predictive relevance. These values correspond to the goodness of fit in regression analysis and denote the explained variance of the latent variable. Figure 2 reports the relationship between the indicators and their latent variable construct. Each indicator includes a high value of factor loading. This finding implies the excellent generalizability of the findings.

4.2.4. Results of Hypotheses Evaluation

We evaluated ten hypotheses as to the significance of path coefficients through a one-tailed t test based on the results of the standard bootstrap. The hypotheses dealt with effects among latent variables. Thus, confirmation of the hypothesis means that the relationship between latent variables is statistically significant, i.e., one variable affects the other. The results presented in Table 6 show that all hypotheses except H2 and H6 were confirmed. Thus, the model essentially ensures the predicted relationships between the variables.
However, if we include indirect effects in the relationships between variables (Table 5), the overall effect would be statistically significant for hypotheses H2 and H6. It is an exciting result as it introduces the importance of mediation between variables into the model.
In the case of H2, the direct effect of technology readiness on the internal value chain was not confirmed, but the mediator of the indirect effect may be the variable internal integration. Here, then, both the indirect effect (p-value = 0.0001) and the overall effect are statistically significant (p-value < 0.0001). It means that technology readiness influences the internal value chain through internal integration. Therefore, interdepartmental collaboration helps to leverage technology for the internal value chain.
Similarly, for H6, there was no statistically significant effect of digitalization on external integration in firms. However, taking into account indirect effects, the situation is different. The overall effect of digitalization on external integration will be statistically significant (p-value < 0.0001). Once again, the variable internal integration is the mediator, supporting cooperation with suppliers and customers through functioning interdepartmental collaboration and process automation.
Thus, in the model, we found a highly significant role for internal integration, which facilitates the use of technology and digitalization to manage the internal value chain and external collaboration with enterprises and customers. Accordingly, enterprises need to integrate their business processes and functions before implementing new technologies and digital transformation. Without these initiatives, the impact of transformation and change may not be successful.

5. Discussion

This section summarizes and discusses the main findings of the work, theoretical and practical implications, the contribution of the proposed model, and research limitations.

5.1. Conceptual Model and Theoretical Implications

Customization of the product design process has become one of the manufacturing Industry 4.0 trends. We developed a conceptual process model based on the studied literature, which was subsequently verified through the structural equation modeling method. The model relies on the use of Industry 4.0 technologies and digitalization to customize products. Parts of the model include variables characterizing firms’ internal and external linkages and their environment. We can also understand them as necessary characteristics of the enterprise environment that influence the implementation of modern technologies and digital transformation success. Technology and digitalization are changing the enterprise environment. They allow enterprises to exploit advantages for customization on customer demand. The individual relationships in the model were converted into research hypotheses and verified through statistical tests.
The first three hypotheses (H1–H3) dealt with the impact of technology readiness on digitalization, internal value chain, and internal integration in enterprises. The results showed that technology readiness directly affects digitalization (H1). It is in line with the definition of Industry 4.0. Digitalization is a tool or means to transform businesses into smart factories. [99,100]. Thus, higher levels of technology positively impact the adoption of digitalization in enterprises. The second hypothesis (H2) examined the impact of technology readiness on the internal value chain. In this case, we could not confirm a direct relationship between the variables studied. It contrasts with the findings of research [101,103], which concluded that Industry 4.0 technologies influence the value creation process and manufacturing and logistics operations. However, technology readiness can influence the internal value chain through internal integration. In practice, it means that technology impacts the value chain if the right internal conditions are created for this purpose, including functioning interdepartmental collaboration and automatic process execution. Although this influence of the internal environment has not been investigated in the studies mentioned above, it may be an important determinant of the implementation of new technologies. The third hypothesis (H3) directly addressed the impact of technology on internal integration. It was statistically confirmed. It implies that technology contributes to better departmental integration and communication. Therefore, this result is congruent with the study results [103] and confirms one of the requirements of Industry 4.0 in enterprises, which is the need for horizontal and vertical integration and integration of engineering processes [37].
The other three hypotheses (H4–H6) focused on the impact of digitalization on internal and external integration and the internal value chain. Our confirmation of the fourth hypothesis (H4) showed that digitalization positively affects internal integration. This finding is in agreement with the literature, in which positive effects of digitalization have been found for internal workflow [107], internal coordination of organizational units and processes [49], or inter-functional coordination [106]. Further, the fifth hypothesis (H5) was also able to confirm that digitalization also has a positive impact on the internal value chain. The sequence of internal activities of the value chain, such as product development or production, is supported by digitalization [101]. More accurate planning of production processes can also occur [76]. In contrast to the internal organizational variables, the sixth hypothesis (H6) failed to confirm the effect of digitalization on external integration. We interpret this result by arguing that enterprises first need to monitor internal processes and departments for successful digital connectivity and integration with suppliers and customers. We agree that digitalization can provide real-time integration and availability of information in the supply chain [118]. However, non-functioning back-end and non-transparent communication can be a barrier to the better use of data shared with customers and suppliers.
The model includes hypotheses (H7 and H8) examining the impact of the internal value chain and external integration on customization. Both of these hypotheses were statistically confirmed. For the internal value chain, we find that adjusting internal processes to be flexible in production, planning, and development greatly influences the possibilities of customizing products for customers. The design and functionality of products can be exploited when production customization stems from integrated digital support throughout the product lifecycle [23]. Similarly, modern digital models and additive manufacturing capabilities can support the internal value chain [120]. In addition, the connection with suppliers and customers via modern information systems is also essential for customization. According to other research, customers can be integrated to create new products [67] by using platforms for interaction [69] or co-creating products and services [70]. Suppliers are then the engine for integrating the entire supply chain, with the possibility of coordinating it [61] across different business systems through the integration of modern technologies.
Finally, we assessed the impact of internal integration on external integration and the internal value chain through hypotheses (H9 and H10). These hypotheses were statistically confirmed. The relationship between internal integration and external integration has been investigated quite frequently in the literature [22,45]. Thus, our research supports the premise that an internally integrated environment positively influences successful integration with external stakeholders, customers, and suppliers. Indeed, enterprises can usually benefit from the experience and functioning communication between departments, which is reflected in the relationships with the external environment. We found that internal integration related to the internal value chain and the functioning and communication between departments positively influence the product’s lifecycle. This conclusion is supported by research on the integration of production or logistics functions [123] or the relationship between marketing [125] and production functions [126]. The coordination and internal integration of these functions assist in implementing individual lifecycle processes.

5.2. Barriers and Limitations

Although digitalization and new technologies are considered drivers of customization and change management when combining customization and technology, it is necessary to mention some barriers to their implementation. Industrial enterprises cannot afford to remove and replace all old technologies with new tools, and it must be stressed that employee training takes time and effort. Empirical research [145] shows that implementing and using Industry 4.0 requires a change in corporate culture. As Murphy [146] argues, AI technologies are not mature enough to prove their effectiveness. For example, Walmart recently decided to stop using robots to scan shelves in its stores and employ 20,000 people to keep up with the 74% increase in online sales. The complexity of customization and e-commerce is still an issue, as Industry 4.0 requires a combination of software, hardware, sensors, and devices provided by multiple companies, which are not always compatible with each other. Customization does not play a crucial role in profits, but it always plays a positive role, as Wang [147] also found in his study. Through data collected from 308 Chinese customers who participated in social network service personalization, it showed that customization toolkits have a marginal but positive effect on client purchases. According to Chen et al. [86], barriers to such processes can include overestimation of internal ERP systems, the robustness of Swan Cosmetics systems currently having 170 tribal programmers, slow information flow, and last but not least, the employees themselves. A study of 195 German companies [148] shows that managers are concerned about a wide range of possible technologies, which differ in their high diversity of functions and possible solutions due to different providers. These concerns can also be a barrier to further development and new technologies.
The research limitation is related to SEM method shortcomings, the data sample, and the generalization of the results. The main drawback of the proposed model could be the lack of indicators for individual latent constructs. According to Henseler [139], the SEM requires at least one available indicator. However, Marsh et al. [149] recommend using more indicators (a minimum of four items) per factor (latent construct) to provide greater interpretability, reliability, and accuracy, fewer non-converged and incorrect solutions, and stable estimates. We chose the single-indicator measurement solution for this study’s technology readiness and customization variables. Rossiter [150] states that if the construct is specific, there is no need for more than one indicator, and the validity will be adequate. According to Sackett and Larson [151], if the construct is narrow in scope, unidimensional, and unambiguous to the respondent, it is a good approach. The notion of customization in the model is defined in general terms. Customization is meant as the ability of the customer to customize the product flexibly. Thus, it is not addressed how the customer could make this modification. Therefore, we consider the construct of customization as sufficiently specific. For technology readiness, we rely on the value of the Industry 4.0 level indicator VPi4, where reliability and research validity are clearly defined [131]. It is due to the possibility of linking the model to the assessment of the Industry 4.0 level in enterprises. Otherwise, the construct can be described by a set of indicators listed in Appendix B. The estimation of this solution with individual indicators of the technology readiness variable has promising results. Another problem concerns the uniqueness of factor loadings under certain rotations or transformations [152]. Other drawbacks may be the issue of path directionality, which is not statistical but rather theoretical. It is important to acknowledge that an over-identified model may not provide a unique solution, as SEM works with iterative estimation processes and models may converge at local minima or suboptimal quasi-solutions [153]. Another issue may relate to the model structure, given that, if there are redundant paths in the model, this will be reflected in a worse SRMR score [139]. However, these paths may have a theoretical basis. In addition to the mentioned limitations related to the SEM method, the sample structure may limit the generalization of the research results as the research was conducted in the Czech Republic. Enterprises in the Czech Republic have a certain level of product customization and use technology to a degree that may be different from other countries. However, most of the enterprises surveyed (44.73%) have foreign owners or are part of a foreign enterprise. Multi-national enterprises may obviously have locally tailored product customization strategies, although, more commonly, the tools, technologies, and capabilities will be similar across countries. This is noticeable with respect to e-commerce, as websites and applications are in most cases identical and only the choices for the end customer differ.

6. Conclusions

Over the last decade, digitalization has become a recognized prerequisite for successfully implementing product customization projects. It is acknowledged that nearly a quarter of customers are willing to pay more to receive a personalized product or service and 22% of consumers are happy to share some data in return for a more personalized customer product or service [8]. For the e-commerce segment, the customization process associated with Industry 4.0 technologies is a massive opportunity for further development. E-commerce has fostered the digitalization of businesses and consumers and led to efficient and effective digital processes [154]. It can be expected that enterprises will invest heavily to ensure that the winner is the customer who receives a better, faster, more convenient, cheaper, and safer service. The customers can input designs for companies to customize products quickly and with lower prices than those who carry out the standardization. Producers and customers are both in a position to create new value. It is the purpose of filling the gaps between mass customization and personalization processes, which can be achieved with industry 4.0 technology [6].
The paper examines the importance of process modification for product customization in the sense of manufacturing in Industry 4.0. We developed a conceptual process model that includes the relationships between technological readiness, digitalization, internal and external integration, internal value chain, and customization. We used the SEM method for model confirmation, and goodness of fit measures show acceptable values. The proposed process model can be generalized to any form of product customization because it uses significant organizational variables that influence it. However, caution should be taken in applying the findings to specific technical product customization solutions. In this case, it is more appropriate to separate the technical side of customization from the organizational side, which includes factors that influence the implementation of these projects.
We confirm the relationships between the model variables, especially the effect of technological readiness on digitalization, internal integration on external integration, technology readiness on internal integration, and technology readiness on the internal value chain in terms of product customization. We confirm that internal processes and external integration significantly influence product modification capabilities. The relationships between the variable technology readiness on the internal processes and digitalization on external integration yielded exciting results. In both cases, the relationship between the variables was significant only when indirect effects were taken into account. The variable internal integration played a mediating role in the relationship. We can see that the internal environment plays an essential role in successfully implementing digitalization and technologies.
The results showed that Industry 4.0 technologies and digitalization positively affect product customization if they support enterprises’ internal and external integration and value chain. We demonstrate that internal and external factors undeniably impact the enterprise environment. New opportunities for customers are triggered by the new technologies of Industry 4.0 and digitalization. They allow the creation of entirely new business models in enterprises [21]. The shift from mass customization to electronic, customer-, and data-driven personalization is evidenced by the growing practical need for flexible online customization frameworks and solutions [12]. It makes the supply chain integration capable of producing personalized products of good quality, at a reasonable price, on time, and in the required quantity [155].
In future research, we plan to determine the impact of enterprise size and industry in the proposed model. We can expect that there will be differences between enterprises. Mainly, there are differences between small and large enterprises or some sectors with higher technology intensity and industries with lower technology intensity. Another direction for future research is extending the model to include different forms of customization. It may be interesting to see how mass customization and modern personalization results will differ here. Our research can be further extended by analyzing the relationship of specific Industry 4.0 technologies with different types of customization. It means discovering the technologies with practical applications for personalization (cloud computing) and those more readily applicable for mass customization (e.g., 3D printing). Finally, the research can focus on actor-centric aspects of digital transformation as viewed by Nadkarmi and Prugl [2]. This focus of research may address the effects of corporate culture, leadership, or customer personality on the components of the proposed model.

Author Contributions

Conceptualization, M.P.; methodology, M.P.; software, M.P.; validation, M.P.; formal analysis, M.P.; investigation, M.P. and J.V.; resources, J.V.; data curation, M.P.; writing—original draft preparation, M.P.; writing—review and editing, M.P. and J.V.; visualization, M.P.; supervision, M.P.; project administration, J.V.; funding acquisition, J.V. All authors have read and agreed to the published version of the manuscript.

Funding

This research was funded by “EF-150-GAJU 047/2019/S”, supported by the University of South Bohemia in Ceske Budejovice.

Institutional Review Board Statement

Not applicable.

Informed Consent Statement

Not applicable.

Data Availability Statement

Data available in a publicly accessible repository.

Acknowledgments

The authors thank the enterprises for taking part in the research.

Conflicts of Interest

The authors declare no conflict of interest.

Appendix A

Appendix A includes the results of exploratory factor analysis in Table A1.
Table A1. Exploratory factor analysis results (Varimax rotation).
Factor DescriptionF1F2F3F4Indicator Abbreviation
DigitalizationExternal
Integration
Internal Value ChainInternal Integration
Customers0.16100.89400.09910.2201EXI1
Suppliers0.14340.91110.12520.1652EXI2
Departments0.17850.41370.26130.7323ICO1
Processes0.25700.24550.20760.8070ICO2
Development0.18670.16130.85740.0146PLC1
Planning0.22350.10540.76170.4189PLC2
Manufacturing0.28620.10540.70180.4304PLC3
Information systems0.73950.16400.36120.1767DIG1
Communication0.79400.20030.21570.1880DIG2
IoT and cloud0.75860.16040.15810.2094DIG3
Integration0.75420.13350.15580.1592DIG4
Eigenvalues2.63252.01962.17101.7599Total = 8.5830
Explained variance0.23930.18360.19740.1600Total = 0.7803

Appendix B

Appendix B includes a description of all variables in the conceptual model.
Table A2. The measurement items and indicators.
External IntegrationIndicatorMeanStd. Dev.
→ EXI1We are connected to customers and processes are electronic3.61981.7236
→ EXI2We are connected with suppliers and processes are electronic3.53351.7817
Internal integrationIndicatorMeanStd. dev.
→ ICO1Organizational departments are connected and processes are carried out electronically3.52401.7182
→ ICO2Computer technology (IT) supports the automatic execution of processes3.24921.9313
Internal value chainIndicatorMeanStd. dev.
→ PLC1New product design and the development process is digitized2.93612.2651
→ PLC2The production planning process is digitized3.20131.8920
→ PLC3The manufacturing and production control is digitized3.00641.7820
DigitalizationIndicatorMeanStd. dev.
→ DIG1Machines, robots, and equipment are controlled and managed by information systems2.74442.1332
→ DIG2Machines and devices communicate with each other 2.27161.8010
→ DIG3Machines and devices communicate via the Internet (using IoT, cloud)2.07351.6004
→ DIG4All systems, devices, machines are integrated into information systems across hierarchical levels2.08631.5342
CustomizationIndicatorMeanStd. dev.
→ CUSTTo what extent can the customer flexibly customize the product?
(5-point Likert scale with anchors: 1 totally disagree … 5 totally agree; where 1 means craft/tailored production and 5 is possibility of mass personification)
2.76042.3495
Note: the indicators are evaluated on the 5-point Likert scale with anchors: 1 totally disagree … 5 totally agree.
Table A3. The measurement items and indicators of VPi4.
Index VPi4IndicatorMeanStd. Dev.
→ VPIWhat is the level of the Industry 4.0 technology readiness in your company according to the second level of VPi4 index? * (based on the % rank, readiness is evaluated as five levels: 0–20%—1, 21–40%—2, 40–60%—3, 60–80%—4, 80–100%—53.16931.4488
* Note: VPi4 index (Vrchota, Pech, 2019) at second level include necessary Industry 4.0 technology: IT infrastructure (weights = 0.5251), information systems architecture (weights = 0.7577), using linked big data (weights = 0.5750), use of robots and robotic arms (weights = 0.5449), using mobile terminals (weights = 0.5448), and use of sensors (weights = 0.5844).

References

  1. Jafari-Sadeghi, V.; Garcia-Perez, A.; Candelo, E.; Couturier, J. Exploring the Impact of Digital Transformation on Technology Entrepreneurship and Technological Market Expansion: The Role of Technology Readiness, Exploration and Exploitation. J. Bus. Res. 2021, 124, 100–111. [Google Scholar] [CrossRef]
  2. Nadkarni, S.; Prügl, R. Digital Transformation: A Review, Synthesis and Opportunities for Future Research. Manag. Rev. Q. 2021, 71, 233–341. [Google Scholar] [CrossRef] [Green Version]
  3. Mathradas, A. Council Post: COVID-19 Accelerated E-Commerce Adoption: What Does It Mean for the Future? Available online: https://www.forbes.com/sites/forbesbusinesscouncil/2021/12/29/covid-19-accelerated-e-commerce-adoption-what-does-it-mean-for-the-future/ (accessed on 21 January 2022).
  4. Acosta, G. Wegmans, Trader Joe’s Master Pandemic Customer Service. Available online: https://progressivegrocer.com/wegmans-trader-joes-master-pandemic-customer-service (accessed on 21 January 2022).
  5. Zhang, X.; Ming, X.; Liu, Z.; Zheng, M.; Qu, Y. A New Customization Model for Enterprises Based on Improved Framework of Customer to Business: A Case Study in Automobile Industry. Adv. Mech. Eng. 2019, 11, 168781401983388. [Google Scholar] [CrossRef] [Green Version]
  6. Wang, Y.; Ma, H.-S.; Yang, J.-H.; Wang, K.-S. Industry 4.0: A Way from Mass Customization to Mass Personalization Production. Adv. Manuf. 2017, 5, 311–320. [Google Scholar] [CrossRef]
  7. Crowther, S.; Ford, H. My Life and Work; Project Gutenberg; Illinois Benedictine College: Champaign, IL, USA, 2005. [Google Scholar]
  8. Deloitte. The Deloitte Consumer Review—Made-to-Order: The Rise of Mass Personalisation. Available online: https://www2.deloitte.com/content/dam/Deloitte/ch/Documents/consumer-business/ch-en-consumer-business-made-to-order-consumer-review.pdf (accessed on 21 January 2022).
  9. Ernest-Jones, T. The Digital Company 2013: How Technology Will Empower the Customer. Available online: https://www.pwc.com/gx/en/technology/assets/digital_co_1.pdf (accessed on 5 January 2022).
  10. Oliver, K.; Moeller, H.L.; Lakenan, B. Smart Customization: Profitable Growth through Tailored Business Streams. Strategy+Business 2004, 34. Available online: https://www.strategy-business.com/article/04104 (accessed on 15 January 2022).
  11. Resca, A.; Za, S.; Spagnoletti, P. Digital Platforms as Sources for Organizational and Strategic Transformation: A Case Study of the Midblue Project. J. Theor. Appl. Electron. Commer. Res. 2013, 8, 11–12. [Google Scholar] [CrossRef] [Green Version]
  12. Baranauskas, G. Digitalization Impact on Transformations of Mass Customization Concept: Conceptual Modelling of Online Customization Frameworks. MMI 2020, 3, 120–132. [Google Scholar] [CrossRef]
  13. Wiedmann, K.-P.; Hennigs, N.; Varelmann, D.; Reeh, M.-O. Determinants of Consumers’ Perceived Trust in IT-Ecosystems. J. Theor. Appl. Electron. Commer. Res. 2010, 5, 137–154. [Google Scholar] [CrossRef] [Green Version]
  14. Koufteros, X.; Vonderembse, M.; Jayaram, J. Internal and External Integration for Product Development: The Contingency Effects of Uncertainty, Equivocality, and Platform Strategy. Decis. Sci. 2005, 36, 97–133. [Google Scholar] [CrossRef]
  15. Zhang, C.; Chen, D.; Tao, F.; Liu, A. Data Driven Smart Customization. Procedia CIRP 2019, 81, 564–569. [Google Scholar] [CrossRef]
  16. Schöning, H.; Dorchain, M. Data Mining und Analyse. In Industrie 4.0 in Produktion, Automatisierung und Logistik; Bauernhansl, T., ten Hompel, M., Vogel-Heuser, B., Eds.; Springer Fachmedien Wiesbaden: Wiesbaden, Germany, 2014; pp. 543–554. ISBN 978-3-658-04681-1. [Google Scholar]
  17. Pech, M.; Vrchota, J.; Bednář, J. Predictive Maintenance and Intelligent Sensors in Smart Factory: Review. Sensors 2021, 21, 1470. [Google Scholar] [CrossRef]
  18. Rymaszewska, A.; Helo, P.; Gunasekaran, A. IoT Powered Servitization of Manufacturing—An Exploratory Case Study. Int. J. Prod. Econ. 2017, 192, 92–105. [Google Scholar] [CrossRef]
  19. Cupek, R.; Drewniak, M.; Ziebinski, A.; Fojcik, M. “Digital Twins” for Highly Customized Electronic Devices—Case Study on a Rework Operation. IEEE Access 2019, 7, 164127–164143. [Google Scholar] [CrossRef]
  20. Tao, F.; Cheng, J.; Qi, Q.; Zhang, M.; Zhang, H.; Sui, F. Digital Twin-Driven Product Design, Manufacturing and Service with Big Data. Int. J. Adv. Manuf. Technol. 2018, 94, 3563–3576. [Google Scholar] [CrossRef]
  21. Nwaiwu, F. Review and Comparison of Conceptual Frameworks on Digital Business Transformation. JOC 2018, 10, 86–100. [Google Scholar] [CrossRef] [Green Version]
  22. Zhao, X.; Huo, B.; Selen, W.; Yeung, J.H.Y. The Impact of Internal Integration and Relationship Commitment on External Integration. J. Oper. Manag. 2011, 29, 17–32. [Google Scholar] [CrossRef]
  23. Bauer, W.; Schlund, S.; Hornung, T.; Schuler, S. Digitalization of Industrial Value Chains—A Review and Evaluation of Existing Use Cases of Industry 4.0 in Germany. Logforum 2018, 14, 331–340. [Google Scholar] [CrossRef]
  24. Schumacher, A.; Nemeth, T.; Sihn, W. Roadmapping towards Industrial Digitalization Based on an Industry 4.0 Maturity Model for Manufacturing Enterprises. Procedia CIRP 2019, 79, 409–414. [Google Scholar] [CrossRef]
  25. Schroeder, A.; Ziaee Bigdeli, A.; Galera Zarco, C.; Baines, T. Capturing the Benefits of Industry 4.0: A Business Network Perspective. Prod. Plan. Control 2019, 30, 1305–1321. [Google Scholar] [CrossRef]
  26. Ober, J. Innovation Adoption: Empirical Analysis on the Example of Selected Factors of Organizational Culture in the IT Industry in Poland. Sustainability 2020, 12, 8630. [Google Scholar] [CrossRef]
  27. Brodny, J.; Tutak, M. Assessing the Level of Digitalization and Robotization in the Enterprises of the European Union Member States. PLoS ONE 2021, 16, e0254993. [Google Scholar] [CrossRef] [PubMed]
  28. Celent, L.; Mladineo, M.; Gjeldum, N.; Zizic, M.C. Multi-Criteria Decision Support System for Smart and Sustainable Machining Process. Energies 2022, 15, 772. [Google Scholar] [CrossRef]
  29. Enyoghasi, C.; Badurdeen, F. Industry 4.0 for Sustainable Manufacturing: Opportunities at the Product, Process, and System Levels. Resour. Conserv. Recycl. 2021, 166, 105362. [Google Scholar] [CrossRef]
  30. Raptis, T.P.; Passarella, A.; Conti, M. Data Management in Industry 4.0: State of the Art and Open Challenges. IEEE Access 2019, 7, 97052–97093. [Google Scholar] [CrossRef]
  31. Tutak, M.; Brodny, J. Business Digital Maturity in Europe and Its Implication for Open Innovation. J. Open Innov. Technol. Mark. Complex. 2022, 8, 27. [Google Scholar] [CrossRef]
  32. Pivoto, D.G.; de Almeida, L.F.; da Rosa Righi, R.; Rodrigues, J.J.; Lugli, A.B.; Alberti, A.M. Cyber-Physical Systems Architectures for Industrial Internet of Things Applications in Industry 4.0: A Literature Review. J. Manuf. Syst. 2021, 58, 176–192. [Google Scholar] [CrossRef]
  33. Rüßmann, M.; Lorenz, M.; Gerbert, P.; Waldner, M.; Justus, J.; Engel, P.; Harnisch, M. Industry 4.0: The Future of Productivity and Growth in Manufacturing Industries; Boston Consulting Group: Boston, MA, USA, 2015; Volume 9, pp. 54–89. [Google Scholar]
  34. Sony, M.; Naik, S. Key Ingredients for Evaluating Industry 4.0 Readiness for Organizations: A Literature Review. Benchmarking Int. J. 2019, 27, 2213–2232. [Google Scholar] [CrossRef]
  35. Mavropoulos, A.; Nilsen, W.A. Industry 4.0 and Circular Economy: Towards a Wasteless Future or a Wasteful Planet? John Wiley & Sons: Hoboken, NJ, USA, 2020. [Google Scholar]
  36. Vaidya, S.; Ambad, P.; Bhosle, S. Industry 4.0—A Glimpse. Procedia Manuf. 2018, 20, 233–238. [Google Scholar] [CrossRef]
  37. Wang, S.; Wan, J.; Li, D.; Zhang, C. Implementing Smart Factory of Industrie 4.0: An Outlook. Int. J. Distrib. Sens. Netw. 2016, 12, 3159805. [Google Scholar] [CrossRef] [Green Version]
  38. Cozmiuc, D.C.; Pettinger, R. Consultants’ Tools to Manage Digital Transformation: The Case of PWC, Siemens, and Oracle. J. Cases Inf. Technol. 2021, 23, 1–29. [Google Scholar] [CrossRef]
  39. Waite, M. Oxford English Dictionary; Oxford University Press: Oxford, UK, 2013. [Google Scholar]
  40. Brennen, S.J.; Kreiss, D. Digitalization. In The International Encyclopedia of Communication Theory and Philosophy; Jensen, K.B., Rothenbuhler, E.W., Pooley, J.D., Craig, R.T., Eds.; Wiley: Hoboken, NJ, USA, 2016. [Google Scholar]
  41. Geisberger, E.; Broy, M. AgendaCPS—Integrierte Forschungsagenda Cyber-Physical Systems; Springer: Berlin, Germany, 2012. [Google Scholar]
  42. Matt, C.; Hess, T.; Benlian, A. Digital Transformation Strategies. Bus. Inf. Syst. Eng. 2015, 57, 339–343. [Google Scholar] [CrossRef]
  43. Entschew, E.M. Acceleration through Digital Communication: Theorizing on a Perceived Lack of Time. Humanist. Manag. J. 2021, 6, 273–287. [Google Scholar] [CrossRef]
  44. Hess, T.; Matt, C.; Benlian, A.; Wiesböck, F. Options for Formulating a Digital Transformation Strategy. MIS Q. Exec. 2016, 15, 123–139. [Google Scholar] [CrossRef]
  45. Yeh, T.-M.; Pai, F.-Y.; Wu, L.-C. Relationship Stability and Supply Chain Performance for SMEs: From Internal, Supplier, and Customer Integration Perspectives. Mathematics 2020, 8, 1902. [Google Scholar] [CrossRef]
  46. Basnet, C. The Measurement of Internal Supply Chain Integration. Manag. Res. Rev. 2013, 36, 153–172. [Google Scholar] [CrossRef]
  47. Kaynak, H. The Relationship between Just-in-Time Purchasing Techniques and Firm Performance. IEEE Trans. Eng. Manag. 2002, 49, 205–217. [Google Scholar] [CrossRef]
  48. Basnet, C.; Wisner, J. Nurturing Internal Supply Chain Integration. OSCM Int. J. 2014, 5, 27–41. [Google Scholar] [CrossRef]
  49. Javalgi, R.G.; Hall, K.D.; Cavusgil, S.T. Corporate Entrepreneurship, Customer-Oriented Selling, Absorptive Capacity, and International Sales Performance in the International B2B Setting: Conceptual Framework and Research Propositions. Int. Bus. Rev. 2014, 23, 1193–1202. [Google Scholar] [CrossRef] [Green Version]
  50. Hillebrand, B.; Biemans, W.G. The Relationship between Internal and External Cooperation. J. Bus. Res. 2003, 56, 735–743. [Google Scholar] [CrossRef]
  51. Kouvelis, P.; Lariviere, M.A. Decentralizing Cross-Functional Decisions: Coordination Through Internal Markets. Manag. Sci. 2000, 46, 1049–1058. [Google Scholar] [CrossRef]
  52. Shen, N.; Au, K.; Li, W. Strategic Alignment of Intangible Assets: The Role of Corporate Social Responsibility. Asia Pac. J. Manag. 2020, 37, 1119–1139. [Google Scholar] [CrossRef]
  53. Wynstra, F.; Weggeman, M.; van Weele, A. Exploring Purchasing Integration in Product Development. Ind. Mark. Manag. 2003, 32, 69–83. [Google Scholar] [CrossRef]
  54. Narasimhan, R.; Swink, M.; Kim, S.W. Disentangling Leanness and Agility: An Empirical Investigation. J. Oper. Manag. 2006, 24, 440–457. [Google Scholar] [CrossRef]
  55. Frohlich, M.T.; Westbrook, R. Arcs of Integration: An International Study of Supply Chain Strategies. J. Oper. Manag. 2001, 19, 185–200. [Google Scholar] [CrossRef]
  56. Droge, C.; Jayaram, J.; Vickery, S.K. The Effects of Internal versus External Integration Practices on Time-Based Performance and Overall Firm Performance. J. Oper. Manag. 2004, 22, 557–573. [Google Scholar] [CrossRef]
  57. Abbas, A.E.; Agahari, W.; van de Ven, M.; Zuiderwijk, A.; de Reuver, M. Business Data Sharing through Data Marketplaces: A Systematic Literature Review. J. Theor. Appl. Electron. Commer. Res. 2021, 16, 3321–3339. [Google Scholar] [CrossRef]
  58. Zhao, X.; Huo, B.; Flynn, B.B.; Yeung, J.H.Y. The Impact of Power and Relationship Commitment on the Integration between Manufacturers and Customers in a Supply Chain. J. Oper. Manag. 2008, 26, 368–388. [Google Scholar] [CrossRef]
  59. Ross, F. Introduction to Supply Chain Management Technologies (Resource Management); CRC Press: Boca Raton, FL, USA, 2010. [Google Scholar]
  60. Vanpoucke, E.; Vereecke, A.; Boyer, K.K. Triggers and Patterns of Integration Initiatives in Successful Buyer-Supplier Relationships. J. Oper. Manag. 2014, 32, 15–33. [Google Scholar] [CrossRef]
  61. Schuh, C.; Strohmer, F.M.; Easton, S.; Hales, M.; Triplat, A. Supplier Relationship Management. How to Maximize Supplier Value and Opportunit; Springer; Apress: New York, NY, USA, 2014. [Google Scholar]
  62. Forslund, H.; Jonsson, P. Dyadic Integration of the Performance Management Process: A Delivery Service Case Study. Int. J. Phys. Distrib. Logist. Manag. 2007, 37, 546–567. [Google Scholar] [CrossRef] [Green Version]
  63. O’Brien, J. Supplier Relationship Management: Unlocking the Hidden Value in Your Supply Base; Kogan Page Publishers: London, UK, 2014. [Google Scholar]
  64. Ragatz, G.L.; Handfield, R.B.; Petersen, K.J. Benefits Associated with Supplier Integration into New Product Development under Conditions of Technology Uncertainty. J. Bus. Res. 2002, 55, 389–400. [Google Scholar] [CrossRef]
  65. Vargo, S.L.; Lusch, R.F. Service-Dominant Logic: Continuing the Evolution. J. Acad. Mark. Sci. 2008, 36, 1–10. [Google Scholar] [CrossRef]
  66. Christopher, M.; Ryals, L.J. The Supply Chain Becomes the Demand Chain. J. Bus. Logist. 2014, 35, 29–35. [Google Scholar] [CrossRef]
  67. Syam, B.N.; Pazgal, A. Co-Creation with Production Externalities. Mark. Sci. 2013, 32, 805–820. [Google Scholar] [CrossRef]
  68. Martinelli, E.M.; Tunisini, A. Customer Integration into Supply Chains: Literature Review and Research Propositions. JBIM 2019, 34, 24–38. [Google Scholar] [CrossRef]
  69. Füller, K.; Weking, J.; Böhm, M.; Krcmar, H. Leveraging Customer-Integration Experience: A Review of Influencing Factors and Implications. CAIS 2019, 44, 81–128. [Google Scholar] [CrossRef]
  70. Füller, J.; Hutter, K.; Faullant, R. Why Co-Creation Experience Matters? Creative Experience and Its Impact on the Quantity and Quality of Creative Contributions: Why Co-Creation Experience Matters? R&D Manag. 2011, 41, 259–273. [Google Scholar] [CrossRef]
  71. Anshari, M.; Almunawar, M.N.; Lim, S.A.; Al-Mudimigh, A. Customer Relationship Management and Big Data Enabled: Personalization & Customization of Services. Appl. Comput. Inform. 2019, 15, 94–101. [Google Scholar] [CrossRef]
  72. Dean, J. Pricing Policies for New Products. Harv. Bus. Rev. 1950, 28, 45–53. [Google Scholar]
  73. Cao, H.; Folan, P. Product Life Cycle: The Evolution of a Paradigm and Literature Review from 1950–2009. Prod. Plan. Control 2012, 23, 641–662. [Google Scholar] [CrossRef]
  74. Porter, M.E. The Competitive Advantage: Creating and Sustaining Superior Performance; Free Press: New York City, NY, USA, 1998. [Google Scholar]
  75. Roucoules, L.; Anwer, N. Coevolution of Digitalisation, Organisations and Product Development Cycle. CIRP Ann. 2021, 70, 519–542. [Google Scholar] [CrossRef]
  76. Ralph, B.J.; Woschank, M.; Miklautsch, P.; Kaiblinger, A.; Pacher, C.; Sorger, M.; Zsifkovits, H.; Stockinger, M. MUL 4.0: Systematic Digitalization of a Value Chain from Raw Material to Recycling. Procedia Manuf. 2021, 55, 335–342. [Google Scholar] [CrossRef]
  77. Acharyulu, S.G.; Subbaiah, K.V.; Rao, K.N. Value Chain Model for Steel Manufacturing Sector: A Case Study. IJMVSC 2015, 6, 45–53. [Google Scholar] [CrossRef]
  78. Jiao, J.; Ma, Q.; Tseng, M.M. Towards High Value-Added Products and Services: Mass Customization and Beyond. Technovation 2003, 23, 809–821. [Google Scholar] [CrossRef]
  79. Murdiana, R.; Hajaoui, Z. E-Commerce Marketing Strategies in Industry 4.0. Int. J. Bus. Ecosyst. Strat. 2020, 2, 32–43. [Google Scholar] [CrossRef] [Green Version]
  80. Blecker, T.; Friedrich, G. Mass Customization Information Systems in Business; Information Science Reference: New York, NY, USA, 2007. [Google Scholar]
  81. Jiang, P. Segment-based Mass Customization: An Exploration of a New Conceptual Marketing Framework. Internet Res. 2000, 10, 215–226. [Google Scholar] [CrossRef]
  82. Zine, P.U.; Kulkarni, M.S.; Chawla, R.; Ray, A.K. A Framework for Value Co-Creation through Customization and Personalization in the Context of Machine Tool PSS. Procedia CIRP 2014, 16, 32–37. [Google Scholar] [CrossRef] [Green Version]
  83. Frank, A.G.; Mendes, G.H.S.; Ayala, N.F.; Ghezzi, A. Servitization and Industry 4.0 Convergence in the Digital Transformation of Product Firms: A Business Model Innovation Perspective. Technol. Forecast. Soc. Chang. 2019, 141, 341–351. [Google Scholar] [CrossRef]
  84. Chen, Z.; Zhang, Y.; Wu, C.; Ran, B. Understanding Individualization Driving States via Latent Dirichlet Allocation Model. IEEE Intell. Transp. Syst. Mag. 2019, 11, 41–53. [Google Scholar] [CrossRef]
  85. Pine, J.B. Mass Customization: The New Frontier in Business Competition; Harvard Business School Press: New York, NY, USA, 1993. [Google Scholar]
  86. Berry, L.L. Relationship Marketing of Services-Growing Interest, Emerging Perspectives. J. Acad. Mark. Sci. 1995, 23, 236–245. [Google Scholar] [CrossRef]
  87. Egaña, F.; Pezoa-Fuentes, C.; Roco, L. The Use of Digital Social Networks and Engagement in Chilean Wine Industry. JTAER 2021, 16, 1248–1265. [Google Scholar] [CrossRef]
  88. Benade, M. Essays on Smart Customization: Towards a Better Understanding of the Customer’s Perspective on Smart Customization Offers; RWTH University: Aachen, Germany, 2018. [Google Scholar]
  89. Piller, F.; Ihl, C.; Steiner, F. Embedded Toolkits for User Co-Design: A Technology Acceptance Study of Product Adaptability in the Usage Stage. In Proceedings of the 2010 43rd Hawaii International Conference on System Sciences, Honolulu, HI, USA, 5–8 January 2010; IEEE: Piscataway, NJ, USA, 2010; pp. 1–10. [Google Scholar]
  90. Kim, J.W.; Sul, S.H.; Choi, J.B. Development of User Customized Smart Keyboard Using Smart Product Design-Finite Element Analysis Process in the Internet of Things. ISA Trans. 2018, 81, 231–243. [Google Scholar] [CrossRef] [PubMed]
  91. Lehmhus, D.; Aumund-Kopp, C.; Petzoldt, F.; Godlinski, D.; Haberkorn, A.; Zöllmer, V.; Busse, M. Customized Smartness: A Survey on Links between Additive Manufacturing and Sensor Integration. Procedia Technol. 2016, 26, 284–301. [Google Scholar] [CrossRef]
  92. CITO Research. How the IoT Is Shaping the Future of Customer Experience and Product Development. Available online: https://theinternetofthings.report/whitepapers/how-the-iot-is-shaping-the-future-of-customer-experience-and-product-development (accessed on 2 January 2021).
  93. Wang, Y.; Zio, E.; Wei, X.; Zhang, D.; Wu, B. A Resilience Perspective on Water Transport Systems: The Case of Eastern Star. Int. J. Disaster Risk Reduct. 2019, 33, 343–354. [Google Scholar] [CrossRef]
  94. Prabhu, K. 7 Best Product Customization Examples. Available online: https://productimize.com/blog/best-product-customization-examples/ (accessed on 20 January 2022).
  95. Gilmore, H.J.; Pine, B.J., II. The Four Faces of Mass Customization. Harv. Bus. Rev. 1997, 75, 91–101. [Google Scholar]
  96. Lima, G. Harnessing the Potential of Industry 4.0 Tech to Improve e-Commerce|UNIDO. Available online: https://www.unido.org/news/harnessing-potential-industry-40-tech-improve-e-commerce (accessed on 21 January 2022).
  97. PSFK. One-Man Manufacturer Explains Why Personalization Is Key to Small Business. Available online: https://www.psfk.com/2015/06/independent-retail-sol-local-heroes-campaign-kennedy-city-bicycles.html?utm_source=PSFK+Newsletter&utm_campaign=7bb290e8ee-Retail%3A+%2A%7CRSSITEM%3ADATE%7C%2A&utm_medium=email&utm_term=0_16a14e1b11-7bb290e8ee-426430369 (accessed on 20 January 2022).
  98. Mandell, D.J.; McIlraith, S.A. A Bottom-Up Approach to Automating Web Service Discovery, Customization, and Semantic Translation. In Proceedings of the Twelfth International World Wide Web Conference Workshop on E-Services and the Semantic Web, Budapest, Hungary, 20–24 May 2003; p. 6. [Google Scholar]
  99. Dalenogare, L.S.; Benitez, G.B.; Ayala, N.F.; Frank, A.G. The Expected Contribution of Industry 4.0 Technologies for Industrial Performance. Int. J. Prod. Econ. 2018, 204, 383–394. [Google Scholar] [CrossRef]
  100. van Veldhoven, Z.; Vanthienen, J. Digital Transformation as an Interaction-Driven Perspective between Business, Society, and Technology. Electron. Mark. 2021. [Google Scholar] [CrossRef]
  101. Nagy, J.; Oláh, J.; Erdei, E.; Máté, D.; Popp, J. The Role and Impact of Industry 4.0 and the Internet of Things on the Business Strategy of the Value Chain—The Case of Hungary. Sustainability 2018, 10, 3491. [Google Scholar] [CrossRef] [Green Version]
  102. Pfohl, H.-C.; Yahsi, B.; Kurnaz, T. Concept and Diffusion-Factors of Industry 4.0 in the Supply Chain. In Dynamics in Logistics; Freitag, M., Kotzab, H., Pannek, J., Eds.; Lecture Notes in Logistics; Springer International Publishing: Cham, Switzerland, 2017; pp. 381–390. ISBN 978-3-319-45116-9. [Google Scholar]
  103. Wang, W.Y.C.; Heng, M.S.H.; Chau, P.Y.K. Supply Chain Management: Issues in the New Era of Collaboration and Competition; IGP Global: Hershey, PA, USA, 2007. [Google Scholar] [CrossRef]
  104. Zhang, J.; Gao, L.; Qin, W.; Lyu, Y.; Li, X. Big-Data-Driven Operational Analysis and Decision-Making Methodology in Intelligent Workshop. Comput. Integr. Manuf. Syst. 2016, 22, 1221–1229. [Google Scholar] [CrossRef]
  105. Angelov, P. Autonomous Learning Systems: From Data Streams to Knowledge in Real-Time; Wiley: New York, NY, USA, 2012. [Google Scholar]
  106. Ruiz-Alba, J.L.; Guesalaga, R.; Ayestarán, R.; Morales Mediano, J. Interfunctional Coordination: The Role of Digitalization. JBIM 2019, 35, 404–419. [Google Scholar] [CrossRef]
  107. Boute, R.N.; van Mieghem, J.A. Digital Operations: Framework and Future Directions. Manag. Bus. Rev. 2019, 1, 177–186. [Google Scholar] [CrossRef]
  108. Ng, I.C.L.; Wakenshaw, S.Y.L. The Internet-of-Things: Review and Research Directions. Int. J. Res. Mark. 2017, 34, 3–21. [Google Scholar] [CrossRef] [Green Version]
  109. Bharadwaj, A.; el Sawy, O.A.; Pavlou, P.A.; Venkatraman, N. Digital Business Strategy: Toward a Next Generation of Insights. MIS Q. 2013, 37, 471–482. [Google Scholar] [CrossRef]
  110. Erol, S.; Jäger, A.; Hold, P.; Ott, K.; Sihn, W. Tangible Industry 4.0: A Scenario-Based Approach to Learning for the Future of Production. Procedia CIRP 2016, 54, 13–18. [Google Scholar] [CrossRef]
  111. Kozlenkova, I.V.; Samaha, S.A.; Palmatier, R.W. Resource-Based Theory in Marketing. J. Acad. Mark. Sci. 2014, 42, 1–21. [Google Scholar] [CrossRef]
  112. Burger, M.; Arlinghaus, J. Digital supplier integration—Transaction 4.0 in buyer-supplier relationships. In Supply Management Research; Bode, C., Bogaschewsky, R., Eßig, M., Lasch, R., Stölzle, W., Eds.; Advanced Studies in Supply Management; Springer Fachmedien Wiesbaden: Wiesbaden, Germany, 2021; pp. 211–232. [Google Scholar]
  113. Birch-Jensen, A.; Gremyr, I.; Halldórsson, Á. Digitally Connected Services: Improvements through Customer-Initiated Feedback. Eur. Manag. J. 2020, 38, 814–825. [Google Scholar] [CrossRef]
  114. Granados, N.; Gupta, A. Transparency Strategy: Competing with Information in a Digital World. MIS Q. 2013, 37, 637–641. [Google Scholar] [CrossRef]
  115. Hansen, L.D.; Shneiderman, B.; Smith, A.M.; Himelboim, I. Analyzing Social Media Networks with NodeXL. Insights from a Connected World; Elsevier: Burlington, MA, USA, 2020. [Google Scholar]
  116. Pagani, M. Digital Business Strategy and Value Creation: Framing the Dynamic Cycle of Control Points. MIS Q. 2013, 37, 617–632. [Google Scholar] [CrossRef]
  117. Chan, F.T.S.; Bhagwat, R.; Wadhwa, S. Study on Suppliers’ Flexibility in Supply Chains: Is Real-Time Control Necessary? Int. J. Prod. Res. 2009, 47, 965–987. [Google Scholar] [CrossRef]
  118. Berger, R. Die Digitale Transformation der Industrie; Bundesverband der Deutschen Industrie e.V. (BDI): Berlin, Germany, 2015. [Google Scholar]
  119. Ward, P.; Zhou, H. Impact of Information Technology Integration and Lean/Just-In-Time Practices on Lead-Time Performance. Decis. Sci. 2006, 37, 177–203. [Google Scholar] [CrossRef]
  120. Frank, A.G.; Dalenogare, L.S.; Ayala, N.F. Industry 4.0 Technologies: Implementation Patterns in Manufacturing Companies. Int. J. Prod. Econ. 2019, 210, 15–26. [Google Scholar] [CrossRef]
  121. Park, S.R.; Pandey, S.; Rhee, S. Co-Creation of Customers’ Extrinsic Value through C2C and e-Store Interaction in an e-Commerce Setting. IJSSCI 2015, 5, 255. [Google Scholar] [CrossRef]
  122. Stank, T.P.; Keller, S.B.; Daugherty, P.J. Supply Chain Collaboration and Logistical Service Performance. J. Bus. Logist. 2001, 22, 29–48. [Google Scholar] [CrossRef]
  123. Pagell, M. Understanding the Factors That Enable and Inhibit the Integration of Operations, Purchasing and Logistics. J. Oper. Manag. 2004, 22, 459–487. [Google Scholar] [CrossRef]
  124. Viale, L. Intra-Functional Coordination: The Case of Purchasing during Innovation in the Agri-Food Sector. Supply Chain Forum Int. J. 2019, 20, 104–115. [Google Scholar] [CrossRef]
  125. Henard, D.H.; Szymanski, D.M. Why Some New Products Are More Successful than Others. J. Mark. Res. 2001, 38, 362–375. [Google Scholar] [CrossRef]
  126. Tatikonda, M.V.; Montoya-Weiss, M.M. Integrating Operations and Marketing Perspectives of Product Innovation: The Influence of Organizational Process Factors and Capabilities on Development Performance. Manag. Sci. 2001, 47, 151–172. [Google Scholar] [CrossRef]
  127. Baker, W.E.; Sinkula, J.M. Market Orientation and the New Product Paradox. J. Prod. Innov. Manag. 2005, 22, 483–502. [Google Scholar] [CrossRef]
  128. Knott, P.; Thnarudee, C. Strategic Planning as Inter-Unit Coordination: An in Depth Case Study in Thailand. Asia Pac. J. Manag. 2020. [Google Scholar] [CrossRef]
  129. Czech Statistical Office. Podniky Pod Tuzemskou a Zahraniční Kontrolou v Členění Podle Převažující Ekonomické Činnosti [Enterprises under Domestic and Foreign Control Broken down by Predominant Economic Activity]. Available online: https://vdb.czso.cz/vdbvo2/faces/index.jsf?page=vystup-objekt-vyhledavani&vyhltext=ifats&bkvt=aWZhdHM.&katalog=all&pvo=IFATSD001 (accessed on 1 October 2021).
  130. Czech Statistical Office. High-Tech Sector. Available online: https://www.czso.cz/csu/czso/high_tech_sektor (accessed on 25 November 2019).
  131. Vrchota, J.; Pech, M. Readiness of Enterprises in Czech Republic to Implement Industry 4.0: Index of Industry 4.0. Appl. Sci. 2019, 9, 5405. [Google Scholar] [CrossRef] [Green Version]
  132. Yáñez, F. The 20 Key Technologies of Industry 4.0 and Smart Factories: The Road to the Digital Factory of the Future: The Road to the Digital Factory of the Future; Independently Published; 2017; Available online: https://www.amazon.com/Technologies-Industry-Factories-Digital-Factory/dp/1973402106 (accessed on 20 January 2022).
  133. Benitez, J.; Henseler, J.; Castillo, A.; Schuberth, F. How to Perform and Report an Impactful Analysis Using Partial Least Squares: Guidelines for Confirmatory and Explanatory IS Research. Inf. Manag. 2020, 57, 103168. [Google Scholar] [CrossRef]
  134. Fornell, C.; Larcker, D.F. Evaluating Structural Equation Models with Unobservable Variables and Measurement Error. J. Mark. Res. 1981, 18, 39. [Google Scholar] [CrossRef]
  135. Voorhees, C.M.; Brady, M.K.; Calantone, R.; Ramirez, E. Discriminant Validity Testing in Marketing: An Analysis, Causes for Concern, and Proposed Remedies. J. Acad. Mark. Sci. 2016, 44, 119–134. [Google Scholar] [CrossRef]
  136. Hair, J.F.; Ringle, C.M.; Sarstedt, M. PLS-SEM: Indeed a Silver Bullet. J. Mark. Theory Pract. 2011, 19, 139–152. [Google Scholar] [CrossRef]
  137. Henseler, J.; Hubona, G.; Ray, P.A. Using PLS Path Modeling in New Technology Research: Updated Guidelines. Ind. Manag. Data Syst. 2016, 116, 2–20. [Google Scholar] [CrossRef]
  138. Rigdon, E.E. Rethinking Partial Least Squares Path Modeling: In Praise of Simple Methods. Long Range Plan. 2012, 45, 341–358. [Google Scholar] [CrossRef]
  139. Henseler, J. ADANCO 2.0.1 User Manual; Composite Modeling: Kleve, Germany, 2017. [Google Scholar]
  140. Vinzi, V.; Chin, W.; Helseler, J.; Wang, H. Handbook of Computational Statistics—PLS and Marketing; Springer: New York, NY, USA, 2008. [Google Scholar]
  141. Dijkstra, T.K.; Henseler, J. Consistent and Asymptotically Normal PLS Estimators for Linear Structural Equations. Comput. Stat. Data Anal. 2015, 81, 10–23. [Google Scholar] [CrossRef] [Green Version]
  142. Henseler, J.; Sarstedt, M. Goodness-of-Fit Indices for Partial Least Squares Path Modeling. Comput. Stat. 2013, 28, 565–580. [Google Scholar] [CrossRef] [Green Version]
  143. Cohen, J. Statistical Power Analysis for the Behavioral Sciences, 2nd ed.; L. Erlbaum Associates: Hillsdale, NJ, USA, 1988; ISBN 978-0-8058-0283-2. [Google Scholar]
  144. Henseler, J.; Dijkstra, T.K.; Sarstedt, M.; Ringle, C.M.; Diamantopoulos, A.; Straub, D.W.; Ketchen, D.J.; Hair, J.F.; Hult, G.T.M.; Calantone, R.J. Common Beliefs and Reality About PLS: Comments on Rönkkö and Evermann (2013). Organ. Res. Methods 2014, 17, 182–209. [Google Scholar] [CrossRef] [Green Version]
  145. Veile, J.W.; Kiel, D.; Müller, J.M.; Voigt, K.-I. Lessons Learned from Industry 4.0 Implementation in the German Manufacturing Industry. JMTM 2019, 31, 977–997. [Google Scholar] [CrossRef] [Green Version]
  146. Murphy, C. Walmart to End Contract with Company Providing Robots to Scan Shelves. Available online: https://www.usatoday.com/story/money/2020/11/03/walmart-robots-retailer-reportedly-ends-contract-robots-stores/6136684002/ (accessed on 21 January 2022).
  147. Wang, Y.; Li, D. Testing the Moderating Effects of Toolkits and User Communities in Personalization: The Case of Social Networking Service. Decis. Support Syst. 2013, 55, 31–42. [Google Scholar] [CrossRef]
  148. Jäger, J.; Schöllhammer, O.; Lickefett, M.; Bauernhansl, T. Advanced Complexity Management Strategic Recommendations of Handling the “Industrie 4.0” Complexity for Small and Medium Enterprises. Procedia CIRP 2016, 57, 116–121. [Google Scholar] [CrossRef]
  149. Marsh, H.W.; Hau, K.-T.; Balla, J.R.; Grayson, D. Is More Ever Too Much? The Number of Indicators per Factor in Confirmatory Factor Analysis. Multivar. Behav. Res. 1998, 33, 181–220. [Google Scholar] [CrossRef] [PubMed]
  150. Rossiter, J.R. The C-OAR-SE Procedure for Scale Development in Marketing. Int. J. Res. Mark. 2002, 19, 305–335. [Google Scholar] [CrossRef] [Green Version]
  151. Sackett, P.R.; Larson, J.R. Research Strategies and Tactics in I/O Psychology. In Handbook of Industrial and Organizational Psychology; Dunnette, D.M., Ackerman, L.P., Hough, M.L., Triandis, C.H., Eds.; Consulting Psychologist Press: Palo Alto, CA, USA, 1990; Volume 1, pp. 419–489. [Google Scholar]
  152. Reilly, T. A Necessary and Sufficient Condition for Identification of Confirmatory Factor Analysis Models of Factor Complexity One. Sociol. Methods Res. 1995, 23, 421–441. [Google Scholar] [CrossRef]
  153. Nachtigall, C.; Kroehne, U.; Funke, F.; Steyer, R. (Why) Should We Use SEM? Pros and Cons of Structural Equation Modeling. Methods Psychol. Res. Online 2003, 8, 1–22. [Google Scholar]
  154. Zhang, S. Sinopec Europa GmbH. Available online: https://www.unido.org/news/harnessing-potential-industry-40-tech-improve-e-commerce (accessed on 21 January 2022).
  155. Cozmiuc, D.; Petrisor, I. Industrie 4.0 by Siemens: Steps Made Next. J. Cases Inf. Technol. 2018, 20, 31–45. [Google Scholar] [CrossRef] [Green Version]
Figure 1. The conceptual research process model of the Industry 4.0 framework.
Processes 10 00539 g001
Figure 2. Results of the structural model. Note: significance is measured by one-tailed t test (* p-value < 0.05, *** p-value < 0.001).
Processes 10 00539 g002
Table 1. Measurement model evaluation of validity, reliability, weights, and loadings.
Construct/IndicatorρAαAVEVIFWeightsLoadings
External integration0.88220.88920.7892
→ EXI1 (customers) 2.65130.53000.8906
→ EXI2 (suppliers) 2.65130.52730.8861
Internal integration0.80910.80660.6774
→ ICO1 (department) 1.84100.56420.8498
→ ICO2 (processes) 1.84100.52810.7954
Internal value chain0.85690.83980.6497
→ PLC1 (development) 1.55910.32600.6864
→ PLC2 (planning) 2.88480.40340.8493
→ PLC3 (manufacturing) 2.66850.41310.8698
Digitalization0.85790.85070.5921
→ DIG1 (IS) 2.21810.33460.8556
→ DIG (connection) 2.33230.31020.7932
→ DIG3 (IoT) 1.80520.27780.7103
→ DIG4 (systems) 1.64410.27720.7090
Note: Dijkstra–Henseler’s rho (ρA), Cronbach’s alpha (α), average variance extracted (AVE), variance inflation factor (VIF).
Table 2. Results of the overall saturated model goodness of fit.
DiscrepancyValueHI95HI99Conclusion
SRMR0.02780.02860.0314Supported
dULS0.07010.07450.0895Supported
dG0.05780.06110.0700Supported
Note: standardized root mean squared residual (SRMR), the LS discrepancy (dULS), and the geodesic discrepancy (dG).
Table 3. Inter-construct correlations.
Construct123456
Digitalization1.0000
Technology readiness0.70551.0000
Internal value chain0.68590.61391.0000
Customization0.33430.20790.38851.0000
External integration0.47390.37030.41420.28191.0000
Internal integration0.65570.62180.73320.22290.67411.0000
Table 4. Results of the estimated model goodness of fit.
DiscrepancyValueHI95HI99Conclusion
SRMR0.03780.03420.0382Supported
dULS0.12970.10660.1325Supported
dG0.06900.06580.0751Supported
Note: standardized root mean squared residual (SRMR), the LS discrepancy (dULS), and the geodesic discrepancy (dG).
Table 5. The structural model effects overview.
Path DirectionDirect EffectIndirect EffectTotal EffectCohen’s f2
Technology readiness → Digitalization0.7055 *** 0.7055 ***0.9911
Technology readiness → Internal integration0.3169 ***0.3048 ***0.6218 ***0.0971
Technology readiness → External integration 0.4358 ***0.4358 ***
Technology readiness → Internal value chain0.11090.5030 ***0.6139 ***0.0147
Technology readiness → Customization 0.2650 ***0.2650 ***
Digitalization → Internal integration0.4321 *** 0.4321 ***0.1804
Digitalization → External integration0.05600.2754 ***0.3314 ***0.0033
Digitalization → Internal value chain0.3020 ***0.2014 ***0.5035 ***0.1014
Digitalization → Customization 0.2135 ***0.2135 ***
External integration → Customization0.1460 * 0.1460 *0.0212
Internal integration → External integration0.6373 *** 0.6373 ***0.4258
Internal integration → Internal value chain0.4662 *** 0.4662 ***0.2949
Internal integration → Customization 0.2460 ***0.2460 ***
Internal value chain → Customization0.3280 *** 0.3280 ***0.1072
Note: significance is measured by one-tailed t test (* p-value < 0.05, *** p-value < 0.001).
Table 6. The evaluation of hypotheses.
Direct EffectsPath Coef. (β)t-Valuep-Value
Technology readiness → Digitalization (H1)0.705521.96130.0000 ***
Technology readiness → Internal value chain (H2)0.11091.44160.0747
Technology readiness → Internal integration (H3)0.31694.28190.0000 ***
Digitalization → Internal integration (H4)0.43215.61260.0000 ***
Digitalization → Internal value chain (H5)0.30203.20750.0007 ***
Digitalization → External integration (H6)0.05600.65310.2568
Internal value chain → Customization (H7)0.32804.97570.0000 ***
External integration → Customization (H8)0.14602.18320.0145 *
Internal integration → External integration (H9)0.63737.34060.0000 ***
Internal integration → Internal value chain (H10)0.46625.04350.0000 ***
Note: significance is measured by one-tailed t test (* p-value < 0.05, *** p-value < 0.001); results for direct effect significance are presented based on the standard bootstrap results.
Publisher’s Note: MDPI stays neutral with regard to jurisdictional claims in published maps and institutional affiliations.

