Article

Study of the Two-Phase Flow and Wear of a Pump with Mixed-Size Particles

State-Province Joint Engineering Lab of Fluid Transmission System Technology, Department of Energy and Power Engineering, Zhejiang Sci-Tech University, Hangzhou 310018, China
*
Author to whom correspondence should be addressed.
Processes 2022, 10(3), 565; https://doi.org/10.3390/pr10030565
Submission received: 9 January 2022 / Revised: 8 March 2022 / Accepted: 8 March 2022 / Published: 14 March 2022
(This article belongs to the Section Energy Systems)

Abstract

:
This paper used a combination of numerical simulations and experiments to study the hydraulic performance and the wear law of a centrifugal pump when conveying mixed particle sizes. The numerical simulation was based on the Discrete Phase Model (DPM). The model was used to complete the mutual coupling between the solid particles and the flow field as well as the calculation of wall wear. The results show that under the same mass concentration, the head and the efficiency of the centrifugal pump were significantly improved with an increase in the small particle composition. Compared with transporting single-sized large particles, the wear law of the mixed particle size on the flow parts changed greatly. The addition of a certain number of small-sized particles to large-sized particles aggravated the wear of the impeller, but when the small particles occupied a relatively high proportion, the wear area of the impeller was reduced even smaller than that for the transportation of single-sized large particles.

1. Introduction

With the increasing demand for mineral resources from social industries, deep-sea mining technology has entered a period of rapid development. At present, hydraulic lifting mining systems are mostly used in deep-sea mining. In mineral lifting systems, centrifugal pumps are generally used as power equipment to provide lift for solid mineral particles [1]. Therefore, the solid-liquid two-phase flow problem in deep-sea mining centrifugal pumps is mostly caused by the existence of particles affecting the flow field in a centrifugal pump [2]. The performance changes and the collision of particles with the wall cause the reliability of the wall surface of the flow-passing part’s wear to decrease, so it is necessary to carry out research on the performance and wear of a centrifugal pump with solid–liquid mixed transportation [3,4]. Many scholars have carried out extensive research work on the solid–liquid two-phase flow inside a centrifugal pump. Song [5] studied the influence of particle diameter on a centrifugal pump. The research showed that particle diameter affected the particle trajectory and the erosion morphology of the particle in a impeller. Additionally, location had a significant impact. As the diameters of the particles increased, the speeds at which the particles moved to the pressure side of the blade’s inlet increased, forming point-like impact erosion. When the particles’ diameters decreased, sliding wear occurred gradually on the pressure side of the blade outlet. Kumar [6] studied the performance characteristics of a centrifugal slurry pump with a multi-sized particulate slurry of bottom ash and fly ash mixtures. The addition of fine–particle fly ash in the coarser particles of the bottom ash slurry, led to reducing the additional head losses in the pump. The pump performance in terms of head and efficiency improved with the addition of fly ash in the bottom ash slurry. Li [7] conducted abrasion experiments on 3 mm large-diameter particles in an elbow, revealed the mechanism of abrasion formation. Shen [8] used experimental and numerical methods to study the erosion wear of the impeller of the double-suction pump in the Jingtai Yellow River irrigation area. At the same sand content, when particle size increases to a certain extent, the wear damage tends to be slow. The erosion rate increases with the sand content, and at the same position on the blade surface, the erosion rate on the suction side is greater than that on the pressure side. Bartosik [9] assumed that the wall shear stress on a flow wall was equivalent to the sum of the shear stress of the fluid and particles on the wall and used the effect of two-phase flow with a large particle size and high concentration on the wall to verify the mathematical model proposed by the hypothesis. This proved that the shear stress of the particles in relation to the wall was much greater than the shear stress of the fluid in relation to the wall. Tarodiya [10] used the Euler-Lagrange method combined with an erosion model to model the three-dimensional unsteady constant value of a centrifugal slurry pump. It was found that the change of the working flow and particle size greatly affected the material removal rate, the high erosion area of the shell, and the surface of the impeller blade. Tang [11] used the CFD-DEM method to simulate the solid–liquid flow in a single-channel pump. The results showed that the smaller particles had a wider range of velocity distribution and peak velocity, while the larger particles exerted a larger contact force. In addition, the collision of pie-shaped particles was the most serious, and the collision of spherical particles was the least serious. Yang [12] used the DPM model to study the erosion and wear behavior of a rotating disk surface with the action of solid–liquid two-phase flow. The results showed that the amount of wear increased exponentially with the radius, and the maximum amount of wear increased faster than the average amount of wear as the particle volume fraction increased. The surface wear was inversely proportional to the particle diameter, but it increased slightly with the particle entrance velocity. Luo et al. [13] studied the wear properties of TC4 titanium alloy, 316 stainless steel, and 2205 duplex stainless steel under three environmental media of non-lubricating friction, pure water, and seawater through experiments so as to determine the materials and quality of a high-pressure pump for seawater desalination and related performance. Zhang et al. [14] experimentally investigated the wear properties of two different materials (ceramic and 30Cr2MoVA). By comparing the friction coefficients, wear amounts, surface morphologies, temperature changes and roughness of the two materials, it was found that the ceramic material has a lower friction coefficient and better wear resistance than the 30Cr2MoVA material. This provides a basis for further research on ultra-high pressure axial piston pumps. Peng et al. [15] used the bidirectionally coupled Euler–Lagrange method to solve the liquid–liquid–solid flow in an elbow. Combined with five different erosion models and two particle wall-impact rebound models, the wear performance of the elbow was studied and compared with the experimental results. Using a new erosion model, Xu et al. [16] investigated the erosion of elbows with high-particle solid fractions using a coupled CFD-DEM approach. The results showed that particle concentration has a great influence on the erosion wear at elbows.
Most of the studies [17,18,19,20,21,22,23,24] on two-phase flow in centrifugal pumps are related to solid concentration, relative density, and particle size. However, most of these studies focus on the flow-field and wear changes in centrifugal pumps with single particle sizes. In the actual hydraulic lifting process of solid particles, the particles are broken due to collisions and other reasons, resulting in a combination of particles of different sizes in the solid–liquid two-phase flow. At present, centrifugal pump-wear research has been mainly carried out for single particle-size conveying conditions. The collision and the rebound of particles of different particle sizes with the wall surface result in different trajectories. Therefore, the flow field in a centrifugal pump and the wear caused by each flow wall surface must be different. It is thus very necessary to study the two-phase transport performance and wear law of solid–liquid two-phase flow for a centrifugal pump for mixed particle transportation.
In this research, it was assumed that particle breakage had occurred. Large-diameter particles (3 mm) and small-diameter particles (0.3 mm) were mixed according to Table 1 to form a solid–liquid two-phase flow of double-diameter particles. For the original particles, before crushing, the small-sized particles were regarded as the particles after crushing, and the mixing ratio of particles with different sizes was used to simulate the different particle-crushing stages. Numerical calculations were performed using the DPM model in the software Fluent, taking into account the mutual coupling between solid particles and fluids. The combination of experiment and simulation method was used to study the changes of two-phase flow and wear in the centrifugal pump under the conditions of different particle-size components. The research results will be beneficial to improve the wear condition of solid–liquid transportation in practical engineering.

2. Centrifugal Pump Experimental Study

The two-phase mixture-transportation test bench is shown in Figure 1. A pressure gauge was set at a distance of 4d1 from the inlet of the centrifugal pump (d1 is the inlet pipe diameter) and a distance from the pump outlet of 2d2 (d2 is the outlet pipe diameter) to measure the pressure and monitor the head change of the centrifugal pump. Additionally, for the experiment, a SIN-PX400 pressure sensor with high measurement accuracy was chosen. The measurement of this sensor could be accurate from ±0.1%–±0.25%. According to the pressure change range in the test bench, the range of the inlet pressure sensor was −0.1–0.2 MPa, and the range of the outlet pressure sensor was 0–0.6 MPa. A torque meter was set between the drive motor and the centrifugal pump to measure the torque and the speed of the centrifugal pump shaft for calculation. A torque meter was set up between the driving motor and the centrifugal pump to measure the torque and speed of the centrifugal pump, so as to calculate the power and efficiency of the centrifugal pump. The speed range of the torque sensor selected in this experiment was 0–6000 r/min. In this experiment, the KROHNE electromagnetic flowmeter OPTIFLUX2300C was used to measure the flow of the flowing medium, which allowed the fluid to contain solid particles with a mass fraction of up to 12%. Because the solid-liquid two-phase wear experiment of the centrifugal pump lasted for a long time, the heat generated during the experiment increased the water temperature and affected the accuracy of the experiment. Therefore, the experimental system used in this research was an open experiment bench to improve the heat dissipation effect. The wear test time for each working condition was 48 h.
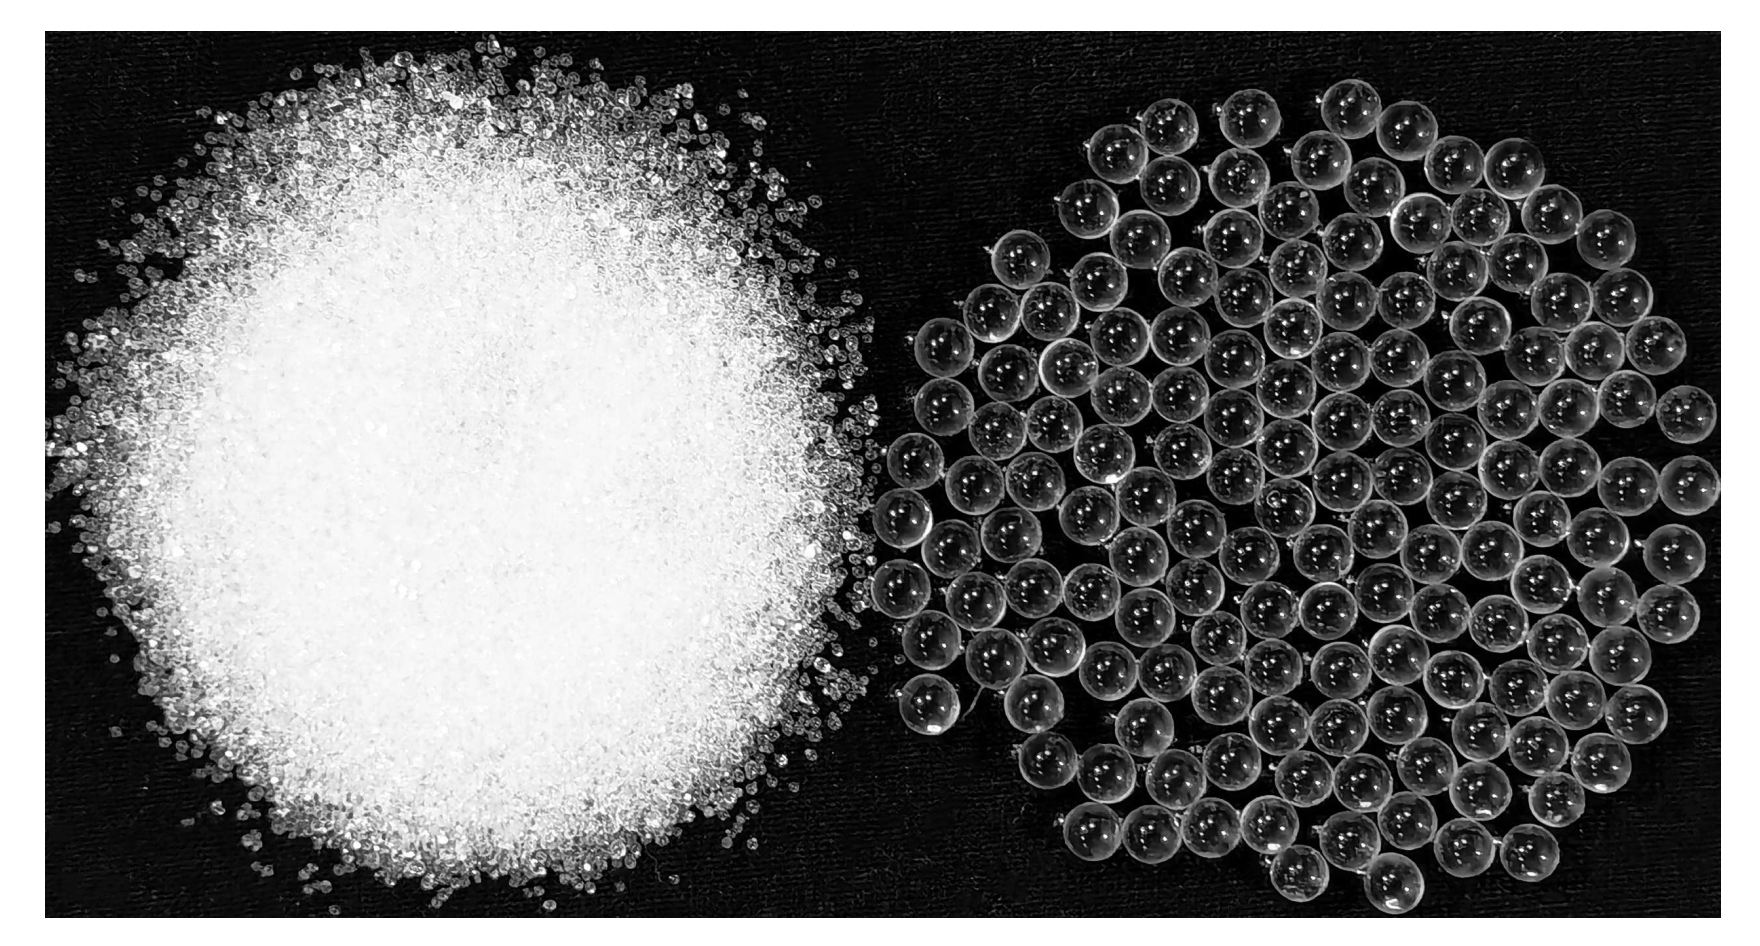
A centrifugal pump model HCK100-80-250 was used in this study and its rated flow rate was 70 m3/h, head was 14 m, and speed was 1450 r/min. The particles selected for the experiment are shown in Figure 2. The materials were glass, the density was 2700 kg/m3, the shape was round, the diameters were 3 mm and 0.3 mm, and the hardness was 6.5 Mohs. In order to simulate different particle-crushing conditions, the original single-particle size solid–liquid two-phase flow was replaced with a two-particle size solid–liquid two-phase flow that was mixed by using the initial large particles and broken small particles according to the ratio. These were regarded as the particles before being broken, and the particles with small diameters were regarded as the particles after being broken. According to Table 1, the particle compositions were divided into three working conditions. At the same time, by comprehensively considering the transportation efficiency and passability, a particle mass concentration of 7% was selected for the study.
The simulation in this study is set as 50 particle-package injection points on the inlet section. During the calculation, the total inlet flow rate is 70 m3/h (19.44 kg/s), and the particle mass concentration is 7%, so the particle mass flow rate at the inlet = 19.44 × 7% = 1.36 kg/s to ensure that the mass flow rate of the particle package at each injection point is the same, which is 0.027222 kg/s. The number of particle packages with different particle sizes is distributed according to the mass fraction ratio in the working condition.

3. Centrifugal Pump Computational Study

3.1. Simulation Settings

In this study, Fluent 16.0 was used to complete the numerical simulation of solid–liquid two-phase flow in a centrifugal pump. The calculation was based on the DPM model. Fluid was regarded as a continuous phase and particles were regarded as a discrete phase, and the two phases were coupled to each other [25]. The collision and rebound model proposed by Grant et al. [26,27] and the wear model proposed by Ahlert et al. [28] were added to solve the interaction between the particles and the wall in the process of calculation.
The continuity equation is also known as the mass conservation equation. The following equation is suitable for incompressible fluids.
· α f U f = 0
where ρ f is the fluid density (in this study, the fluid was assumed to be incompressible, so ρ f was constant) and U f is the fluid velocity.
The equation of motion describing the momentum conservation of a viscous incompressible fluid is the N–S equation (Navier–Stokes equation):
ρ f · d ( α f U f ) d t = p + α f μ e f f Δ U f + α f ρ f g + F s
where p is the pressure, μ e f f is the effective viscosity, g is the gravitational acceleration, F s is the interaction force between the fluid and the particle, and α f is the porosity, which can be calculated as follows:
α f = 1 j = 1 n V p , j / V c e l l
where V p , j is the particle volume, n is the number of particles in the cell, and V c e l l is the mesh cell volume.
In this numerical simulation, the effects of particle gravity, drag force, pressure gradient force and additional mass force are considered in the particle momentum equation, so the equation of discrete phase-particles in the flow field is:
m p d U p d t = m p g + F D + F P + F V
where m p , U p , and t are, respectively, the particle mass, translational velocity of particles and time. m p g is the gravitational force, F D is fluid drag on the particle, F D = C D ρ f g U f U p π d p 2 8 , d p is the particle diameter, C D is the fluid resistance coefficient, C D = 30 R e p 0.625 , R e p is the Reynolds number of discrete phase-particles, F P is pressure gradient force on the particle, F p = 1 6 π d p 3 d p d x , F V is the additional mass force, and F V = 1 12 π d p 3 ρ f d U f d t d U p d t .
When calculating the orbit of the particles, the gain and loss of the particles’ mass and momentum are tracked along the orbit. These physical quantities are then applied to the calculation of continuous phase. Fluent alternately solves the governing equations of the discrete phase and continuous phase until both converge.
In Fluent, when the particles pass through the control body of the model, the momentum value of the continuous transmission to the discrete phase is solved by calculating the momentum change of the particles. The mass value of the continuous transfer to the discrete phase can be calculated by calculating the mass change of particles.
The particle momentum change value is:
H = 18 β μ C D R e p 24 ρ p d p 2 U p U f + F o t h e r m p Δ t
where μ is the fluid viscosity, ρ p is the particle density, m p is the particle mass flow rate, t is the time step, and F o t h e r is the other interphase forces. This momentum exchange acts as a momentum “exchange” in the subsequent calculation of the momentum balance of the fluid phase.
The SST (Shear-Stress Transport) model under the k ω turbulence model was adopted as the turbulence model. Compared with the standard turbulence model, the SST model introduces a damped cross-diffusion derivative term in the specific dissipation rate equation, and modifies the definition of turbulent viscosity, which has a higher turbulent separation accuracy. Its equation can be expressed as:
t ( ρ k ) + x j ( ρ k u i ) = x j ( Γ k k x j ) + G ~ k Y k + S k
t ( ρ ω ) + x j ( ρ ω u j ) = x j ( Γ ω ω x j ) + G ω Y ω + D ω + S ω
where G ω represents the generation of ω ; G ~ k represents the turbulent kinetic energy due to the average velocity gradient; Γ k represents the effective diffusivity of k ; Γ ω represents the effective diffusivity of ω ; Y k and Y ω represent the resulting dissipations k and ω ; D ω represents the cross-diffusion term; and S k and S ω are user-defined terms.
The collision and rebound model proposed by Grant et al. [27] was selected. Its formula is as follows:
e n = 0.993 1.76 θ 1 + 1.56 θ 1 2 0.49 θ 1 3
e t = 0.988 1.66 θ 1 + 2.11 θ 1 2 0.67 θ 1 3
where θ 1 is the collision angle, in radians.
The wear model proposed by Ahlert et al. [28] was selected according to the material of the flow wall surface. Its expression is:
E R = A ( B H ) 0.59 C s U p n A f θ
f θ = a θ 2 + b θ θ θ 0 x cos 2 θ sin ( w θ ) + y sin 2 θ + z θ > θ 0
where A is the constant related to the wall material, BH is the Brinell hardness of the wall material, C s is the correlation coefficient for the particle shape (0.2 if the particle is spherical and 1 if the particle is sharp), U p is the particle collision velocity, and f θ is the particle collision angle function. The parameters selected in the equation according to the wall material are shown in Table 2.
In the simulation, the inlet boundary condition was the velocity inlet, which was set to 2.47 m/s, and this velocity was calculated using the inlet diameter of the pump and the rated flow rate. The outlet boundary condition was the outflow. In order to observe the fully developed internal flow, the corresponding turbulence parameters for the boundary conditions were set, which were the turbulence intensity (I = 0.033907305) and the hydraulic diameter (100 mm).
The particle injection method on the inlet surface was carried out in the form of file form, and 64 particle injection points were evenly arranged on the inlet surface. The incident velocity of particles is the same as that of fluid; both are 2.47 m/s. Mesh motion is used in an impeller zone, and its rotational speed is 1450 r/min, which is the same as the actual experimental speed. The boundary conditions in the simulation are set according to the actual experimental conditions. In the simulation, the time step was set to 0.00011494255 s, which was the time required for the impeller to rotate through 1°. The convergence criterion for the residual values at each time step was set to 10−4.

3.2. Geometry and Meshes

In order to find the appropriate number of computational meshes, eight sets of meshes with the numbers of nodes gradually increasing from 460,426 to 3,561,073 were drawn. These eight sets of meshes were simulated and analyzed separately, and the results are shown in Table 3. Considering the accuracy of the simulation and the calculation time, the mesh number of 2,427,310 was selected for the numerical simulation. The three-dimensional assembly model and mesh diagram of the centrifugal pump are shown in Figure 3.

3.3. Simulation Accuracy Verification

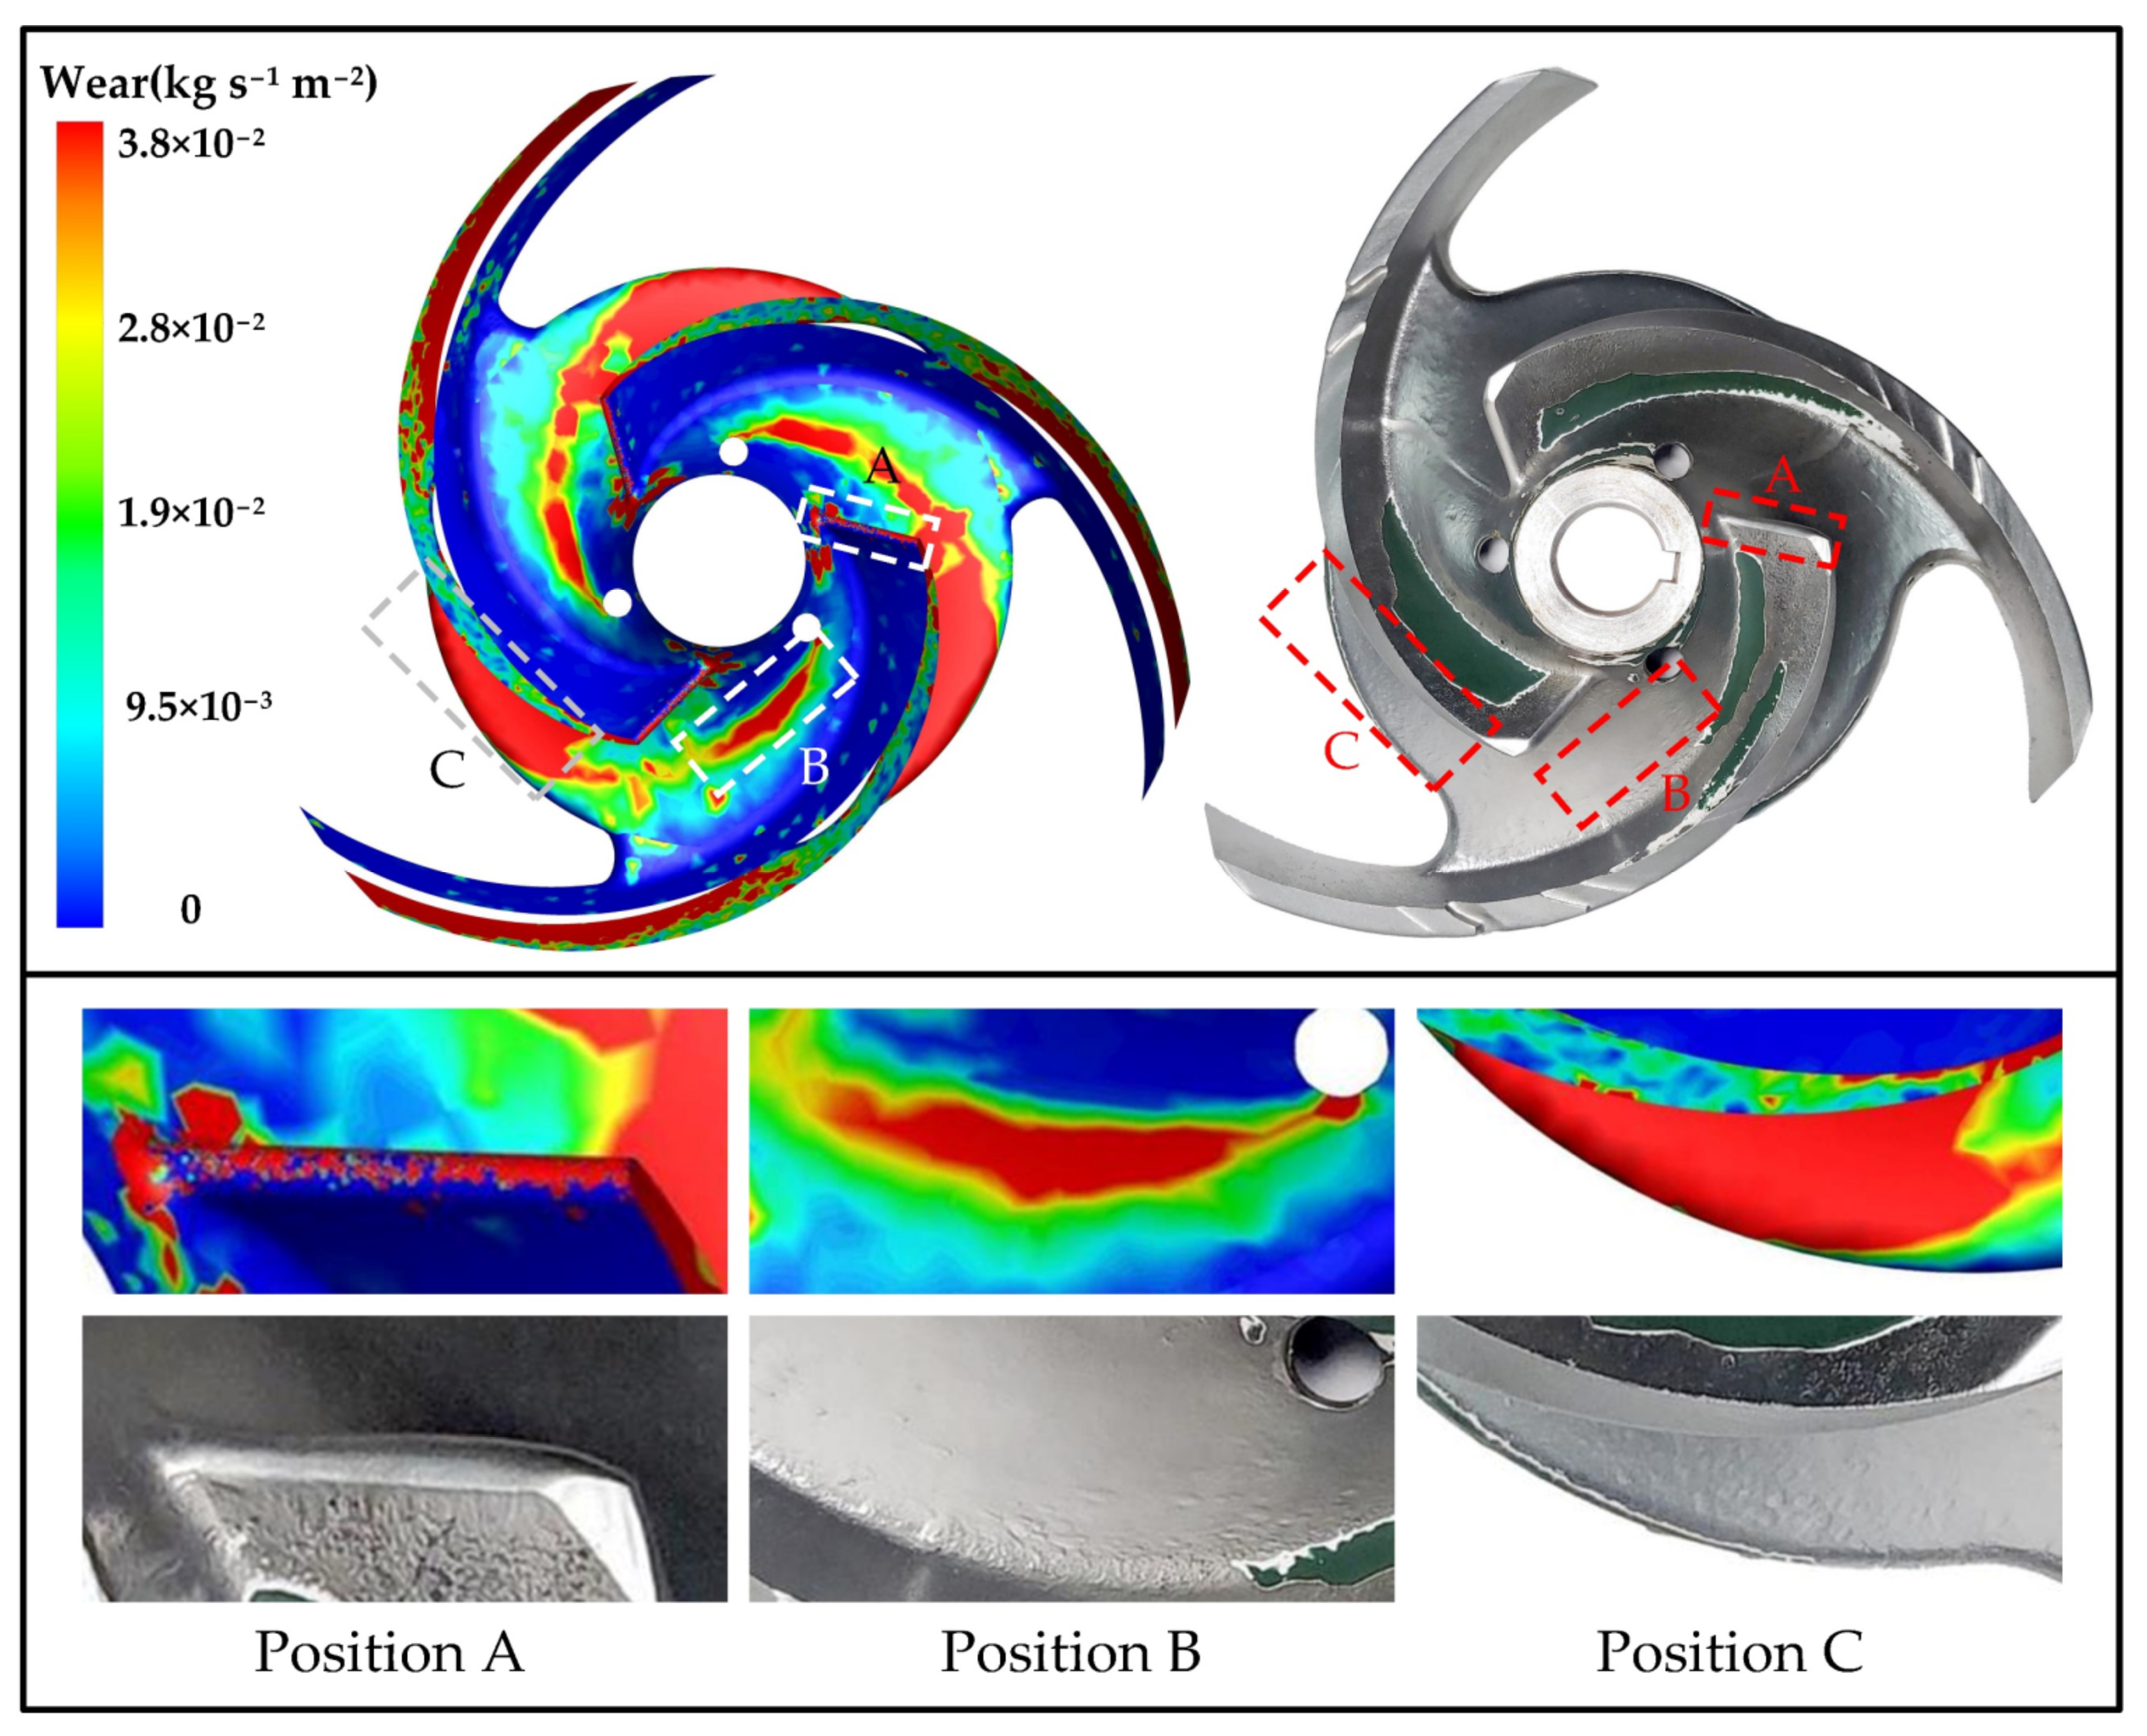
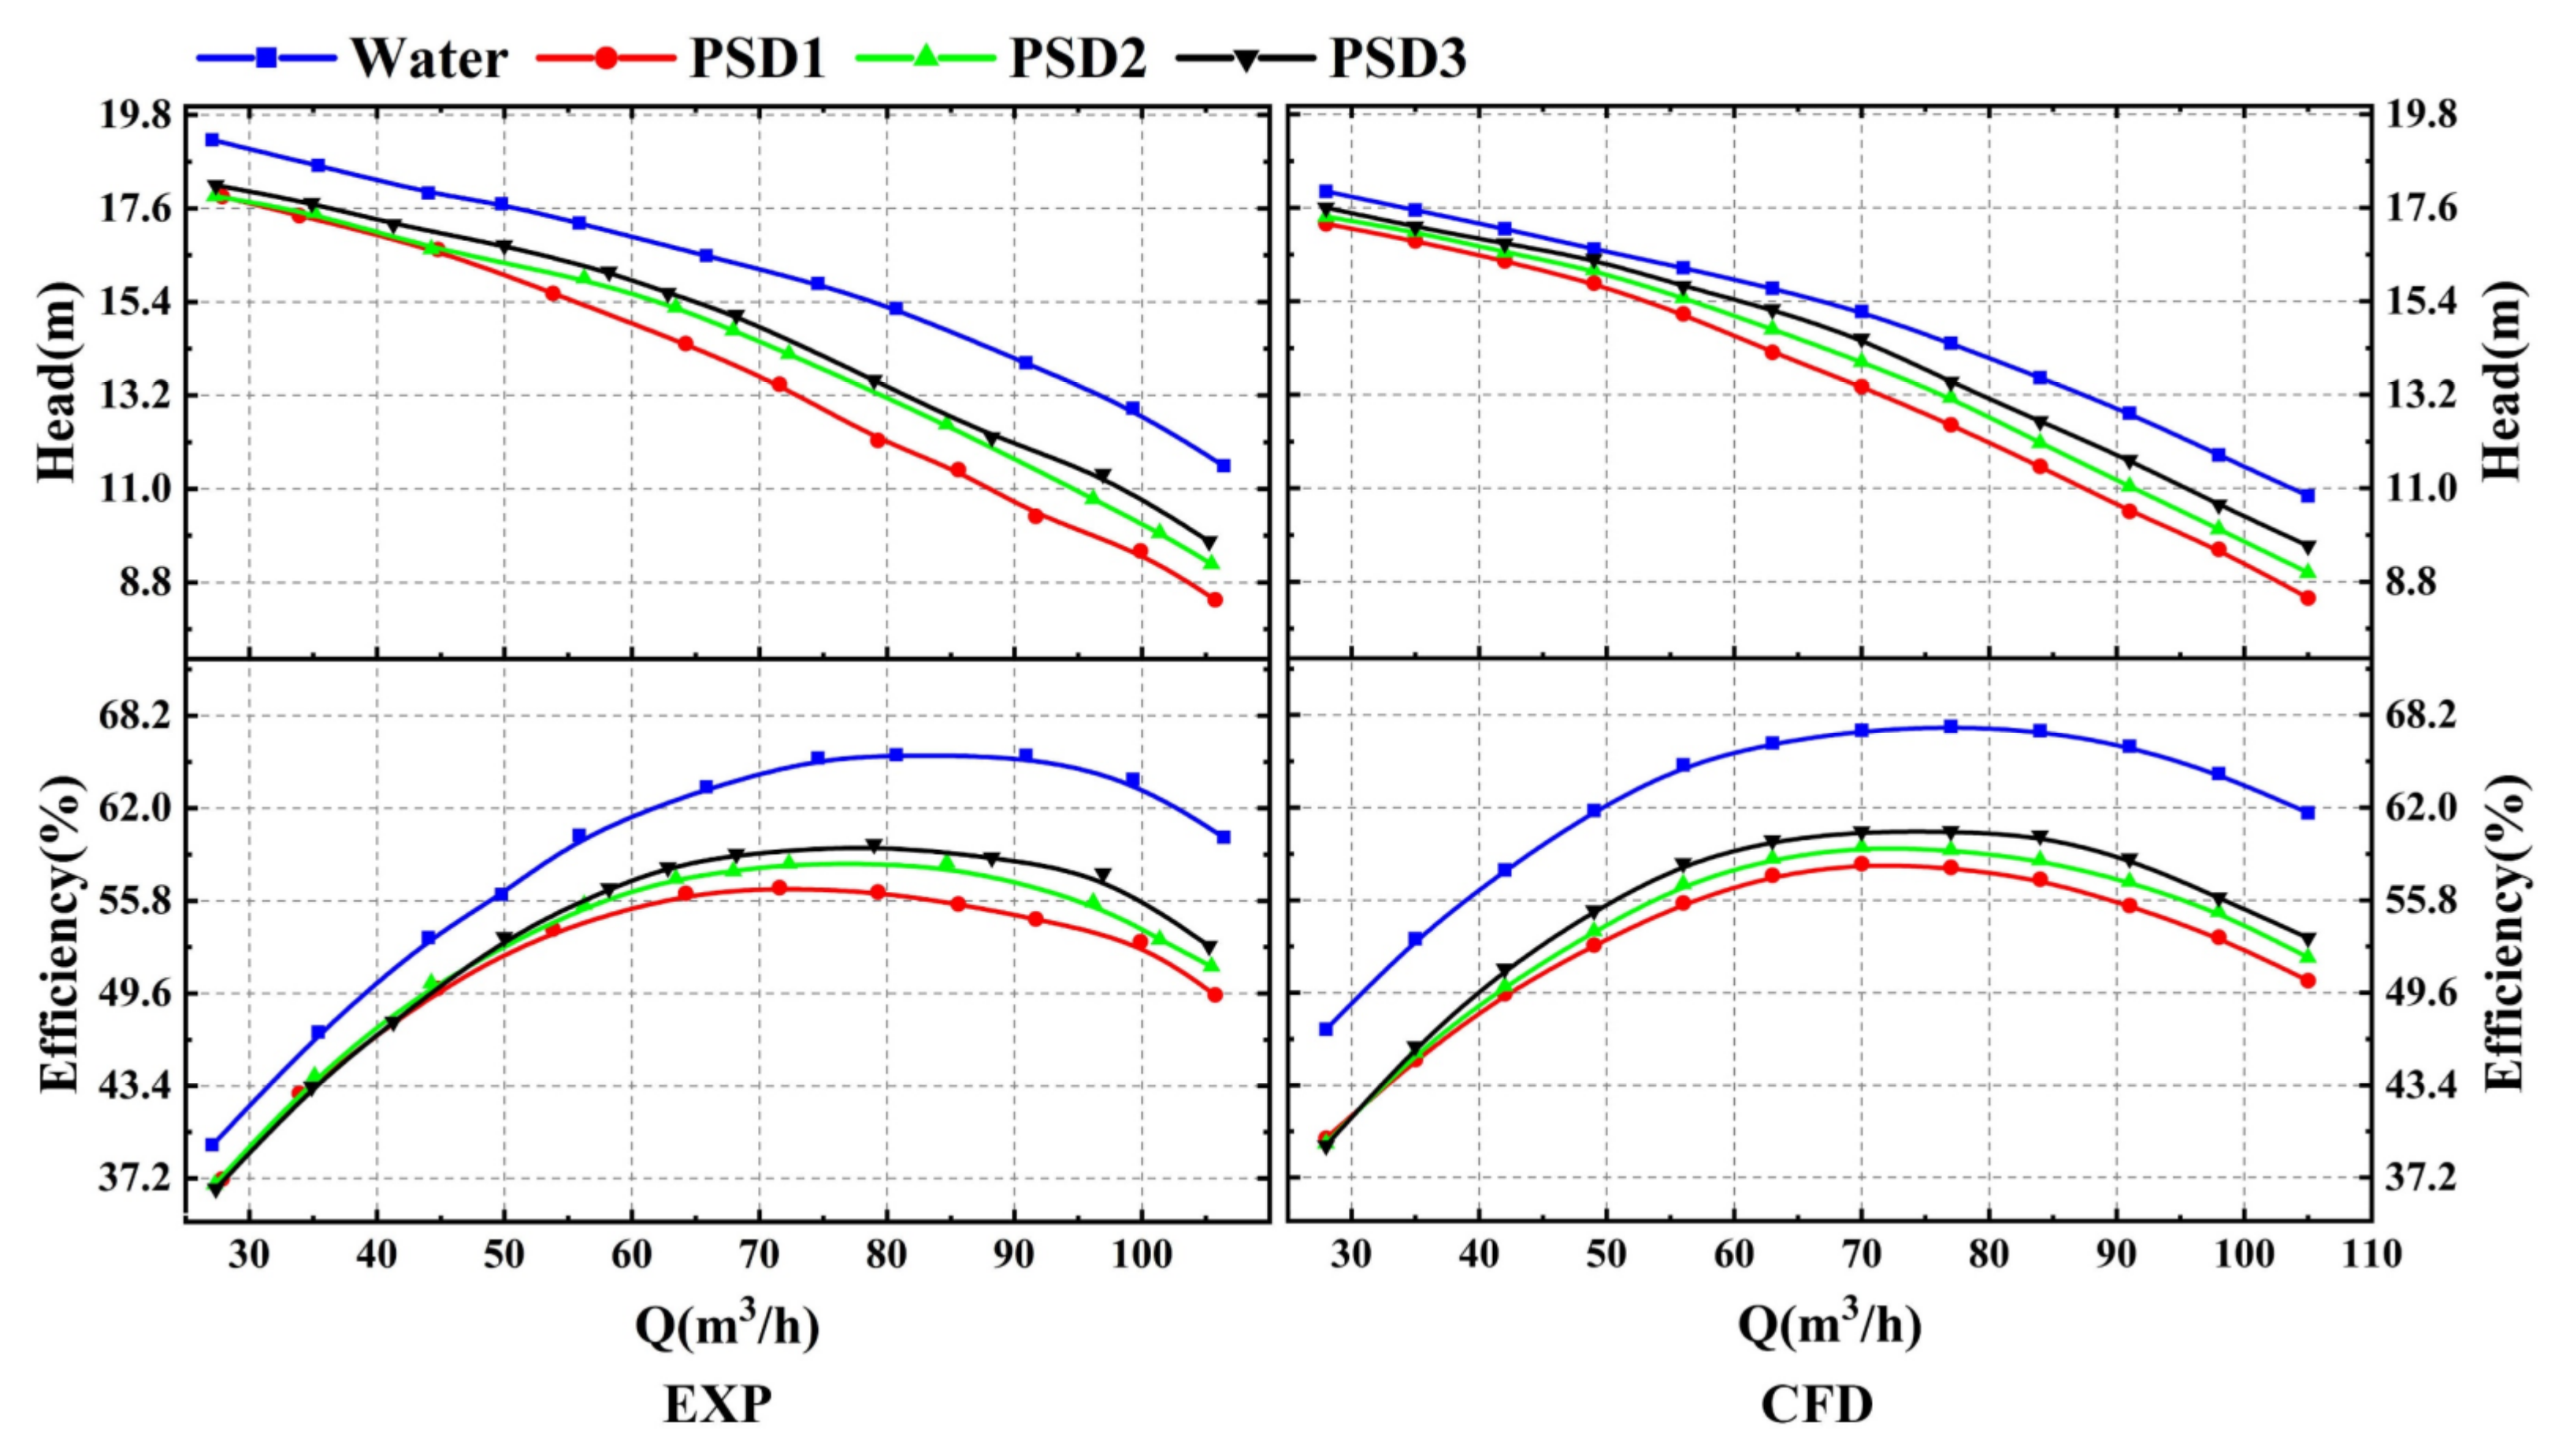
For verifying the validity of the numerical simulation method, the numerical simulation results were compared with the experimental results. Figure 4 shows the head and efficiency comparison between the numerical results for the ratio of large particles to small particles of 3:7 and the experimental data. Based on the comparison of the experimental value and the calculated value shown in the figure, the change trend of the two was basically the same, and the experimental value of the efficiency was generally smaller than the calculated value. This was because the power loss caused by the volume leakage and the mechanical friction was not considered in the numerical calculation. Additionally, due to the influence of the experimental uncertainty, the experimental curve jumped slightly, while the calculation curve was relatively smooth. The maximum error of the head at the rated flow rate was 3.01%, and the maximum error of the efficiency was 7.23%. This result was within a reasonable error range. Figure 5 shows the simulation and experimental results of PSD2 (particle size distribution) with a ratio of large particles to small particles of 7:3. From the simulation results in the figure, it can be seen that the severe wear areas of the impeller were mainly concentrated at the position of the blade head (position A), the hub wall at the center line of the two blades (position B), and the outer edge of the impeller hub wall near the pressure surface of the blade (position C), which were consistent with the results obtained from the wear experiment. The qualitative analysis showed that the simulation results were in good agreement with the experimental-impeller wear conditions. Based on the above results, the numerical simulation results could be considered reliable.

4. Results

4.1. Analysis of Different Particle Conditions

In order to study the effects of different particle size components on the performance of the centrifugal pump, a performance comparison experiment for the three component particles with the same mass concentration of 7% was designed, and the relevant numerical simulation calculation was carried out based on the experiment. The experimental and numerical simulation results are shown in Figure 6.
It can be seen from Figure 6 that at the rated operating point of Q = 70 m3/h, the heads of PSD1, PSD2, and PSD3 were reduced to 13.39 m, 13.98 m, and 14.52 m, respectively, compared with 15.16 m in the clean-water transportation condition, with values of 11.68%, 7.78%, and 4.22%, respectively. The change trend of the efficiency was basically the same as the head. Compared with the 67.16% in the clean-water transportation condition, the change trends dropped to 58.24%, 59.38%, and 60.39%, and the magnitudes of decline were 13.28%, 11.58%, and 10.08% for PSD1, PSD2, and PSD3, respectively. Obviously, it could be seen that the performance of the centrifugal pump was the best for PSD3, followed by PSD2, and the performance of PSD3 was relatively the lowest, but the hydraulic performance for the small flow conditions was not much different. That is, the performance of the two-phase flow centrifugal pump increased as the proportion of small particles in the particle composition increased, and the head and the efficiency gradually increased.
The external characteristics of a centrifugal pump are determined by its internal flow field. The interaction of the particles and fluid affects the structure of the internal flow field. In order to study the influence of different particle components on the performance of a centrifugal pump, it is necessary to study the changes in the internal flow. According to vortex identification method 1 proposed by Liu et al. [29,30,31], both strong and weak vortices can be captured at the same time, and this vortex identification method is not sensitive to small changes in the threshold used. The vorticity in the flow field can be divided into two parts: the rotating vorticity and the non-rotating vorticity, as seen in Equation (12):
× U f = R + ( × U f R )
where × U f represents the velocity gradient, R represents the rotating vorticity part, and × U f R represents the non-rotating vorticity part.
As shown in Equation (13) the value of Ω is [0, 1]. When Ω = 0 , it means that the flow field has non-rotational motion, and Ω = 1 indicates that the flow field has a purely rotational motion. Equation (13) is calculated as follows:
Ω = × U f · R 2 × U f 2 2 R 2 2
where Ω represents the ratio of the rotating vorticity to the total vorticity.
The vorticity in the flow field occupies the dominant position compared to the deformation; that is, when Ω > 0.5, it can be considered that there is a vortex structure at that time, and a reference value of 0.52 is given.
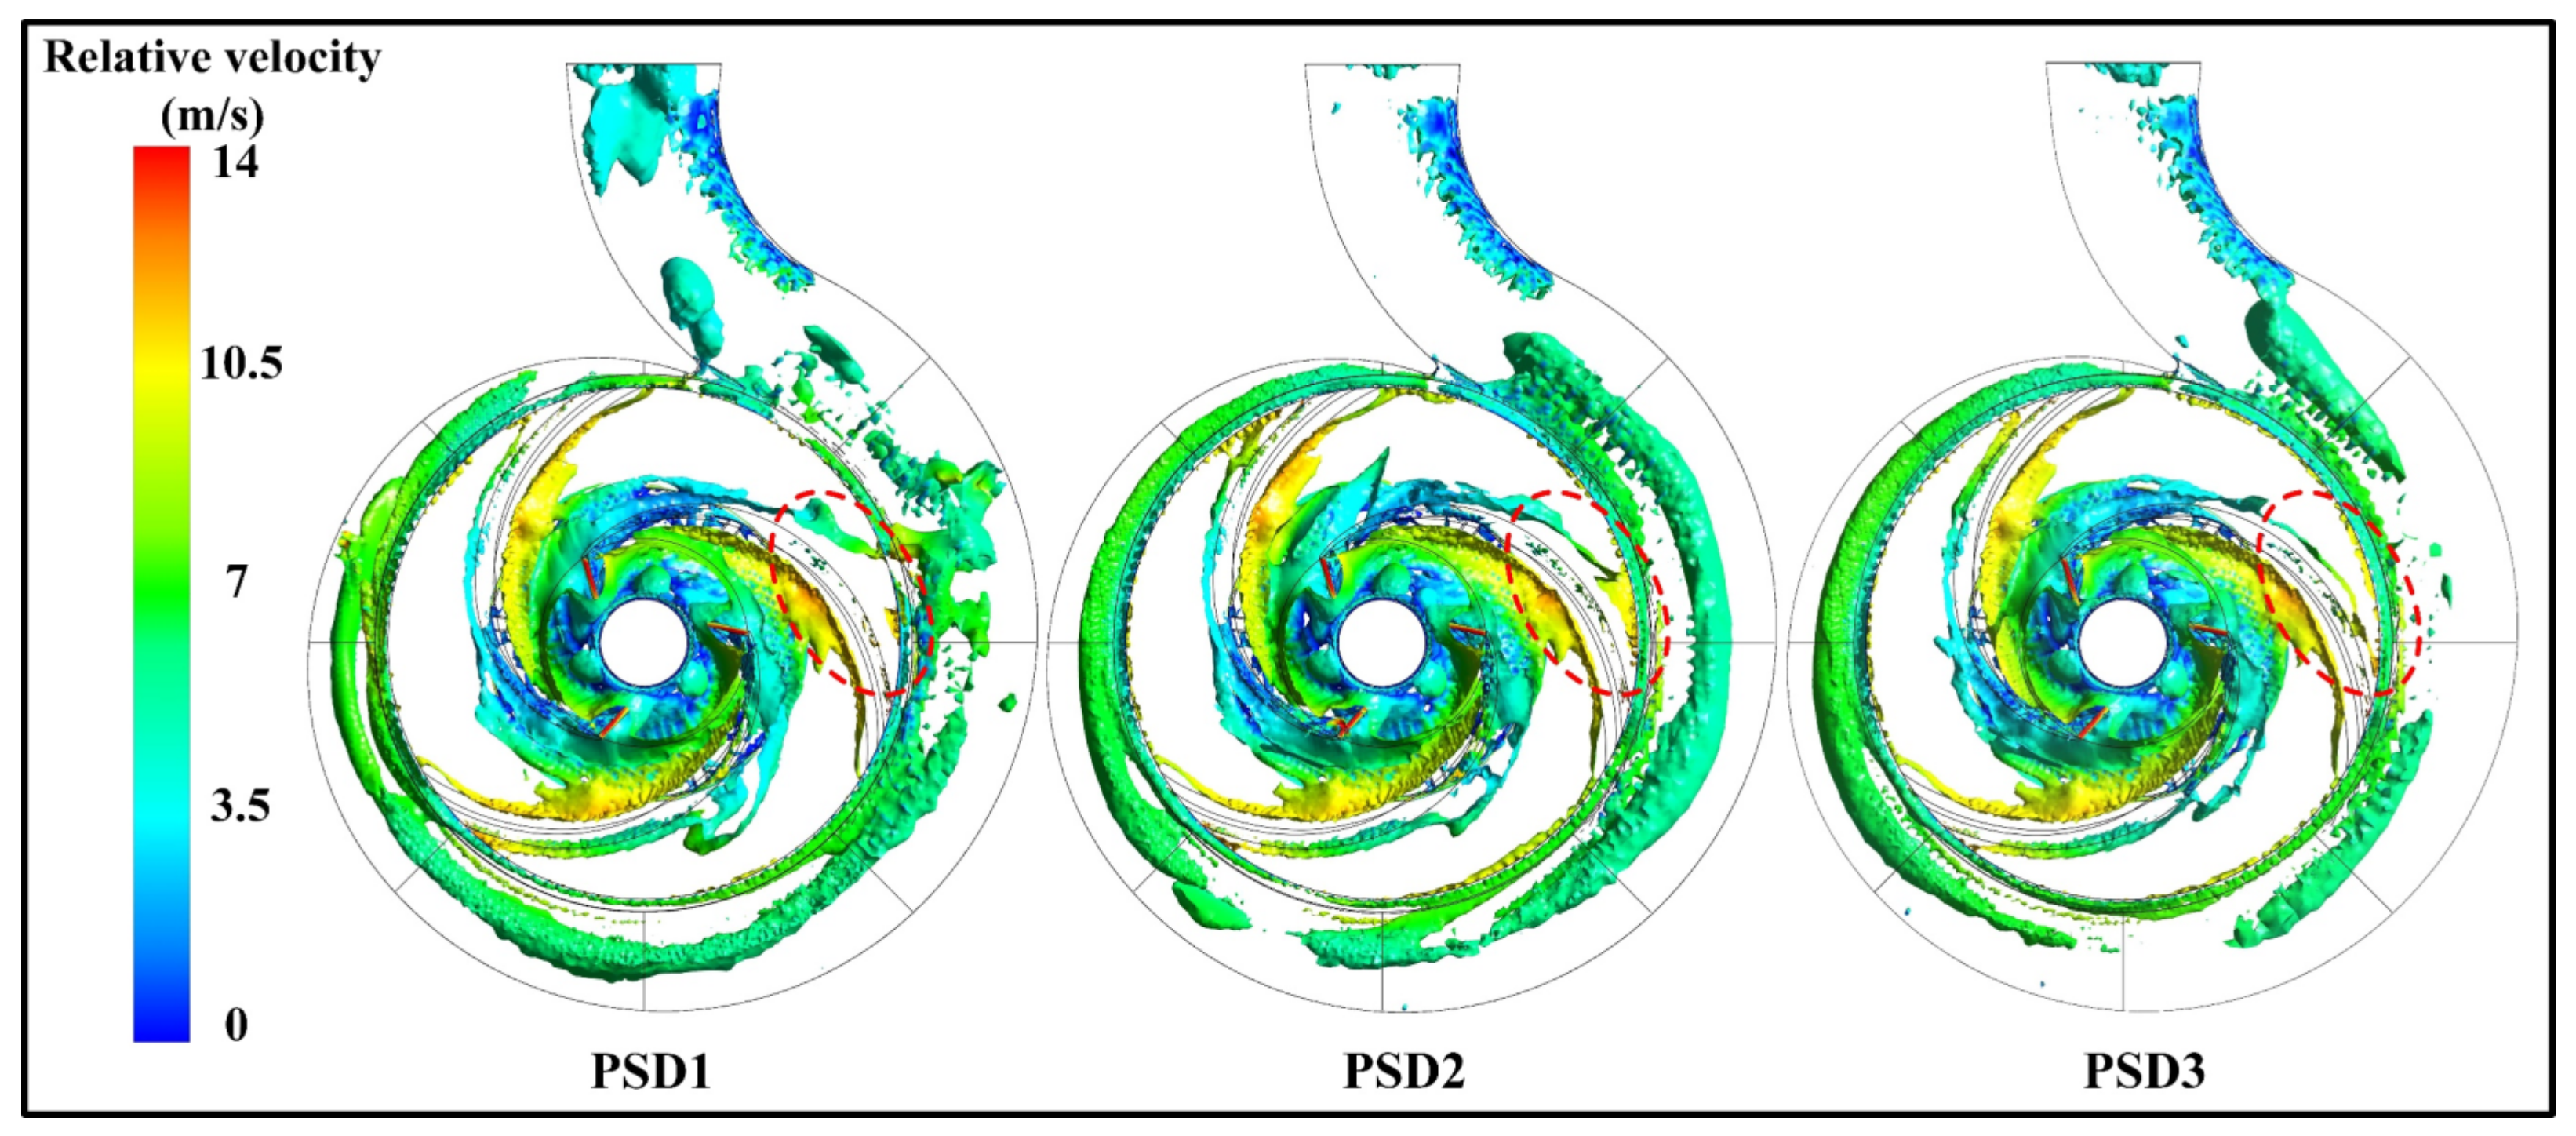
Figure 7 shows the vortex core diagram under the working conditions of three particle components when the rated flow rate is Q = 70 m3/h and Ω = 0.52. It can be seen from the figure that the vortices of the three working conditions were not very different at the entrance section of the impeller channel. With the disturbance of the leading edge of the blade, a large number of vortices were generated at the entrance of the impeller. As shown in the red circle at the end of the pressure surface of the blade in the picture, the vortex generated by the PSD1 working condition with all 3 mm particles had entered the volute channel, and the vortex core generated at this position in the PSD2 working condition was still near the trailing edge of the pressure surface. The PSD3 working condition had not yet produced the vortex core at that position. This was mainly because compared with the 0.3 mm particles, the 3 mm particles were less random in the flow field. With the influence of gravity and the inertia force, the particles accumulated at the trailing edge of the blade- pressure surface. Moreover, due to the coupling effect of the particles and the fluid, the flow field there was more chaotic. At that time, compared with the other working conditions, the vortex core was pushed into the volute flow channel in advance by the accumulated particles. At the same time, part of the volute was observed. With the increase in the small particles in the particle composition, the number of vortexes in the volute gradually decreased and the strength of the vortex gradually weakened. That is, when the particle-mass concentration was the same, the increase in the proportion of small particles in the particle component could suppress the generation of vortices in the flow field and stabilize the internal flow field, while a relatively stable flow field could improve the pump head and operating efficiency. This is similar to the turbulence-limiting hypothesis proposed by Zhang [32], who believes that due to the ability of silt particles to limit turbulence, the turbulent structure and turbulence intensity in muddy water are smaller than those in pure water, resulting in a small resistance loss.
It can be seen from Figure 8 that at the rated flow rate Q = 70 m3/h, the pressure distribution of the centrifugal pump was different when the centrifugal pump was transporting particles of different components. The pressure trend of the working condition for each component particle from the inlet to the outlet of the impeller increased. With the increase of the 0.3 mm small particles in the particle component, the trend of the pressure increase was more circumferential; that is, the pressure increase was more uniform, indicating that with the increase of the number of small particles in the particle component, the flow field in the impeller passage tended to be stable, which helped to reduce the efficiency loss of the centrifugal pump. At the same time, it can be observed that from PSD1 to PSD3, the pressure value at the outlet of the volute rose gradually, indicating that the change of the particle composition had a great influence on the pressure at the outlet, which was also one of the reasons why the pump head increased when the number of small and medium particles in the particle composition increased.
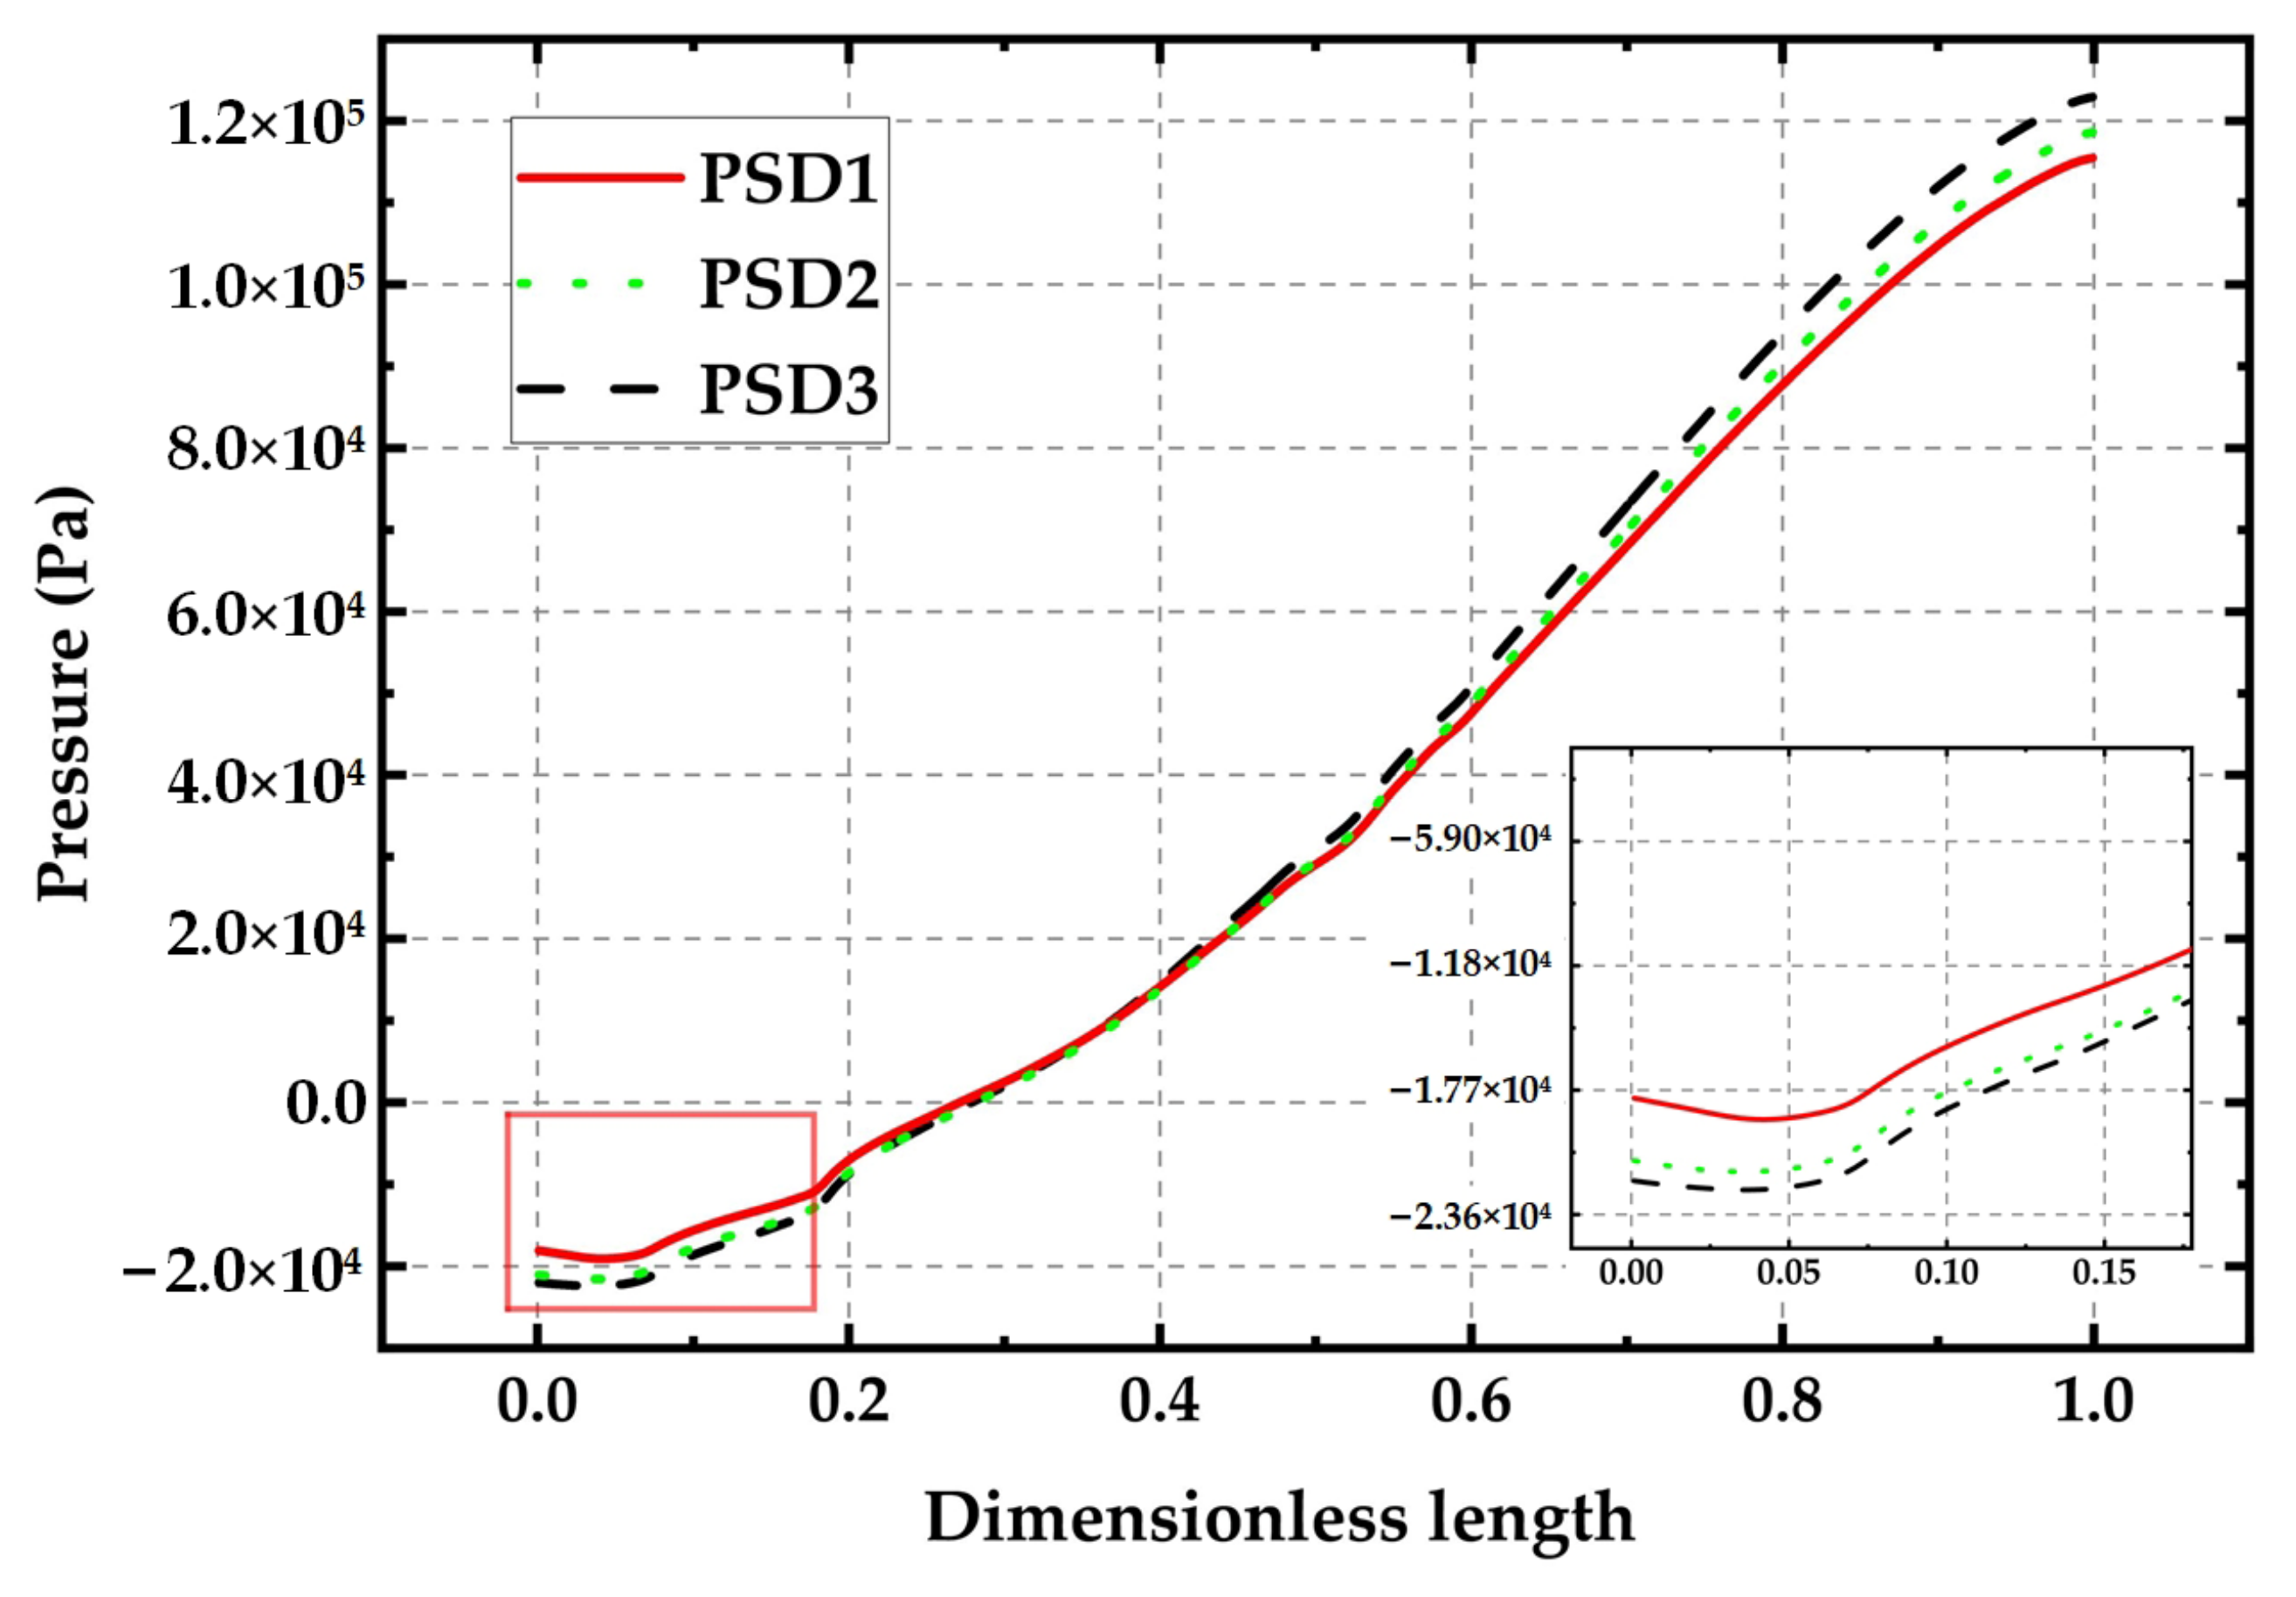
Figure 9 shows the average pressure from the impeller inlet channel to the outlet when the rated flow rate (Q) is 70 m3/h. It can be seen from the figure that there was a negative pressure at the impeller inlet, mainly because the presence of particles increased the friction loss and created an additional pressure drop at the inlet, which reduced the inlet pressure. A negative value increased the possibility of cavitation. With the increase of the small-particle component in the particle component, the negative pressure value at the impeller inlet became lower, indicating that the cavitation performance of the pump was reduced when the solid–liquid was mixed. At the outlet of the impeller, the pressure gradually increased with the increase of the small-particle component in the particle component.

4.2. Impeller Wear Analysis

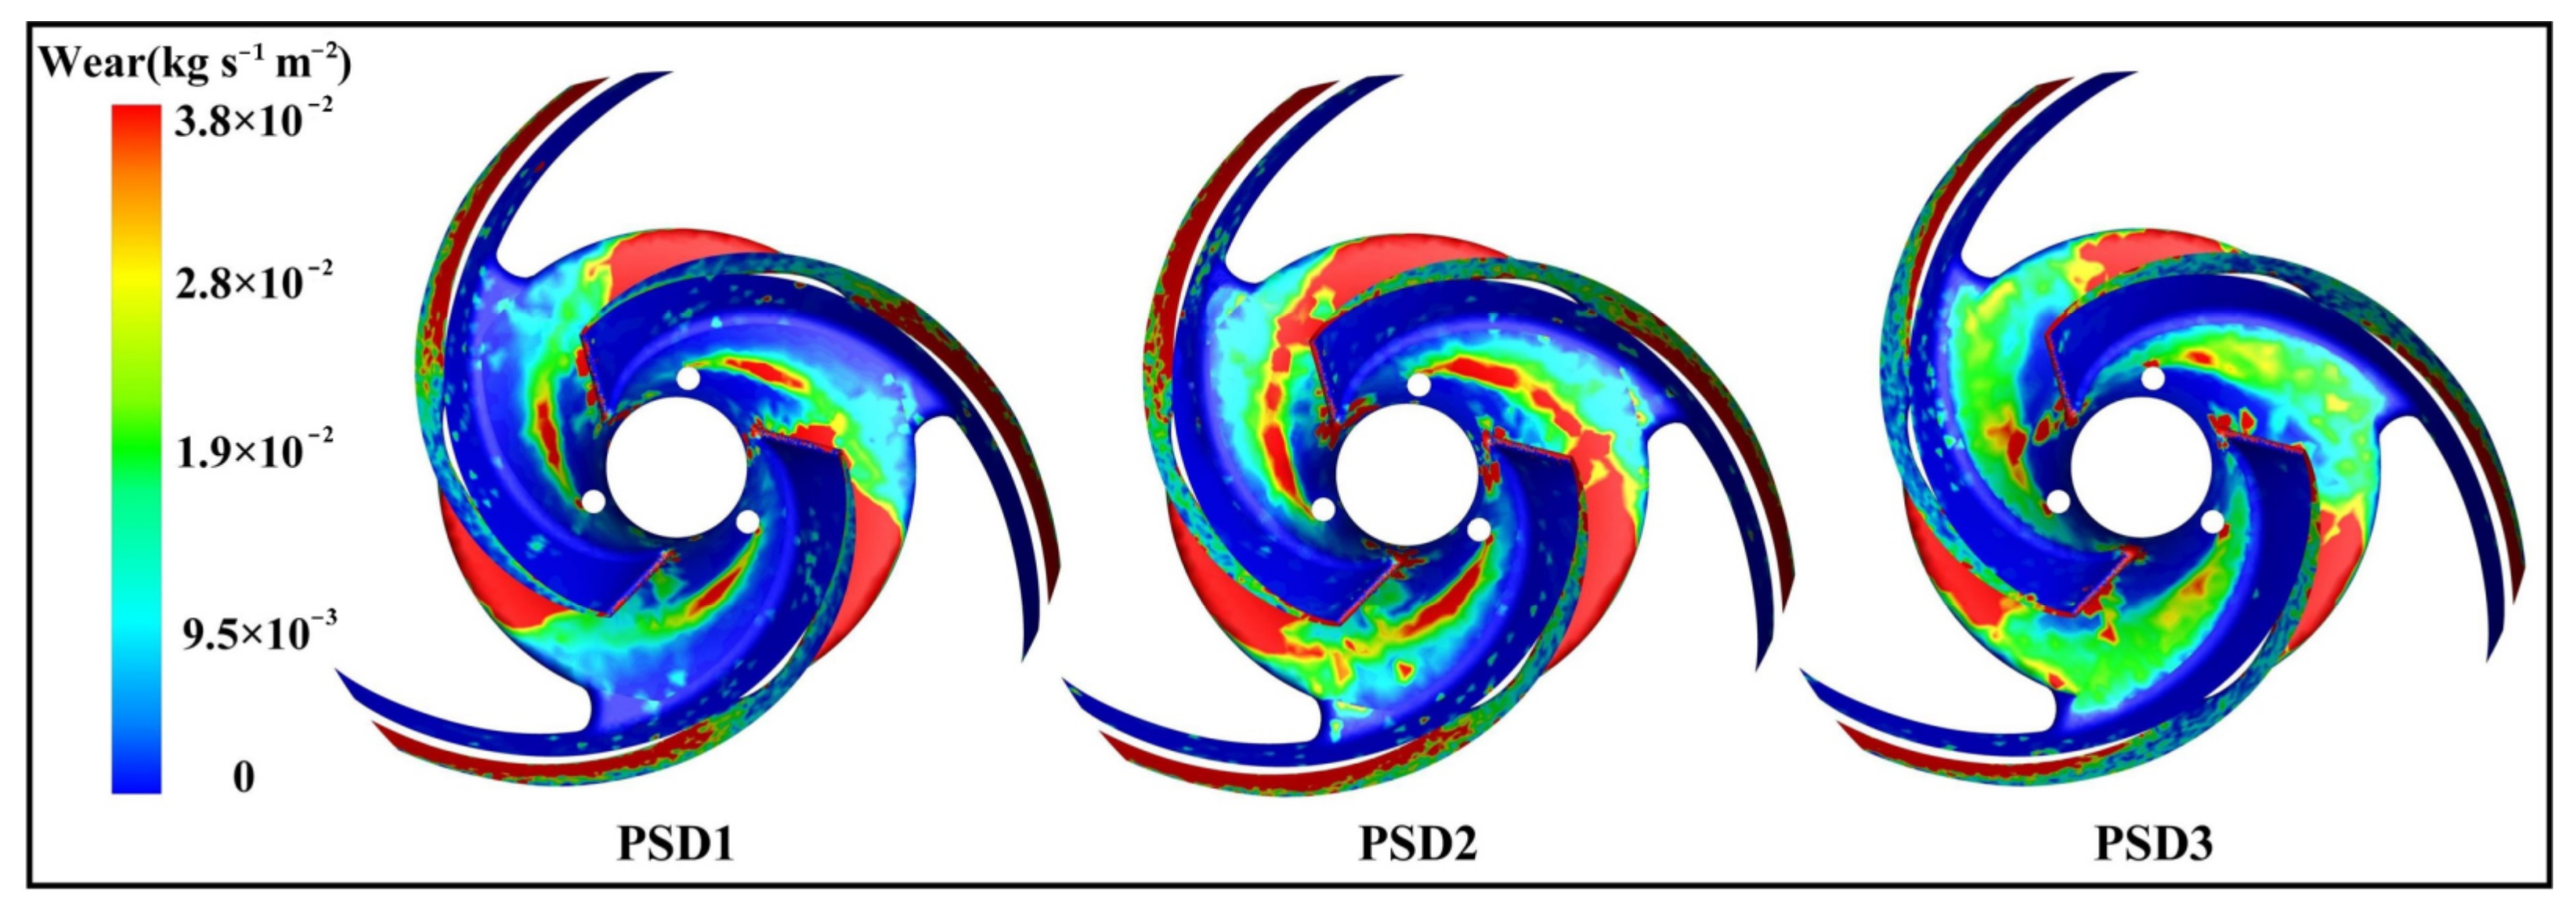
Figure 10 shows the wear of the impeller under the conditions of three particle components when the rated flow rate (Q) is 70 m3/h. It can be seen from the figure that the wear on the wall of the hub was mainly concentrated at the center line of the two blades (position A) and the outer edge of the hub wall near the pressure surface of the blade (position B). In the three working conditions of different particle compositions, the wear area of PSD1 was mainly concentrated in the B position and there was a small amount of wear in the A position. Both the A and B areas of PSD2 were distributed with more severe wear areas, and the overall wear was the most serious. The severely worn area of PSD3 was distributed in position B. The severely worn area was the smallest of the three, but its overall worn area was the largest.
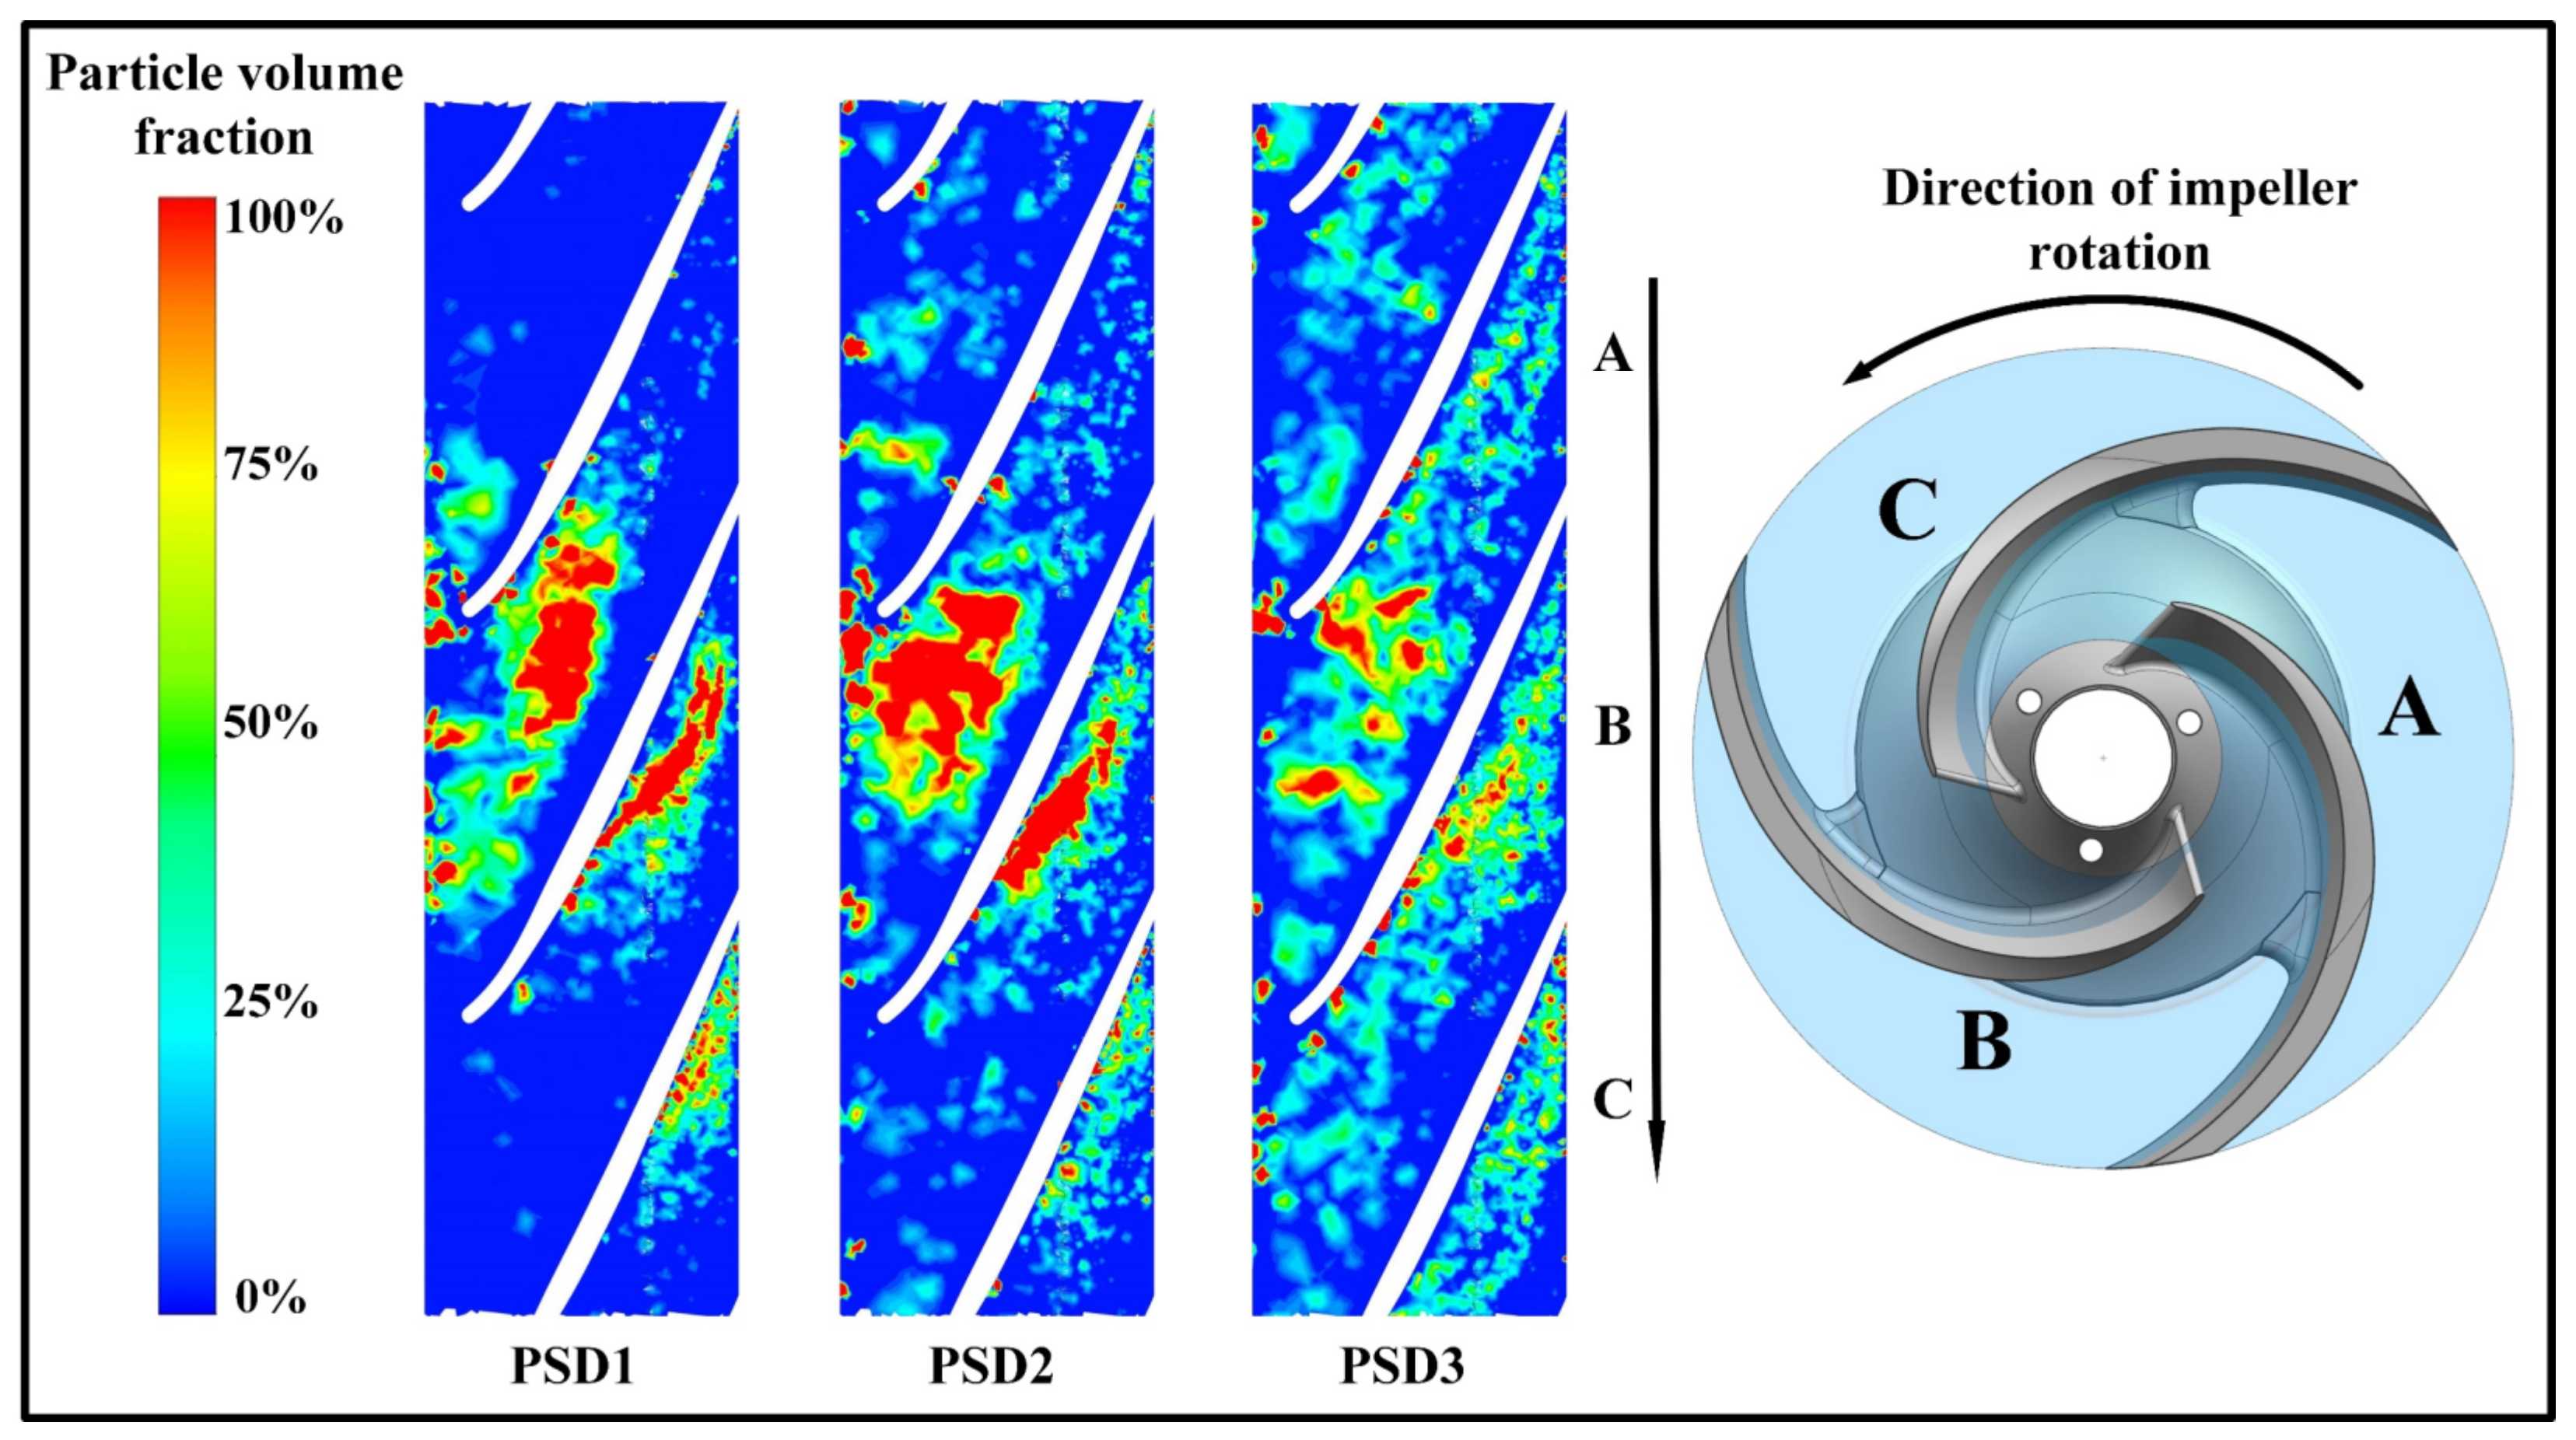
In order to study the reasons for the differences in the impeller wear caused by different particle components, the particle-volume distribution diagrams of the cascade span of 0.5 under three different working conditions were compared and analyzed. It can be seen from Figure 11 that the particles were mainly distributed in second flow channel A. This was mainly because the particles were affected by gravity and began to accumulate in the lower part of the flow channel before entering the impeller. In the PSD2 condition, 30% of the particle components were replaced by small particles, which were distributed in all three flow channels. In second flow channel A, higher local particle aggregation occurred than in the PSD1 condition. In the PSD3 condition, the particle distribution in the three flow channels had showed little difference.
The reason for the above phenomenon was that in the solid–liquid two-phase flow, compared with the 3 mm large particles, the proportion of 0.3 mm small particles affected by gravity was lower, and gravity did not play a leading role. Additionally, the followability of the small particles was better, so the particle distribution of the PSD3 working condition wherein small particles accounted for more of the total was more uniform [33]. Therefore, the local severe-wear area of the impeller under the PSD3 operating condition was the lowest among the three operating conditions, but the overall wear area was the largest. Comparing PSD1 and PSD2, it was found that the local particle aggregation phenomenon was more obvious at the entrance of the A channel under the PSD2 working condition. This was because the particle component of PSD2 contained a certain number of small particles, and a small number of small particles was mixed in between the large particles to fill the space between the large particles. The gaps between the particles further aggravated the local high concentration in this area. At the same time, it could be considered that the composite particles had a larger collision area when they collided with the impeller. This was also the reason the wear of the PSD2 impeller hub mentioned above was more serious than that of PSD1. That is, in the solid–liquid two-phase conveying process of the centrifugal pump, for the condition of a certain mass fraction, when a small amount of the particle component was small particles, it increased the wear of the impeller; but when the small particles in the particle component accounted for a large proportion of the total, the wear situation was weakened again.
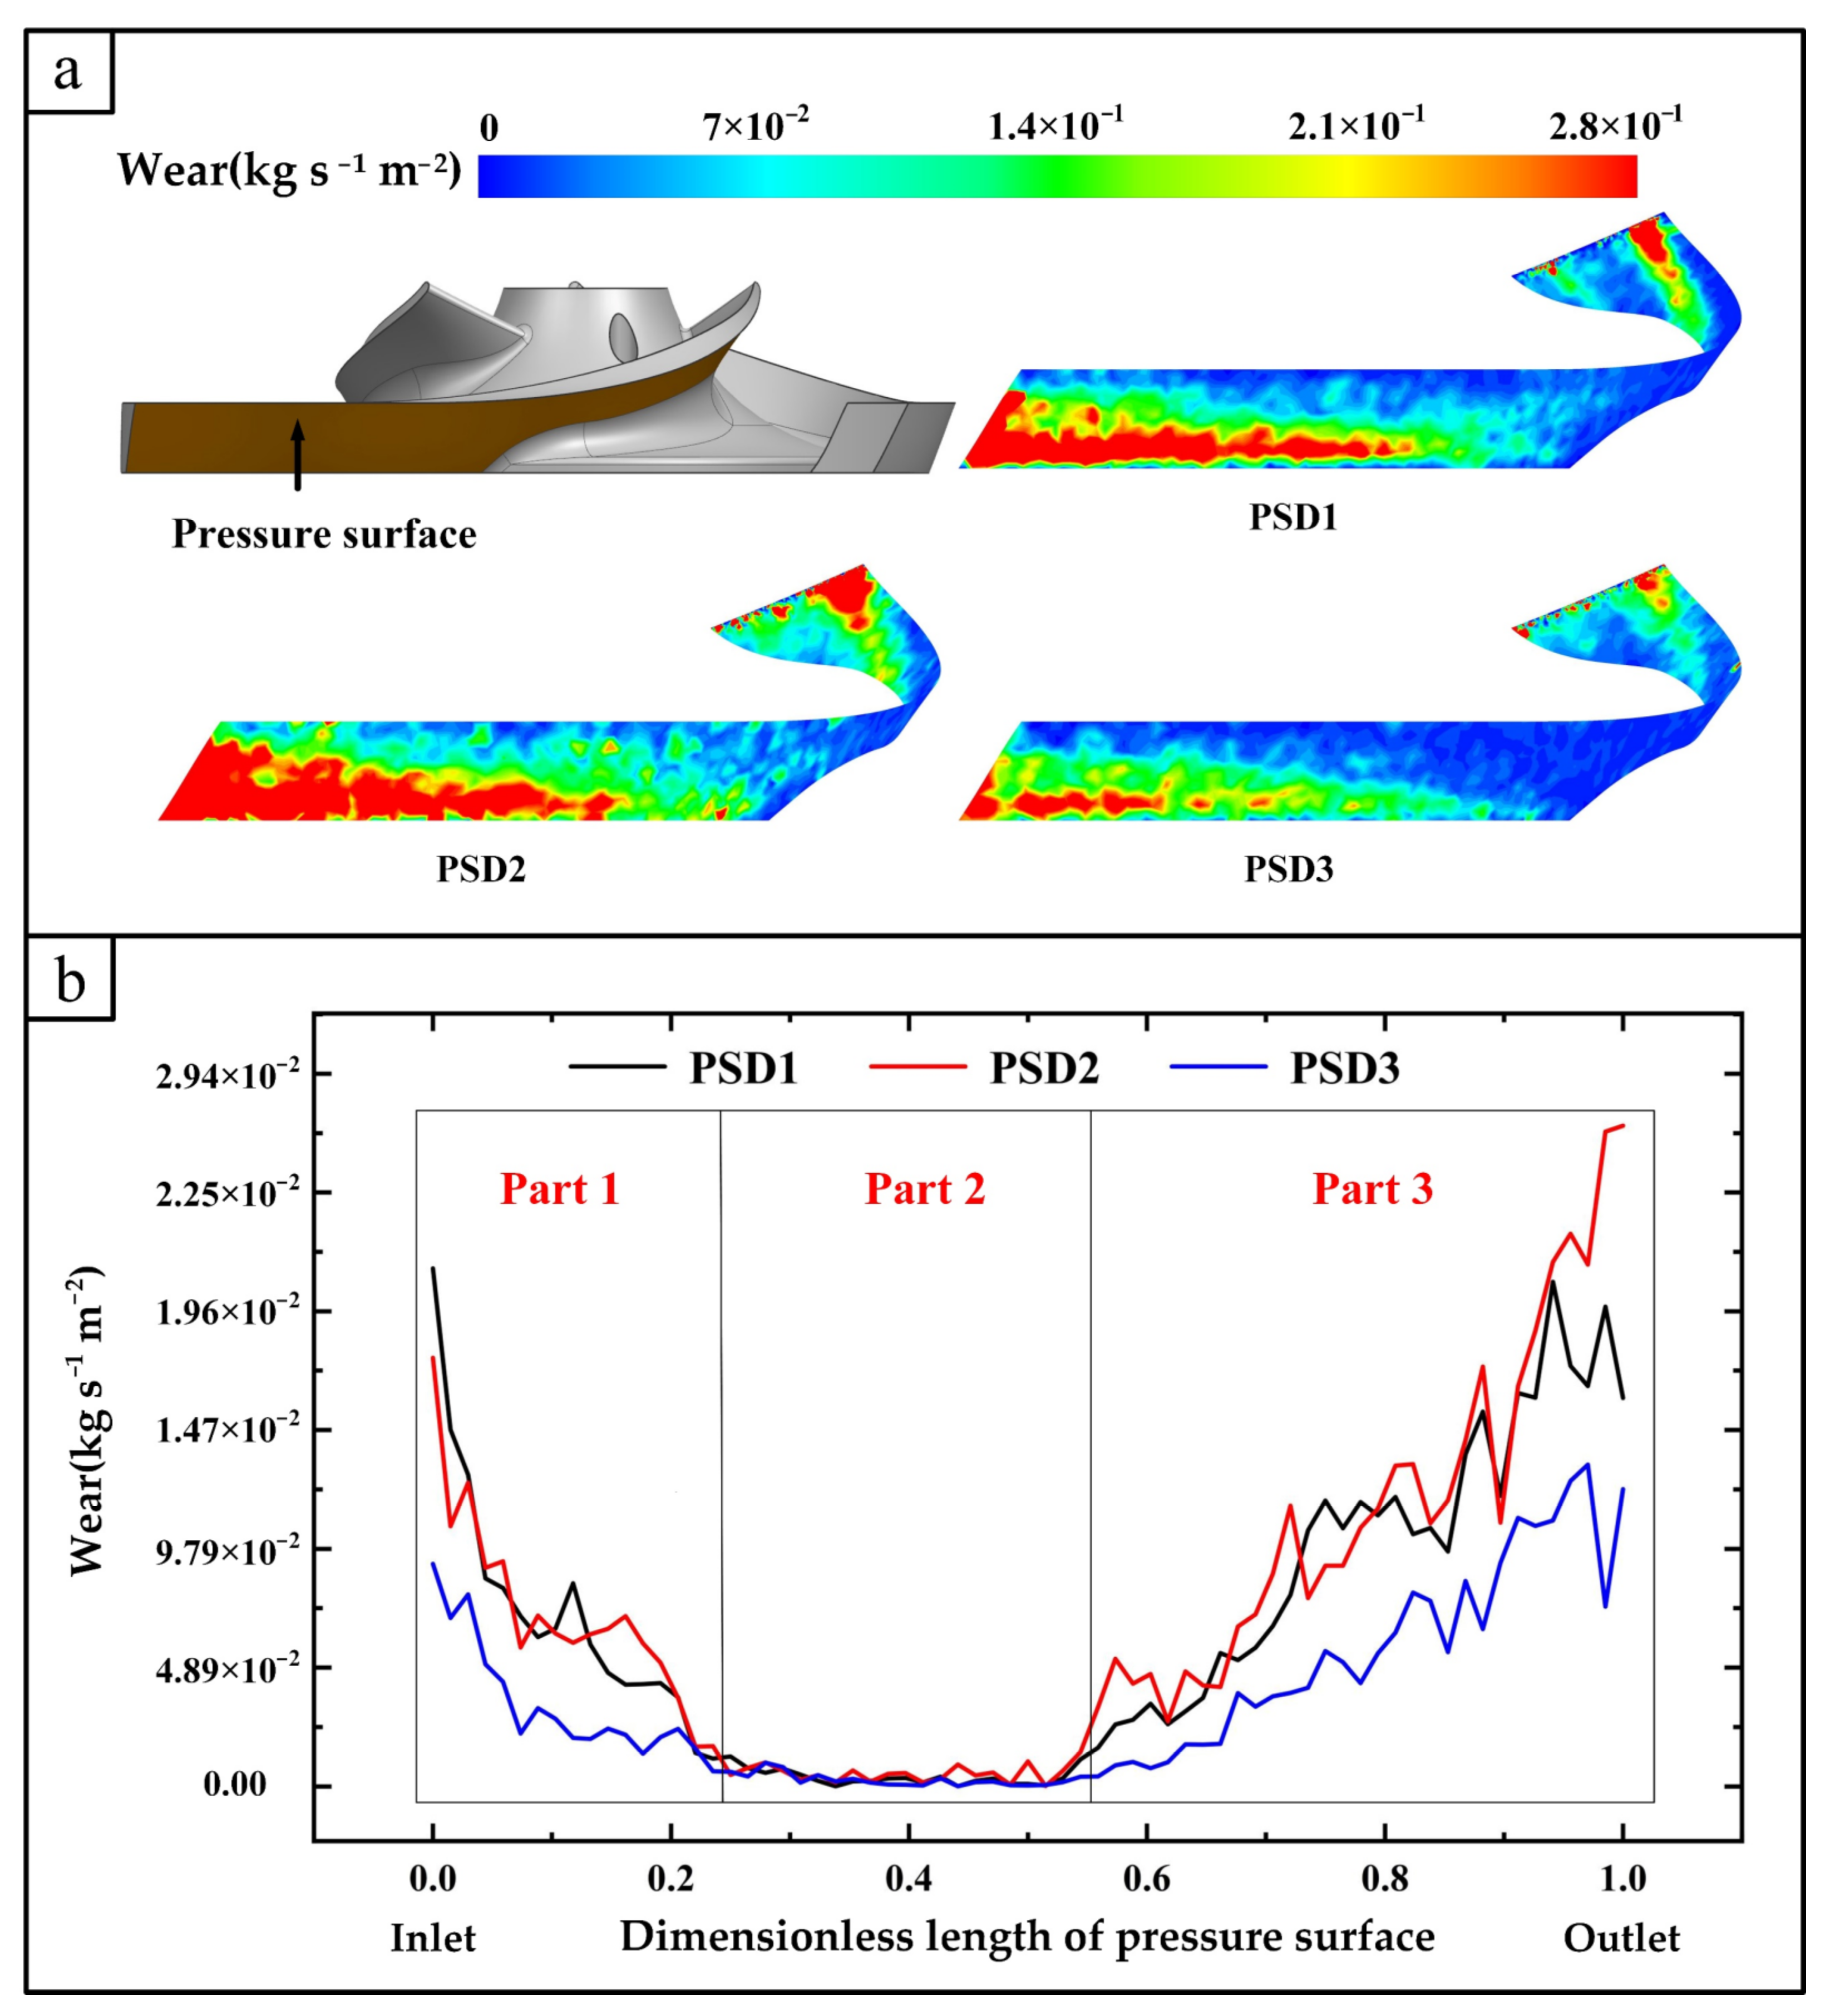
It can be seen from Figure 12 that when the rated flow rate (Q) was 70 m3/h, except for the different wear rates, the distribution area of the wear area on the pressure surface of the blade was basically the same. The most serious wear under different working conditions generally occurred on the leading edge and the trailing edge of the blade. Nearby, the middle section of the pressure surface also exhibited wear, but the wear of these parts was relatively light. As shown in Figure 12a, at the blade-head position, the wear area of PSD2 was the largest, that of PSD1 was the second largest, and that of PSD3 was the smallest of the three. However, it can be found from Figure 12b that the average wear rate of PSD1 at the head of Part 1 of the blade-pressure surface was the highest among the three working conditions. This was because in the PSD1 working condition, the particle components were all 3 mm larger. The particles were greatly affected by inertia. The particles directly hit the head of the impeller at a large relative speed, causing comparatively serious erosion and wear. The PSD2 working condition had 30% small particles, and the distribution ratio was for the particles when they entered the impeller. The dispersion of PSD1 occurred because the wear area was larger than that of PSD1, but the average wear rate was less than that of PSD1. However, as shown in Figure 12b, the average wear rate of the pressure-surface tail of the PSD2 blade was greater than that of the PSD1 condition. This was because of the pressure surface of the blade in the tail region. Due to the rotation of the impeller itself, particles gathered there to form a local high concentration. At the same time, the small particles in PSD2 filled the large-particle clusters and formed a higher concentration than PSD1 at the same position. The particles aggregated, so the average wear rate of PSD2 was greater than that of PSD1.

4.3. Volute Wear Analysis

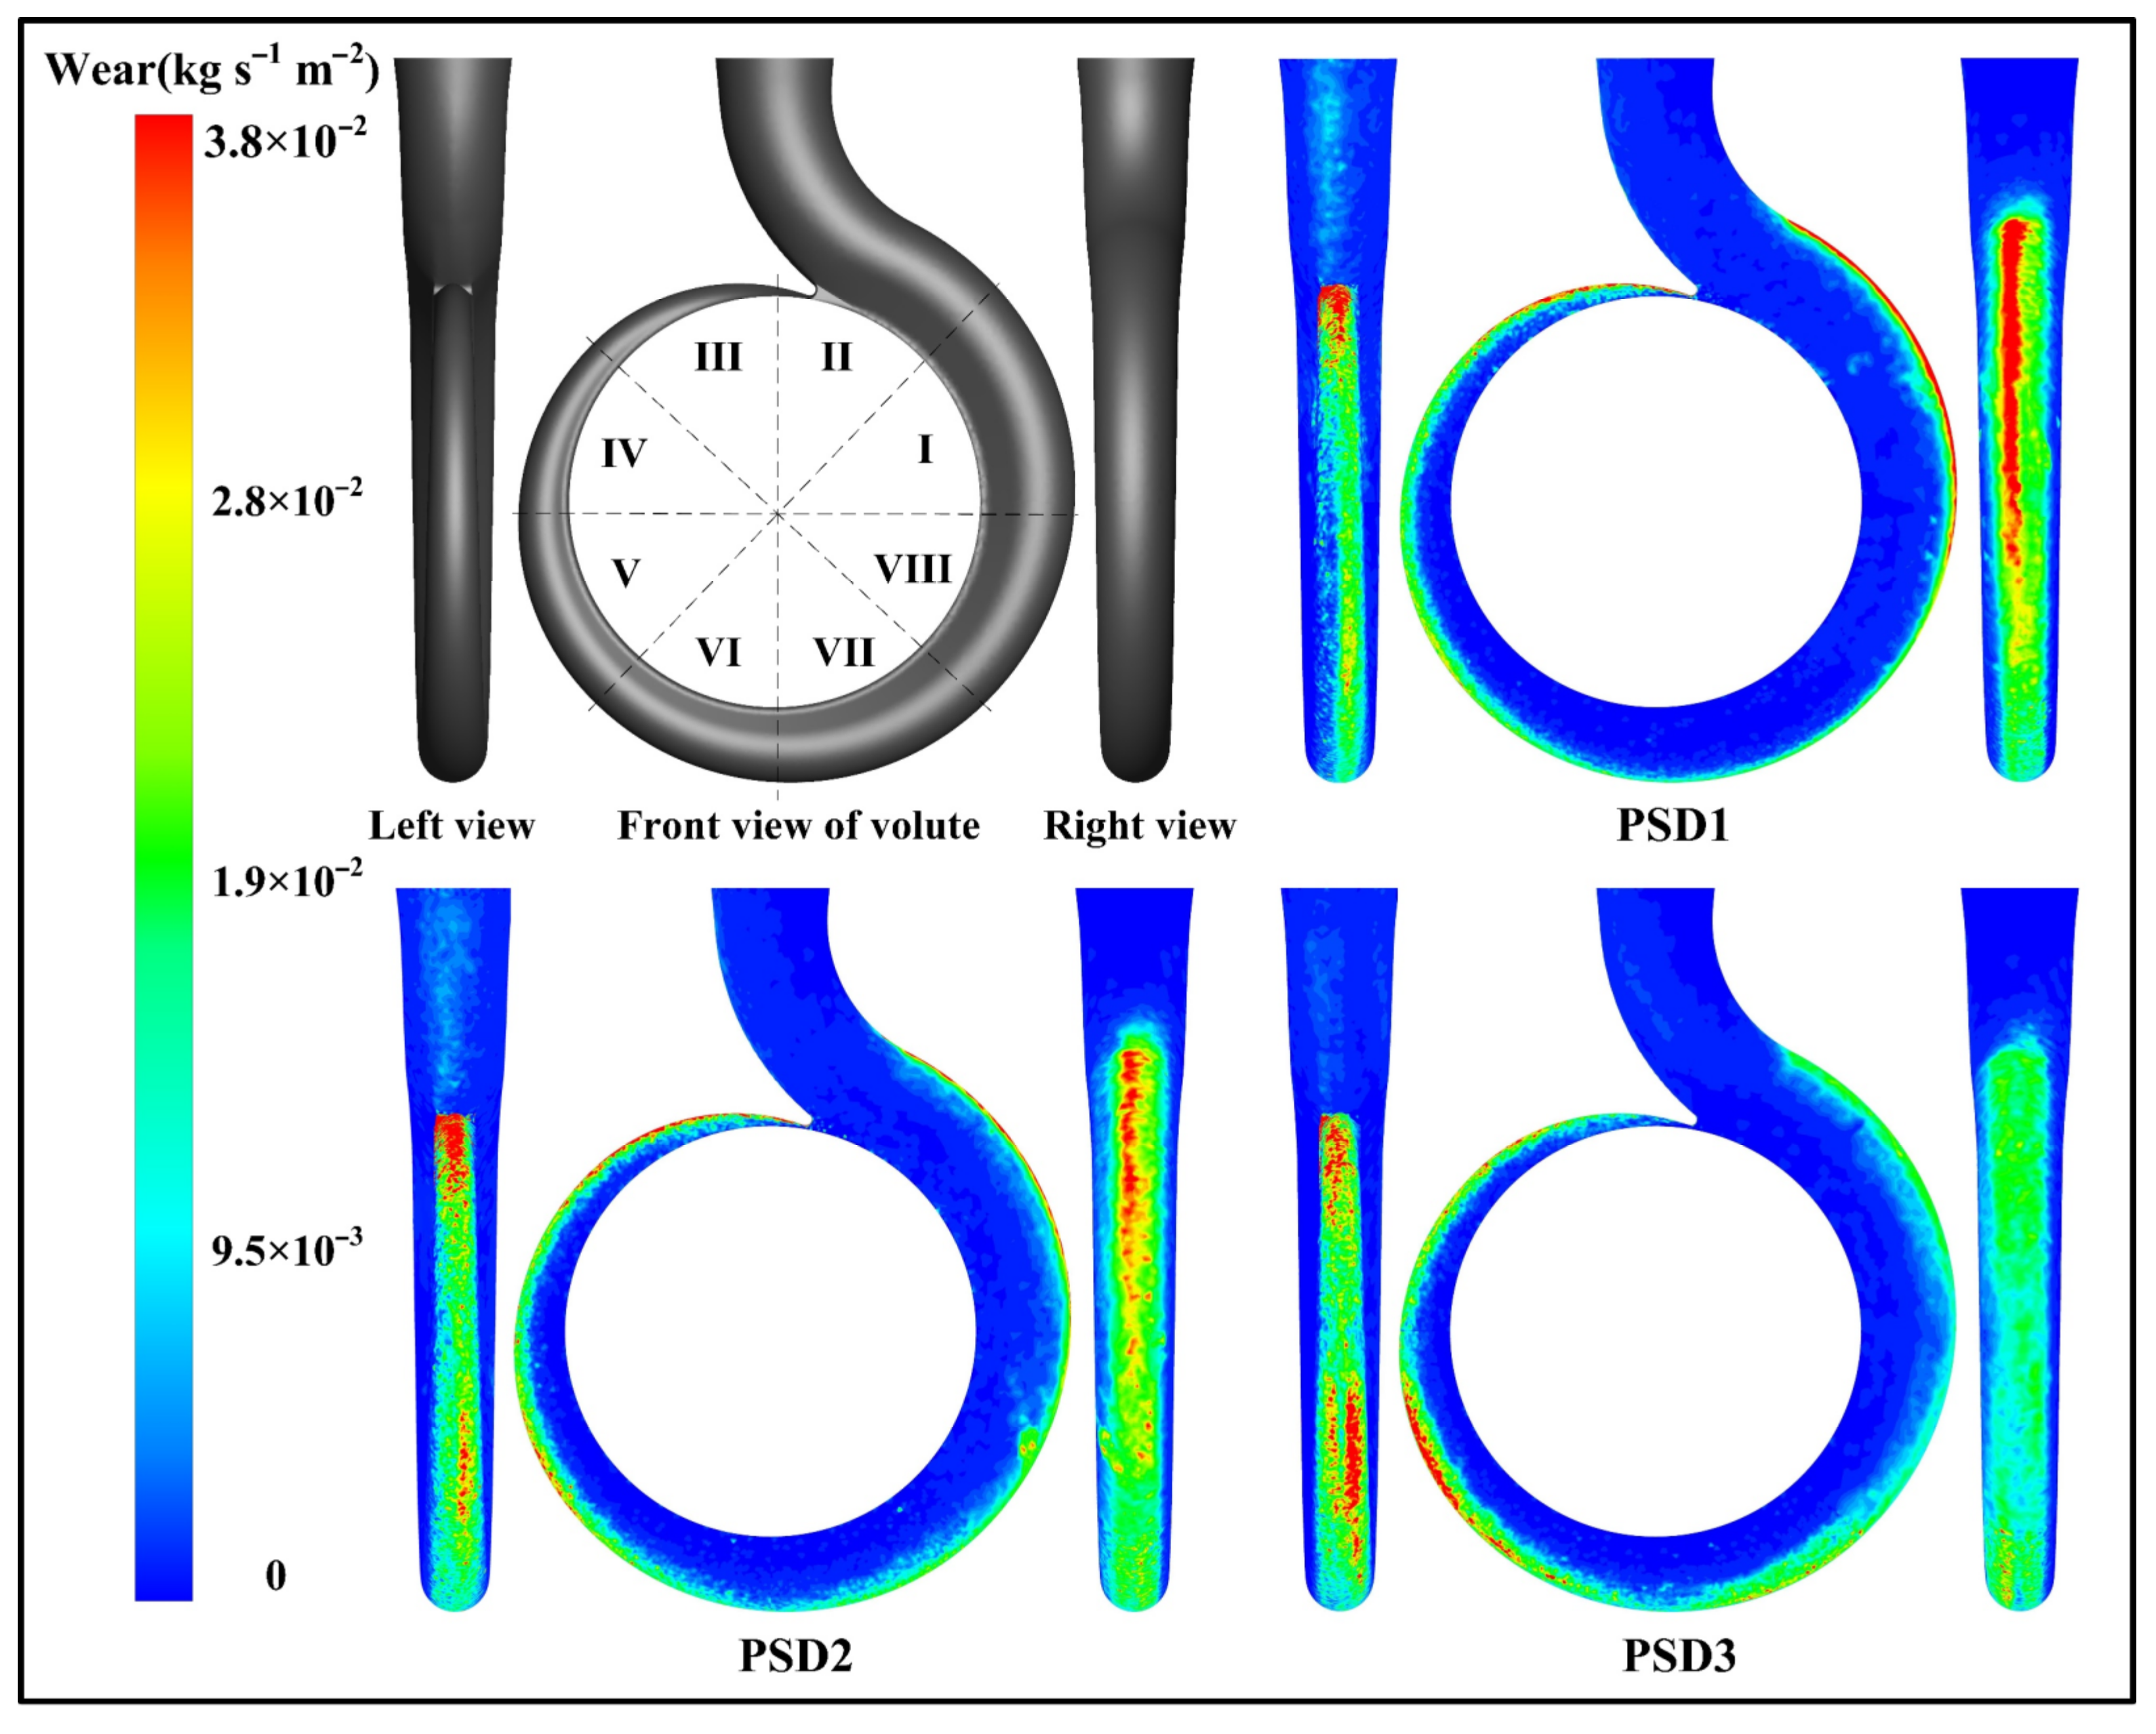
The fluid in the volute was decelerated and pressurized, and the particle flow was different from that in the impeller. The wear mechanism of the particles on the inner wall of the volute was also different, mainly due to changes in the contributions of the impact wear and the cutting wear. As shown in Figure 13, when the rated flow rate (Q) was 70 m3/h under the PSD1 working condition, that is, when the particles were all 3 mm, the wear area of the volute was relatively concentrated. There was more serious wear in the tongue areas of I and II. When some of the particles were broken and the particle composition was converted to the PSD2 working condition with 30% small particles, the overall wear area of the volute increased, and the wear in the I and II areas was weaker than that of single-particle PSD1. The wear rate of the tongue area increased, and at the same time, the average wear rate of the V and VI areas increased compared with PSD1. When the particle composition was PSD3, the severely worn areas appeared in the III, V, and VI regions. The wear area of the volute reached the maximum and the wear area tended to spread to the front and rear covers, but the severe wear area was reduced.

5. Discussion

(1)
At the rated point Q = 70 m3/h from PSD1 to PSD3, compared with 15.16 m in the clean-water conveying condition, the particle components in the solid–liquid two-phase centrifugal pump decreased to 13.39 m, 13.98 m, and 14.52 m, respectively. The decreasing amplitude was 11.68%, 7.78%, and 4.22%, respectively. Compared with 67.16% in the clean-water conveying condition, the efficiency decreased to 58.24%, 59.38%, and 60.39%, respectively, with the decreasing amplitude of 13.28%, 11.58%, and 10.08%, respectively. That is, the performance of the two-phase flow centrifugal pump increases with the proportion of small and medium-sized particles in the particle composition, the head and efficiency gradually improve, and the mixing efficiency of the centrifugal pump improves.
(2)
In the impeller of the mixed-particle solid–liquid two-phase flow of the centrifugal pump, the concentration of the particles was low at the inlet of the impeller, and the flow velocity at the inlet was lower than the flow velocity at the trailing edge of the pressure surface. The filling effect of small particles on large particles is not obvious. At the outlet of the pressure surface of the impeller, the particles were highly aggregated by the rotation of the impeller, and the filling effect of small particles around large particles could not be ignored. This effect caused a larger wear area and aggravated the wear.
(3)
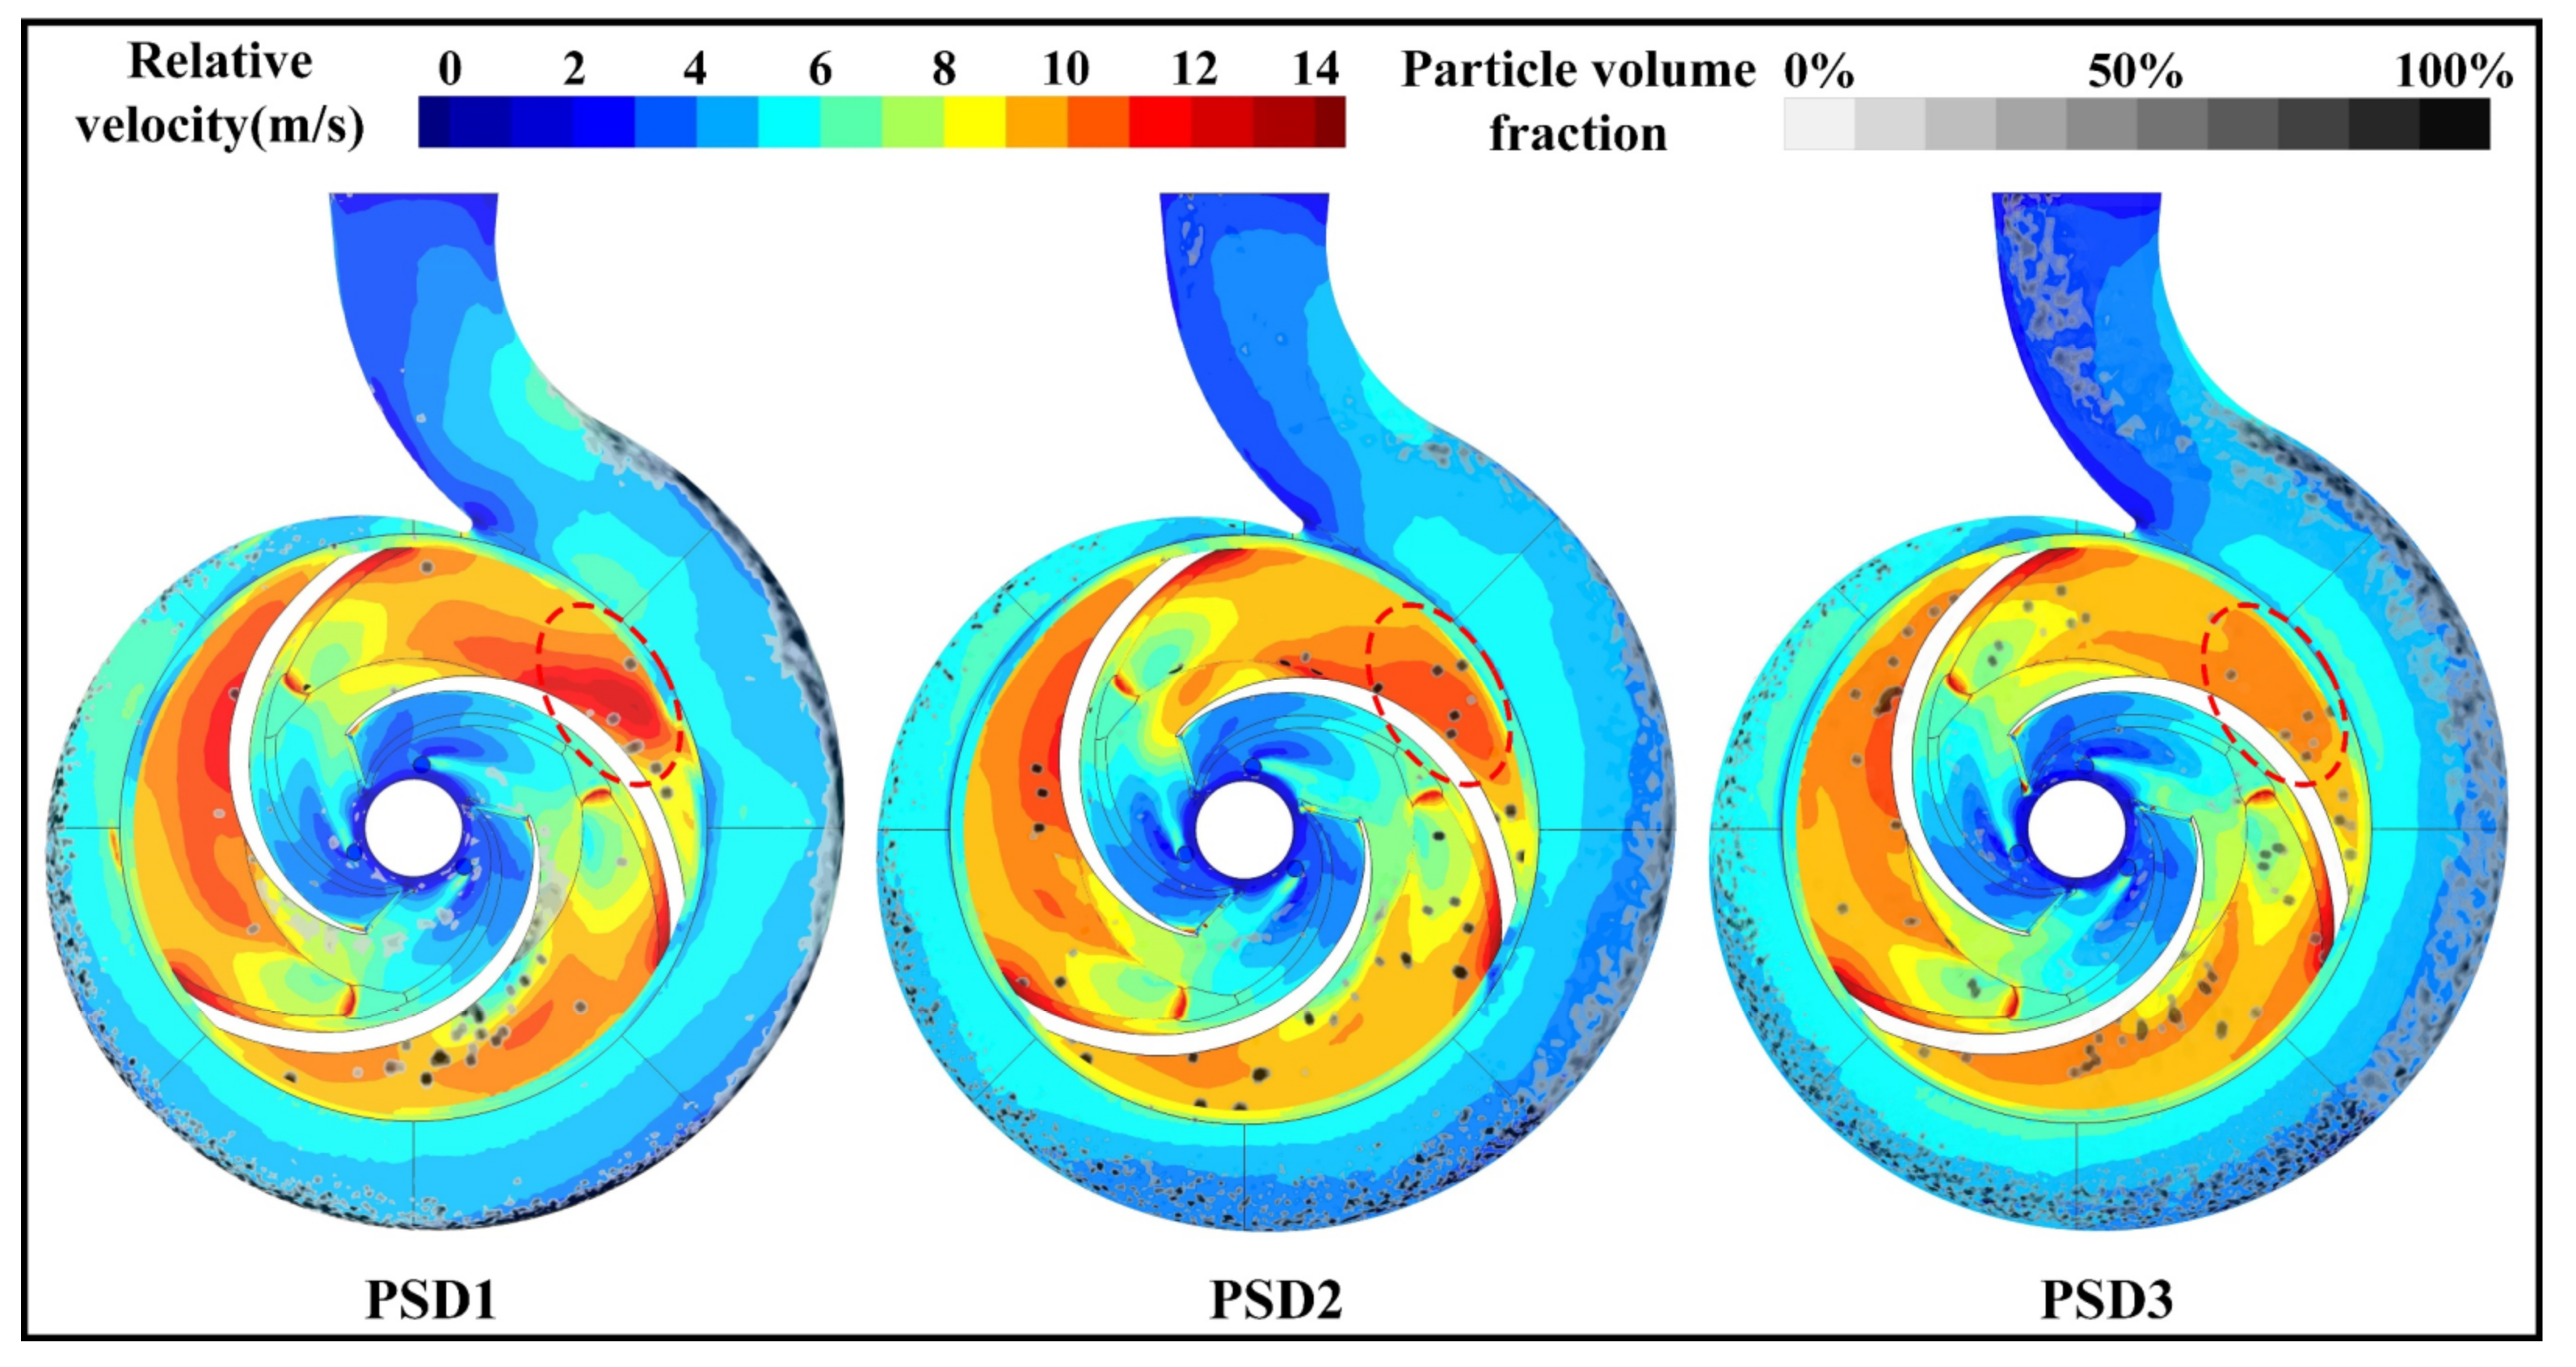
Comparing the wall-velocity cloud map and the wall-particle volume fraction of the three different particle composition conditions in Figure 14, it could be found that the local velocity of PSD1 was the highest at the red circle, but the overall velocity distribution of the impeller and the volute wall was also the most uneven. The particle distribution on the wall of the volute of PSD1 was mainly concentrated in parts I and II. This was because the 3 mm large particles had a large volume and poor followability. They could easily collide with the wall in the impeller channel. Most of the large particles gained greater speeds after colliding with the pressure surface of the blade at the red circle and directly bounced away from the impeller channel. Then the large particles collided with the volute’s I and II flow channels, and a small number of the particles collided with the volute’s III flow channel after rotating with the impeller. As a result, the severely worn area of the volute in Figure 13 occurred in flow passages I, II, and III. The speed of PSD3 at the position of the red circle was the lowest among the three kinds of working conditions, but the overall wall speed and the particle distribution in the flow channel of the impeller and volute were the most uniform. Most of the particles followed the flow field and then were thrown out evenly. As a result, the overall wear area shown in Figure 13 was larger, but the severe wear area was smaller. The PSD2 working condition presented an intermediate state between PSD1 and PSD3.
In this study, wear experiments and numerical simulations are completed under design conditions while centrifugal pumps may deviate from the design conditions in practical engineering applications. Therefore, subsequent studies can be carried out under variable conditions.

6. Conclusions

Through experiments and numerical simulations of mixed-transport centrifugal pumps, the external characteristics and wear characteristics of centrifugal pumps with different particle components were studied in this research. The numerical calculation results were in good agreement with the experimental results. Through this research, the following conclusions could be drawn:
  • The particle components in the solid–liquid two-phase centrifugal pump have an obvious effect on the external characteristics of the centrifugal pump. With the increase of the small-particle component at the same mass concentration, the head and the efficiency of the centrifugal pump were significantly improved, and the mixing efficiency of the centrifugal pump was improved.
  • For the condition of the total-mass fraction of the particles being constant, the wear area of the impeller was more concentrated in the PSD1 single-particle working condition, and the wear rate at the root of the impeller hub (position B) was the most serious of the three working conditions. The PSD2 working condition had a particle composition of 7:3. While the overall wear area is larger than that of PSD1, the wear rate of the trailing edge of the blade pressure surface is also 41% higher than that of PSD1 under the single-particle condition. In the PSD3 working condition with a particle composition of 3:7, the wear area of the volute and the impeller was the largest of the three working conditions, but the overall average wear rate was the lowest among the three working conditions.
  • In the volute, with the increase of the small particle components in the particle composition, the area of the severely worn area of the I and II sections decreases, and the severely worn area of the V and VI sections increases. In the trend of transition from the II area to the V and VI areas, the overall wear area of the volute increases but the local severe-wear area decreases.

Author Contributions

Conceptualization, Y.L. and L.Z.; methodology, L.Z.; software, Z.J.; validation, Y.L., L.Z. and Z.J.; formal analysis, L.Z.; investigation, L.Z.; resources, L.Z.; data curation, Z.J.; writing—original draft preparation, L.Z.; writing—review and editing, L.Z.; visualization, L.Z.; supervision, Y.L.; project administration, Y.L. All authors have read and agreed to the published version of the manuscript.

Funding

This work was supported by the National Natural Science Foundation of China (No. 51976197), and the Key Research and Development Program of Zhejiang Province (No. 2020C03099).

Institutional Review Board Statement

Not applicable.

Informed Consent Statement

Not applicable.

Data Availability Statement

The data presented in this study are available on request from the corresponding author. Due to the huge amount of data, it is not convenient to save them in publicly archived datasets.

Conflicts of Interest

The authors declare no conflict of interest.

References

  1. Ma, W.B.; Schott, D.; Lodewijks, G. Continuous Line Bucket Lifting Versus Pipe Lifting. J. Offshore Mech. Arct. Eng. 2017, 139, 9. [Google Scholar] [CrossRef]
  2. Wang, R.K.; Guan, Y.J.; Jin, X.; Tang, Z.J.; Zhu, Z.C.; Su, X.H. Impact of Particle Sizes on Flow Characteristics of Slurry Pump for Deep-Sea Mining. Shock Vib. 2021, 2021, 13. [Google Scholar] [CrossRef]
  3. Wang, Z.; Qian, Z. Effects of concentration and size of silt particles on the performance of a double-suction centrifugal pump. Energy 2017, 123, 36–46. [Google Scholar] [CrossRef]
  4. Guan, X.F. Modern Pumps Theory and Design; Astronautic Press: Beijing, China, 2011. [Google Scholar]
  5. Song, X.J.; Yao, R.; Shen, Y.B.; Bi, H.L.; Zhang, Y.; Du, L.P.; Wang, Z.W. Numerical Prediction of Erosion Based on the Solid-Liquid Two-Phase Flow in a Double-Suction Centrifugal Pump. J. Mar. Sci. Eng. 2021, 9, 14. [Google Scholar] [CrossRef]
  6. Kumar, S.; Gandhi, B.K.; Mohapatra, S.K. Performance Characteristics of Centrifugal Slurry Pump with Multi-Sized Particulate Bottom and Fly Ash Mixtures. Part. Sci. Technol. 2014, 32, 466–476. [Google Scholar] [CrossRef]
  7. Li, Y.; Zhang, H.B.; Lin, Z.; He, Z.H.; Xiang, J.L.; Su, X.H. Relationship between wear formation and large-particle motion in a pipe bend. R. Soc. Open Sci. 2019, 6, 15. [Google Scholar] [CrossRef] [PubMed] [Green Version]
  8. Shen, Z.; Li, R.; Han, W.; Quan, H.; Guo, R. Erosion Wear on Impeller of Double-Suction Centrifugal Pump due to Sediment Flow. J. Appl. Fluid Mech. 2020, 13, 1131–1142. [Google Scholar] [CrossRef]
  9. Bartosik, A. Influence of Coarse-Dispersive Solid Phase on the ‘Particles-Wall’ Shear Stress in Turbulent Slurry Flow with High Solid Concentration. Arch. Mech. Eng. 2010, 57, 45–68. [Google Scholar] [CrossRef] [Green Version]
  10. Tarodiya, R.; Gandhi, B.K. Numerical Investigation of Erosive Wear of a Centrifugal Slurry Pump Due to Solid–Liquid Flow. J. Tribol. 2021, 143, 14. [Google Scholar] [CrossRef]
  11. Tang, C.; Kim, Y.-J. CFD-DEM Simulation for the Distribution and Motion Feature of Solid Particles in Single-Channel Pump. Energies 2020, 13, 12. [Google Scholar] [CrossRef]
  12. Yang, C.X.; Hou, S.S.; Xu, J.H.; Zhang, Y.Q.; Zheng, Y.; Fernandez-Rodriguez, E.; Zhou, D.Q. Multicomponent Water Effects on Rotating Machines Disk Erosion. Water 2020, 12, 20. [Google Scholar] [CrossRef] [Green Version]
  13. Luo, B.W.; Wang, Z.W.; Wu, X.B.; Wang, C.P. Friction and Wear Behavior of Paired Pairs of Ceramics and Metal in High-Pressure Pump of Seawater Desalination. Strength Mater. 2021, 53, 797–803. [Google Scholar] [CrossRef]
  14. Zhang, J.; Qiu, X.G.; Gong, X.Z.; Kong, X.D. Wear behavior of friction pairs of different materials for ultra-high-pressure axial piston pump. Proc. Inst. Mech. Eng. Part E J. Process. Mech. Eng. 2019, 233, 945–953. [Google Scholar] [CrossRef]
  15. Peng, W.S.; Cao, X.W.; Hou, J.; Ma, L.; Wang, P.; Miao, Y.C. Numerical prediction of solid particle erosion under upward multiphase annular flow in vertical pipe bends. Int. J. Press. Vessel. Pip. 2021, 192, 12. [Google Scholar] [CrossRef]
  16. Xu, L.; Zhang, Q.; Zheng, J.Y.; Zhao, Y.Z. Numerical prediction of erosion in elbow based on CFD-DEM simulation. Powder Technol. 2016, 302, 236–246. [Google Scholar] [CrossRef]
  17. Burgess, K.E.; Reizes, J.A. The Effect of Sizing, Specific Gravity and Concentration on the Performance of Centrifugal Slurry Pumps. Proc. Inst. Mech. Eng. 1976, 190, 391–399. [Google Scholar] [CrossRef]
  18. Sellgren, A. Performance of a Centrifugal Pump When Pumping Ores and Industrial Minerals. In Proceedings of the 6th International Conference on the Hydraulic Transport of Solids in Pipes, Sendai, Japan, 4–6 November 1980; pp. 291–304. [Google Scholar]
  19. Gahlot, V.K.; Seshadri, V.; Malhotra, R.C. Effect of Density, Size Distribution, and Concentration of Solid on the Characteristics of Centrifugal Pumps. J. Fluids Eng. 1992, 114, 386–389. [Google Scholar] [CrossRef]
  20. Kazim, K.A.; Maiti, B.; Chand, P. A correlation to predict the performance characteristics of centrifugal pumps handling slurries. Proc. Inst. Mech. Eng. Part A J. Power Energy 1997, 211, 147–157. [Google Scholar] [CrossRef]
  21. Engin, T.; Gur, M. Performance Characteristics of a Centrifugal Pump Impeller With Running Tip Clearance Pumping Solid-Liquid Mixtures. J. Fluids Eng. 2001, 123, 532–538. [Google Scholar] [CrossRef]
  22. Engin, T.; Gur, M. Comparative Evaluation of Some Existing Correlations to Predict Head Degradation of Centrifugal Slurry Pumps. J. Fluids Eng. 2003, 125, 149–157. [Google Scholar] [CrossRef]
  23. Yassine, K.C.; Hammoud, A.H.; Khalil, M.F. Experimental Investigation for Centrifugal Slurry Pump Performance. In Proceedings of the 10th International Congress of Fluid Dynamics (ICFD’10), Cairo, Egypt, 16–19 December 2010. [Google Scholar]
  24. Khalil, M.F.; Kassab, S.Z.; Naby, A.A.A.; Azouz, A. Performance Characteristics of Centrifugal Pump Conveying Soft Slurry. Am. J. Mech. Eng. 2013, 1, 103–112. [Google Scholar] [CrossRef] [Green Version]
  25. El-Emam, M.A.; Shi, W.D.; Zhou, L. CFD-DEM simulation and optimization of gas-cyclone performance with realistic macroscopic particulate matter. Adv. Powder Technol. 2019, 30, 2686–2702. [Google Scholar] [CrossRef]
  26. Grant, G.; Tabakoff, W. An Experimental Investigation of the Erosive Characteristics of 2024 Aluminum Alloy; Report No. 73-37; National Technical Information Service, U.S. Department of Commerce: Alexandria, VI, USA, 1973. [Google Scholar]
  27. Grant, G.; Tabakoff, W. Erosion Prediction in Turbomachinery Resulting from Environmental Solid Particles. J. Aircr. 1975, 12, 471–478. [Google Scholar] [CrossRef]
  28. Ahlert, K.R. Effects of particle impingement angle and surface wetting on solid particle erosion of AISI 1018 steel, BUniversity of Tulsa, 1994. Mater. Sci. Eng. 2020, 943, 012024. [Google Scholar]
  29. Liu, C.Q.; Wang, Y.Q.; Yang, Y.; Duan, Z.W. New omega vortex identification method. Sci. China Ser. G Phys. Mech. Astron. 2016, 59, 9. [Google Scholar] [CrossRef]
  30. Liu, C.; Liu, J. Modified normalized Rortex/vortex identification method. Phys. Fluids 2019, 31, 061704. [Google Scholar] [CrossRef] [Green Version]
  31. Liu, J.-M.; Wang, Y.-Q.; Gao, Y.-S.; Liu, C. Galilean invariance of Omega vortex identification method. J. Hydrodyn. 2019, 31, 249–255. [Google Scholar] [CrossRef]
  32. Zhang, R.J. River Sediment Dynamics; Water and Power Press: Beijing, China, 1998. [Google Scholar]
  33. Hinze, J.O. Turbulent Fluid and Particle Interaction. In Proceedings of the International Symposium on Two-Phase Systems, Haifa, Israel, 29 August 1971; pp. 433–452. [Google Scholar]
Figure 1. The experimental system: (a) schematic view and (b) photographic view.
Processes 10 00565 g001
Figure 2. Particle morphology.
Processes 10 00565 g002
Figure 3. 3D assembly model of centrifugal pump and grid diagram.
Processes 10 00565 g003
Figure 4. The performance comparison of the experiment and the simulation.
Processes 10 00565 g004
Figure 5. Contrast diagram of impeller experiment and simulation.
Processes 10 00565 g005
Figure 6. Numerical simulation and experimental results of solid–liquid two-phase flow centrifugal pump.
Processes 10 00565 g006
Figure 7. Vortex structures for different particle composition conditions.
Processes 10 00565 g007
Figure 8. Pressure-variation and pressure-of-volute outlet diagram for different particle composition conditions.
Processes 10 00565 g008
Figure 9. Pressure distribution of the impeller.
Processes 10 00565 g009
Figure 10. Wear on impeller at different particle composition conditions.
Processes 10 00565 g010
Figure 11. Particle-volume fraction in span 0.5 of the impeller under different particle composition conditions.
Processes 10 00565 g011
Figure 12. (a) The blade wear contour and (b) average wear rate of blades.
Processes 10 00565 g012
Figure 13. Wear rate on volute for different particle composition conditions.
Processes 10 00565 g013
Figure 14. Wall-velocity and wall-particle volume fractions for different particle-composition conditions.
Processes 10 00565 g014
Table 1. Particle size distribution.
Pland/mmRatio
PSD131
0.30
PSD230.7
0.30.3
PSD330.3
0.30.7
Table 2. The parameters in the Ahlert wear model.
AnAθ0abxyxw
1.599 × 10−71.73Π/12−38.422.73.1470.36092.5321
Table 3. The number of nodes with the head of each set.
Serial Number of GridNumber of NodesThe Head of the Simulation (m)
14.60426 × 10515.28343
28.46013 × 10515.32418
31.10640 × 10615.28373
41.55974 × 10615.24920
52.00676 × 10615.19412
62.42731 × 10615.19312
72.93915 × 10615.18951
83.56107 × 10615.18709
Publisher’s Note: MDPI stays neutral with regard to jurisdictional claims in published maps and institutional affiliations.