Article

Effect of Surface Roughness on the Performance of a Shallow Spiral Groove Liquid Mechanical Seal

1
School of Energy and Power Engineering, Jiangsu University, Zhenjiang 212013, China
2
Shanghai Kaiquan Pump (Group) Co., Ltd., Shanghai 201804, China
*
Author to whom correspondence should be addressed.
Processes 2022, 10(4), 651; https://doi.org/10.3390/pr10040651
Submission received: 10 February 2022 / Revised: 22 March 2022 / Accepted: 24 March 2022 / Published: 27 March 2022

Abstract

:
Because surface roughness is similar to the size of the sealing gap in terms of scale, the effect of surface roughness on sealing performance must be considered. A calculation model determining the micro-gap flow and surface roughness is used to prove that the existence of surface roughness can effectively improve the sealing performance and that it can especially improve the opening force. The results indicated that the opening force of the lubrication film increases as the surface roughness increases and that the growth rate increases as the rotating speed increases. Due to different roughness sensitivities, the opening force increases differently in different parts of the seal. With regard to leakage, the roughness of the rotating ring’s grooved zone only increases the negative leakage when the rotating speed is higher than 8000 rpm. When the non-grooved zone of the rotating ring is rough, it can inhibit the negative leakage flow and cause the negative leakage to become positive when the rotating speed is higher than 1000 rpm. When the end face of the stationary ring is rough, the amount of leakage decreases. Furthermore, the surface roughness increases the friction torque when the rotating speed is higher than 5000 rpm. When the rotating speed is in the range of 1000–10,000 rpm, the roughness of the non-grooved area and the end face of the rotating ring increase the opening force by 2.40~57.94% and 3.55~69.33%, respectively. Meanwhile, by defining SF and SQ, a scheme for providing sealing performance is provided.

1. Introduction

With improvements in technology, mechanical face seals have become more widely used in industry. Poor mechanical sealing performance can affect the internal flow of centrifugal pump [1,2]. To ensure sealing performance, leakage should be eliminated or maintained within a certain range. In 2008, Lebeck proved that zero leakage can be realized through a grooved face seal through experimentation and theory [3]. Through further research, seals with spiral grooves have been proven to eliminate leakage and to improve sealing performance [4,5].
In some studies on sealing performance, the effect of roughness has frequently been ignored [6,7,8]. Since the roughness of the ring surface is similar to the size of the sealing gap in terms of scale, performance is also related to the surface roughness. Through experiments, Matsuzaki et al. and Arghavani et al. found that surface roughness and surface form can affect the performance of a sealing system [9,10,11]. Thus, surface roughness is a key parameter when studying sealing performance. In this study, a model considering the micro-scale gap flow and surface roughness was established to study sealing performance.
Generally, statistical, fractal, and roughness characterization methods that are based on deterministic rough micro-elements are the main and current methods that are implemented for solving roughness simulation problems. The use of a random distribution function to simulate surface roughness is called statistical model representation. Minet et al. used a mathematical model to realize random surface roughness, proposed a mixed lubrication model that considered surface roughness, and studied the sealing performance of a rough surface with mixed lubrication [12,13]. Gaussian random distribution and non-Gaussian random distribution are two common functions used to represent surface roughness. In 2016, Hu et al. established a statistical contact model for a continuous bi-Gaussian surface and analyzed the influence of the surface morphology on the surface properties, lubrication, and asperity contact [14]. In 2019, Meng et al. established a circular-pored texture mixed lubrication finite element model considering the effect of surface roughness and studied the influence of skewness and kurtosis values of non-Gaussian surface on the load-carrying capacity of sealing surface [15]. Chen et al. studied the effects of roughness using a Gaussian distribution to determine the sealing performance of a laser surface with a textured mechanical seal [16]. The results showed that both rough micro-elements and micro-dimples could produce hydrodynamic effects. Considering the surface roughness, the opening force of the lubrication film and the friction power consumption increased, and leakage decreased.
Fractal parameter characterization uses fractal parameters with an independent scale instead of statistical parameters to characterize roughness. In 1991, Majumdar and Bhushan proposed an M-B contact model based on fractal geometry [17]. In 1998, Yan and Komvopoulos used a modified W-M bivariate function to characterize three-dimensional fractal surface topographies and studied the effects of the surface topography parameters and material properties on the total deformation force [18]. Based on the M-B contact model, Morag and Estion proposed an M-E model to overcome the shortcomings of the M-B contact model [19]. Based on a thermal-elasto-hydrodynamic mixed lubrication model, Wen et al. observed that the sealing clearance, pressure distribution, friction torque, and leakage of mechanical seals that are in contact with each other are closely related to the surface roughness [20]. In 2014, Miao and Huang expended and modified the M-B contact model into a model that was able to fit the complete fractal surface [21]. Yu and Chen built an elastic–plastic contact surface asperities model based on the Kogut–Etsion model to investigate the elastic–plastic contact that takes place between fractal rough surfaces [22]. Based on fractal theory, Li et al. proposed a leakage model of contact mechanical seal considering wear and thermal deformation [23].
The use of regular rough micro-elements to replace actual roughness is called deterministic rough element characterization. Based on the deterministic rough micro element characterization method, Meng et al. verified the feasibility of leakage control by machining oval, rhombic, triangular, and rectangular pits on the sealing face and analyzed the influence of the geometric parameters on the leakage and carrying capacity [24]. Xie et al. studied the effect of surface roughness on the performance of an end-face microporous textured mechanical seal by establishing an isotropic surface roughness pattern [25]. Ayadi et al. used simple micro-convex bodies as rough elements to conduct experimental and numerical studies on mechanical seals with different lubrication states. The results showed that roughness can cause hydrodynamic effects, thus improving the lubrication performance [26]. Blasiak and Zahorulko studied the effects of surface textures such as dry gas seal micro-channels, compartments, and micropores on the dynamic properties of a medium layer [27]. Wang et al. studied the orientation effect of an orderly roughness microstructure on a spiral groove dry gas seal and observed that orderly roughness microstructures can increase the opening force and maintain a reasonable leakage rate [28]. Recently, there were also many applications of the deterministic rough micro element characterization method. Liao et al. simulated and calculated the leakage of an aviation seal by establishing an aviation seal with isosceles triangle-shaped holes on the sealing face [29]. Han et al. used a linearization method to link the effects of surface morphology across disparate scales. The results showed that the existence of surface morphology can improve the sealing performance [30].
In this paper, deterministic rough micro-element characterization was used on a shallow spiral groove liquid mechanical seal to explore the effects of surface roughness on the performance of hydrodynamic mechanical seals. Based on the mixed flow model and the Zwart–Gerber–Belamri cavitation model combined with a rough surface reflecting the actual machining roughness, a three-dimensional flow calculation model of a seal micro-gap lubrication film was established. The effect of groove zone roughness, non-groove zone roughness, the roughness of the end face of the stationary ring, and the full-face roughness on the opening force, leakage, and friction torque of the seal have been studied. The results are closer to the real state than the case that does not consider surface roughness, which provides a reference for the study of sealing lubrication film flow characteristics and performance optimization and provides a reference for solving the problem of micro-scale flow rough boundaries.

2. Geometric and Mathematic Models

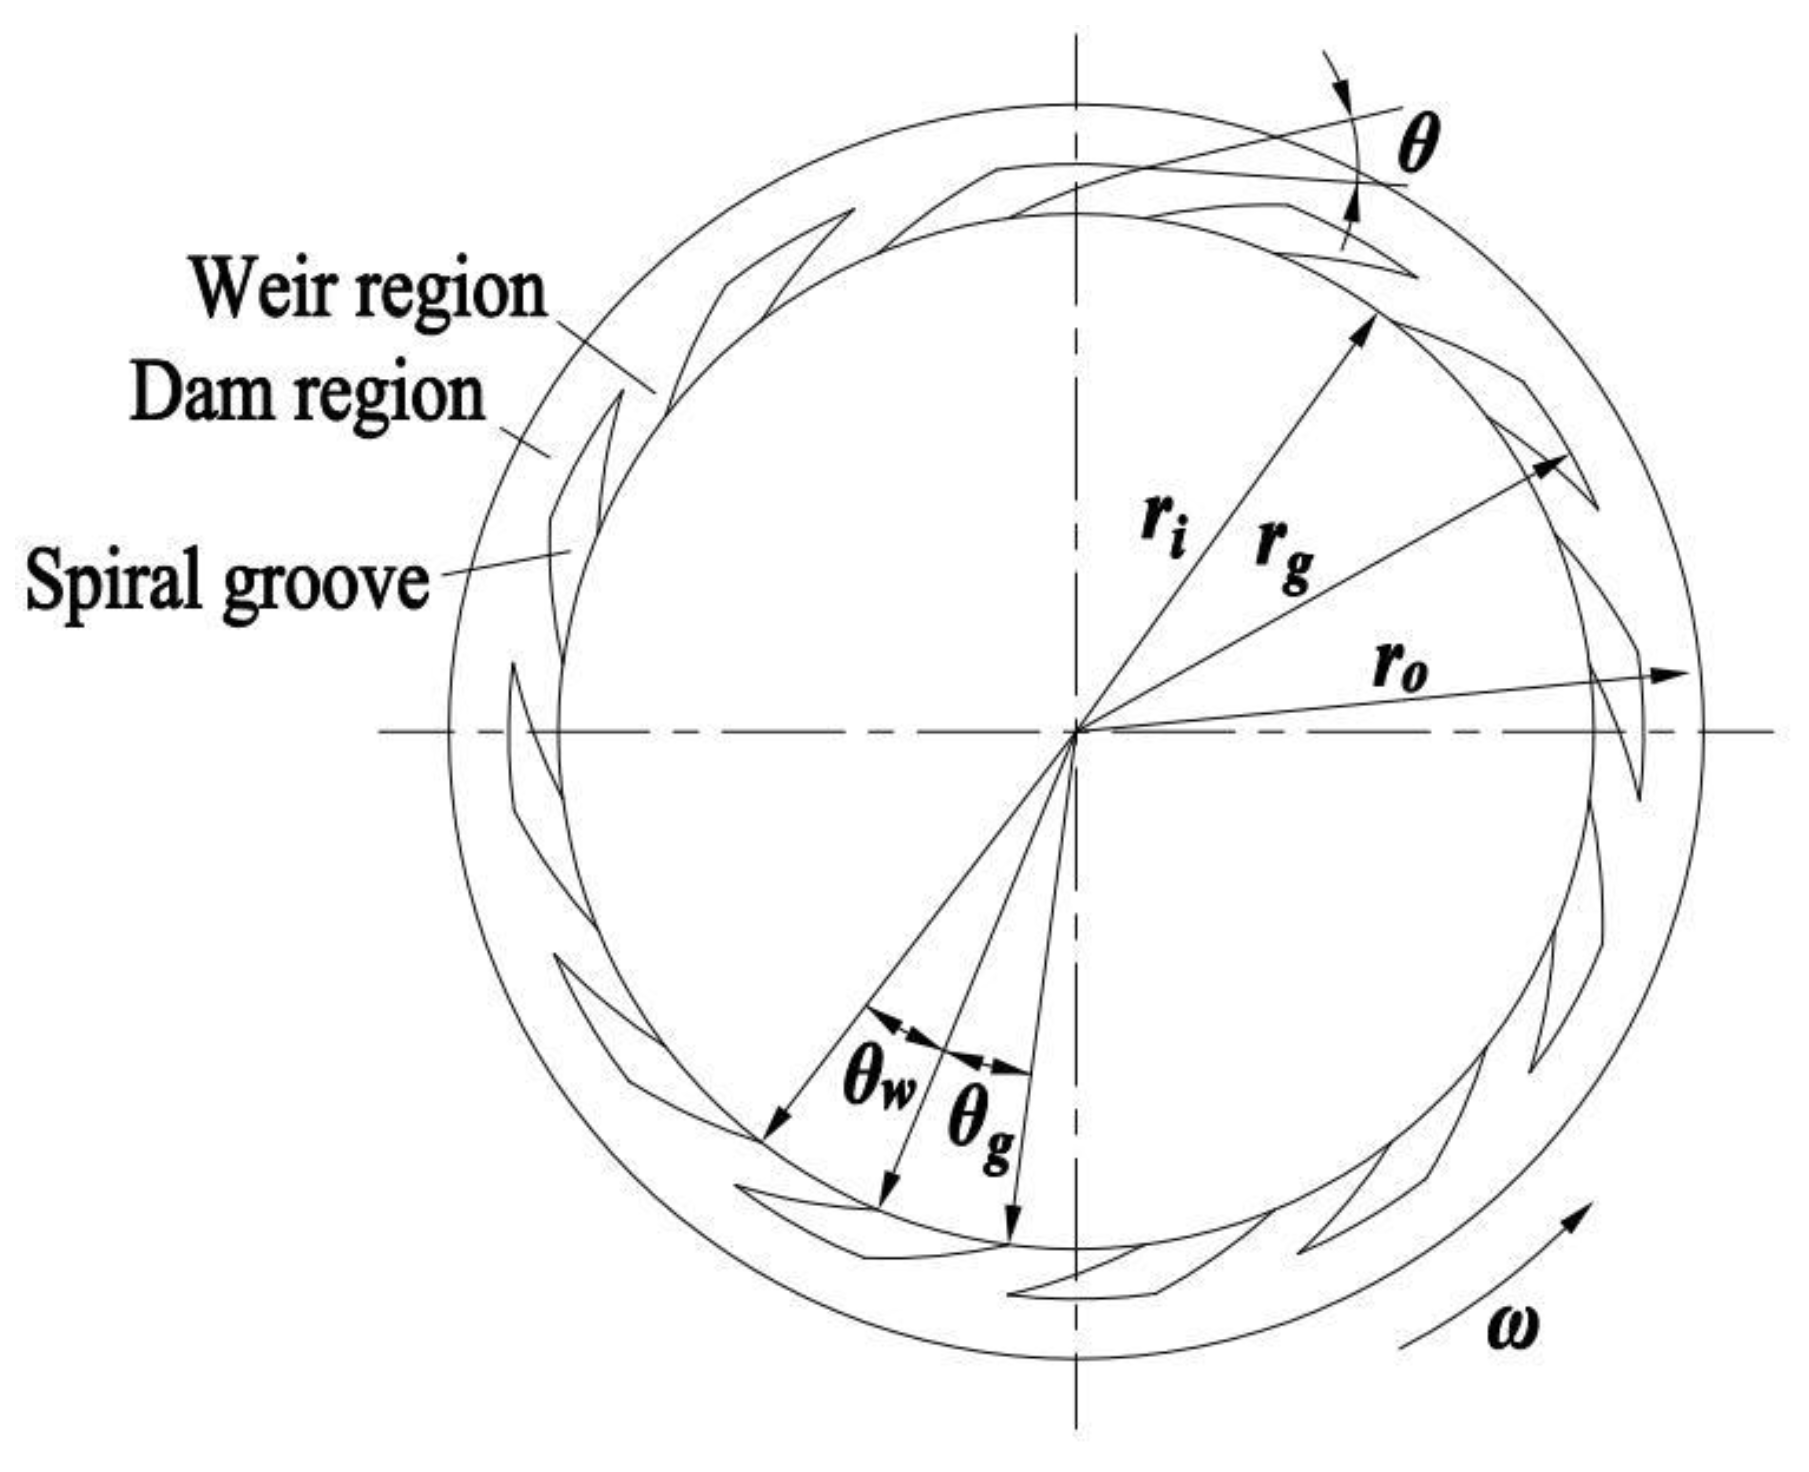
2.1. Geometric Model

A geometric model of the surface structure of a spiral groove is shown in Figure 1, where ri, ro, and rg represent the inner radius, outer radius, and spiral groove outer root radius, respectively. The variables θg and θw represent the circumferential width of the groove and weir at the inner radius, respectively. The groove shape is a logarithmic spiral with a spiral angle of θ. The relationship in polar coordinates is
r = r i e ϕ tan θ
where ri and Φ are the two coordinates of the groove line points.
Considering sealing performance, geometrical parameters were selected and are shown in Table 1. Room-temperature pure water was used as the sealing medium. The stationary ring was fabricated from carbon graphite with a rotating ring created from silicon carbide. Ng and hc denote the number of grooves on the face and the depth, respectively. All of the grooves were distributed on the surface of the rotating ring. Therefore, the 1/Ng of the lubrication film was selected as the research domain, and its periodic boundary condition was
ϕ ( θ + 2 π / N g ) = ϕ ( θ )
Because the roughness of the seal surface is related to the sealing ring material, processing method, and technological level, the relevant standards also have different provisions on the allowable range of roughness for different parts. To facilitate the study and to make it more practical, referring to the relevant literature [31], the standard deviations of the roughness of the grooved zone of the rotating ring, the non-grooved zone of the rotating ring, and the end face of the stationary ring, denoted as σ1, σ2, and σ3, were selected as 0.2–1.4 μm, 0.03–0.18 μm, and 0.08–0.38 μm, respectively.
Due to the randomness and complexity of the surface roughness topography, calculating the flow field in the lubrication film is extremely difficult. Therefore, this study adopted a regular rough surface to approximately represent a random rough surface. Subsequently, a three-dimensional flow calculation model of the micro-gap lubrication film based on the rough surface was established. Considering that the spiral groove is formed by laser processing in the spiral direction, the rough micro-elements are staggered along the spiral direction. A simulation of the surface roughness of the grooved zone was used as an example. As shown in Figure 2, in this study, the width and length of the groove were not significantly different. To characterize the surface roughness, N spiral lines on the grooved side and N arc lines on the inner diameter side were divided along the directions of the groove width and length, respectively. The spiral line on the grooved side and the inner diameter of the grooved-side arc line divided the grooved bottom into a surface with N × N rough micro-elements. The standard deviation of the actual roughness was characterized by the height of the regular rough elements. Similarly, the rough surface of the non-grooved zone of the rotating ring and the surface of the stationary ring could be obtained.
Due to the large-scale differences between the lubrication film in the axial and radial directions, the grid division method was conducted as follows: First, the ribbon spiral groove surface was obtained using Pro/E software, and then, the surface with spiral grooves and rough elements was defined using ICEM software. Finally, ICEM’s surface grid stretching function was used to stretch the gap lubrication film, groove lubrication film, and rough micro-element lubrication film by three, four, and three layers, respectively.

2.2. Mathematical Model

Considering the accuracy and efficiency of the simulation calculations, some basic assumptions were made according to the characteristics of the sealing micro-gap lubrication film:
  • The micro-gap lubrication film has a laminar flow pattern.
  • The deformation of the seal ring and the gravity of the lubricating film medium are ignored.
  • There is no relative slip between the lubricating medium and the seal surface.
  • Changes of the viscosity and temperature of the medium in the lubrication film are ignored.
For cavitation in the sealing micro-gap lubrication film, the two-phase boundary could not be clearly defined. Therefore, the following mixture model was used to describe the flow:
Mixed continuity equation:
ρ m t + x i ( ρ m v m i ) = 0
where ρm is the density of the mixture, and vm is the average velocity of the mixture mass.
Mixed momentum equation:
t ( ρ m v m i ) + v m i ( ρ m v m j ) x j = p x i + μ m x j ( v m i x j + v m j x i )
where μm is the mixing viscosity coefficient and is written as
μ m = n = 1 2 α n μ n
Mass transport equations for liquid and vapor phases:
t ( α v ρ v ) + · ( α v ρ v v v ) = R e R c
where Re and Rc are the source terms of the evaporative and condensed phases in the cavitation process, respectively, and the specific calculation formulas are as follows: When the liquid phase medium temperature Tl > Tsat:
R e = C c o e f f α l ρ l ( T l T s a t ) T s a t
When the vapor phase medium temperature Tv < Tsat:
R c = C c o e f f α v ρ v ( T s a t T v ) T s a t
where the subscript l represents the liquid phase, and v represents the vapor phase, and Ccoeff represents the evaporation condensation coefficient, which is calculated according to Equation (9), where Tsat is the local saturated vaporization temperature.
C c o e f f = 6 d b ζ M 2 π R T s a t L ( α v ρ v ρ l ρ v )
where db is the diameter of the bubble, ζ is the fitness coefficient, M is the molar mass, L is the latent heat, and R is the general gas constant.
The performance parameters for the dynamic pressure mechanical seal involved in this paper include opening force F, leakage rate Q, and friction torque M, and the specific meaning and calculation expression are as follows:
Opening force refers to the sum of the static pressure of the fluid film in the sealing gap. In numerical simulation calculations, it is obtained by integrating the pressure of the sealing end face, and the expression is
F = p d A f
where Af is the contact area of the sealing surface, and P is the static pressure of the liquid film.
The leakage rate refers to the net fluid mass flowing out of the low-pressure side of the seal per unit time, and the calculation formula is
Q = ρ v j d A
where ρ is the density of the medium, vj is the radial velocity, and A is the area of the leakage section.
The friction torque is a measure of the friction state between the sealing faces. The formula is as follows:
M = F f r m
F f = τ d A s
where rm is the average radius of the sealing surface, τ is the shear force of the fluid, and As is the area of the sealing face.
In this study, the Zwart–Gerber–Belamri cavitation model [32] was adopted in Fluent, and the boundary conditions of the calculated domain are shown in Figure 3. A double-precision model was created using the SIMPLEC algorithm. The PRESTO! format was used for pressure discretization. The second-order upwind difference format and Quick format were adopted for the momentum and volume fraction, respectively.

2.3. Number of Rough Micro-Elements and Validation of Grid Independence

Considering the workload and reliability of the calculation, it was necessary to determine the appropriate size of the rough micro-element under the parameter value of the sealing surface. Without loss of generality, the standard deviation of the surface roughness of the grooved zone was set as 0.8 μm. When the medium pressure was 0.3 MPa and the rotating speed was 5000 rpm, the opening force (F) and leakage (Q) of the lubricating film with the number of dividing lines N were obtained through the simulation calculation. The calculation results are shown in Figure 4 and show that, when N reached more than 100, the values of F and Q only changed slightly. Therefore, N = 100 was used to simulate the grooved zone. Based on the size of the surface, N = 200 was used to simulate the stationary ring surface and non-grooved zone of the rotating ring.
Considering the number of grids, this study tested the independence of the grid divisions in the grooved zone, non-grooved zone, and stationary ring surface. Figure 5a,b shows the calculation results of the opening force and the changes in the leakage with the size of grids when σ1 was 0.2, 0.8, and 1.4 μm. As Figure 5a,b shows, when the grid size of the grooved zone was 0.03 mm, the effect of the grid size on the opening force and leakage of the lubrication film was negligible. Considering the calculations for accuracy and time, when the rotating ring’s grooved zone was rough, the grid size of the selected surface was 0.03 mm.
Second, for the non-grooved zone, due to the standard deviation range of the roughness in this region and based on the calculation results of the grooved zone, the standard deviation in the surface roughness was more sensitive to the size of the grid. Therefore, the large standard deviation in the surface roughness of the non-grooved zone was selected for grid-independent verification. Figure 6a,b shows the calculation results of the opening force and leakage with the size of grids when σ2 was 0.18 μm. As these figures show, when the grid size of the grooved zone was 0.025 mm, the change in the opening force and leakage based on the grid size was minimal. Therefore, when the non-grooved zone of the rotating ring was rough, the grid size of the selected surface was 0.025 mm.
In addition, for the surface of the stationary ring, a roughness standard deviation of σ3 = 0.28 μm was selected for independent grid verification. As Figure 7a,b shows, similar to the surface of the non-grooved zone of the rotating ring, when the grid size of the grooved zone was 0.025 mm, the changes in the opening force and the leakage with the grid size were minimal. Therefore, when the surface of the stationary surface was rough, the grid size of the selected surface was 0.025 mm.

3. Model Validation

Figure 8 shows a comparison of the model’s calculation results in this study, and the experimental and simulation results in the literature [33]. The friction power dissipation calculated in this paper is closer to the experimental measurement value and is slightly higher than the numerical calculation results found in the literature. This is because this paper considers the surface roughness in the calculation model. The comparison between the calculation results obtained in this paper and the experimental and calculation results obtained in the literature shows that the model established in this paper can reflect actual scenarios more accurately. The experimental device from the literature is shown in Figure 9.
Friction power dissipation can be calculated using the following formula:
W F = μ A f d v d 2 h + μ A f g v g 2 h + β h c
where μ is the dynamic viscosity of liquid, Afd is the area of the dam region, Afg is the area of the grooved zone, vd is the average linear velocity of the dam region, and vg is the average linear velocity of the grooved zone.
The experimental steps followed in the literature are as follows:
  • Design, process, and measure the slotted mechanical seal ring.
  • Select the seal installation mode.
  • Select a seal ring; install and debug it; control the specific spring pressure; apply different internal pressures and different speed conditions; and measure the pressure, end temperature, friction torque, and leakage rate of the system.
  • Adjust the specific pressure and repeat step 1 until the specified specific pressure series is completed.
  • Remove the sealing ring, select another sealing ring, and repeat step 2 and step 3.
  • Measure the friction torque of the system, except for that of the experimental mechanical seal.

4. Results and Discussion

In order to eliminate the influence of the unit, some of the parameters reflecting the sealing performance are dimensionless. The dimensionless terms and dimensionless performance parameters are defined as follows:
F = F F 0 ,   Q = Q Q 0 ,   M = M M 0  
where F0, Q0, and M0 are the sealing performance parameters when the whole face is smooth, the rotating speed is 1000 rpm, and the medium pressure is 0.6 MPa.

4.1. Effect of the Roughness of the Grooved Zone of the Rotating Ring on the Opening Force

4.1.1. Effect of the Roughness of the Grooved Zone of the Rotating Ring on the Opening Force

Figure 10 shows the effect of roughness on the opening force of the lubrication film when the medium pressure was 0.6 MPa and the rotating speed was from 1000 to 10,000 rpm. Figure 11 shows the film pressure distribution of the grooved zone with different roughness values when the medium pressure was 0.6 MPa and the rotating speed was 1000 and 10,000 rpm. As shown in Figure 10, when the rotating speed was from 1000 to 3000 rpm, the opening force was almost unaffected by the roughness. When the rotating speed was higher than 3000 rpm, the opening force increased as the roughness increased. As shown in Figure 11, when the rotating speed was low, the pumping capacity of the pumping groove was weak, and the pumping flow velocity was low. Because of the weak hydrodynamic effect caused by the rough elements, the film pressure in the grooved zone increased slightly. Meanwhile, due to the increase in the pumping flow resistance, the high-pressure area in the outer grooved root shrunk slightly. The combined effect of the weak pumping capacity and the weak hydrodynamic effect on the opening force was not noticeable. Subsequently, when the rotating speed was higher, the alternating distribution of high and low pressure in the grooved zone was more apparent, indicating that the hydrodynamic effect caused by rough elements was significantly enhanced and had a central function. In addition, the pressure in the grooved zone increased, the low-pressure area shrunk, and the range of the high-pressure area in the outer groove root expanded.

4.1.2. Effect of the Roughness of the Non-Grooved Zone of the Rotating Ring on the Opening Force

Figure 12 shows the effect of the roughness of the non-grooved zone on the opening force when the medium pressure was 0.6 MPa at rotating speeds of 1000 to 10,000 rpm. Figure 13 shows the film pressure distribution of the non-grooved zone with different roughness values when the medium pressure was 0.6 MPa at rotating speeds of 1000 and 10,000 rpm. As shown in Figure 12, with the exception of 1000 rpm, the opening force increased significantly as the roughness increased in the non-grooved zone when the rotating speed was above 3000 rpm. The effect of roughness in the non-grooved zone was greater than that of the roughness in the grooved zone. Combined with Figure 13, the rough elements in the non-grooved zone were in the high-speed flow area of the lubrication film. The hydrodynamic effect caused by the rough element was apparent, which caused the film pressure to exhibit a noticeable alternating high- and low-pressure distribution. Because the area of the non-grooved zone was significantly larger than that of the grooved zone, the number of rough elements was larger. In addition, the roughness of the dam region had an increasing resistance effect on the shear flow. In particular, when the rotating speed was higher, the range of the high-pressure area expanded, and the pressure increased (Figure 13b). Therefore, the roughness of the non-grooved zone had a more prominent effect on the opening force. When the rotating speed was low, the hydrodynamic effect caused by the rough elements and the pumping effect of the pumping groove were both weak, and the roughness of the non-grooved zone had a smaller effect on the opening force.

4.1.3. Effect of end Face Roughness of Stationary Ring on Opening Force

Figure 14 shows the effect of the roughness of the stationary ring surface on the opening force of the lubrication film when the medium pressure was 0.6 MPa at rotating speeds of 1000 to 10,000 rpm. Figure 15 shows the film pressure distribution of the stationary ring surface under different roughness values when the medium pressure was 0.6 MPa at rotating speeds of 1000 and 10,000 rpm. As shown in Figure 14, the opening force increased as the surface roughness increased, and the growth trend exhibited an increasing rate as the rotating speed increased. Figure 15 indicates that, from 1000 to 10,000 rpm, the rough elements on the stationary ring surface produced a hydrodynamic effect, and the roughness area was the largest. Therefore, the high-pressure zone of the lubrication film expanded, and the pressure in the high-pressure zone increased at high rotating speeds. Although the roughness of the stationary ring surface also increased the resistance of the flow in the dam region and expanded the range of the high-pressure area, it also increased the resistance of the shear flow in the grooved zone and shrunk the high-pressure area. Therefore, the increase in the opening force caused by the roughness of the stationary ring surface was weaker than that caused by the roughness of the non-grooved zone of the rotating ring.
In order to clearly reflect the influence of the roughness of each part on the opening force, the sensitivity SF of the opening force to the change in the roughness is defined, and the expression is as follows:
S F = Δ F Δ σ
where Δσ is the variation in the standard deviation of the roughness, and ΔF is the change of opening force corresponding to the change in the standard deviation of the roughness.
The relationship between the SF of the different parts and the rotating speed is shown in Figure 16. It can be seen from the figure that within the range of working condition parameters and roughness standard deviations studied, the SF of different parts increases as the rotating speed increases. The SF of the non-grooved zone shows the most significant increase, and the increase in the SF of different parts increases as the rotating speed increases. When the rotating speed reaches 10,000 rpm, the SF values of the opening force on the non-grooved zone, stationary ring surface, and grooved zone are 24.24, 19.11, and 4.08, respectively. It can be seen that changing the roughness of the non-grooved zone and the stationary ring surface can have a greater impact on the opening force. In other words, improving the roughness of the non-grooved area and the end face of the stationary ring can increase the opening force.

4.2. Effect of Surface Roughness on Leakage

4.2.1. Effect of the Roughness of the Grooved Zone of Rotating Ring on Leakage

Figure 17 depicts the effect of the roughness of different parts on the sealing leakage when the medium pressure was 0.6 MPa at rotating speeds of 1000 to 10,000 rpm. As shown in Figure 17a, when the rotating ring in the grooved zone was rough, the leakage still changed from positive to negative as the rotating speed increased. The increase in roughness only resulted in an increase in the negative leakage when the rotating speed was high. As shown in Figure 11, when the rotating speed was low, the flow rate in the grooved zone was low, and the roughness had a slight effect on the film pressure and leakage quantity. When the rotating speed was high, negative leakage occurred as the hydrodynamic effect increased. As the roughness increased, the film pressure increased, and the hydrodynamic effect and negative leakage increased.

4.2.2. Effect of the Roughness of the Non-Grooved Zone of the Rotating Ring on the Leakage

As Figure 17b shows, when the non-grooved zone of the rotating ring was rough, with the exception of the increase in the positive leakage at 1000 rpm, the leakage at other speeds changed from negative at the smooth surface to positive. The higher the speed, the greater the positive leakage. Within the selected range of roughness values, the increase in roughness had a slight effect on the leakage. Combined with Figure 13, the hydrodynamic effect and the increase in flow resistance caused by the rough elements in the non-grooved zone of the rotating ring significantly inhibited the negative leakage flow in the dam region and increased the pressure difference. Therefore, the positive leakage increased when the rotating speed was low, while the negative leakage was suppressed and transformed into a larger amount of positive leakage when the rotating speed was high due to the significant enhancement of the high-pressure area. As the roughness increased, the above effects were enhanced, but the effect on the leakage quantity was not significant.

4.2.3. Effect of the Roughness of the Stationary Ring Surface on the Leakage

As shown in Figure 17c, when the stationary ring surface was rough, both positive and negative leakages decreased, and the leakage continued to decrease as the roughness increased. Combined with Figure 15, as the roughness of the stationary ring surface increased, the hydrodynamic effect and the increase in flow resistance caused by the rough elements increased, and the range of the high-pressure zone of the lubrication film expanded. In addition, the pressure in the high-pressure zone of the lubrication film increased. Although the increase in the pressure difference increased the leakage, the leakage decreased due to the inhibitory effect caused by the roughness of the leakage flow. Due to the inhibitory effect of the roughness of the stationary ring surface on both the positive and negative leakages, the direction of the leakage did not change.
In order to clearly reflect the influence of the roughness of each part on the leakage, the sensitivity SQ of the leakage to the change in the roughness is defined and is expressed as follows:
S Q = Δ Q Δ σ
where ΔQ is the change in the leakage corresponding to the change in the standard deviation of the roughness.
The relationship between the SQ of different parts and the rotating speed is shown in Figure 18. The SQ is calculated from the absolute leakage value. When SQ is positive, it means that the leakage has increased, and when the SQ is negative, it means that the leakage has decreased. It can be seen from Figure 18 that within the range of the working condition parameters and roughness standard deviations studied, the SQ of different parts increases was the rotating speed increases. The SQ of the surface of the stationary ring is negative, and the absolute value showed the most significant increase. The change in the SQ range in the grooved zone is small. The SQ of the non-grooved zone changes from negative to positive with a small increase. It can be seen that from the perspective of reducing leakage, the change in the roughness of the stationary ring surface is more noteworthy; that is, leakage can be reduced when the stationary ring has a higher roughness value. When the rotating speed is higher than 5000 rpm, it is advantageous to reduce the roughness of the rotating ring’s surface, especially the roughness in the non-grooved zone. When the rotating speed is below 5000 rpm, it is advantageous to improve the roughness of the rotating’s ring surface, especially the roughness in the non-grooved zone.

4.3. Effect of Surface Roughness on Friction Torque

Figure 19 depicts the effect of the roughness of different parts on the friction torque when the medium pressure was 0.6 MPa at rotating speeds of 1000 to 10,000 rpm. Figure 19a shows that the friction torque increased as the roughness of the grooved zone increased, and the effect of the roughness increased as the rotating speed increased. When the rotating speed was low, the effect of the roughness was minimal. Figure 19b shows that when the non-grooved zone of the rotating ring was rough, the roughness had a slight effect on the friction torque at a low speed. When the rotating speed was high, the friction torque only increased significantly in the roughness transition area in the non-grooved zone and was slightly affected by the increase in the roughness. Figure 19c shows that when the stationary ring surface was rough in general, the friction torque increased slightly as the roughness increased. The effect of the roughness decreased as the rotating speed decreased. In summary, the effect of the roughness in different parts on the friction torque of the end faces was similar. For the friction torque, the existence of surface roughness primarily increases the gap flow resistance, and the flow resistance is proportional to the value of the flow velocity. In addition, for micro-gaps, the existence of surface roughness is equivalent to changing the flowing room of the gap, which affects the flow velocity gradient in the lubrication film. Therefore, the greater the rotating speed and roughness, the more significant the effect on the friction torque will be.

4.4. Performance Comparison between Full-Face Roughness and Partial Roughness

Figure 20 shows the performance comparison between instances where the whole face was rough versus when it was only rough in some areas when the medium pressure was 0.6 MPa, and the rotating speed ranged from 1000 rpm to 10,000 rpm. This research takes the median roughness of each part to represent the roughness. Compared to the other conditions, the opening force increases the most when the whole face is rough, and the difference in the opening force increases as the rotating speed increases. This means that the hydrodynamic effect produced by the roughness of different parts results in a superposition effect. The maximum positive leakage occurs when the whole face is rough, and it increases as the rotating speed increases. The main reason for this phenomenon is that the increase in the film pressure leads to an increase in the pressure difference between the high-pressure areas and the high-pressure side of the lubrication film. The friction torque is slightly higher when the whole face is rough, but the difference is only obvious when the rotating speed is higher. This is mainly because when the two end faces of the relative movement are rough, the flow gap is contracted, and the internal friction of the fluid increases.

5. Conclusions

In this study, the effect of surface roughness on the performance of a shallow spiral groove liquid mechanical seal was investigated using a calculation model of the micro-gap flow and surface roughness. The following conclusions were drawn:
  • The roughness of the sealing surface causes the lubrication film to produce a hydrodynamic effect. The effect increases as the rotating speed increases. The opening force of the lubrication film increases as the roughness increases, and the growth trend exhibits an increasing rate as the rotating speed increases. The roughness of the rotating ring’s grooved zone is primarily used to increase the film pressure in the grooved zone through the hydrodynamic effect. The effect on the opening force is weak. In terms of the roughness of the non-grooved zone of the rotating ring, the hydrodynamic effect and increased flow resistance of the dam region expand the range and increase the pressure in the high-pressure areas. The effect on the increase in the opening force is the greatest. The roughness of the stationary ring surface produces a hydrodynamic effect, increases the flow resistance of the dam region, and increases the flow resistance of the pumping flow. The effect on the increase in the opening force is second to the effect of the roughness of the non-grooved zone of the rotating ring. Considering the sensitivity of different parts to roughness, improving the roughness of the non-grooved area and the end face of the stationary ring can increase the opening force.
  • Increasing the roughness of the grooved zone of the rotating ring only results in an increase in negative leakage when the speed is high. When the non-grooved zone of the rotating ring is rough, it can inhibit the negative leakage flow and cause the negative leakage to become positive. The positive leakage increases as the rotating speed increases. However, increasing the roughness has a weak effect on leakage. When the stationary ring surface is rough, both the positive and negative leakages decrease, and the leakage decreases as the roughness increases.
  • The friction torque primarily increases when the rotating speed is high. It increases as the surface roughness of the stationary ring and the roughness of the grooved zone of the rotating ring increase, but the increase in the surface roughness of the non-grooved zone of the rotating ring has a slight effect on the friction torque.
  • Compared to the other conditions, the opening force increases the most, the positive leakage is the largest, and the friction torque increases slightly when the whole face is rough, and all of them increase was the rotating speed increases. Compared to smooth surfaces, when the rotating speed is 1000 rpm~10,000 rpm and considering the median value of conventional roughness, the roughness of the non-grooved area and end face of rotating ring increase the opening force by 2.40~57.94% and 3.55~69.33%, respectively.

Author Contributions

H.C.: conceptualization, obtaining research funding, and editing; Y.C. and T.H.: software, data analysis, and writing—original draft preparation; Y.F.: conceptualization and writing—review and editing; Q.C. and Z.W.: investigation and validation; B.Z.: conceptualization and writing—review and editing. All authors have read and agreed to the published version of the manuscript.

Funding

This research was funded by the National Natural Science Foundation of China (Grant No.51976078).

Institutional Review Board Statement

Not applicable.

Informed Consent Statement

Not applicable.

Data Availability Statement

Not applicable.

Conflicts of Interest

The authors declare no conflict of interest.

References

  1. Cao, W.; Mao, J. Study of the affinity law of energy and cavitation characteristics in emergency drainage pumps at different rotating speeds. Processes 2019, 7, 932. [Google Scholar] [CrossRef] [Green Version]
  2. Li, F.; Cui, B.; Zhai, L. Research on rotordynamic characteristics of pump annular seals based on a new transient CFD method. Processes 2020, 8, 227. [Google Scholar] [CrossRef] [Green Version]
  3. Lebeck, A.O. Experiments and modeling of zero leakage backward pumping mechanical face seals. Tribol. Trans. 2008, 51, 389–395. [Google Scholar] [CrossRef]
  4. Salant, R.T.; Homiller, S.T. Stiffness and leakage in spiral groove upstream pumping mechanical seals. Tribol. Trans. 1992, 36, 55–60. [Google Scholar] [CrossRef]
  5. Jiang, J.; Peng, X.; Li, J.; Chen, Y. Leakage and stiffness characteristics of bionic cluster spiral groove dry gas seal. Chin. J. Mech. Eng. 2018, 31, 148–158. [Google Scholar] [CrossRef] [Green Version]
  6. Sun, J.; Ma, C.; Yu, Q.; Lu, J.; Zhou, M.; Zhou, P. Numerical analysis on a new pump-out hydrodynamics mechanical seal. Tribol. Int. 2017, 106, 62–70. [Google Scholar]
  7. Rouillon, M.; Brunetière, N. Spiral groove face seal behavior and performance in liquid lubricated applications. Tribol. Trans. 2018, 61, 1048–1056. [Google Scholar] [CrossRef]
  8. Du, Q.; Zhang, D. Research on the performance of supercritical CO2 dry gas seal with different deep spiral groove. J. Therm. Sci. 2019, 28, 547–558. [Google Scholar] [CrossRef]
  9. Matsuzaki, Y.; Kazamaki, T. Effect of surface roughness on compressive stress of static seals. JSME Int. J. Ser. 3 Vib. Control. Eng. Eng. Ind. 1988, 31, 99–106. [Google Scholar] [CrossRef]
  10. Matsuzaki, Y.; Hosokawa, K.; Funabashi, K. Effect of surface roughness on contact pressure of static seals: Sealing characteristics of knife-edge seals. JSME Int. J. Ser. 3 Vib. Control. Eng. Eng. Ind. 1992, 35, 470–476. [Google Scholar] [CrossRef] [Green Version]
  11. Arghavani, J.; Derenne, M.; Marchand, L. Effect of surface characteristics on compressive stress and leakage rate in gasketed flanged joints. Int. J. Adv. Manuf. Technol. 2003, 21, 713732. [Google Scholar] [CrossRef]
  12. Minet, C.; Brunetière, N.; Tournerie, B. A deterministic mixed lubrication model for mechanical seals. J. Tribol. 2011, 133, 042203. [Google Scholar] [CrossRef]
  13. Minet, C.; Brunetière, N.; Tournerie, B. On the lubrication of mechanical seals with rough surfaces: A parametric study. IMechE Part J J. Eng. Tribol. 2012, 226, 1109–1126. [Google Scholar] [CrossRef]
  14. Hu, S.; Huang, W.; Brunetière, N.; Song, Z.; Liu, X.; Wang, Y. Stratified effect of continuous bi-Gaussian rough surface on lubrication and asperity contact. Tribol. Int. 2016, 104, 328–341. [Google Scholar] [CrossRef]
  15. Chen, W.; Meng, X.; Wang, Y.; Liang, Y.; Peng, X. Finite element model and tribological properties analysis of textured mechanical seals considering roughness effect. Tribology 2019, 39, 523–531. [Google Scholar]
  16. Chen, H.; Zhang, P.; Sun, D. Effect of surface roughness on properties of liquid film lubricated hydrodynamic mechanical seal. J. Drain. Irrig. Mach. Eng. 2020, 38, 176–182. [Google Scholar]
  17. Majumdar, A.; Bhushan, B. Fractal model of elastic-plastic contact between rough surfaces. ASME. J. Tribol. 1991, 113, 1–11. [Google Scholar] [CrossRef]
  18. Yan, W.; Komvopoulos, K. Contact analysis of elastic-plastic fractal surfaces. J. Appl. Phys. 1998, 84, 3617–3624. [Google Scholar] [CrossRef]
  19. Morag, Y.; Etsion, I. Resolving the contradiction of asperities plastic to elastic mode transition in current contact models of fractal rough surfaces. Wear 2007, 262, 624–629. [Google Scholar] [CrossRef]
  20. Wen, Q.; Liu, Y.; Huang, W.; Suo, S.; Wang, Y. The effect of surface roughness on thermal-elasto-hydrodynamic model of contact mechanical seals. Sci. China (Phys. Mech. Astron.) 2013, 56, 1920–1929. [Google Scholar] [CrossRef]
  21. Miao, X.; Huang, X. A complete contact model of a fractal rough surface. Wear 2014, 309, 145–151. [Google Scholar] [CrossRef]
  22. Yu, R.; Chen, W. Fractal modeling of elastic-plastic contact between three-dimensional rough surfaces. Ind. Lubr. Tribol. 2018, 70, 290–300. [Google Scholar] [CrossRef]
  23. Li, X.; Yang, Z.; Xu, J.; Chen, R.; Yang, H. The fractal leakage model of contact mechanical seals considering wear and thermal deformation. J. Braz. Soc. Mech. Sci. 2019, 41, 521. [Google Scholar] [CrossRef]
  24. Meng, X.; Bai, S.; Peng, X. Lubrication film flow control by oriented dimples for liquid lubricated mechanical seals. Tribol. Int. 2014, 77, 132–141. [Google Scholar] [CrossRef]
  25. Xie, Y.; Li, Y.; Suo, S.; Liu, X.; Li, J.; Wang, Y. A mass-conservative average flow model based on finite element method for complex textured surfaces. Sci. China Phys. Mech. 2013, 56, 1909–1919. [Google Scholar] [CrossRef]
  26. Ayadi, K.; Brunetière, N.; Tournerie, B.; Maoui, A. Experimental and numerical study of the lubrication regimes of a liquid mechanical seal. Tribol. Int. 2015, 92, 96–108. [Google Scholar] [CrossRef]
  27. Blasiak, S.; Zahorulko, A.V. A parametric and dynamic analysis of non-contacting gas face seals with modified surfaces. Tribol. Int. 2016, 94, 126–137. [Google Scholar] [CrossRef]
  28. Wang, Y.; Sun, J.; Hu, Q.; Wang, D.; Zhang, X. Orientation effect of orderly roughness microstructure on spiral groove dry gas seal. Tribol. Int. 2018, 126, 97–105. [Google Scholar]
  29. Liao, B.; Sun, B.; Li, Y.; Yan, M.; Ren, Y.; Feng, Q.; Yang, D.; Zhou, K. Sealing reliability modeling of aviation seal based on interval uncertainty method and multidimensional response surface. Chin. J. Aeronaut. 2019, 32, 2188–2198. [Google Scholar] [CrossRef]
  30. Han, Y.; Meng, Q.; de Boer, G. Two-scale homogenization of hydrodynamic lubrication in a mechanical seal with isotropic roughness based on the Elrod cavitation algorithm. Proc. Inst. Mech. Eng. J-J. Eng. 2022, 236, 359–385. [Google Scholar] [CrossRef]
  31. Peng, X.; Li, J.; Sheng, S.; Yin, X.; Bai, S. Effects of surface roughness on performance prediction and geometric optimization of a spiral groove face seal. Tribology 2007, 6, 567–572. [Google Scholar]
  32. Chen, H.; Wu, Q.; Xu, C.; Zuo, M. Research on cavitation regions of upstream pumping mechanical seal based on dynamic mesh technique. Adv. Mech. Eng. 2014, 6, 821058. [Google Scholar] [CrossRef] [Green Version]
  33. Song, P. Study on the Characteristics of Liquid Film between Faces of Spiral Groove Hydrodynamic Mechanical Seal; Sichuan University: Chengdu, China, 1999. [Google Scholar]
Figure 1. End-face structure of the spiral groove figure.
Processes 10 00651 g001
Figure 2. Rough micro-element and rough surface simulation diagram.
Processes 10 00651 g002
Figure 3. Boundary conditions of the lubricating film calculation domain.
Processes 10 00651 g003
Figure 4. Effect of the number of circumferential and radial divisions (N) on the sealing performance: (a) Effect on opening force, (b) effect on leakage rate.
Processes 10 00651 g004
Figure 5. Changes in the sealing performance with the grid size considering the roughness of the grooved zone of the rotating ring: (a) Changes in the opening force, (b) changes in the leakage rate.
Processes 10 00651 g005
Figure 6. Changes in the sealing performance with the grid size considering the roughness of the non-grooved zone of the rotating ring: (a) Changes in the opening force, (b) changes in the leakage rate.
Processes 10 00651 g006
Figure 7. Changes in the sealing performance with the grid size considering the roughness of the stationary ring: (a) Changes in the opening force, (b) changes in the leakage rate.
Processes 10 00651 g007
Figure 8. Comparison of the simulation results determining friction power dissipation.
Processes 10 00651 g008
Figure 9. Experimental device from the literature [33].
Processes 10 00651 g009
Figure 10. Effect of roughness of the grooved zone of the rotating ring on the opening force of the lubrication film.
Processes 10 00651 g010
Figure 11. Pressure distribution under different roughness values in the grooved zone of the rotating ring: (a) n = 1000 rpm, (b) n = 10,000 rpm.
Processes 10 00651 g011
Figure 12. Effect of roughness of non-grooved zone of rotating ring on opening force of lubrication film.
Processes 10 00651 g012
Figure 13. Pressure distribution under different roughness levels in the non-grooved zone of the rotating ring: (a) n = 1000 rpm, (b) n = 10,000 rpm.
Processes 10 00651 g013
Figure 14. Effect of the roughness of the stationary ring surface on the opening force of the lubrication film.
Processes 10 00651 g014
Figure 15. Pressure distribution under different roughness values of the stationary ring surface: (a) n = 1000 rpm, (b) n = 10,000 rpm.
Processes 10 00651 g015
Figure 16. Relationship between the SF of different parts and the rotating speed.
Processes 10 00651 g016
Figure 17. Effect of the roughness of different parts of the leakage: (a) the grooved zone of the rotating ring was rough, (b) the non-grooved zoned of the rotating ring was rough, (c) the stationary ring surface was rough.
Processes 10 00651 g017
Figure 18. Relationship between SQ of different parts and the rotating speed.
Processes 10 00651 g018
Figure 19. Effect of the roughness of different parts on friction torque: (a) the grooved zone of the rotating ring was rough, (b) the non-grooved zone of the rotating ring was rough, (c) the stationary ring surface was rough.
Processes 10 00651 g019aProcesses 10 00651 g019b
Figure 20. Comparison of sealing performance under different surface roughness conditions: (a) comparison of the opening force, (b) comparison of the leakage rate, (c) comparison of the friction torque.
Processes 10 00651 g020aProcesses 10 00651 g020b
Table 1. Operating conditions for the seal and end face modeling parameters.
Geometrical ParametersValue
Inner radius of lubrication film, ri (mm)25.5
Outer radius of lubrication film, ro (mm)30.5
Spiral groove outer root radius, rg (mm)28.5
Spiral angle, θ (°)20
Groove width ratio, γ0.5
Groove diameter ratio, β0.6
Depth of groove, hc (μm)4
Lubrication film thickness, h (μm)3
Groove number, Ng12
Inlet pressure, Pi (MPa)0.6
Outlet pressure, P0 (MPa)0
Rotating speed, n (rpm)1000~10,000
Publisher’s Note: MDPI stays neutral with regard to jurisdictional claims in published maps and institutional affiliations.

