Article

Model-Based Analysis for Ethylene Carbonate Hydrogenation Operation in Industrial-Type Tubular Reactors

1
State Key Laboratory of Chemical Engineering, School of Chemical Engineering, East China University of Science and Technology, Shanghai 200237, China
2
Key Laboratory of Smart Manufacturing in Energy Chemical Process, Ministry of Education, East China University of Science and Technology, Shanghai 200237, China
3
Key Laboratory for Green Chemical Technology of Ministry of Education, Collaborative Innovation Center of Chemical Science and Engineering, School of Chemical Engineering and Technology, Tianjin University, Tianjin 300072, China
4
Wison Engineering Ltd., 633 Zhongke Rd., Shanghai 201210, China
5
Guangxi Key Laboratory of Petrochemical Resource Processing and Process Intensification Technology, School of Chemistry and Chemical Engineering, Guangxi University, Nanning 530004, China
*
Authors to whom correspondence should be addressed.
Processes 2022, 10(4), 688; https://doi.org/10.3390/pr10040688
Submission received: 21 March 2022 / Revised: 27 March 2022 / Accepted: 28 March 2022 / Published: 31 March 2022

Abstract

:
Hydrogenation of ethylene carbonate (EC) to co-produce methanol (MeOH) and ethylene glycol (EG) offers an atomically economic route for CO2 utilization. Herein, aided with bench and pilot plant data, we established engineering a kinetics model and multiscale reactor models for heterogeneous EC hydrogenation using representative industrial-type reactors. Model-based analysis indicates that single-stage adiabatic reactors, despite a moderate temperature rise of 12 K, suffer from a narrow operational window delimited by EC condensation at lower temperatures and intense secondary EG hydrogenation at higher temperatures. Boiling water cooled multi-tubular reactors feature near-isothermal operation and exhibit better operability, especially under high pressure and low space velocity. Conduction oil-cooled reactors show U-type axial temperature profiles, rendering even wider operational windows regarding coolant temperatures than the water-cooled reactor. The revelation of operational characteristics of EC hydrogenation under industrial conditions will guide further improvement in reactor design and process optimization.

Graphical Abstract

1. Introduction

Efficient chemical conversion and utilization of CO2 is envisioned as an important vector in future carbon-neutral and carbon-negative human society [1,2]. Researchers are in hot pursuit of disposing the energy- and industry-related CO2 emissions by renewable electricity or discarded H2 to produce feedstock or commodity chemicals [3,4,5]. In particular, thermo-/electro- chemical CO2 reduction to oxygenates, for instance, aldehydes, alcohols, and carboxyl acids, exerts great prospects in high-atom-economy CO2-based chemical manufacture by reducing the by-production of H2O [6,7,8,9,10]. Direct hydrogenation of CO2 into methanol (MeOH) has attracted intense research attention in recent years in that MeOH serves as a commodity chemical as well as a crucial platform to various downstream products [11,12,13,14,15]. However, this process is inherently limited by the kinetic inertness and thermodynamic stability of the CO2 molecule, resulting in extremely low per-pass CO2 conversion (~10~20%), and thereby a poor atom economy [16,17,18].
A feasible solution to by-pass the thermodynamic limitation is to “bridge” the low-energy CO2 reactant and the high-energy MeOH product with a CO2-derivable, medium-energy intermediate, such as ethylene carbonate (EC), dimethyl carbonate, methyl formate, and so on [19,20,21,22,23]. Such indirect green methanol production processes are advantageous in milder reaction conditions as well as higher per-pass CO2 conversion (over 95%) and overall methanol yield. Amongst these processes, EC hydrogenation as illustrated in Figure 1 is of great interest:
This process co-produces methanol and ethylene glycol (EG), another value-added bulk chemical, with theoretically 100% atom economy. In addition, EC production using CO2 and ethylene oxide has already been demonstrated [24,25], making the subsequent EC hydrogenation process a promising enabler for industrially relevant green alcohols production.
Development of catalyst systems for EC hydrogenation has gained considerable progress. Since Han et al. [26] first proposed a Ru II PNP catalyst for homogeneous EC hydrogenation, the catalyst system has evolved from homogeneous nobel metal complex [27] to heterogenous supported copper (Cu) based catalysts [28,29,30,31,32,33], in view of difficult separation and recovery of the former and, in contrast, convenient deployment of the latter. As the early-version Cu-based catalysts are inferior to the homogeneous catalysts in performance, continuous efforts are being paid to develop more active and selective candidates suitable for industrial application [34,35,36]. Song et al. [37] prepared MoOx-promoted Cu/SiO2 catalyst, which achieved 89% MeOH yield and 99% EG yield within 150 h time-on-stream at a H2/EC ratio of 20 and a WLHSVEC (weight liquid hourly space velocity of EC) of 0.64 gEC·gcat−1·h−1. Carbon modified Cu catalyst proposed by Chen et al. [38] displayed good activity and stability after using for 264 h, owing to improved dispersion of Cu particles, showing EC conversion of 100%, and EG and MeOH selectivities up to 99.9% and 85.8%, respectively. Appropriate synergy between Cu0 and Cu+ species are believed to play an important role in the activation of H2, providing adsorption sites for the carbonyl groups of EC, and stabilizing the surface acyl and methoxy species, leading to improved EC conversion and alcohol yields [39,40].
Despite the progress in catalyst investigation, to date, the heterogeneous EC hiydrogenation process has not been studied at a pilot scale. Tailoring the transport characteristics of industrial-scale reactors in accordance with the intrinsic reaction kinetics is crucial for commercial operation of catalytic processes [41,42]. In this respect, industrial methanol synthesis serves as a reference given a similar reaction enthalpy change and the employment of similar Cu-based catalysts. Multi-stage adiabatic fixed bed reactors and boiling water-cooled multi-tubular reactors are the most commonly applied types of reactors in methanol synthesis [42]. The design and operation optimization of these reactors has been well aided by model-based analysis accounting for intrinsic reaction kinetics, internal/external mass transfer at the scale of catalyst particles, and heat and mass transfer at the reactor-scale [43]. Recently, Samimi et al. [44] compared water cooled, gas cooled, and doubled cooled reactors for direct CO2 hydrogenation to MeOH by one-dimensional reactor models focusing on the phase stability. The gas cooled reactor exhibits the lowest possibility of methanol condensation and the highest methanol yield. Cui et al. [45] assessed the potentials of adiabatic, water cooled and gas cooled reactors for direct CO2 hydrogenation to MeOH using coupled two-dimensional (2D) computational fluid dynamics (CFD) models for the reactor and single catalyst particles. The water-cooled reactors demonstrate outstanding temperature control at the expense of a higher capital cost. It is apparent that, to promote the process towards commercialization, understanding of the operational behaviors of EC hydrogenation in industrial-type reactors is urgently needed.
Herein, we investigated the operational characteristics of industrial-type adiabatic, water-cooled and oil-cooled tubular reactors for a 3 × 10⁴ t/a EC hydrogenation process by model-based comparative analysis. Two-dimensional (2D) pseudo-homogeneous CFD models were established with engineering kinetic models developed for heterogeneous EC hydrogenation over an industrial Cu-based catalyst, and validated by bench-scale and pilot-scale reaction data. The operation windows of key reactor operating variables, including reactant/coolant inlet temperature, total pressure and space velocity, were delineated for the representative industrial-type reactors, considering both the reactor performance and the EC phase change boundaries. The presented results will pave the way to future industrial design and optimization of reactors and process for the green alcohols production.

2. Methods

2.1. Method Description

Figure 2 illustrates the industrial reactors for ethylene carbonate hydrogenation considered and the modeling scheme used in this study. Two types of industrial reactors are modeled, namely, adiabatic and multi-tubular heat-exchange reactors; for the heat-exchange reactors, two different coolants are considered: boiling water and heat conduction oil (Figure 2a). The adiabatic reactor is 2 m in diameter and 8 m in length, whereas the heat-exchange reactor comprises 1682 tubes of 0.05 m diameter and 8 m length, corresponding to a total capacity of 3 × 10⁴ t/a methanol and ethylene glycol. Key geometric parameters and operating conditions are listed in Table 1. The 2D asymmetrical steady-state multi-scale reactor models are built under the following assumptions:
  • Reactants are fed into the adiabatic reactor through inlet manifolds, which are simplified into a ring.
  • The inlet gas distributor of the heat-exchange multi-tubular reactor ensures uniform distribution of the reactants to all reaction tubes, so that only a single reaction tube is modeled as representative.
  • The wall temperatures of all reaction tubes of the boiling water-cooled reactor are equal to the boiling temperature of pressurized water.
  • The coolant temperature and external heat transfer coefficient are the same for all reaction tubes of the oil-cooled reactor.

2.2. Governing Equations

The fluid computational mass conservation equation in the bed is
( ε b ρ f ) t + · ( ε b ρ f v ) = 0
The momentum Equation (2), the energy Equation (7) and the species transport equation Equation (10) for flow in the catalyst bed are listed below.
Momentum equation:
( ε b ρ f v ) t + · ( ε b ρ f v v ) = ε b p + · ( ε b τ ) + S ϕ
where p is the static pressure and τ is the stress tensor. S ϕ is the momentum source term for fluid flow in porous media,
S ϕ = B f ( ε b 2 μ K v + ε b 3 C 2 2 ρ f | v | v )
representing the viscous and inertial drag forces imposed on the fluid flow by the pore walls within the porous media, in which C 2 is the inertial loss coefficient.
C 2 = 3.5 d p v ( 1 ε b ) ε b 3
The k - ω SST turbulence model is used with the turbulence kinetic energy k and the specific dissipation rate ω obtained from the following equations:
( ρ f k ) t + ( ρ f k u i ) x i = x j ( Γ k k x j ) + G k Y k + S k + G k b
( ρ f ω ) t + ( ρ f ω u i ) x i = x j ( Γ ω ω x j ) + G ω Y ω + S ω + G ω b
Energy equation:
t ( ε b ρ f E f + ( 1 ε b ) ρ s E s ) + · ( v ( ρ f E f + p ) ) = S f h + · [ k e T ( i h i J i ) + ( τ · v ) ]
where E f is total fluid energy and E s is total solid medium energy. The energy source S f h represents the chemical reaction heat.
S f h = j h j 0 M w , j R j
where h j 0 is the enthalpy of formation of species and R j is the volumetric rate of creation of species j . The effective heat conduction of bed k e is computed in Equation (9).
k e = { k e ,   ax = u 0 ρ f c p , f d p v P e h , ax     k e , r = k r 0 k f + k f · P e h 0 P e h , r
Species equation:
t ( ρ f Y i ) + · ( ρ f v Y i ) = · J i + S i
where Y i is mass fraction of each species, and J i is the diffusive flux of species i arising from gradients of species concentration and temperature.
J i = ρ f D e j = 1 N 1 Y j D T , i T T
S i , the net source of species i due to chemical reactions, S i is computed as the sum of the reaction rates:
S i = M w , i r = 1 N R R ^ i , r
where M w , i is the molecular weight of species i and R ^ i , r is the molar rate of creation/destruction of species i in reaction r . In Equation (11), the calculation of thermal diffusion coefficients D T , i adopts the following empirically based expression [46].
D T , i = 2.59 × 10 7 T   0.659 [ M w , i   0.511 X i i = 1 N M w , i   0.511 X i Y i ] · [ i = 1 N M w , i   0.511 X i i = 1 N M w , i   0.489 X i ]
where X i is mole fraction of species i; the effective mass transfer coefficient of bed D e is computed as:
D e = { D e , ax = d p v u 0 P e m , ax   D e , r = d p v u 0 P e m , r

2.3. Bed Voidage and Pressure Drop

When the ratio of tube diameter to the catalyst’s volume-equivalent diameter (denoted by R in the following paper) is less than 10, the wall effect cannot be ignored [47]. In this work, R values for the adiabatic fixed bed (2 m in diameter) and the heat-exchange reactor (single tube 0.05 m in diameter) filled with 5 mm spherical catalyst are 400 and 10, respectively. Therefore, without the wall effect, the bed voidage of the adiabatic reactor is set as constant in the radial direction (Supplementary Materials Table S5). Meanwhile, the fluctuations of bed voidage in the radial direction is considered for the heat-exchange reactors (Table S5) [48,49,50].
The bed pressure drop is computed by the Ergun equation in Equation (15) [51].
| Δ P | L = 150 d p s 2 ( 1 ε b ) 2 μ ε b 3 u 0 + 1.75 ρ f d p s ( 1 ε b ) ε b 3 u 0 2

2.4. Heat and Mass Transfer in the Catalyst Bed

The axial effective heat conduction is computed as [52]:
k e , ax = u 0 ρ f c p , f d p v P e h , ax
in which the Peclet number for axial heat conduction P e h , ax equals 2.
The radial effective heat conduction is computed by:
k e , r = k r 0 k f + k f · P e h 0 P e h , r
in which the molecular Peclet number P e h 0 is [53]:
P e h 0 = R e P r = u 0 ρ f c p , f d p v k f
and P e h , r is [54]:
P e h , r = 8 [ 2 ( 1 2 R ) 2 ]
The following expression for the effective thermal stagnant conductivity k r 0 k f is obtained by Equation (20) [55]:
k r 0 k f = ( 1 1 ε b ) + 2 1 ε b 1 B κ 1 × [ B ( 1 κ 1 ) ( 1 B κ 1 ) 2 ln ( κ B ) B 1 1 B κ 1 B + 1 2 ]
where B = C f ( 1 ε b ε b ) 1.11 ; C f = 1.25 (sphere), C f = 2.5 (cylinder).
Under turbulent conditions ( R e > 100 ), axial mixing of mass can be approximated as mixing in a cascade of L / d p ideal mixers [56]. The Peclet number for axial mass dispersion approximately equals 2.
P e m , ax = d p v u 0 D e , ax = 2
The effective radial mass transfer coefficient of bed D e , r is computed as [57]:
P e m , r = d p v u 0 D e , r = C ( 1 + 19.4 R 2 )
where C = 8.65 d p v d p a [58].

2.5. Heat and Mass Transfer of Catalyst Particles

Due to mild exothermicity of the ethylene carbonate hydrogenation reaction, the temperature difference between the catalyst surface and the gas phase is estimated to be less than 1 K in Equation (23). Consequently, the temperature of catalyst surface and the gas phase is taken as identical. The gas–solid heat transfer coefficient α f is calculated as [59]:
Δ T ex = Q reaction α f · S cat
N u = 2 + 1.1 R e 0.6 · P r 1 3
N u = α f d p v k f
For heat transfer inside the catalyst particle, the temperature gradient within the catalyst particle is related to the heat of reaction Q reaction and the effective thermal conductivity of the catalyst particle λ eff , cat (Equation (26)) and can be calculated by Equation (27) [60,61].
Δ T in = D eff , EC · ( C EC , s C EC , center ) · ( Δ r H ) λ e f f , c a t
λ eff , cat = k f ( k s k f ) 1 ε cat
Under the reaction conditions considered in this article, Δ T in is estimated to be less than 1 K. Therefore, the catalyst particle is considered isothermal.
The mass transfer between the catalyst surface and the gas phase is described by a mass transport coefficient k g :
k g · a · ( C EC , gas C EC , s ) = R EC , s
where R EC , s is the effective consumption rate of EC at the particle surface. k g is related to the catalyst shape, the Reynolds number and the Schmidt number, as shown in Equations (29)–(31) [62].
S h = 2 + 0.6 R e 0.5 S c 1 3   ( sphere )
S h = 0.61 R e 0.5 S c 1 3   ( cylinder )
S h = k g d p v D EC , m
The effect of mass transfer inside the catalyst particles, namely, internal mass transfer, is accounted for with the generalized Thiele modulus approach, which is applicable to a broad range of rate equations [63]. The generalized Thiele modulus with respect to EC consumption rate ( ϕ gen , EC ) is expressed as
ϕ gen , EC = V cat S cat k v D eff , EC · n + 1 2 · C EC , s n 1
The effectiveness factor for internal mass transfer is then computed as:
η E C = tanh ( ϕ gen , EC ) ϕ gen , EC
Note that Equations (28)–(31) must be solved simultaneously in an iterative manner because the two sides in Equation (28) are related by the EC concentration at catalyst particle surface, which is unknown in advance.

2.6. Coolant Heat Transfer

For the heat exchange by pressurized boiling water, a large heat transfer coefficient (4000–6000 W·m−2·K−1) and a constant wall temperature ( T w ) are considered:
T w = T b
where T b is the boiling point of pressurized water.
In contrast, the heat conduction oil has a low specific heat capacity, and thus is heated up easily. The oil temperature is therefore considered as a function of the transferred heat. The oil-to-tube heat transfer coefficient is set as a function of the space in between adjacent baffle plates t and the coolant mass flow rate m ˙ oil .
α oil = α ¯ oil ( t , m ˙ oil )
The detailed expressions are given in the Supporting Information. The heat transferred between the oil and the tube wall is
Q oil = α ¯ oil · ( T oil T w ) · S wall
As the oil temperature T oil varies with the axial position, the steady-state coolant temperature profile is determined by iteration. The single reaction tube is divided into 10 segments (each 0.8 m long) in the flow direction with the oil temperature in each segment calculated as
T oil , i + 1 = { T oil , in ,       i = 1 T oil , i + Q oil , i   3600 c p , oil ·   m ˙ oil   ,     0 i 9
when the iteration converges, the oil temperature as a continuous function of the the axial position is calculated by linear interpolation of the above discrete temperatures.
T oil ( x ) = T oil , i 1 + T oil , i T oil , i 1 x i x i 1 · ( x x i 1 ) ,     ( x i 1 < x < x i )

2.7. Chemical Reactions

The global reaction of ethylene carbonate hydrogenation to ethylene glycol and methanol is described by three separate reactions as shown in (R1)–(R3), respectively. This scheme allows for investigation of the effect of operating variables on the reactant conversion and product selectivity. The intrinsic kinetics of these reactions are modeled by power-law equations. The kinetic parameters were fitted to bench-scale experimental data covering a wide range of reaction conditions of T = 175–220 °C, P op = 3.0 MPa, H2/EC = 120–200 and S V = 0.5–2.2 h−1. Details regarding the kinetic equations and parameters are given in the Supporting Information (Section S1).
Processes 10 00688 i001
Since the two EC hydrogenation reactions ((R1) and (R3)) are dependent on the gas phase EC concentration only, their effective reaction rates over the catalyst particle surface are:
r obs = η EC · r chem ( C EC , s , T s )
The EG hydrogenation reaction (R3) is zeroth order; therefore, its effective reaction rate is equal to the intrinsic reaction rate:
  r obs = r chem ( C EG , s , T s )
The performance metrics of the reaction, EC conversion X EC , EG selectivity S EG , MeOH selectivity S MeOH and total alcohols selectivity S Alcohol , are defined by the following definitions:
X EC = m ˙ EC , in m ˙ EC , out m ˙ EC , in
S EG = m ˙ EG , out / M EG ( m ˙ EC , in m ˙ EC , out ) / M EC
S MeOH = m ˙ MeOH , out / M MeOH ( m ˙ EC , in m ˙ EC , out ) / M EC
S Alcohol = S EG + S MeOH 2

2.8. Model Implementation

The multi-scale reactor models were implemented in the FLUENT software. The computational domains were discretized using rectangular meshes refined in the inlet regions and adjacent to the walls. Spatial discretization was conducted by the second-order upwind differencing scheme. The pressure–velocity coupling was performed with the SIMPLEC algorithm. User defined function (UDF) of FLUENT was used to couple the heat and mass transport models and chemical kinetics to the reactor-level models. The inlet boundary was set as uniform velocity. The outlet boundary was set as constant pressure (operating pressure) and zero normal gradients of velocity, temperature and species mass fractions. A no-slip, adiabatic or thermally coupled boundary was imposed on the reactor walls depending on the reactor type. Axisymmetric boundaries were imposed on the centerline of the reactor. The convergence criteria were set as all residuals below 10−3. Simulations were performed on PC with Intel i9-9900X processors (Intel Corporation, Santa Clara, CA, USA) and 64 GB RAM (G.skill International Enterprise Co., Ltd., Taipei, China). The typical computation time under each operating condition is between 0.5 and 2 h.

3. Results and Discussion

3.1. Model Validation

Table 2 shows results of the grid independence study using EC conversion as the most sensitive key variable. When the grid size exceeds 10,000, the EC conversions remain unchanged for both adiabatic and heat-exchange reactor models with sphere/cylinder catalysts. Therefore, the following work was carried out with a grid size of 10,000.
To validate the established multi-scale reactor and chemical kinetics model, we compared the model predictions with pilot plant data. The EC hydrogenation pilot reactor was operated at a production capacity of 1000 talcohol/a and had steadily run for over 72 h to allow collection of all reaction products. The structure and working conditions of the pilot reactor are shown in Table 3. Simulations were conducted with the same parameter settings as the pilot reactor, including the reactor geometry, operating conditions and catalyst properties. Figure 3 shows the mass flow rates of the converted EC and the produced EG, MeOH and by-products measured in pilot plant run and those predicted by our model. The model predictions are in quantitative agreement with the pilot plant data with relative errors for both the converted EC and the produced EG < 5%. The amount of produced MeOH is underestimated by ~20%, which is accompanied by an overestimated amount of by-products. The reason is suspected to be incomplete measurement of the volatile MeOH in bench-scale experiments used for deriving the kinetics parameters. Nonetheless, the multi-scale reactor model is reliable in predicting the generic reaction performance of EC hydrogenation in industrial reactors and will be used to explore the operational behaviors of different types of tubular reactors.

3.2. Reactor Profiles

3.2.1. Adiabatic

As the simplest form of fixed bed reactors, adiabatic reactors are often designed with multi-stage feeding in order to control the temperature rise of the catalytic bed by inter-stage cooling. For the EC hydrogenation reaction, however, the adiabatic temperature rise is estimated as only 10~20 K under typical operating conditions because of the high H2/EC ratio, despite a considerable reaction enthalpy change (−87.3 kJ/mol). Therefore, a one-stage adiabatic reactor is considered herein in view of a facile temperature control that could be envisioned.
For the adiabatic reactor loaded with sphere catalysts (5 mm), Figure 4 shows the contours of bed temperature and partial pressures of EC and EG under three different inlet temperatures. The adiabatic reactor exhibits a plug-flow behavior with minimal radial gradients of velocity, temperature and species concentrations. In the axial (flow) direction, a mild adiabatic temperature rise of c.a. 12 K is observed, which is scarcely affected by the variation of inlet temperatures from 443 to 483 K (Figure 4a−c). With the increase of the inlet temperature, the average bed temperature increases, thus accelerating EC transformation as reflected by the decrease of average P EC inside the catalyst bed. Consistently, in the front part of the catalyst bed, P EG , is found to increase with the inlet temperature. P EG near the reactor outlet, however, is lower for higher inlet temperatures as a result of the intensified secondary EG hydrogenation reaction (R3). This side reaction has a high activation energy of 114 kJ/mol (Table S1) and is sensitive to temperature rise than the main reaction (R1). The consumption of EG in the rear part of the catalyst bed is remarkable when the local bed temperature rises to above 473 K (Figure S3), corresponding to inlet temperatures above 463 K. Therefore, maintaining a moderate bed temperature is necessary to maximize the selectivity to desired alcohol products.
Another necessary practical consideration for reactor operation is that EC is a high boiling-point organic liquid with a dew-point temperature of c.a. 450 K under the inlet condition (Figure S2), which overlaps with the range of operating temperatures. If EC liquefies within the catalyst bed, liquid film would cover the catalyst particle, not only blocking the active sites but also causing coking in the longer term. At the inlet temperature of 443 K, EC condensation is predicted to occur in the first c.a. 20% of the catalyst bed from the inlet (marked by a vertical line in Figure 4a) as judged by the local partial pressure of EC. From the condensation boundary downstream to the reactor outlet, EC remains in the gas phase as a consequence of both the increasing temperature profile of the adiabatic reactor and the decreasing EC partial pressure with the reaction proceeding.

3.2.2. Boiling Water Cooling

Boiling water-cooled fixed-bed reactors often adopt a shell-and-tube structure in which multiple parallel reaction tubes are immersed in flowing boiling water in a shell. To enhance heat transfer from the tube to the coolant, a small tube diameter is chosen. Figure 5 shows the contours of bed temperature and partial pressures of EC and EG within a single reaction tube of the boiling-water cooled reactor under three different coolant temperatures. Within the first 10% of the catalyst bed, the bed temperature approaches the coolant temperature with the temperature gradients in the radial direction reducing from 20 K to zero (Figure 5a–c and Figure S7a,c). No exotherm is observed within the entire catalyst bed in the axial direction for the three coolant temperatures. Because of the relatively low heat release from the reaction and the high convective heat transfer coefficient of boiling water, the coolant temperature rather than the reactant inlet temperature is the determining factor for the bed temperature (Figure S6a). When the coolant temperature increases, the average P EC decreases with the accelerated EC hydrogenation reaction. Different from the adiabatic reactor, an upward trend is observed in P EG with an increasing coolant temperature from 423 K to 463 K because EC conversion to EG is promoted whilst the EG hydrogenation side-reaction remains negligible in the temperature range. For the inlet temperature of 463 K, it is remarkable that the boiling water-cooled reactor gives rise to an EG yield ~10% higher than the adiabatic reactor, with only 12 K difference in the bed temperature.
The lower bed temperatures relative to the adiabatic reactor increase the risk of EC condensation. Figure 5a,b illustrate that the condensation zones are more extended in the near-wall region than around the reactor centerline. Due to an oscillatorily increasing bed porosity towards the reactor wall (Table S5), the EC flowrate increase towards the wall (Figures S4 and S5), contributing to higher local partial pressures of EC. Such a behavior is prominent for the multi-tubular heat-exchange reactors with high tube-to-particle diameter ratios and thus considerable channeling flows near the wall.

3.2.3. Conduction Oil Cooling

In the pilot plant reactor, conduction oil is selected as the coolant in consideration of easiness of control and its satisfactory performance of heat removal. The heat transfer coefficients of conduction oils are significantly lower than the boiling water and depend on geometrical and operational parameters such as the oil flow rates, the distance between adjacent baffle plates, the type of baffle, etc. The specific relationships are given in the Supporting Information (Section S3.2). In general, conduction oil is not as effective as boiling water in controlling the reactor temperature, especially under low oil flow rates. Taking 25% open baffle, 1 m distance between adjacent baffle plates and the 200,000 kg·h−1 mass flow rate as the reference case, the resulting heat transfer coefficient is calculated to be 619 W·m−2·K−1. These values will be used in the following study.
Figure 6 shows that the bed temperature drops quickly close to the inlet of the oil-cooled reactor as a consequence of the low inlet temperature of the conduction oil. Then, with the oil being heated up continuously by the exothermic reaction, the bed temperature gradually rises towards the reactor outlet (Figure 6a−c and Figure S7a). The radial temperature gradient in the catalyst bed reduces from 9 K at the inlet to zero after 10% of the catalyst bed. Distinct from that of the boiling water-cooled reactor, the bed temperature of the oil-cooled reactor is also affected by the inlet temperature of reactants: both the increase of reactant inlet temperature and the coolant inlet temperature decrease the EG selectivity (Figure S6b). Different also from both the adiabatic and the boiling water-cooled reactors is that P EG increases slightly with the bed temperature for oil inlet temperatures below 463 K, but decreases slightly with the bed temperature when the oil inlet temperature exceeds 463 K. The outlet flow rates of EG are the highest among the studied reactor types for reactant inlet temperatures between 423 and 463 K thanks to the moderate temperature profile, which balances between promoting EC conversion and preventing secondary EG hydrogenation. Meanwhile, the predicted condensation region of EC is significantly smaller than that of the boiling-water cooled reactor, and the condensation only appears under the lowest coolant temperature of 423 K.

3.3. Effects of Key Operating Variables

To elaborate the reactor’s operation behaviors, the effects of major operation variables on the reactor performance are further depicted. Five operation variables are studied, including the inlet temperature T in , the coolant temperature T c , the operating pressure P op , the space velocity S V , and the inlet H2/EC. The chosen performance metrics are EC conversion X EC , EG selectivity S EG , MeOH selectivity S MeOH and total alcohols selectivity S Alcohol .

3.3.1. Temperature

For all reactor types, Figure 7 shows that X EC and S MeOH increase while S EG and S Alcohol decrease with the increase of inlet temperature. At higher temperatures, the faster reaction results in a greater amount of EC being converted ( X EC rises). Given that the activation energies of Reaction 1, 2 and 3 (R1)–(R3) are 30.1, 28.1 and 113.8 kJ·mol−1, respectively (Table S1), higher temperatures promote hydrogenation of EG to by-products ( S EG decreases) but inhibits EC conversion to CO instead of MeOH ( S MeOH increases). Comparison among different reactor types (Figure 7a–d) show slight differences in the EC conversion. X EC of the adiabatic reactor is higher than that of the other two types of reactor owing to its high average temperature of the catalyst bed. X EC of the boiling water-cooled reactor is the lowest among the three types of reactor, but the difference from that of the oil-cooled reactor diminishes as the coolant temperature is raised above 453 K. Since the reactant inlet temperature also affects the performance of the oil-cooled reactor, Figure 7d additionally illustrates the effect of reactant inlet temperature on X EC , S EG , S MeOH and S Alcohol . The variations in the reactant inlet temperature and the oil temperature exhibit similar influences on the reactor performance.
EC condensation occurs in the boiling water-cooled reactor when the boiling water temperature is 448 K (Figure 7b). This critical temperature is consistent with the reactant inlet temperature leading to condensation in the adiabatic and oil-cooled reactors (Figure 7a,d) because their inlet regions are the most prone to condensation. For the oil-cooled reactor, moderate heat removal by the conduction oil combined with its relatively low heat capacity yields a bed temperature higher than the initial oil temperature. Therefore, condensation with a fixed reactant inlet temperature of 463 K does not occur until the oil temperature is lowered to 428 K (Figure 7c).

3.3.2. H2/EC

In this work, a higher H2/EC means lower EC partial pressures under almost the same H2 partial pressure (the variation in the H2 partial pressure is negligible for H2/EC > 80). As shown in Figure 8a–c, higher H2/EC inhibits EC conversion because the EC consumption reactions (R1 and R2) are positive-order with respect to EC. For the adiabatic reactor, the MeOH selectivity increases slightly with H2/EC (Figure 8a). The reason is that S MeOH is related to parallel reactions R1 and R2, which are 0.65-order and 1-order with respect to EC, respectively. The lower the EC partial pressure, the lower the relative rate of Reaction 1 to Reaction 2, and therefore the higher the MeOH selectivity. The EG selectivity increases more significantly with H2/EC, because enhanced axial convective heat transfer by the gas mixture under high H2/EC alleviates the adiabatic rise of bed temperature, which favors EG selectivity. For the boiling water-cooled reactor, the variation of S MeOH with H2/EC in Figure 8b resembles that for the adiabatic reactor. However, S EG and S Alcohol of the water-cooled reactor only increase by 1% and 3%, respectively, for H2/EC from 80 to 200, because the catalyst bed is close to isothermal. In Figure 8c, almost identical behavior is observed for the oil-cooled reactor as the boiling water-cooled reactor, except that X EC of the latter is slightly higher for H2/EC > 160, and that S EG and S Alcohol of the latter is slightly lower for H2/EC < 120. EC condensation happens when inlet H2/EC is smaller than 120 regardless of the type of the reactor, provided that EC most likely liquefies at the reactor inlet when its partial pressure is the highest.

3.3.3. Pressure and Space Velocity

Pressure and space velocity have a great impact on the catalytic reaction but a minor influence on the transport characteristics. The influence of pressure and space velocity on the reactor performance is exemplified by the case of the boiling water-cooled reactor in view of the consistent behaviors among the different types of reactors. Figure 9a shows that the increase of operating pressures accelerates EC hydrogenation as the partial pressure of EC is increased (R1) and (R3). Meanwhile, since R1 and R2 are boosted at higher pressure while remaining unaffected, an increase in EG selectivity is observed. The MeOH selectivity is determined by the relative rates between R1 and R2. With a higher total pressure and EC partial pressure, the rate of R1 increases less than that of R2 (EC orders 0.65 and 1), resulting in lower MeOH selectivity. Although a higher operating pressure favors both EC conversion and the selectivity of EG—the more value-added product—it may also lead to EC condensation when exceeding 4.8 MPa. The optimal operating pressure is around 3 MPa when all performance metrics achieves a reasonable trade-off.
Figure 9b depicts the influence of space velocity on the reactor performance. Lower space velocity is beneficial for both X EC and S MeOH . To ensure a conversion over 90%, the space velocity should be maintained below 0.3 gEC·gcat−1·h−1. The slightly higher MeOH selectivity at low S V and high X EC originates from the fact that the main reaction R1 has a smaller reaction order of EC than the parallel side-reaction R2 (i.e., R1 decays slower at high EC conversion than R2). In contrast to MeOH, the EG selectivity is boosted at high S V when the secondary EG hydrogenation reaction proceeds inadequately. Since high space velocity results in too large bed pressure drop (Figure S5b), a space velocity of around 0.3 gEC·gcat−1·h−1 is deemed feasible with balanced operational cost and reaction performance.
The specific effects of key operating variables T , P op , S V and H2/EC on the reactor performance are summarized in the Table S7.

3.4. Operation Windows

Informed by the preceding illustrations, the different types of reactors response differently to variations of operating parameters. The major variables that affect the reactor performance and could be frequently changed in industrial practice include the inlet temperature of reactants and coolant ( T ), the operating pressure ( P op ), and space velocity ( S V ). Therefore, the T , P op and S V values required to reach certain X EC , S EG and S Alcohol are further calculated for the different types of reactors to shed light on their respective operating windows.
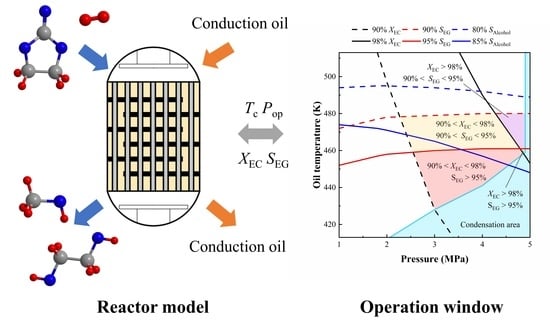
Figure 10 shows the demanded temperature and operating pressure for X EC , S EG and S Alcohol to reach 90/95/98%, respectively. In brief, the contour lines for X EC = 90% and 98% indicate that higher temperatures are required should the EC conversion be kept constant at decreasing operating pressures. The contour lines for S EG = 90% and 95% indicate that the operating pressure has negligible effects on S EG , which only decreases with the increase of temperature. The 85% S Alcohol contour line shows a downward trend with temperature for P op > 3.5 MPa. This is because higher pressures decrease S MeOH with S EG unaffected; thus, lower temperatures are demanded to compensate for the decrease in S Alcohol . Additionally, EC condensation restrains the allowable scope of the operation variables; the condensation regimes for the different types of reactors are marked in cyan in Figure 10. As P op increases, the dewpoint temperature of EC rises, thus enlarging the condensation regime. In Figure 10b,c, EC condensation is unavoidable regardless of the coolant temperature for P op > 4.9 MPa because the reactants condensate at the reactor inlet with the given inlet temperature of 463 K.
For all types of reactors under investigation, the contour lines divide the reactor’s operating window ( T and P op ) into different regimes with distinct reactor performance. For instance, the red, triangular zone in Figure 10a denotes the T in and P op window for the adiabatic reactor to achieve X EC > 90% and S EG > 95% under the S V of 0.3 gEC·gcat−1·h−1 and inlet H2/EC of 200. Figure 10a also indicates that the adiabatic reactor is not operable if X EC > 98% and S EG > 95% are desired, as the corresponding regimes would overlap inside the EC condensation regime with pressures over 5 MPa and inlet temperature below 450 K. It can be concluded that the adiabatic reactor is difficult to operate under pressures >4 MPa owing to a very narrow range of feasible inlet temperatures for adequate product yields. In contrast to the adiabatic reactor, Figure 10b−d demonstrate that the boiling water and conduction oil-cooled reactors exhibit wider operating windows of the inlet/coolant temperatures under higher pressures. The reason is twofold: First, heat removal uplifts the contour lines of S EG in the case of boiling water cooling and in the case of oil cooling with varying inlet temperatures (Figure 10b,d). Second, the ascending temperature profile along the oil-cooled reactor drastically lowers the EC condensation line on the oil inlet temperature-reactor pressure diagram (Figure 10c). The reactors with heat exchange would allow X EC > 98% and S EG > 95% with the demanded T c and P op being 463–465 K and 4.8–4.9 MPa for the boiling water-cooled reactor (green zone, Figure 10b), and 458–461 K and 4.8–4.9 MPa for T in = 463 K, or 466–474 K and 4.8–5.0 MPa for T c = 453 K, respectively, for the conduction oil-cooled reactor (Figure 10c,d). In all, the conduction oil-cooled reactor demonstrates the best operability in terms of allowable reactant/coolant inlet temperatures, especially under lower pressures.
As the production capacity of reactors might be varied during industrial operation, we further investigated the reactors’ operating windows with respect to various T in / T c and S V in with P op and H2/EC set to 3 MPa and 200, respectively. Figure 11 shows that increasing temperature with the space velocity is required in order to maintain certain EC conversions, and in contrast, the maximum temperature limits to keep the EG selectivity and total alcohols selectivity above thresholds are uplifted under a higher S V . An exception is found for the oil-cooled reactor with varying inlet temperatures, where the maximum inlet temperature allowable for 85% total alcohols selectivity decreases again with the increase of space velocity at above c.a. 0.4 gEC·gcat−1·h−1. The EC condensation regime remains invariant with the space velocity for the adiabatic and boiling water-cooled reactor, as well as for the oil-cooled reactor with varying reactant inlet temperatures. In these cases, whether EC condensates in the catalyst bed is determined by the inlet conditions. For the oil-cooled reactor with varying oil inlet temperatures, the EC condensation regime shifts to lower temperatures with increasing space velocity, under which conditions the initial sink of bed temperature due to cooling is less prominent.
A very small operation window for X EC > 98% and S EG > 95% (green zone; T in of 448–449 K, S V of 0.19–0.20 gEC·gcat−1·h−1) is shown for the adiabatic reactor in Figure 11a. However, common fluctuations in industry makes it difficult to keep T in and S V static in the range. For the boiling water-cooled reactor, the corresponding ranges of T c and S V are c.a. 448–463 K and 0.10–0.22 gEC·gcat−1·h−1, respectively, while for the conduction oil-cooled reactor with varying oil inlet temperatures, the ranges of T c and S V are c.a. 432- 454 K and 0.10–0.21 gEC·gcat−1·h−1. As in Figure 11b–d, the larger T c - S V window of the boiling water-cooled reactor benefits from an isothermal temperature profile that avoids deteriorating S EG at higher water temperatures, while that of the conduction oil-cooled reactor from a wide non-condensable regime. To sum up, the conduction oil-cooled reactor has the greatest allowable scope of space velocity for a wide range of reactant/coolant inlet temperatures.

4. Conclusions

In this work, multiscale reactor models for heterogenous EC hydrogenation to co-produce MeOH and EG in industrial-type adiabatic, water-cooled and oil-cooled tubular fixed-bed reactors are established and validated with bench-scale and pilot plant data. The main and side reactions occurring during the heterogeneous EC hydrogenation over Cu-based catalysts are described by a power-law engineering kinetics model involving three independent reactions.
EC hydrogenation under typical operating conditions in the adiabatic reactor renders a mild temperature rise of c.a. 12 K. However, bed temperatures above 473 K would significantly reduce the selectivity to the primary product EG due to its secondary hydrogenation, which is more temperature-sensitive than the main EC hydrogenation reaction. If the inlet temperature is lower than 453 K, however, EC condensation might happen and deactivate the catalyst, especially under low H2/EC and high operating pressures. The boiling water-cooled reactor behaves close to isothermally regardless of the reactant inlet temperature, with temperature gradients only existing in the first 10% of the catalyst bed, which is beneficial for the improving the yield of EG. The conduction oil-cooled reactor shows a minimum bed temperature near the bed entrance as the cold oil gets constantly heated up towards the bed outlet. Such a U-shape temperature profile allows a relatively wide scope of both the reactant inlet temperature and the oil inlet temperature with adequate reactor performance.
Model-based operational analysis of the three different types of reactors further suggests that the application of the adiabatic reactor in EC hydrogenation is restrained by a very narrow operating window of the inlet temperature, especially under higher pressures and space velocities, if practical EC conversion and alcohols selectivity are to be acquired within the non-condensable regime of EC. The boiling water-cooled reactor exhibits no restraint on the reactant inlet temperature and a relatively wide window of the coolant temperature under different pressures and space velocities. The conduction oil-cooled reactor has a sufficiently wide window of the reactant inlet temperature and a larger operating window of the coolant temperature than the water-cooled reactor. This enables reactor operation under higher pressures and space velocities, thus providing a greater production flexibility. Understanding of these operational characteristics of representative industrial-type reactors for EC hydrogenation not only reveals the key in reactor design, but will also pave the way to further process optimization.

Supplementary Materials

The following supporting information can be downloaded at: https://www.mdpi.com/article/10.3390/pr10040688/s1, Figure S1: Model and experiment values deviation of EC hydrogenation reaction; Figure S2: EC condensation zone under the condition of T = 410–530 K, Pop = 1–5 MPa and H2/EC = 40–200; Figure S3: Contours of PEG in different heat-exchange-type reactors: (a) (d) (g) adiabatic, (b) (e) (h) boiling water-cooled, (c) (f) (i) oil-cooled, under the conditions of 3 MPa, 0.3 gEC·gcat–1·h–1, 200 H2/EC and inlet/coolant temperatures of (a) (d) (g) inlet temperatures 443, 463, 483 K, (b)/(c) (e)/(f) (h)/(i) inlet temperature 463 K, coolant temperatures 423, 443, 463 K; Figure S4: Contours of u0 in different heat exchange type reactor: (a) adiabatic (b) boiling water-cooled (c) oil-cooled under the conditions of 3 MPa, 0.3 gEC·gcat–1·h–1, 200 H2/EC, 463 K inlet temperature and 463 K coolant temperature; Figure S5: The influence of SV on (a) superficial velocity and (b) bed pressure drop, in boiling water-cooled reactor under the conditions of 3 MPa, 0.3 gEC·gcat–1·h–1 and 200 H2/EC; Figure S6: The influence of reactant/coolant inlet temperatures on SEG under the conditions of 3 MPa, 0.3 gEC·gcat–1·h–1 and 200 H2/EC: (a) boiling water-cooled, (b) conduction oil-cooled reactor; Figure S7: Under the conditions of 3 MPa, 0.3 gEC·gcat–1·h–1 and 200 H2/EC, (a) bed and coolant temperatures in the axial direction; bed temperatures in the radial direction: (b) adiabatic, Tin = 443 K, (c) boiling water-cooled, Tin = 463 K and Tc = 443 K (d) conduction oil-cooled reactors, Tin = 463 K and Tc = 423 K; Table S1: Intrinsic kinetic parameters; Table S2: Specific heat capacity; Table S3: Thermal conductivity; Table S4: Viscosity; Table S5: Bed voidage; Table S6: Influence of catalyst sizes and shapes on reactor performance; Table S7: Effect of key operating variables on XEC, SEG, SMeOH. Refs. [62,64,65] are cited in supplementary materials.

Author Contributions

Conceptualization, C.C.; Funding acquisition, Y.W., J.L. and J.X.; Investigation, H.H., C.C. and Y.Y.; Methodology, C.C. and Y.W.; Project administration, Y.W., J.L. and J.X.; Supervision, C.C. and J.X.; Writing—original draft preparation, H.H.; Writing—review and editing, C.C., Y.W., J.L. and J.X. All authors have read and agreed to the published version of the manuscript.

Funding

This research was funded by the National Natural Science Fund for Distinguished Young Scholars (61725301), International (Regional) Cooperation and Exchange Project (61720106008), National Natural Science Foundation of China (21878080, 61973124), and the Dean/Opening Project of Guangxi Key Laboratory of Petrochemical Resource Processing and Process Intensification Technology.

Data Availability Statement

Data available on request due to restrictions e.g., privacy or ethical.

Conflicts of Interest

The authors declare no conflict of interest.

Notations

a Surface area of particles per unit volume (m−1)
c p , f Specific heat capacity of fluid (J·kg−1·K−1)
c p , oil Specific heat capacity of conduction oil (J·kg−1·K−1)
C 2 Inertial loss coefficient (m−1)
C EC , center Concentration of EC in the center of catalyst (kmol·m−3)
C EC , gas Concentration of EC in the gas phase (kmol·m−3)
C EC , s Concentration of EC on the surface of catalyst (kmol·m−3)
d p Diameter of sphere (m)
d p a Diameter of sphere with equal specific surface area (m)
d p s Diameter of sphere with equal surface area (m)
d p v Diameter of sphere with equal volume (m)
D Bed or tube diameter (m)
D e , ax Effective axis diffusion coefficient (m2·s−1)
D e , r Effective radial diffusion coefficient (m2·s−1)
D eff ,   EC Effective diffusion coefficient of EC in the catalyst particle (m2·s−1)
D EC , m Molecular diffusivity of EC (m2·s−1)
D T , i Thermal diffusion coefficient (kg·m−1·s−1)
E f Total fluid energy (m2·s−2)
E s Total solid energy (m2·s−2)
h j 0 Enthalpy of formation of species j (J·kmol−1)
H2/ECMolar ratio of EC to H2
J i Diffusion flux of species i vector (kg·m−2·s−1)
k Turbulence kinetic energy
k e , ax Effective axial thermal conductivity (W·m−1·K−1)
k e , r Effective radial thermal conductivity (W·m−1·K−1)
k f Thermal conductivity of fluid (W·m−1·K−1)
k g Gas-solid mass transfer coefficient (m·s−1)
k s Thermal conductivity of catalyst particle (W·m−1·K−1)
k v Pre-exponential factor
L Bed length (m)
m ˙ EC , in EC inlet mass flow (kg·h−1)
m ˙ EC , out EC outlet mass flow (kg·h−1)
m ˙ EG , out EG outlet mass flow (kg·h−1)
m ˙ MeOH , out MeOH outlet mass flow (kg·h−1)
m ˙ oil Conduction oil mass flow (kg·h−1)
M w Molecular weight (kg·kmol−1)
n Reaction order
N u Nusselt number
p Static pressure (Pa)
P EC EC partial pressure (Pa)
P EG EG partial pressure (Pa)
P op Operating pressure (MPa)
P e h 0 Fluid Peclet number for heat transfer
P e h , ax Peclet number for axial heat conduction
P e h , r Peclet radial heat transfer for fully developed turbulence flow
P e m , ax Peclet number for axial mass dispersion
P e m , r Peclet number for radial mass dispersion
P r Prandtl number
Q oil Heat flux to oil (W)
Q reaction Reaction heat (W)
r chem Intrinsic reaction rate (kmol·m−3·s−1)
r obs Effective reaction rate (kmol·m−3·s−1)
R Ratio of tube diameter to catalyst’s volume-equivalent diameter
R EC , s Effective consumption rate of EC at the particle surface (kmol·m−3·s−1)
R j Volumetric rate of creation of species j (kmol·m−3·s−1)
R e Reynolds number based on particle diameter
S Alcohol Total alcohol selectivity
S cat Surface area of catalyst particle (m2)
S EG EG selectivity
S f h Energy source term (W·m−3)
S i Mass source term (kg·m−3·s−1)
S MeOH MeOH selectivity
S wall Surface area of wall (m2)
S ϕ Momentum source term (kg·m−2·s−2)
S c Schmidt number
S h Sherwood number
S V Space velocity (gEC·gcat−1·h1)
t Time (s) or adjacent baffle plate space (m)
T Temperature (K)
T b Boiling point of pressurized water (K)
T c Coolant temperature (K)
T in Reactant inlet temperature (K)
T oil Conduction oil temperature (K)
T s Catalyst surface temperature (K)
T w Wall temperature (K)
u 0 Superficial velocity (m·s−1)
v Fluid flow velocity vector (m·s−1)
v cat Volume of catalyst particle (m3)
x X position along the bed axial direction (m)
X EC EC conversion
X i Mass fraction of species i
Y i Mole fraction of species i
Greek letters
α f Gas-solid heat transfer coefficient (W·m−2·K−1)
Δ r H Enthalpy of reaction (J·kmol−1)
Δ P Bed pressure drop (Pa)
Δ T ex Temperature difference between catalyst surface and gas phase (K)
Δ T in Temperature difference between catalyst surface and center (K)
ε b Bed voidage
ε cat Internal porosity of catalyst particle
η EC Effectiveness factor for EC internal mass transfer
λ eff , cat Effective thermal conductivity of catalyst particle (W·m−1·K−1)
μ Fluid viscosity (Pa·s)
ρ f Fluid density (kg·m−3)
τ Stress tensor (Pa)
ϕ gen , EC Generalized Thiele modulus of EC
ω Specific dissipation rate

References

  1. Hepburn, C.; Adlen, E.; Beddington, J.; Carter, E.A.; Fuss, S.; Mac Dowell, N.; Minx, J.C.; Smith, P.; Williams, C.K. The technological and economic prospects for CO2 utilization and removal. Nature 2019, 575, 87–97. [Google Scholar] [CrossRef] [Green Version]
  2. Zhang, Z.; Pan, S.; Li, H.; Cai, J.; Olabi, A.G.; Anthony, E.J.; Manovic, V. Recent advances in carbon dioxide utilization. Renew. Sustain. Energy Rev. 2020, 125, 109799. [Google Scholar] [CrossRef]
  3. Ronda-Lloret, M.; Rothenberg, G.; Shiju, N.R. A Critical Look at Direct Catalytic Hydrogenation of Carbon Dioxide to Olefins. ChemSusChem 2019, 12, 3896–3914. [Google Scholar] [CrossRef] [PubMed]
  4. Guo, L.; Sun, J.; Ge, Q.; Tsubaki, N. Recent advances in direct catalytic hydrogenation of carbon dioxide to valuable C2+ hydrocarbons. J. Mater. Chem. A 2018, 6, 23244–23262. [Google Scholar] [CrossRef]
  5. Yang, H.; Zhang, C.; Gao, P.; Wang, H.; Li, X.; Zhong, L.; Wei, W.; Sun, Y. A review of the catalytic hydrogenation of carbon dioxide into value-added hydrocarbons. Catal. Sci. Technol. 2017, 7, 4580–4598. [Google Scholar] [CrossRef]
  6. Ye, K.; Zhou, Z.; Shao, J.; Lin, L.; Gao, D.; Ta, N.; Si, R.; Wang, G.; Bao, X. In Situ Reconstruction of a Hierarchical Sn-Cu/SnOx Core/Shell Catalyst for High-Performance CO2 Electroreduction. Angew. Chem. Int. Ed. 2020, 59, 4814–4821. [Google Scholar] [CrossRef]
  7. Wu, C.; Lin, L.; Liu, J.; Zhang, J.; Zhang, F.; Zhou, T.; Rui, N.; Yao, S.; Deng, Y.; Yang, F.; et al. Inverse ZrO2/Cu as a highly efficient methanol synthesis catalyst from CO2 hydrogenation. Nat. Commun. 2020, 11, 5767. [Google Scholar] [CrossRef]
  8. Pedersen, J.K.; Batchelor, T.A.A.; Bagger, A.; Rossmeisl, J. High-Entropy Alloys as Catalysts for the CO2 and CO Reduction Reactions. ACS Catal. 2020, 10, 2169–2176. [Google Scholar] [CrossRef]
  9. Jiang, Z.; Wang, T.; Pei, J.; Shang, H.; Zhou, D.; Li, H.; Dong, J.; Wang, Y.; Cao, R.; Zhuang, Z.; et al. Discovery of main group single Sb–N4 active sites for CO2 electroreduction to formate with high efficiency. Energy Environ. Sci. 2020, 13, 2856–2863. [Google Scholar] [CrossRef]
  10. Hu, J.; Yu, L.; Deng, J.; Wang, Y.; Cheng, K.; Ma, C.; Zhang, Q.; Wen, W.; Yu, S.; Pan, Y.; et al. Sulfur vacancy-rich MoS2 as a catalyst for the hydrogenation of CO2 to methanol. Nat. Catal. 2021, 4, 242–250. [Google Scholar] [CrossRef]
  11. Wang, J.; Li, G.; Li, Z.; Tang, C.; Feng, Z.; An, H.; Liu, H.; Liu, T.; Li, C. A highly selective and stable ZnO-ZrO2 solid solution catalyst for CO2 hydrogenation to methanol. Sci. Adv. 2017, 3, e1701290. [Google Scholar] [CrossRef] [PubMed] [Green Version]
  12. Sen, R.; Goeppert, A.; Kar, S.; Prakash, G.K.S. Hydroxide Based Integrated CO2 Capture from Air and Conversion to Methanol. J. Am. Chem. Soc. 2020, 142, 4544–4549. [Google Scholar] [CrossRef] [PubMed]
  13. Hartadi, Y.; Widmann, D.; Behm, R.J. CO2 Hydrogenation to Methanol on Supported Au Catalysts under Moderate Reaction Conditions: Support and Particle Size Effects. ChemSusChem 2015, 8, 456–465. [Google Scholar] [CrossRef] [PubMed]
  14. Frei, M.S.; Mondelli, C.; Cesarini, A.; Krumeich, F.; Hauert, R.; Stewart, J.A.; Curulla Ferré, D.; Pérez-Ramírez, J. Role of Zirconia in Indium Oxide-Catalyzed CO2 Hydrogenation to Methanol. ACS Catal. 2020, 10, 1133–1145. [Google Scholar] [CrossRef]
  15. Dang, S.; Qin, B.; Yang, Y.; Wang, H.; Cai, J.; Han, Y.; Li, S.; Gao, P.; Sun, Y. Rationally designed indium oxide catalysts for CO2 hydrogenation to methanol with high activity and selectivity. Sci. Adv. 2020, 6, eaaz2060. [Google Scholar] [CrossRef] [PubMed]
  16. Wang, W.; Wang, S.; Ma, X.; Gong, J. Recent advances in catalytic hydrogenation of carbon dioxide. Chem. Soc. Rev. 2011, 40, 3703–3727. [Google Scholar] [CrossRef] [Green Version]
  17. Wang, S.; Zhao, L.; Wang, W.; Zhao, Y.; Zhang, G.; Ma, X.; Gong, J. Morphology control of ceria nanocrystals for catalytic conversion of CO2 with methanol. Nanoscale 2013, 5, 5582–5588. [Google Scholar] [CrossRef]
  18. Song, Q.; Zhou, Z.; He, L. Efficient, selective and sustainable catalysis of carbon dioxide. Green Chem. 2017, 19, 3707–3728. [Google Scholar] [CrossRef]
  19. Tamura, M.; Kitanaka, T.; Nakagawa, Y.; Tomishige, K. Cu Sub-Nanoparticles on Cu/CeO2 as an Effective Catalyst for Methanol Synthesis from Organic Carbonate by Hydrogenation. ACS Catal. 2016, 6, 376–380. [Google Scholar] [CrossRef]
  20. Li, Y.; Junge, K.; Beller, M. Improving the Efficiency of the Hydrogenation of Carbonates and Carbon Dioxide to Methanol. ChemCatChem 2013, 5, 1072–1074. [Google Scholar] [CrossRef]
  21. Du, X.; Sun, X.; Jin, C.; Jiang, Z.; Su, D.; Wang, J. Efficient Hydrogenation of Alkyl Formate to Methanol over Nanocomposite Copper/Alumina Catalysts. ChemCatChem 2014, 6, 3075–3079. [Google Scholar] [CrossRef]
  22. Balaraman, E.; Gunanathan, C.; Zhang, J.; Shimon, L.J.W.; Milstein, D. Efficient hydrogenation of organic carbonates, carbamates and formates indicates alternative routes to methanol based on CO2 and CO. Nat. Chem. 2011, 3, 609–614. [Google Scholar] [CrossRef] [PubMed]
  23. Du, X.; Jiang, Z.; Su, D.; Wang, J. Research Progress on the Indirect Hydrogenation of Carbon Dioxide to Methanol. ChemSusChem 2016, 9, 322–332. [Google Scholar] [CrossRef] [PubMed]
  24. Yu, B.-Y.; Chen, M.-K.; Chien, I.L. Assessment on CO2 Utilization through Rigorous Simulation: Converting CO2 to Dimethyl Carbonate. Ind. Eng. Chem. Res. 2018, 57, 639–652. [Google Scholar] [CrossRef]
  25. Gu, X.; Zhang, X.; Zhang, X.; Deng, C. Simulation and assessment of manufacturing ethylene carbonate from ethylene oxide in multiple process routes. Chin. J. Chem. Eng. 2021, 31, 135–144. [Google Scholar] [CrossRef]
  26. Han, Z.; Rong, L.; Wu, J.; Zhang, L.; Wang, Z.; Ding, K. Catalytic Hydrogenation of Cyclic Carbonates: A Practical Approach from CO2 and Epoxides to Methanol and Diols. Angew. Chem. Int. Ed. 2012, 51, 13041–13045. [Google Scholar] [CrossRef]
  27. Wu, X.; Ji, L.; Ji, Y.; Elageed, E.H.M.; Gao, G. Hydrogenation of ethylene carbonate catalyzed by lutidine-bridged N-heterocyclic carbene ligands and ruthenium precursors. Catal. Commun. 2016, 85, 57–60. [Google Scholar] [CrossRef]
  28. Lian, C.; Ren, F.; Liu, Y.; Zhao, G.; Ji, Y.; Rong, H.; Jia, W.; Ma, L.; Lu, H.; Wang, D.; et al. Heterogeneous selective hydrogenation of ethylene carbonate to methanol and ethylene glycol over a copper chromite nanocatalyst. Chem. Commun. 2015, 51, 1252–1254. [Google Scholar] [CrossRef]
  29. Zhang, M.; Yang, Y.; Li, A.; Yao, D.; Gao, Y.; Fayisa, B.A.; Wang, M.-Y.; Huang, S.; Lv, J.; Wang, Y.; et al. Nanoflower-like Cu/SiO2 Catalyst for Hydrogenation of Ethylene Carbonate to Methanol and Ethylene Glycol: Enriching H2 Adsorption. ChemCatChem 2020, 12, 3670–3678. [Google Scholar] [CrossRef]
  30. Yang, Y.; Yao, D.; Zhang, M.; Li, A.; Gao, Y.; Fayisa, B.A.; Wang, M.; Huang, S.; Wang, Y.; Ma, X. Efficient hydrogenation of CO2-derived ethylene carbonate to methanol and ethylene glycol over Mo-doped Cu/SiO2 catalyst. Catal. Today 2021, 371, 113–119. [Google Scholar] [CrossRef]
  31. Ding, Y.; Tian, J.; Chen, W.; Guan, Y.; Xu, H.; Li, X.; Wu, H.; Wu, P. One-pot synthesized core/shell structured zeolite@copper catalysts for selective hydrogenation of ethylene carbonate to methanol and ethylene glycol. Green Chem. 2019, 21, 5414–5426. [Google Scholar] [CrossRef]
  32. Zhou, M.; Shi, Y.; Ma, K.; Tang, S.; Liu, C.; Yue, H.; Liang, B. Nanoarray Cu/SiO2 Catalysts Embedded in Monolithic Channels for the Stable and Efficient Hydrogenation of CO2-Derived Ethylene Carbonate. Ind. Eng. Chem. Res 2018, 57, 1924–1934. [Google Scholar] [CrossRef]
  33. Chen, X.; Cui, Y.; Wen, C.; Wang, B.; Dai, W. Continuous synthesis of methanol: Heterogeneous hydrogenation of ethylene carbonate over Cu/HMS catalysts in a fixed bed reactor system. Chem. Commun. 2015, 51, 13776–13778. [Google Scholar] [CrossRef] [PubMed]
  34. Li, F.; Wang, L.; Han, X.; Cao, Y.; He, P.; Li, H. Selective hydrogenation of ethylene carbonate to methanol and ethylene glycol over Cu/SiO2 catalysts prepared by ammonia evaporation method. Int. J. Hydrogen Energy 2017, 42, 2144–2156. [Google Scholar] [CrossRef]
  35. Chen, W.; Song, T.; Tian, J.; Wu, P.; Li, X. An efficient Cu-based catalyst for the hydrogenation of ethylene carbonate to ethylene glycol and methanol. Catal. Sci. Technol. 2019, 9, 6749–6759. [Google Scholar] [CrossRef]
  36. Tian, J.; Chen, W.; Wu, P.; Zhu, Z.; Li, X. Cu–Mg–Zr/SiO2 catalyst for the selective hydrogenation of ethylene carbonate to methanol and ethylene glycol. Catal. Sci. Technol. 2018, 8, 2624–2635. [Google Scholar] [CrossRef]
  37. Song, T.; Qi, Y.; Jia, A.; Ta, N.; Lu, J.; Wu, P.; Li, X. Continuous hydrogenation of CO2-derived ethylene carbonate to methanol and ethylene glycol at Cu-MoOx interface with a low H2/ester ratio. J. Catal. 2021, 399, 98–110. [Google Scholar] [CrossRef]
  38. Chen, X.; Wang, L.; Zhang, C.; Tu, W.; Cao, Y.; He, P.; Li, J.; Li, H. The effective and stable Cu–C@SiO2 catalyst for the syntheses of methanol and ethylene glycol via selective hydrogenation of ethylene carbonate. Int. J. Hydrogen Energy 2021, 46, 17209–17220. [Google Scholar] [CrossRef]
  39. Deng, F.; Li, N.; Tang, S.; Liu, C.; Yue, H.; Liang, B. Evolution of active sites and catalytic consequences of mesoporous MCM-41 supported copper catalysts for the hydrogenation of ethylene carbonate. Chem. Eng. J. 2018, 334, 1943–1953. [Google Scholar] [CrossRef]
  40. Poels, E.K.; Brands, D.S. Modification of Cu/ZnO/SiO2 catalysts by high temperature reduction. Appl. Catal. A: Gen. 2000, 191, 83–96. [Google Scholar] [CrossRef]
  41. Meyer, J.J.; Tan, P.; Apfelbacher, A.; Daschner, R.; Hornung, A. Modeling of a Methanol Synthesis Reactor for Storage of Renewable Energy and Conversion of CO2—Comparison of Two Kinetic Models. Chem. Eng. Technol. 2016, 39, 233–245. [Google Scholar] [CrossRef]
  42. Bozzano, G.; Manenti, F. Efficient methanol synthesis: Perspectives, technologies and optimization strategies. Prog. Energy Combust. Sci. 2016, 56, 71–105. [Google Scholar] [CrossRef]
  43. Haid, J.; Koss, U. Lurgi’s Mega-Methanol technology opens the door for a new era in down-stream applications. In Studies in Surface Science and Catalysis; Iglesia, E., Spivey, J.J., Fleisch, T.H., Eds.; Elsevier Science Pub. Co. Inc.: Amsterdam, The Netherlands, 2001; Volume 136, pp. 399–404. [Google Scholar]
  44. Samimi, F.; Feilizadeh, M.; Ranjbaran, M.; Arjmand, M.; Rahimpour, M.R. Phase stability analysis on green methanol synthesis process from CO2 hydrogenation in water cooled, gas cooled and double cooled tubular reactors. Fuel Processing Technol. 2018, 181, 375–387. [Google Scholar] [CrossRef]
  45. Cui, X.; Kær, S.K. A comparative study on three reactor types for methanol synthesis from syngas and CO2. Chem. Eng. J. 2020, 393, 124632. [Google Scholar] [CrossRef]
  46. Kuo, K.K. Principles of Combustion; Elsevier Science Pub. Co. Inc.: Amsterdam, The Netherlands, 1986. [Google Scholar]
  47. Verman, L.C.; Banerjee, S. Effect of Container Walls on Packing Density of Particles. Nature 1946, 157, 584. [Google Scholar] [CrossRef]
  48. Theuerkauf, J.; Witt, P.; Schwesig, D. Analysis of particle porosity distribution in fixed beds using the discrete element method. Powder Technol. 2006, 165, 92–99. [Google Scholar] [CrossRef]
  49. Roshani, S. Elucidation of Local and Global Structural Properties of Packed Bed Configurations; The University of Leeds: Leeds, UK, 1990. [Google Scholar]
  50. de Klerk, A. Voidage variation in packed beds at small column to particle diameter ratio. AIChE J. 2003, 49, 2022–2029. [Google Scholar] [CrossRef]
  51. Ergun, S. Fluid Flow Through Packed Columns. Chem. Eng. Prog. 1952, 48, 89–94. [Google Scholar]
  52. Koning, B. Heat and Mass Transport in Tubular Packed Bed Reactors at Reacting and Non-Reacting Conditions; University of Twente: Enschede, The Netherlands, 2002. [Google Scholar]
  53. Agnew, J.B.; Potter, O. Heat transfer properties of packed tubes of small diameter. Trans. Inst. Chem. Eng. 1970, 48, T15. [Google Scholar]
  54. Bauer, R.; Schluender, E.U. Effective Radial Thermal Conductivity of Packings in Gas Flow-1. Convective Transport Coefficient. Int. Chem. Eng. 1978, 18, 181–188. [Google Scholar]
  55. Bauer, R.; Schluender, E.U. Effective Radial Thermal Conductivity of Packings in Gas Flow-2. Thermal Conductivity of the Packing Fraction without Gas Flow. Int. Chem. Eng. 1978, 18, 189–204. [Google Scholar]
  56. Westerterp, K.R.; Swaaij, W.P.M.V.; Beenackers, A.A.C.M. Chemical Reactor Design and Operation, 2nd ed.; John Wiley & Sons, Ltd.: Hoboken, NJ, USA, 1987; p. 800. [Google Scholar]
  57. Fahien, R.W.; Smith, J.M. Mass transfer in packed beds. AIChE J. 1955, 1, 28–37. [Google Scholar] [CrossRef]
  58. Specchia, V.; Baldi, G.; Sicardi, S. Heat transfer in packed bed reactors with one phase flow. Chem. Eng. Commun. 1980, 4, 361–380. [Google Scholar] [CrossRef]
  59. Wakao, N.; Funazkri, T. Effect of fluid dispersion coefficients on particle-to-fluid mass transfer coefficients in packed beds: Correlation of sherwood numbers. Chem. Eng. Sci. 1978, 33, 1375–1384. [Google Scholar] [CrossRef]
  60. Bai, P.T.; Manokaran, V.; Saiprasad, P.S.; Srinath, S. Studies on Heat and Mass Transfer Limitations in Oxidative Dehydrogenation of Ethane Over Cr2O3/Al2O3 Catalyst. Procedia Eng. 2015, 127, 1338–1345. [Google Scholar] [CrossRef] [Green Version]
  61. Soomro, M.; Hughes, R. The thermal conductivity of porous catalyst pellets. Can. J. Chem. Eng. 1979, 57, 24–28. [Google Scholar] [CrossRef]
  62. McCabe, W.L.; Smith, J.C.; Harriott, P. Heat Tranfer to Fluids without Phase Change. In Unit Operations in Chemical Engineering; Clark, B.J., Castellano, E., Eds.; Mcgraw Hill, Inc.: New York, NY, USA, 1993; pp. 647–685. [Google Scholar]
  63. Ross, J.R.H. Chapter 8-Mass and Heat Transfer Limitations and Other Aspects of the Use of Large-Scale Catalytic Reactors. In Contemporary Catalysis; Ross, J.R.H., Ed.; Elsevier Science Pub. Co. Inc.: Amsterdam, The Netherlands, 2019; pp. 187–213. [Google Scholar]
  64. Plessis, J.P.; Diedericks, G. Fluid transport in porous media: Pore-scale modelling of interstitial transport phenomena. Comput. Mech. Publ. 1997, 11, 61–104. [Google Scholar]
  65. Bird, R.B.; Stewart, W.E.; Lightfoot, E.N. Transport Phenomena; John Wiley & Sons, Ltd.: New York, NY, USA, 1960. [Google Scholar]
Figure 1. EC hydrogenation reaction.
Processes 10 00688 g001
Figure 2. Schematic diagram of (a) industrial adiabatic and heat-exchange reactors for ethylene carbonate hydrogenation and (b) the multi-scale reactor model.
Processes 10 00688 g002
Figure 3. Comparison between pilot plant and simulation data for EC hydrogenation in the conduction oil-cooled multi-tubular reactor.
Processes 10 00688 g003
Figure 4. Contours of T , P EC and P EG in the adiabatic reactor with different reactant inlet temperatures of (a) 443 K, (b) 463 K and (c) 483 K under the conditions of 3 MPa, 0.3 gEC·gcat−1·h−1 and H2/EC = 200.
Processes 10 00688 g004
Figure 5. Contours of T , P EC and P EG in boiling water-cooled reactor with different coolant temperatures of (a) 423 K, (b) 443 K and (c) 463 K under the conditions of 3 MPa, 0.3 gEC·gcat−1·h−1, H2/EC = 200 and reactant inlet temperature of 463 K.
Processes 10 00688 g005
Figure 6. Contours of T , P EC and P EG in oil-cooled reactor with different coolant temperatures of (a) 423 K, (b) 443 K and (c) 463 K under the conditions of 3 MPa, 0.3 gEC·gcat−1·h−1, H2/EC = 200 and reactant inlet temperature of 463 K.
Processes 10 00688 g006
Figure 7. Reactor performance under different reactant/coolant inlet temperatures: (a) adiabatic reactor with T in = 433–483 K, (b) boiling water-cooled reactor with T in = 463 K and T c = 423–463 K, (c) conduction oil-cooled reactor with T in = 463 K and T c = 423–463 K, (d) conduction oil-cooled reactor with T c = 463 K and T in = 433–483 K. Operating conditions: 3 MPa, 0.3 gEC·gcat−1·h−1, H2/EC = 200.
Processes 10 00688 g007
Figure 8. Reactor performance under different H2/EC: (a) adiabatic reactor, (b) boiling water-cooled reactor, (c) conduction oil-cooled reactor. Operating conditions: reactant and coolant inlet temperatures 463 K, 3 MPa, 0.3 gEC·gcat−1·h−1, 80–200 H2/EC.
Processes 10 00688 g008
Figure 9. Reactor performance of the boiling water-cooled reactor under the conditions of (a) 1–5 MPa, 0.3 gEC·gcat−1·h−1, (b) 3 MPa, 0.1–0.5 gEC·gcat−1·h−1 ( T in = 463 K, T c = 463 K and H2/EC = 200).
Processes 10 00688 g009
Figure 10. Operation windows of reactors for demanded T in / T c - P op parameters on outlet EC conversion, EG selectivity and total alcohol selectivity under SV = 0.3 gEC·gcat−1·h1 and H2/EC = 200. Reactor type: (a) adiabatic, (b) boiling water-cooled, (c) oil-cooled, T in = 463 K, (d) oil-cooled, T c = 453 K.
Processes 10 00688 g010
Figure 11. Operation windows of reactors for demanded T in / T c - S V parameters on outlet EC conversion, EG selectivity and total alcohol selectivity under 3 MPa and 200 H2/EC. Reactor type: (a) adiabatic, (b) boiling water-cooled, (c) oil-cooled, T in = 463 K, (d) oil-cooled, T c = 453 K.
Processes 10 00688 g011
Table 1. Model parameters.
Geometric ParametersAdiabatic FBRHeat-Exchange FBR
Bed / Tube   diameter ,   D (m)20.05
Developing zone length2 m
Reaction zone length8 m
Catalyst typeCu/SiO2 [30]
Catalyst geometry3/5/7 mm (sphere); 3 × 3/5 × 5/7 × 7 mm (cylinder)
Catalyst loading mass (kg)13730 kg for (5 mm sphere)
Average bed voidage 0.4 (5 mm sphere)0.43 (5 mm sphere)
Gas distributor geometry1 m diameter, ring /
Operating conditions
(Nominal value/range)
Temperature ,   T in (K)463/433–483
Coolant   temperature ,   T c (K)/463/423–463
Pressure ,   P op (MPa)3/1–5
Space   velocity ,   S V (gEC·gcat−1·h−1)0.3/0.1–0.5
Molar ratio of H2 to EC200/80–200
Details of the multi-scale reactor models, including governing equations, heat and mass transfer correlations, chemical kinetics and model implementation are introduced in the following text.
Table 2. Dependence of EC conversion on grid sizes in simulation.
Adiabatic Reactor Model
Mesh Size125010,00020,000
EC conversions (%)20% length (sphere)37.639.039.1
outlet (sphere)94.194.094.0
20% length (cylinder)29.730.230.1
outlet (cylinder)86.085.184.8
Heat-Exchange Reactor Model
Mesh Size250010,00040,000
EC conversions (%)20% length (sphere)36.838.038.3
outlet (sphere)93.293.293.2
20% length (cylinder)33.734.835.1
outlet (cylinder)89.489.489.4
Table 3. Structure and working conditions of the pilot reactor for EC hydrogenation.
Pilot Reactor Configuration
Tube Inner Diameter (m)0.034
Tube length (m)4
Tube number95
Operating Conditions
EC mass flow (kg·h−1)107.3
Feed EC to H2 molar ratio170
Feed temperature (K)458.2
Coolant typeConduction oil
Coolant mass flow rate (kg·h−1)20,000
Coolant temperature (K)453.2
Catalyst Information
Catalyst compositionCu/SiO2
Size and shape3 × 5 mm cylinder
Publisher’s Note: MDPI stays neutral with regard to jurisdictional claims in published maps and institutional affiliations.