Article

Transfer of Potentially Toxic Elements in the Soil-Plant System in Magnesite Mining and Processing Areas

Department of Management, Faculty of Management and Business, University of Prešov, Konštantínova 16, 080 01 Prešov, Slovakia
*
Author to whom correspondence should be addressed.
Processes 2022, 10(4), 720; https://doi.org/10.3390/pr10040720
Submission received: 9 March 2022 / Revised: 4 April 2022 / Accepted: 6 April 2022 / Published: 8 April 2022
(This article belongs to the Special Issue Innovative Treatments for the Improvement of Bioremediation Processes)

Abstract

:
Mining activities, ore concentrations, and transport processes generate large amounts of pollutants, including hazardous elements, which are released into the environment. This work presents the results of experimental research aimed at evaluating the environmental risks of soil and plant contamination in two magnesite mining and processing areas in the Slovak Republic, and assesses the phytoremediation potential of dominant plant species. Eleven potentially toxic elements in the soil were investigated using X-ray fluorescence spectrometry (Cd, Pb, Cr, Zn, Cu, As, Ni, Mn, Mg, Fe) and atomic absorption spectrometry (Hg). In plants, potentially toxic elements were investigated using inductively coupled plasma mass spectrometry (Cu, As, Cd, Pb) and inductively coupled plasma atomic emission spectrometry (Cr, Zn, Mn, Mg). Selected soil parameters (pH, redox potential, and soil organic matter) were also investigated. Soil contamination was evaluated using environmental indices (geoaccumulation index—Igeo, enrichment factor—EF, contamination factor—Cf, degree of contamination—Cd). The phytoremediation potential of plants was evaluated using the bioconcentration factor (BCF) and the translocation factor (TF). The soil reaction in the studied areas indicated a strong alkalization of the soil. The soils in Jelšava-Lubeník were significantly contaminated with Cr, As, Mn, and Mg. The most significant enrichment based on the average values of EF was found to be in the order of Cd > Mg > Zn > Cu > As > Cr > Ni > Pb > Fe > Hg > Mn. The observed values of Cf and Cd indicated a high degree of soil contamination. In Košice, the soils were found to be significantly contaminated with Cr, Mn, Mg, and Ni. The most significant enrichment was found in the order of Cd > Mn > Ni > Pb > Zn > Mg > Cu > As > Fe > Cr > Hg. Very high Cf was found for Pb and Cr. The results of correlation and hierarchical cluster analyses suggest a similar origin of pollutants caused by significant anthropogenic interventions due to magnesite mining and processing. The investigated dominant plant species, Phragmites australis, Agrostis stolonifera, Elytrigia repens, and Taraxacum officinale are able to accumulate high concentrations of the monitored potentially toxic elements without more serious load or damage. The results of BCF and TF confirmed that P. australis and T. officinale appeared to be suitable accumulators in the phytoextraction process. In the case of E. repens and A. stolonifera it was confirmed that they accumulate and immobilize high concentrations of potentially toxic elements, especially in the roots, establishing the suitability of their use in phytostabilization processes.

1. Introduction

Soil contamination by potentially toxic elements currently poses a serious environmental threat and is one of the most pressing global environmental problems [1,2,3,4]. Mining activities, ore concentration, and transport processes cause dust and wastewater generation, especially in the immediate vicinity of mines [5]. Tailings, dust emissions, and acid mine drainage cause the release of large amounts of pollutants into the environment, including hazardous elements [6,7]. This can jeopardize soil production capacity, ecological integrity, and habitat security in mining areas [8,9,10,11]. Mining, smelting, and industrial processing of ores are the cause of serious environmental pollution. While the world’s population doubled in the second half of the 20th century, the production of the five potentially toxic elements—copper, lead, nickel, tin, and zinc—more than doubled [12].
Potentially toxic elements are ubiquitous in the environment and adversely affect not only ecological systems but also human health [13,14]. The bioavailability of potentially toxic elements in soil depends on specific combinations of chemical, biological, and environmental parameters [15]. The distribution of potentially toxic elements in plants is heterogeneous and is controlled by genetic, environmental, and toxicological factors. The interaction of potentially toxic elements in the plant-soil system depends mainly on the level of soil contamination and the plant species [16]. Physiological and biochemical processes in a plant’s life cycle require essential potentially toxic elements such as copper, iron, manganese, nickel, and zinc, which can become toxic if present in excessive amounts [17]. Non-essential potentially toxic elements such as lead, cadmium, arsenic, and mercury are highly toxic and have no significant function in plants. They can cause serious environmental pollution and affect various physiological and biochemical processes in plants [18,19]. Most plant species are unable to adapt to high levels of potentially toxic elements. At increased concentrations of pollutants in soil, some native plants stop growing or even die due to phytotoxicity, suggesting that the plants have different levels of tolerance for potentially toxic elements [20]. There are plants that survive, grow, and multiply in soils contaminated with potentially toxic elements. Most of these species tolerate concentrations of potentially toxic elements and keep them at the roots with minimal translocation to the leaves [21].
Decontamination of soil is a cleaning process that restores it to its original state. This is a relatively complicated and long-term process, since it is almost impossible to completely remove potentially toxic elements from the soil [22,23]. Several remediation approaches have been developed to cultivate soil contaminated with potentially toxic elements. They are primarily based on mechanical or physicochemical techniques. They are limited by high costs and irreversible changes in the physicochemical and biological properties of soils, which can lead to deterioration of the soil ecosystem and secondary pollution [24,25,26,27]. From an economic as well as an environmental point of view, biological methods are more beneficial, as they are more environmentally friendly and support the renewal and growth of plants on contaminated soil. In general, bioremediation technologies are more in line with the concept of sustainable development compared to traditional physical and chemical remediation technologies. Bioremediation is a generally accepted method of soil remediation because it is assumed to rely on natural processes [28,29]. An important method of bioremediation is phytoremediation, which is considered a highly efficient and an ecologically and economically advantageous method that can be applied to a large area. It can prevent the spread of contaminants and improve the productive capacity of the soil by releasing various organic substances into the soil [27,30]. It is a method of remediation of soils contaminated with potentially toxic elements by using plants, which extract pollutants from the soil or reduce their bioavailability in the soil. This method is suitable if a wide area is contaminated with pollutants and the substances are in the root zone of the plant, as the plants can absorb potentially toxic elements even at low concentrations through the root system [31,32,33].
Hyperaccumulators are plant species that can accumulate high levels of potentially toxic elements in their organs without signs of phytotoxicity. Their activity consists of actively absorbing one or several potentially toxic elements from the soil. Potentially toxic elements are not preserved in the roots but move to other parts of the plant [34,35,36,37]. To date, more than 450 types of potentially toxic element hyperaccumulators have been identified that can concentrate more than 10 mg/kg mercury, 100 mg/kg cadmium, 1000 mg/kg cobalt, chromium, copper, and lead, and 10,000 mg/kg zinc and nickel [38,39,40]. Significant hyperaccumulators, according to Ma et al. [41], Schmidt [42], and Scragga [43] are Thlaspicaerulescens, Betula pendula, Salix viminalis, Zea mays, Helianthus annuus, Agrostis capillaris, Agrostis stolonifera, and Pteris vittata. Highly resistant plants include Elytrigia repens and Taraxacum officinale [44].
The aim of this study was to assess the environmental risks of soil and plant contamination in the areas of magnesite mining and processing through environmental indices and to estimate the phytoremediation potential of dominant plant species.

2. Materials and Methods
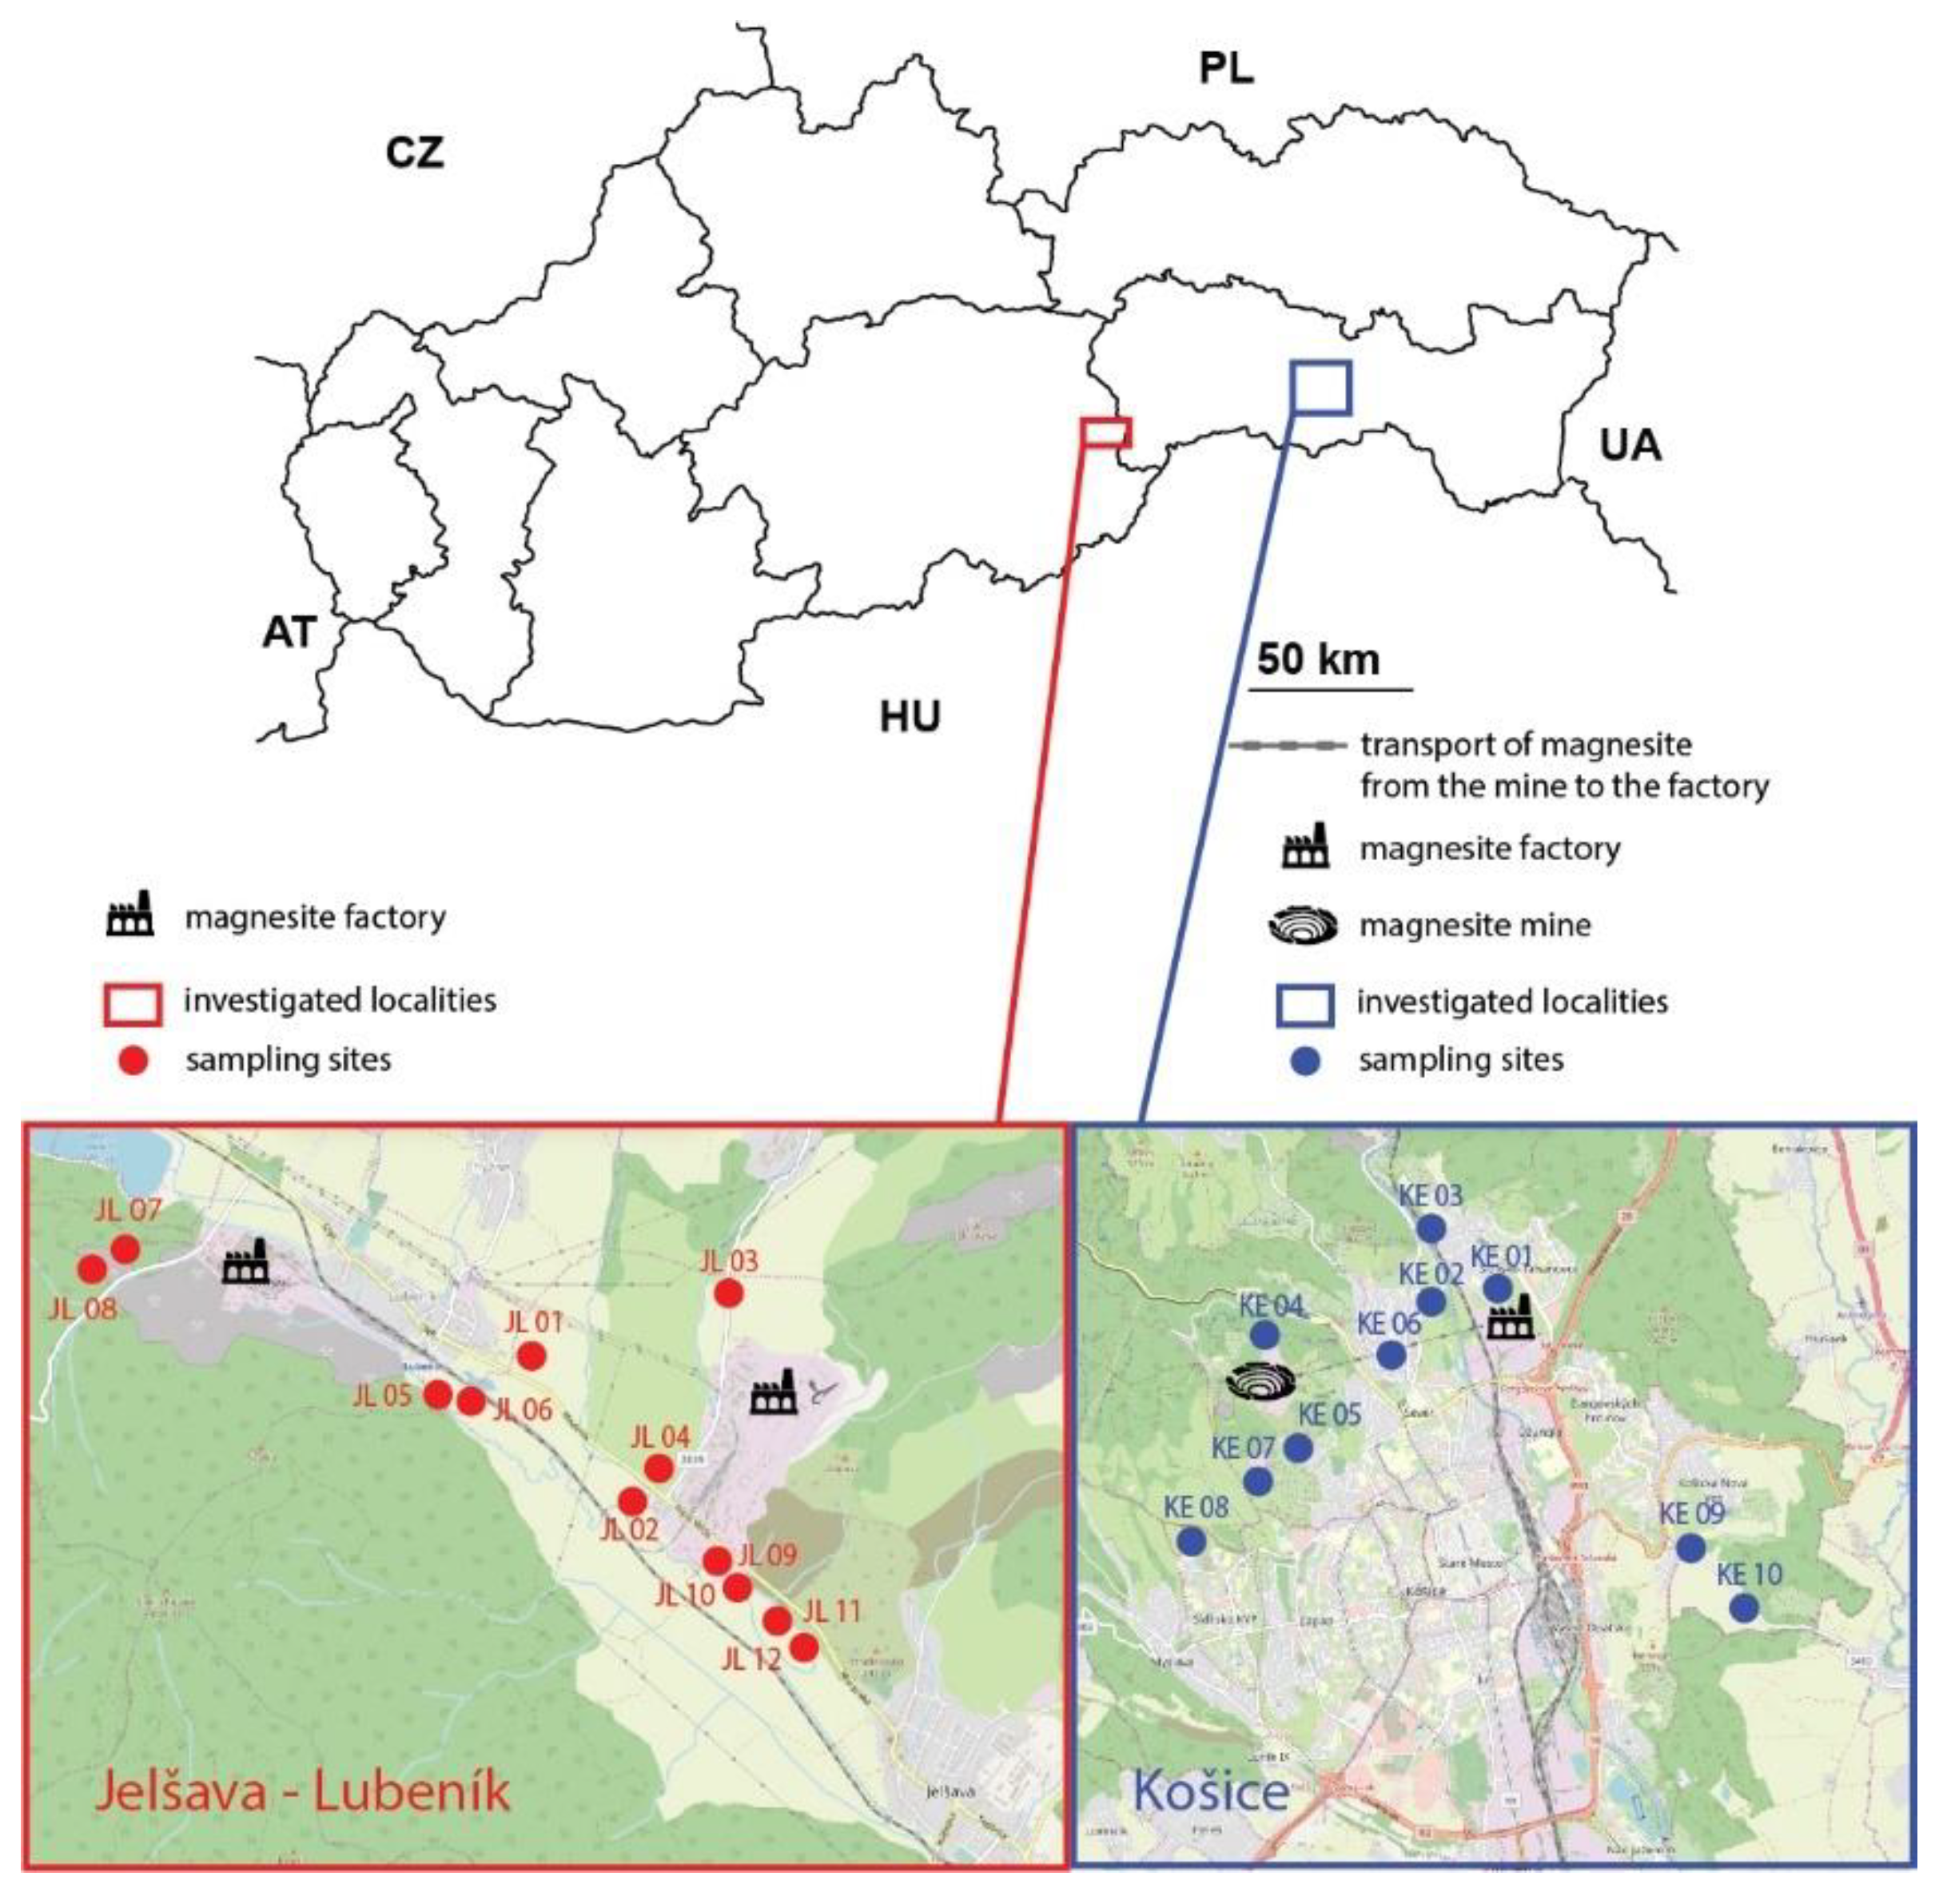
2.1. Study Area

The research was carried out in the tailings of the magnesite mining and processing area of the Jelšava-Lubeník and Košice mines located in the Revúca and Košice regions. Based on the environmental regionalization of the Slovak Republic, Jelšava (48°38′39.1″ N 20°13′02.7″ E) and Lubeník (48°39′18.3″ N 20°11′48.9″ E) have been included in the Revúca region of the 2nd environmental quality with a slightly disturbed environment. Rendzinas, Cambisols, and Luvisols predominate in this area [45,46]. The climate in the study area is warm, slightly humid, with cold winters. In winter, the average temperature is in the range of −3 to −5 °C and in summer, 14.5 to 16.5 °C. The average annual rainfall is in the range of 700–800 mm [47]. Slovak Magnesite Factory Jelšava and SLOVMAG Lubeník (Figure 1) account for the maximum magnesite production and represent magnesite storage that is expected to last for the next 100 years in Jelšava, and 10 years in Lubeník [48].
Another investigated area was near the former magnesite plant and mine in Košice (48°42′50.2″ N 21°15′29.1″ E). According to the environmental regionalization of Slovakia, the studied area in the Košice region belongs to the 3rd degree of environmental quality with a severely disturbed environment. Soil types of Rendzina and Pseudogley predominate in this area [46]. The climate in the Košice region is warm and slightly humid. In January, the average temperature ranges from −3 to 2 °C and in July, from 15 to 26 °C. The average annual rainfall is 530 mm [47]. Dust generated during the processing of magnesite significantly polluted the air in Košice and the city became one of the most polluted cities. At present, the industrial area of the plant and the mine is devastated and dilapidated (Figure 2) [49,50].

2.2. Sampling Procedure

In Jelšava-Lubeník (JL), 12 sampling points were identified and, in Košice (KE), 10 sampling points were monitored (Figure 3), all classified as agricultural land. Soil sampling was carried out in the years 2019–2021 from the horizon A to a depth of 0.05 to 0.15 m. One homogeneous sample consisted of five random samples taken at regular intervals in one locality and consisted of approximately 1 kg of soil. The samples were placed in plastic bags, transported to the laboratory, cleaned of plant debris and other materials. They were then dried at room temperature, crushed, and sieved through a 2 mm stainless steel sieve. The collection and processing procedures were in accordance with the standard STN ISO 10381-6 [51] and with Decree 338/2005 Coll. from the Ministry of Agriculture of the Slovak Republic [52], which lays down the details of the soil sampling procedure.
The underground and above-ground parts of the dominant plant species, which are present in the investigated localities and form monocultures, were also examined. The species Phragmites australis, Agrostis stolonifera, and Elytrigia repens were collected in Jelšava-Lubeník, while Elytrigia repens and Taraxacum officinale were sampled in Košice. The samples were placed in plastic bags, transported to the laboratory, washed of residual materials, dried at room temperature, and divided into individual parts (root, stem, flower, and leaf) for further analysis.

2.3. Analytical Methods

Soil reaction (pH), redox potential (Eh), and soil organic matter (SOM) were determined in the soil samples. The pH was determined as the exchange soil reaction in 1M KCl neutral salt solution (20 g of soil mixed with 50 mL of 1M KCl) potentiometrically on a Mettler Toledo pH-meter (Mettler-Toledo Group, Zurich, Switzerland). Redox potential was also measured on a Mettler Toledo instrument. The soil organic matter content was determined by a dry route on a C/N Analyzer (Euro EA 3000, Pavia, Italy) [53].
The content of potentially toxic elements was determined in cooperation with an accredited laboratory (Certificate No. 042/S-004) of the Dionýz Štúr State Geological Institute in Spišská Nová Ves. X-ray fluorescence spectrometry (Cd, Pb, Cr, Zn, Cu, As, Ni, Mn, Mg, Fe) using SPECTRO XEPOS HE X-ray Spectrometer (SPECTRO ANALYTICAL INSTRUMENTS GmbH, Kleve, Germany) and VARIAN VF-60-WS X-ray tube (W-Anode) and atomic absorption spectrometry (Hg) using AMA-254 Mercury Analyzer (ALTEC, Uherské Hradiště, Czech Republic) were used to determine the content of potentially toxic elements in the soil. NIST 2711, NIST 2709, GBW 07404, GBW 07406, and GBW 07405 standards were used to determine potential toxic elements in the soil. The total content of potentially toxic elements in plants was determined using inductively coupled plasma mass spectrometry (Cu, As, Cd, Pb) with an AURORA M90 Spectrometer (BRUKER CAM, Bremen, Germany) and ICP MS 7900 (AGILENT, Santa Clara, CA, USA) and inductively coupled plasma atomic emission spectrometry (Cr, Zn, Mn, Mg) using ICP OES 5100 and ICP OES 5110 Analyzers (AGILENT, Santa Clara, CA, USA) [53]. Standards TM 15.3, TM 25.5, TM 25.6, TM DA 64.3, and GBW 07703 were used to determine potential toxic elements in plants. The obtained values of potentially toxic elements were compared with the limit values for sandy-aluminous soils and for the soil–plant relationship set by Act No. 220/2004 Coll. [54].
Soil contamination was assessed using the following pollution indices: index of geoaccumulation (Igeo), enrichment factor (EF), contamination factor (Cf), and degree of contamination (Cd).
The index of geoaccumulation (Igeo) makes it possible to determine the level of soil contamination by individual potentially toxic elements on the basis of their concentration in a soil sample and their geochemical background values. Igeo was calculated according to Müller [55]: Igeo = log2(Cn/1.5Bn), where Cn represents the content of the selected potentially toxic element in the sample and Bn is the background value of the given potentially toxic element [56]. Based on Igeo values, the level of contamination can be characterized as follows: Igeo ≤ 0 (uncontaminated), 0 < Igeo < 1 (uncontaminated to moderately contaminated), 1 ≤ Igeo < 2 (moderately contaminated), 2 ≤ Igeo < 3 (moderately to heavily contaminated), 3 ≤ Igeo < 4 (heavily contaminated), 4 ≤ Igeo < 5 (heavily to extremely contaminated), and Igeo ≥ 5 (extremely contaminated).
The enrichment factor (EF), which allows the assessment of the level of anthropogenic activity intensity and the risk of contamination, was calculated according to Buat-Menard and Chesselet [57], using Mn as the reference element: EF =   c n   ( s a m p l e ) c r e f ( s a m p l e ) / B n ( b a c k g r o u n d ) B r e f ( b a c k g r o u n d ) , where cn (sample) is the content of the investigated potentially toxic element in the studied environment, cref (sample) is the content of the reference element in the investigated environment, Bn (background) is the content of the examined potentially toxic element in the benchmark environment, and Bref (background) is the content of the reference element in the benchmark environment. The values can be interpreted as follows: EF < 2 (deficiency to minimal enrichment), 2 < EF < 5 (moderate enrichment), 5 < EF < 20 (significant enrichment), 20 < EF < 40 (very high enrichment), and EF > 40 (extremely high enrichment).
The contamination factor (Cf) and degree of contamination (Cd), which determine soil quality and soil contamination level based on the average content of potentially toxic elements, were calculated according to Håkanson [58]: C f = C i B n i , where Ci is the average content of the selected potentially toxic element in the sample and Bin is the background value of the given potentially toxic element for soils SR [56]. The interpretation of Cf values is as follows: Cf < 1 (low contamination), 1 ≤ Cf < 3 (moderate contamination), 3 ≤ Cf < 6 (considerable contamination), and Cf > 6 (very high contamination). The sum of all contamination factors of the individual potentially toxic elements expresses the degree of contamination (Cd): Cd = i = 1 n C f , where Cf represents the contamination factor of the selected potentially toxic element and n is the number of analyzed elements. Cd values are classified as follows: Cd < 8 (low degree of contamination), 8 ≤ Cd < 16 (moderate degree of contamination), 16 ≤ Cd < 32 (considerable degree of contamination), and Cd > 32 (very high degree of contamination) [58].
Within plant species, their phytoremediation ability was investigated using the bioconcentration factor (BCF) and translocation factor (TF). The BCF expresses the ability of plants to accumulate potentially toxic elements and was determined according to Baker [59]: BCF = = C v C n , where Cv represents the content of the selected potentially toxic element in the chosen part of the plant and Cn is the content of the potentially toxic element in the soil sample. The values are evaluated as follows: BCF < 1 (excluder, the potentially toxic element is immobilized in the root), BCF = 1 (indicator, the content of the potentially toxic element in the plant reflects the situation in the external environment), and BCF > 1 (accumulator, the potentially toxic element is concentrated in the above-ground parts of the plant). The TF allows quantifying the part of the plant where the selected potentially toxic element is dominantly accumulated [60]: TF = C a g C u g , where Cag is the content of the selected potentially toxic element in the above-ground part of the plant and Cug is the content of the selected potentially toxic element in the underground part of the given plant species. If the TF value is < 1, the selected potentially toxic element tends to accumulate in the underground parts of the plant. If TF > 1, the selected potentially toxic element accumulates predominantly in the above-ground parts of the plant and the plant is deemed to be a potentially suitable accumulator in phytoremediation.
The results were logarithmically transformed and statistically processed using IBM SPSS Statistics 26, where descriptive statistics and correlation analysis were resorted to, and PAST 4, where a hierarchical cluster analysis (HCA) and principal component analysis (PCA) were performed.

3. Results and Discussion

3.1. Soil Reaction, Soil Organic Matter, and Total Content of Potentially Toxic Elements in Soil

Soil response is one of the factors that play an important role in the retention, mobilization, and migration of potentially toxic elements in soil [61,62,63]. According to Fuller [64], in acidic soils (pH 4.2–6.6), the elements Cd, Ni, and Zn are highly mobile, Cr is moderately mobile, and Cu and Pb are practically immobile. While in neutral to alkaline soils (pH 6.7–7.8), Cr is highly mobile, Cd and Zn are moderately mobile, and Ni is immobile. Increased mobility makes potentially toxic elements available to plants, resulting in greater toxicity. The pH values in Jelšava-Lubeník ranged from 7.0 to 9.3, indicating that the soils in the study area are neutral to strongly alkaline (Table 1). In Košice, the pH values ranged from 5.3 to 9.1, showing that the soils in this area are strongly acidic to strongly alkaline. Similar findings are reported in the studies of Yang et al. [65], Štofejova et al. [66], Fazekaš et al. [67], and Hronec and Adamišin [68], who confirmed a strong alkalization of the soil in the areas of magnesite mining and processing.
The current research clearly confirms the key role of organic carbon in the sorption of inorganic contaminants [69,70,71]. SOM values in Jelšava-Lubeník ranged from 3.33 ± 1.66% (median ± standard deviation), which means that the humus supply in the soils is medium to very acceptable. SOM values in Košice ranged from 1.91 ± 0.57% (median ± standard deviation), which means that the humus supply in soils is very small to acceptable (Table 1).
The total content of potentially toxic elements in Jelšava-Lubeník and Košice, expressed by descriptive statistics, is given in Table 1. The maximum value of Cr in Jelšava-Lubeník exceeded the legal limit value by 11.33 times and in Košice by 9.74 times. Zhong et al. [72] state that the toxic effect of As in soil is several times higher than that of other potentially toxic elements, and thus increases environmental risks and makes it necessary to pay increased attention to remediation processes. In Košice, the maximum measured value of Ni exceeded the legal limit value by 11.46 times. Limit values for Mn and Mg are not set by law in Slovakia. The average value of Mn in soils in the Slovak Republic is in the range of 2.10–95.27 mg/kg [53]. The maximum value of Mn found in Jelšava-Lubeník was 2817 mg/kg and in the territory of Košice, 1500 mg/kg; Kabata-Pendias [22] states that if the content of Mn in the soil exceeds 1500 mg/kg, toxicity can occur. Average Mg values for Slovak soils are in the range of 200–400 mg/kg. The measured values of Mg in the investigated areas exceeded the average values for the Slovak Republic by several times, while the maximum measured value in Jelšava-Lubeník exceeded the average value by 567 times, and in Košice by 451 times. These findings are consistent with previous studies by Fazekaš et al. [67], Štofejova et al. [66], and Štofejová et al. [73], who found significant soil contamination with these potentially toxic elements in the studied areas, resulting in the formation of Mg(OH)2 crusts and alkalization and salinization of the soil.
The average content of Hg, Cd, Pb, Zn, Cu, and Ni in Jelšava-Lubeník did not exceed the limit values of these potentially toxic elements set by law in the monitored period [54]. In Košice, the average content of As, Hg, Cd, Pb, Zn, and Cu did not exceed the statutory limit values.

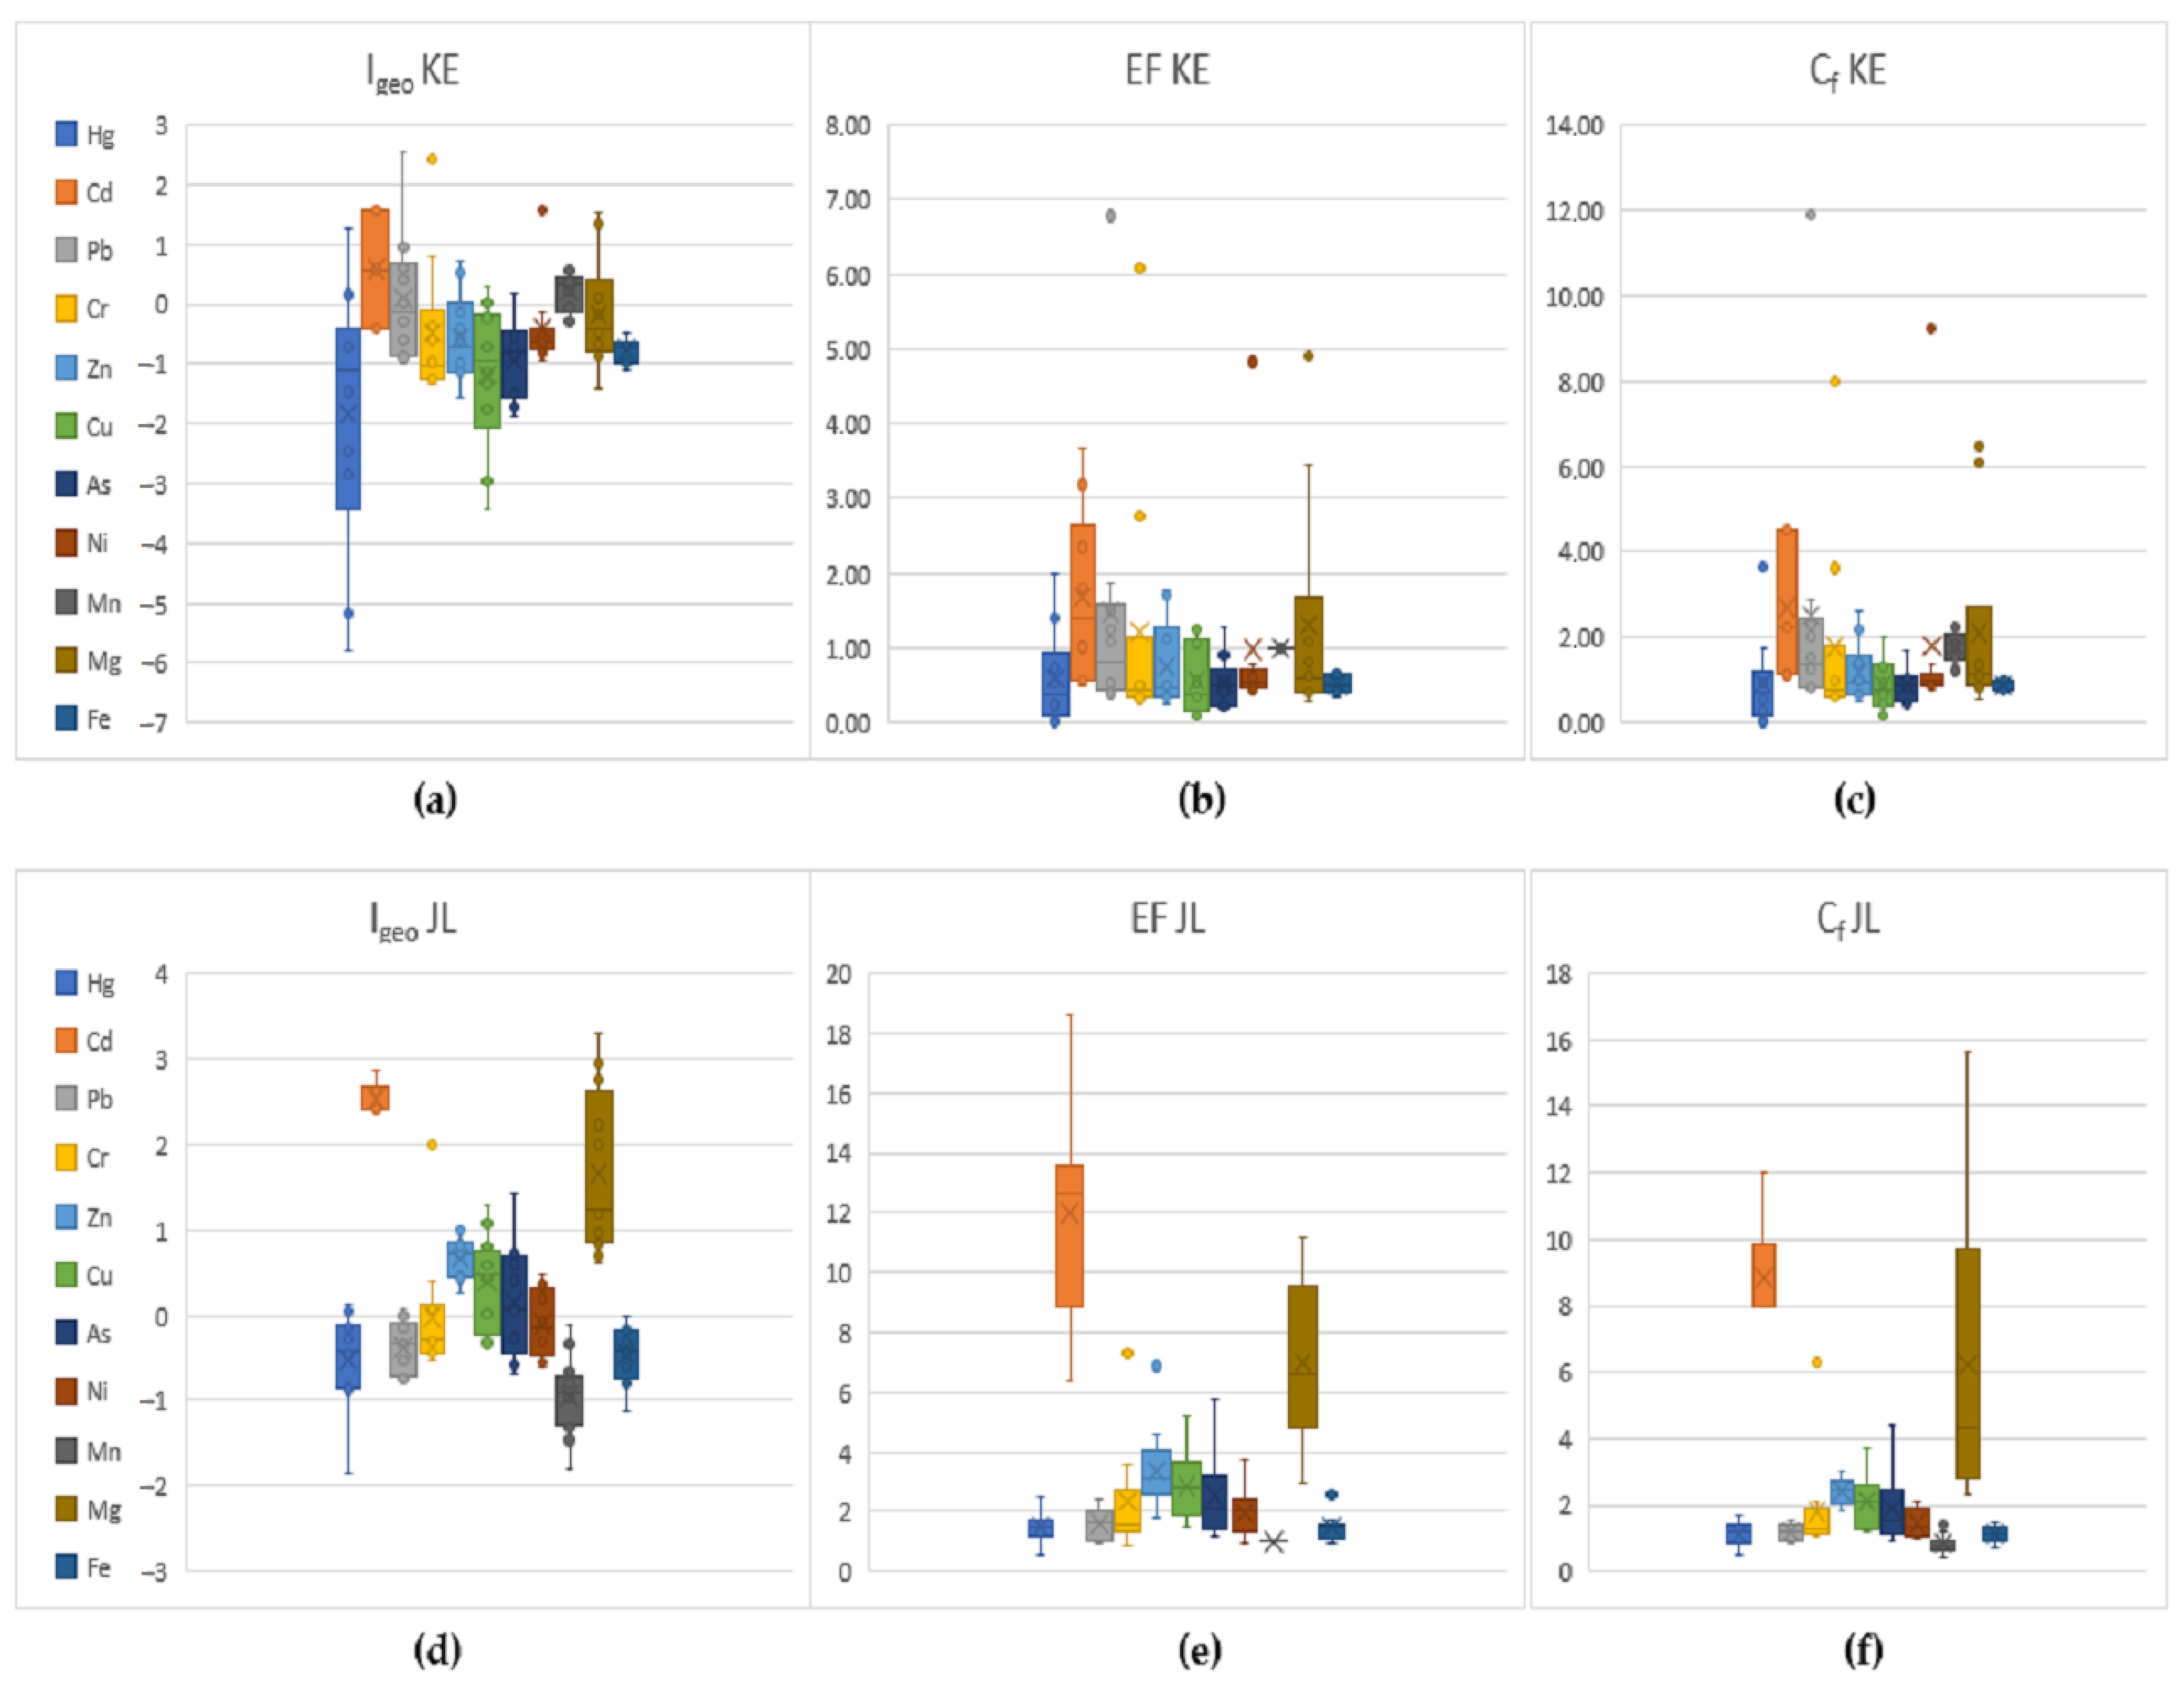
3.2. Assessment of Soil Pollution

Soil pollution in Jelšava-Lubeník and Košice was evaluated using environmental indices (Table 2 and Table 3 and Figure 4). In Jelšava-Lubeník, the geoaccumulation index (Igeo) of Hg, Pb, Ni, Mn, and Fe reached a value lower than 1, indicating a minimal anthropogenic effect evaluated as uncontaminated to moderately contaminated [55]. The same was true for Zn, Cu, and As, with the exception of one site in relation to Zn (JL08), one site in relation to As (JL07), and two sites in relation to Cu (JL09, JL10), where Igeo was assessed as moderately contaminated (1 < Igeo < 2). Additionally, in the case of Cr, Igeo was < 1, except for one site (JL07), where Igeo was evaluated as moderately to heavily contaminated. Moderate to heavy contamination (2 < Igeo < 3) was recorded for Cd in all sites. In the case of Mg, the Igeo values were in the range of 0.61–3.31. These values were evaluated as uncontaminated to heavily contaminated. Based on the average Igeo values, the content of potentially toxic elements increases in the order of Mn < Hg < Fe < Pb < Ni < Cr < As < Cu < Zn < Mg < Cd. The enrichment factor (EF) makes it possible to assess the intensity level of anthropogenic activities, and if EF values are < 2, the minimum enrichment can be attributed to natural causes or to the fluctuation of the content of potentially toxic elements in the soil [57]. Significant enrichment (5 < EF < 20) was confirmed for Cd and Mg in almost all localities. For other elements, values ranged from deficiency or minimal enrichment (EF < 2) to moderate enrichment (2 < EF < 5). The most significant enrichment based on the average values of EF was found in the order of Cd > Mg > Zn > Cu > As > Cr > Ni > Pb > Fe > Hg > Mn.
In Košice, Igeo achieved values of less than 1 for Zn, Cu, As, Mn, and Fe, which led to its assessment as being uncontaminated to moderately contaminated [55]. This also applied to Hg, Ni, and Mg, except at one site for Hg (KE07), one site for Ni (KE04), and two sites for Mg (KE04, KE05). The Igeo for Cd was in the range of −0.42–1.57, which was evaluated as being uncontaminated to moderately contaminated. Moderate to heavy contamination (2 < Igeo < 3) was confirmed at one site in the case of Pb and Cr (KE04). Based on the average Igeo values, the content of potentially toxic elements increased in the order of Hg < Cr < Fe < Cu < As < Mg < Zn < Pb < Ni < Cd < Mn. EF values were assessed from deficiency to minimal enrichment in almost all potentially toxic elements at the examined localities. In the case of Cd, Ni, and Mg, values corresponding to moderate enrichment were also found (2 < EF < 5). For Pb and Cr, significant enrichment was recorded at one site (KE04; 5 < EF < 20). Similar findings regarding elevated Igeo and EF values in mining and industrial areas have been noted in previous studies by Wang et al. [74], Dolezalova-Weissmanova et al. [75], and Fazekašová et al. [76]. The most significant enrichment was found in the order of Cd > Mn > Ni > Pb > Zn > Mg > Cu > As > Fe > Cr > Hg.
A very high contamination factor (Cf ≥ 6) was recorded in all the sites in Jelšava-Lubeník for Cd, in the case of locality JL07, in the order of Cd > Cr (Table 4). In the case of Cu, a considerable contamination factor (3 ≤ Cf <6) was recorded in localities JL09 and JL10, for As in JL07, and for Zn in JL08. Moderate contamination levels (1 ≤ Cf <3) of the examined potentially toxic elements were recorded in most localities. The degree of contamination was considerable (16 ≤ Cd < 32) for all sites, except JL01 and JL02, where a moderate degree of contamination was recorded (8 ≤ Cd < 16). The maximum value was found in JL07 (29.88).
In Košice, the very high contamination factor (Cf ≥ 6) was found at the site KE04 in the order of Pb > Cr (Table 5). A considerable contamination factor (3 ≤ Cf < 6) was recorded for Cd at sites KE04 and KE08, at site KE05 in the order of Cd > Cr, and at KE07 in the order of Cd > Hg. A considerable degree of contamination (16 ≤ Cd < 32) was recorded at KE04 with a value of 31.68. A moderate degree of contamination was found at sites KE05, KE07, KE08, and KE09 (8 ≤ Cd < 16). A low degree of contamination was recorded at KE01, KE02, KE03, KE06, and KE10.

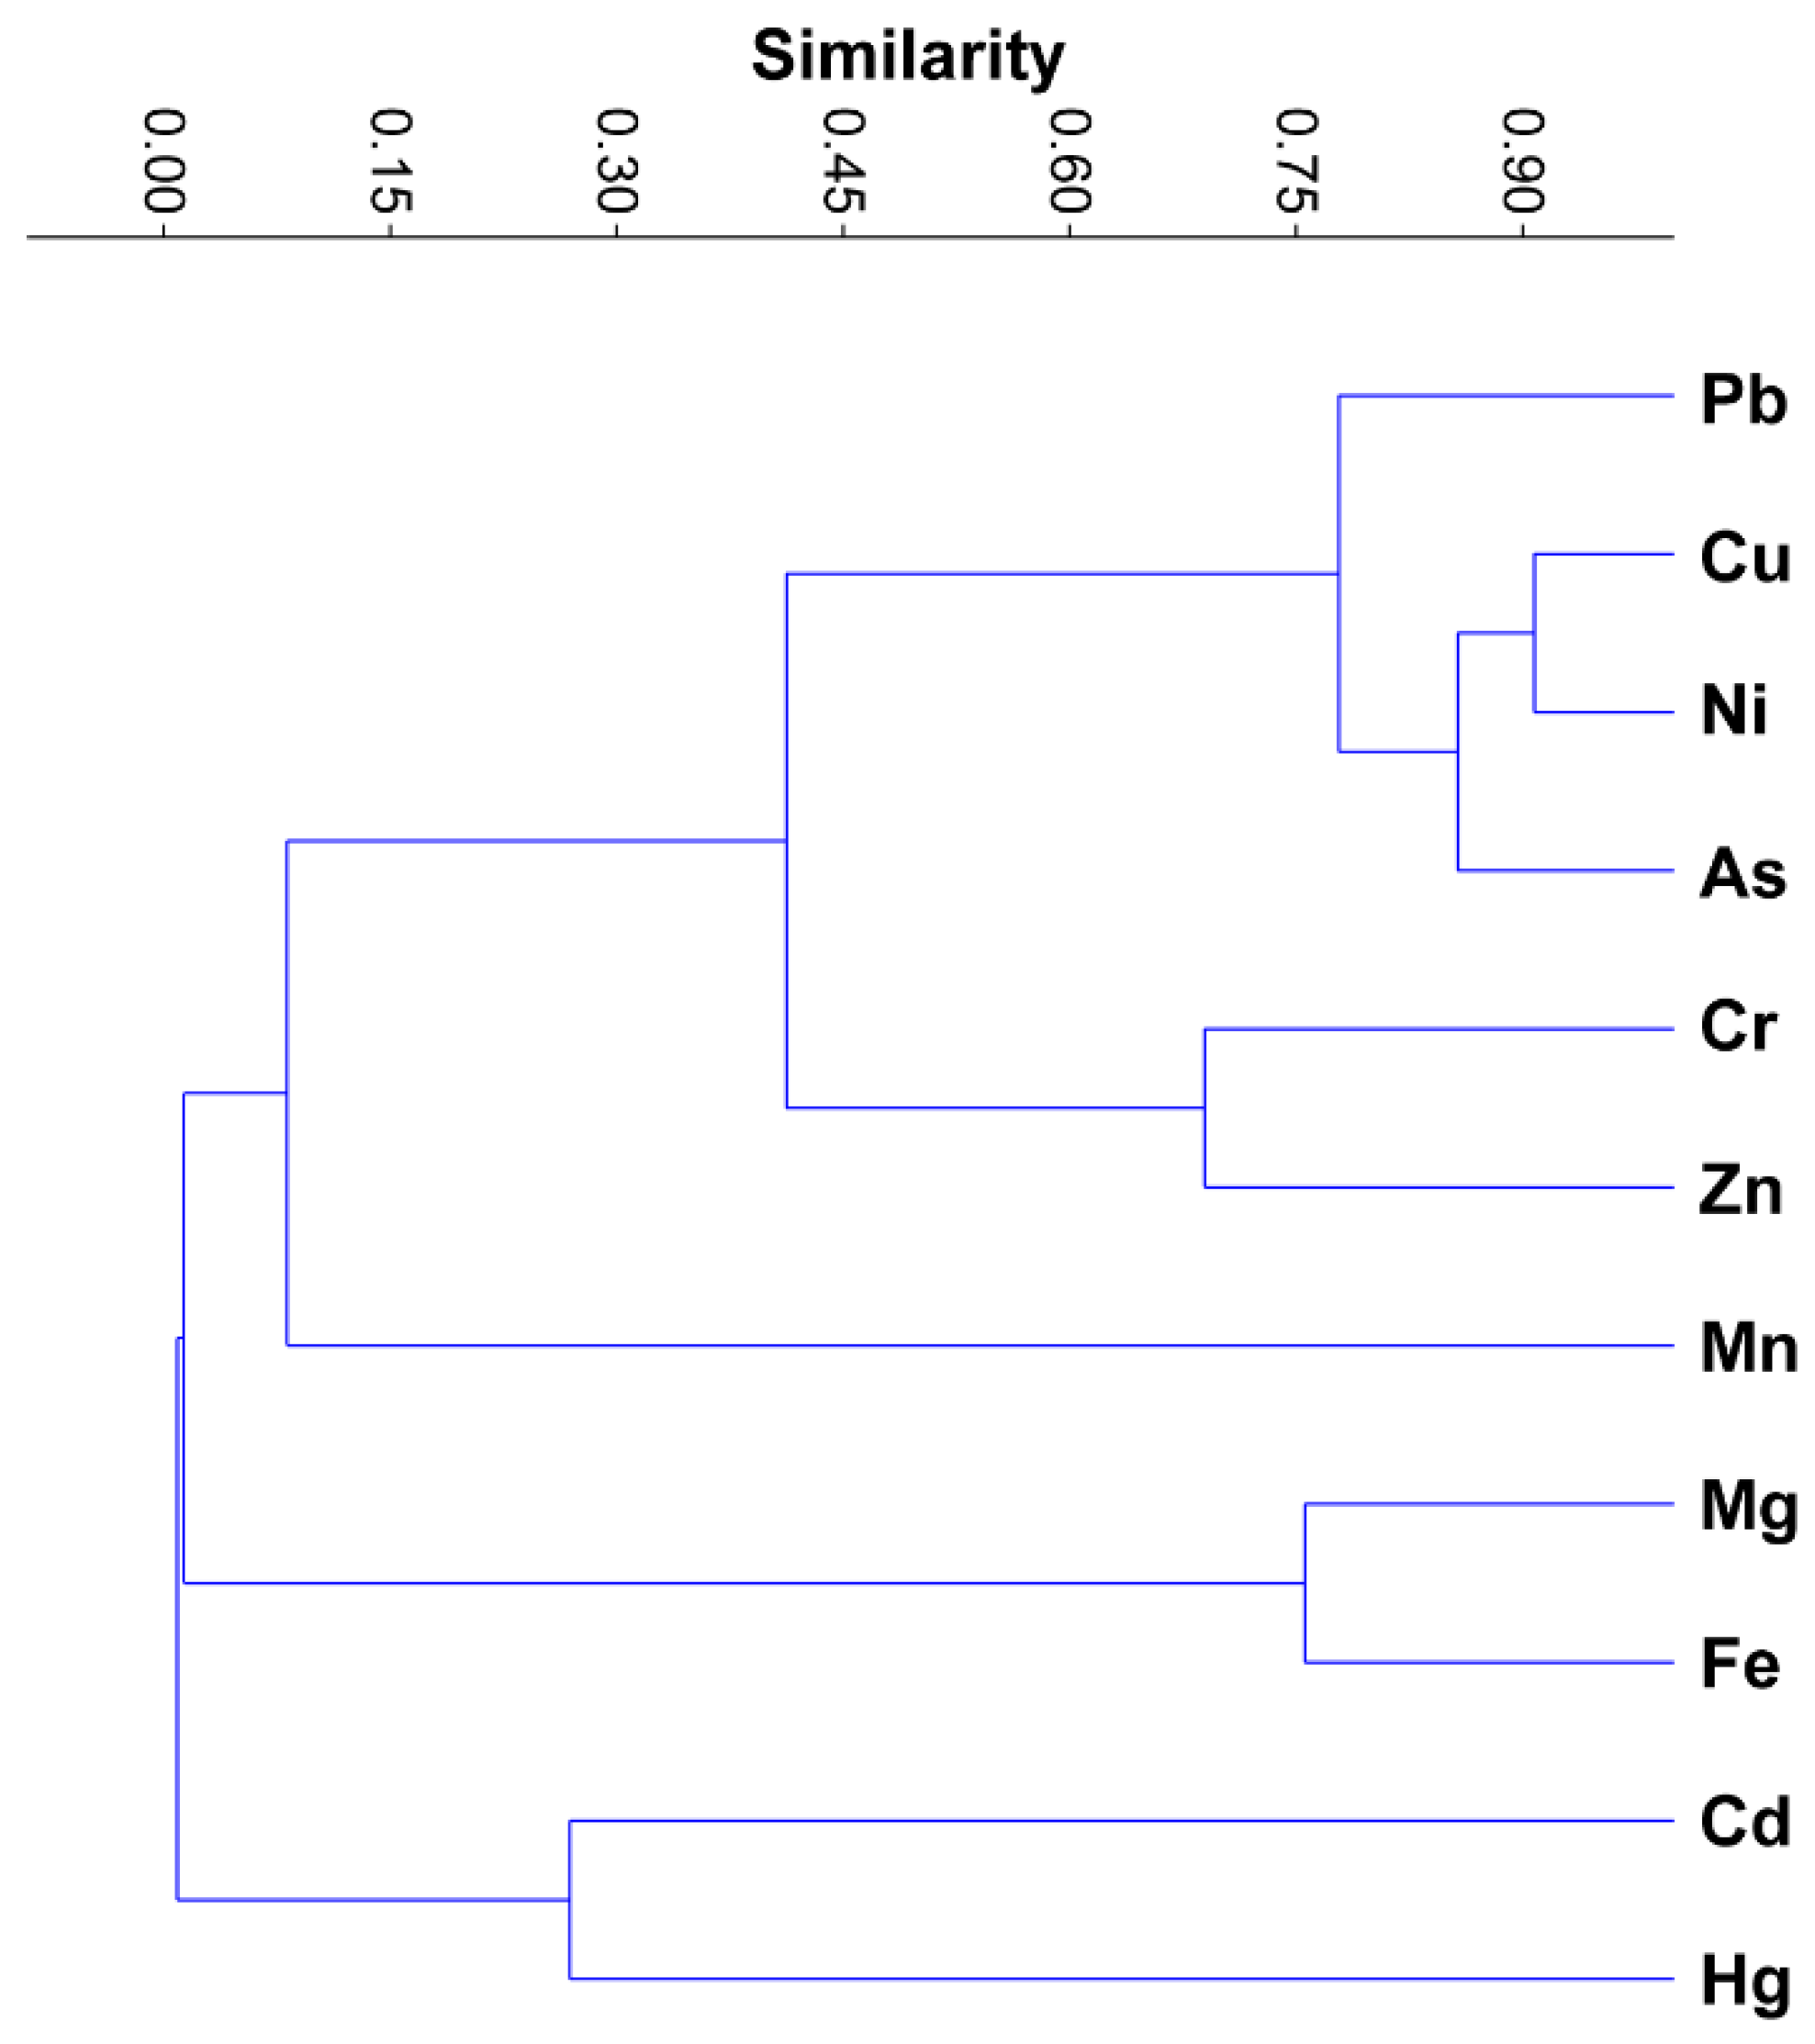
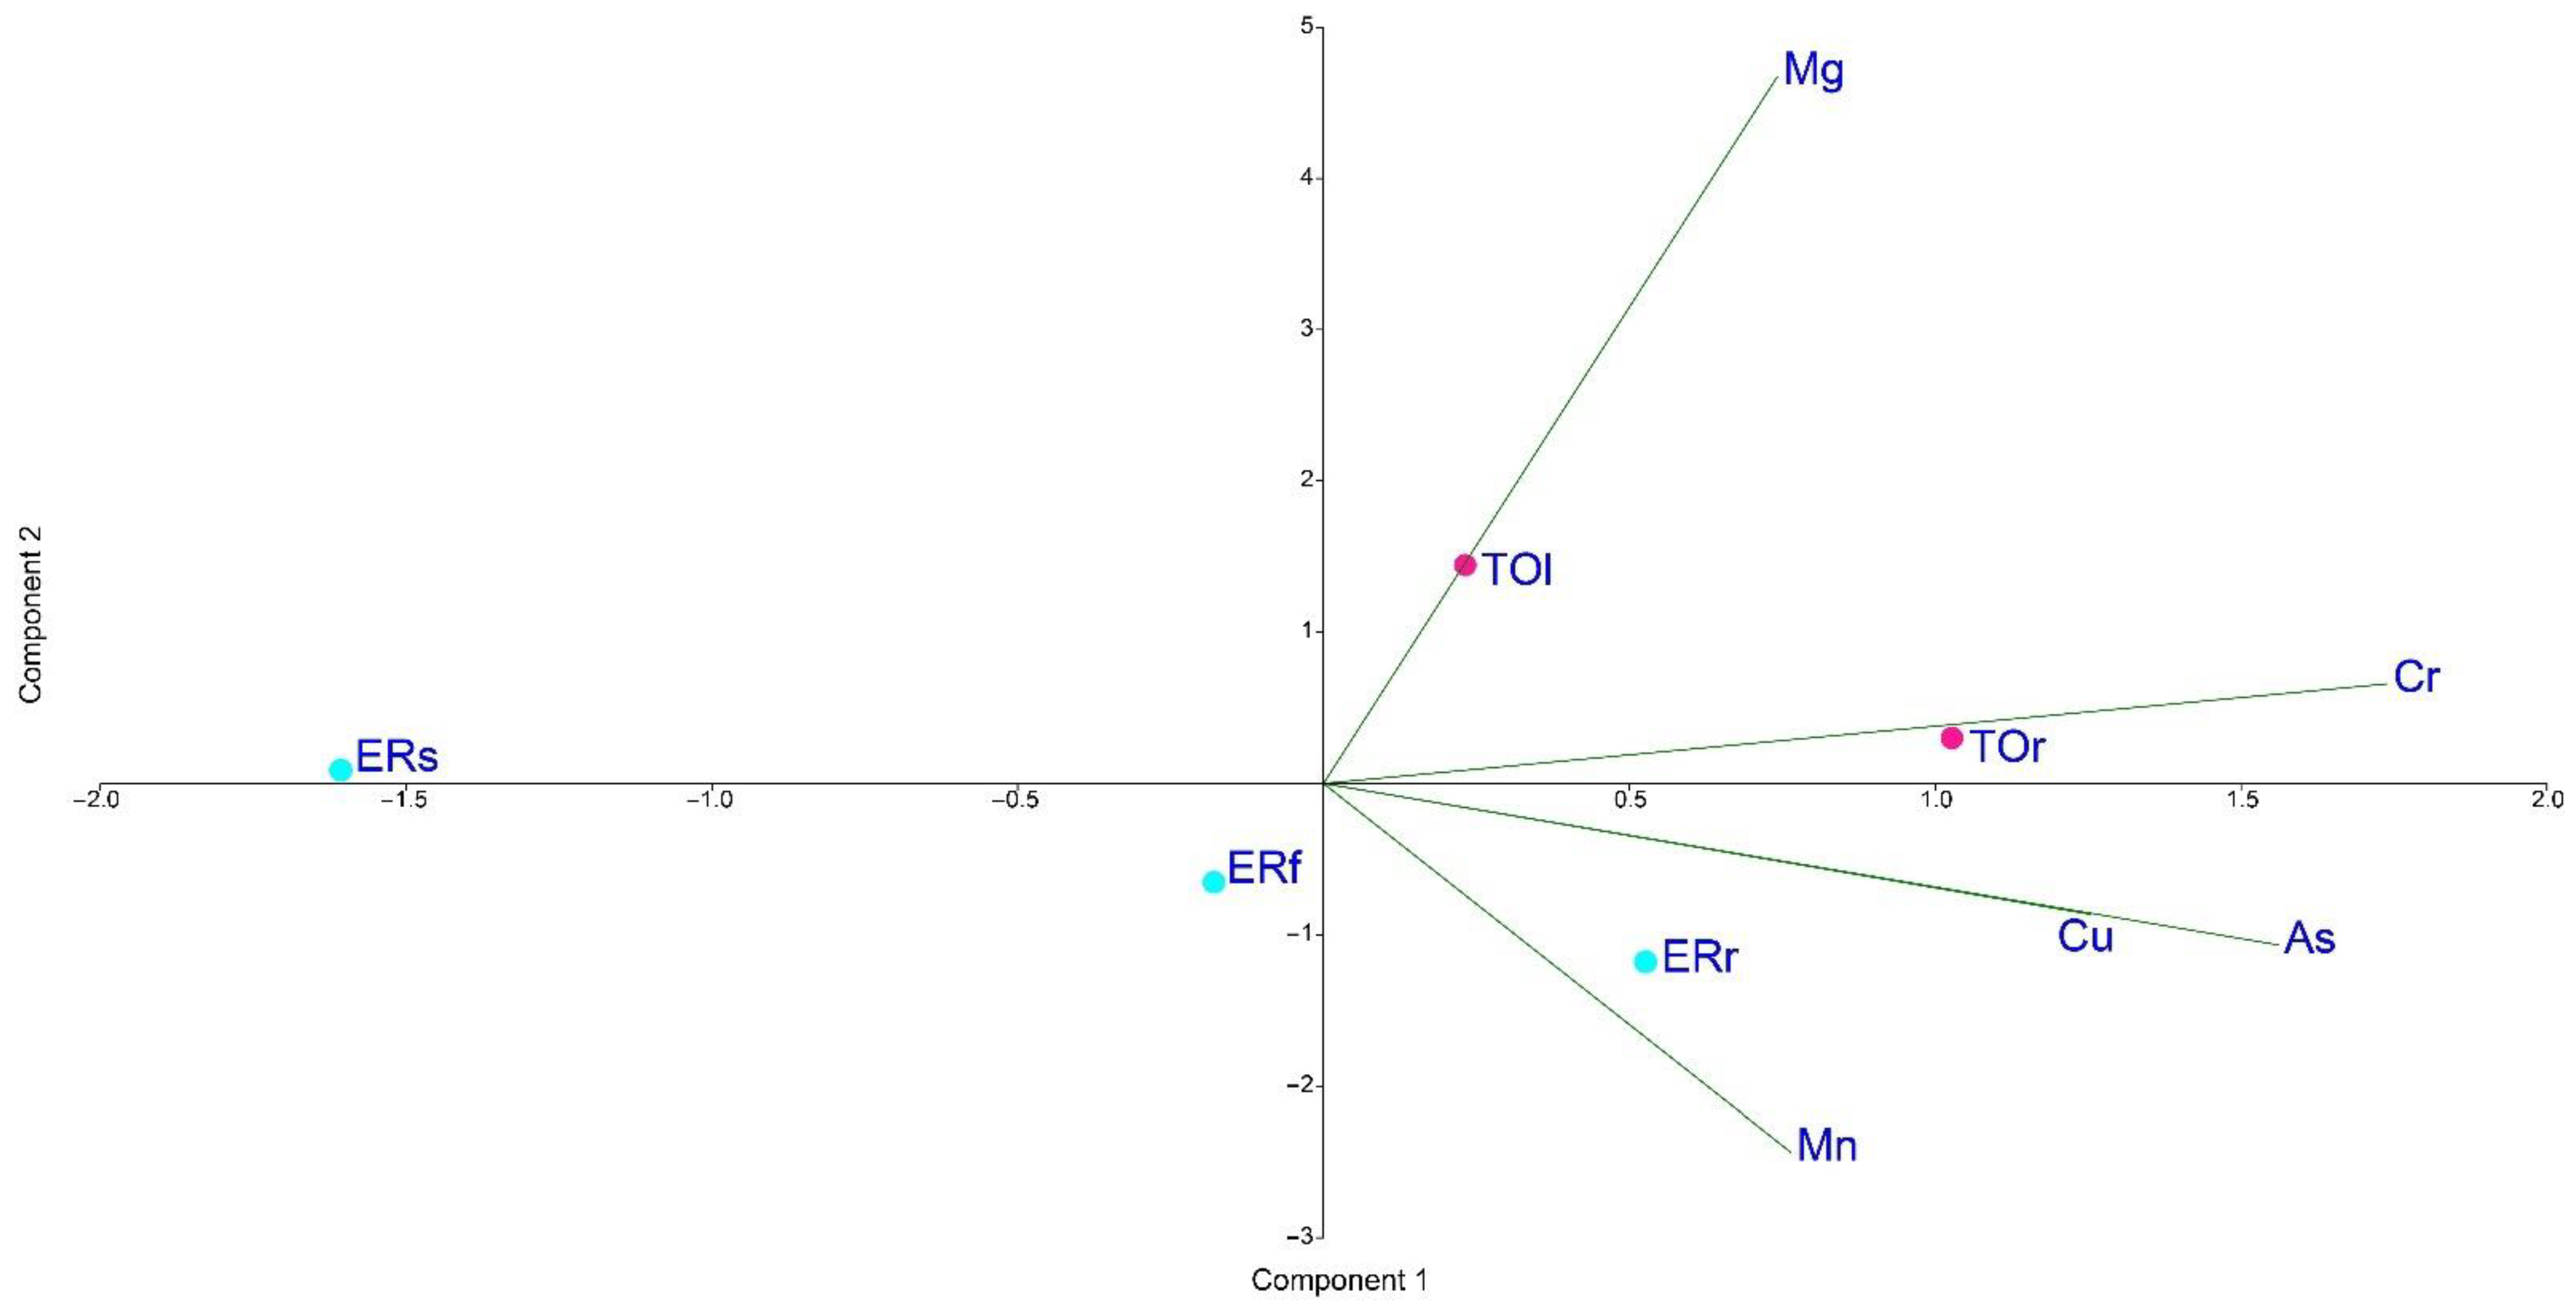
3.3. Correlation and Hierarchical Cluster Analyses

Correlations between potentially toxic elements and selected soil parameters (pH, redox potential—Eh, soil organic matter—SOM) in Jelšava-Lubeník are shown in Table 6. Based on Spearman’s rho coefficient at significance levels p < 0.05 and p < 0.01, significant positive correlations were found between Cr-Zn, As-Cu, As-Ni, As-Fe, Mn-Mg, Mn-Cu, Mn-Fe, Mn-pH, and Mn-SOM, Mg-Fe, Mg-pH, Mg-SOM, and Hg-Pb. Copper positively correlated with Ni, Fe, pH, and SOM. Other correlations was found between Ni-Fe, Fe-pH, Fe-SOM, and pH-SOM. A significantly negative correlation was noted between Hg-Eh, pH-Eh, and Eh-SOM.
For Košice, correlations are shown in Table 7. Only positive significant correlations were found in this area, specifically between Cr-Mg, Cr-Ni, Cr-Fe, and Cr-Eh, between As-Mg, As-Zn, As-Cu, As-Ni, and As-Fe, between Mn-Fe, Mg-Zn, Mg-Cu, Mg-Ni, and Mg-pH, and between Hg-Cu, Pb-Zn, Zn-Cu, Cu-Ni, Cu-Fe, and Ni-Fe. Positive correlations between Mg and pH in magnesite mining and processing areas have also been confirmed in previous studies by Yang et al. [65] and Štofejová et al. [66]. High correlation coefficients between the examined potentially toxic elements may indicate a similar origin of pollution sources, caused by significant anthropogenic interventions due to industrial activities. They can be characterized by a similar process of migration and transformation through physicochemical environmental conditions. Low or negative correlation coefficients may indicate different sources of pollution that are closely related to natural or geogenic processes [75,77].
A dendrogram of the hierarchical cluster analysis of potentially toxic elements is shown in Figure 5 for Jelšava-Lubeník and in Figure 6 for Košice. The hierarchical cluster analysis identified several groups of associations between potentially toxic elements in relation to the area and confirmed that the elements in one group are associated with the same pollution source. In Jelšava-Lubeník, the first group consisted of the elements Cd-Hg, the second group of elements Mg-Fe, the third group solely of Mn, the fourth group of Zn-Cr, and the fifth group of Pb-Cu, Ni, As. Five groups were also identified in Košice. The first group consisted of Cd-Hg, the second group of Mg-Fe, the third group of Mn, the fourth group of Zn-Cr, and the fifth group of As-Cu, Ni, and Pb. The correlation analysis of the Jelšava-Lubeník area and the Košice area also identified similar relationships between potentially toxic elements, which may indicate mainly anthropogenic sources of the origin of potentially toxic elements in the soil. The high content of Mn, Mg, and Fe can come from the weathering of basic materials but also from anthropogenic sources, which are related to the intensity of mining and processing of magnesite. Similar findings have also been reported by Dolezalova-Weissmanova et al. [75] and Štofejová et al. [66].

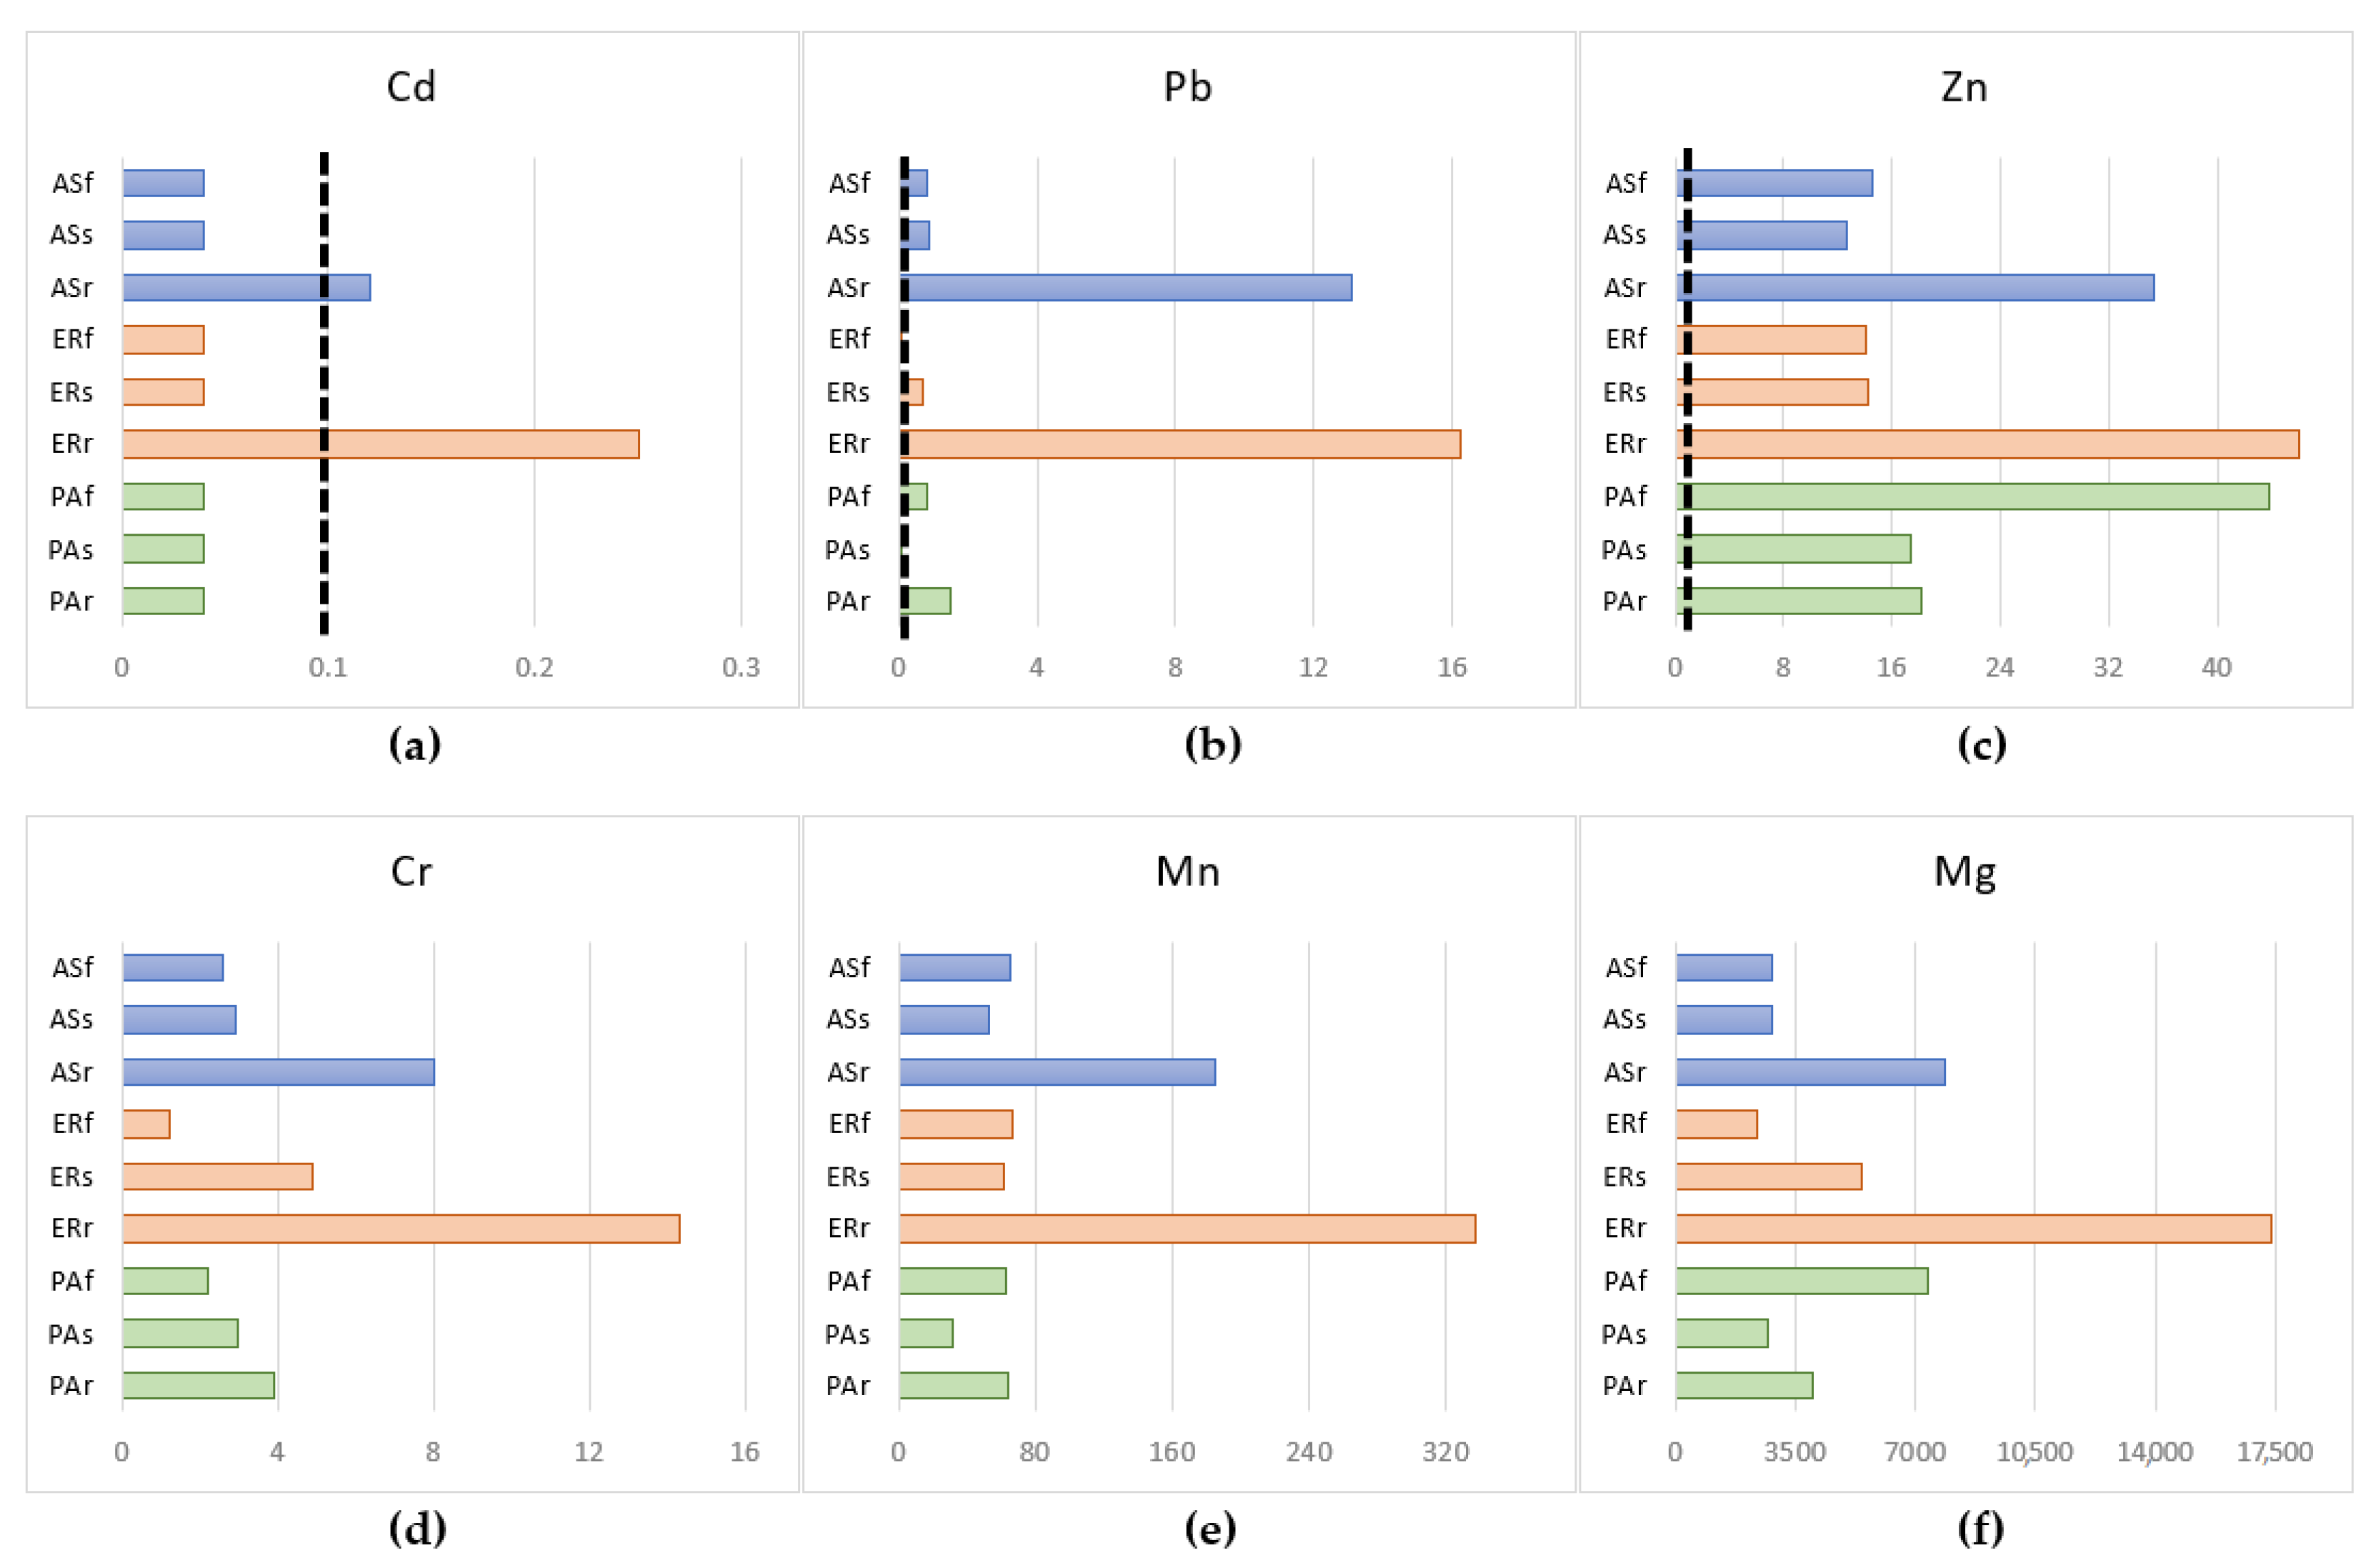
3.4. Total Content of Potentially Toxic Elements in Plants

The total content of potentially toxic elements in the above-ground and underground parts of plants is recorded in Figure 7 for Elytrigia repens, Agrostis stolonifera, and Phragmites australis in Jelšava-Lubeník, and in Figure 8 for Elytrigia repens and Taraxacum officinale in Košice. The Cd content exceeded the legal limit [54] in the roots of E. repens (0.25 mg/kg of dry matter) and A. stolonifera (0.12 mg/kg of dry matter). The measured Pb values exceeded the limit values in all plant species, with the highest content recorded in the roots of E. repens (16.20 mg/kg of dry matter) and A. stolonifera (13.10 mg/kg of dry matter). The maximum value exceeded the limit value by 162 times. These findings are confirmed by Siedlecka et al. [78], who state that Pb tends to accumulate in plant roots and is toxic. Similar findings for Cd, Cr, and Pb are reported by Minkina et al. [79]. Although Zn is an essential component for plants, it can cause toxicity at high concentrations [80]. The Zn content exceeded the statutory values for all examined plants, with the highest content being found in E. repens roots (46.00 mg/kg of dry matter), P. australis flowers (43.90 mg/kg of dry matter), and A. stolonifera roots (35.30 mg/kg of dry matter). The highest measured value exceeded the limit value by 23 times. The law does not set any limit values for Cr, but Allen [81] states that it is toxic to plants at concentrations higher than 0.50 mg/kg. In Jelšava-Lubeník, Cr values were in the range of 1.20–14.30 mg/kg, while the highest measured value was in the roots of E. repens. In the case of Košice, Cr values were in the range of 2.20–27.50 mg/kg, with the highest content in T. officinale roots. The measured Cu values exceeded the limit values for all plants in Košice, while the highest measured values were in the roots of E. repens (31.70 mg/kg of dry matter) and T. officinale (30.80 mg/kg of dry matter). Yruela [82] states that, although Cu is necessary for plant growth, it has toxic effects at elevated levels. The increased Cu content in plants is attributed not only to natural origins but also to anthropogenic activities, such as mining, smelting, ore processing, and agriculture, as a result of which Cu is released into the environment. The measured As values exceeded the limit values set by law by several times. The highest As content was found in the roots of T. officinale (4.20 mg/kg of dry matter) and E. repens (3.11 mg/kg of dry matter), which is consistent with the study by Williams et al. [83], who report that As is taken up and allocated predominantly in plant roots. The average Mn content in plants in Jelšava-Lubeník was 103.11 mg/kg with the highest content in E. repens roots (337.00 mg/kg of dry matter) and in Košice 90.70 mg/kg with the highest content also in E. repens roots (183.00 mg/kg of dry matter). Kabata-Pendias and Mukherjee [84] report that Mn is toxic to plants at 500 mg/kg, with some types of hyperaccumulators being able to accumulate up to 10,000 mg/kg. The Mg content in Jelšava-Lubeník was in the range of 2420.00–17,400.00 mg/kg, with the highest content being found in the order of E. repens root > A. stolonifera root > P. australis flower. In Košice, Mg values were in the range of 682.00–4347.00 mg/kg, while the highest content was found in the order of T. officinale leaf > T. officinale root > E. repens root. The high content of Mg in the investigated plant species in the areas of magnesite mining and processing is also confirmed by previous studies done by Zeleňáková et al. [85], Hronec and Hajdúk [86], and Fazekaš et al. [67]. Based on the obtained results, it is possible to support the claim that the investigated dominant plant species in environmentally polluted areas can accumulate high concentrations of monitored potentially toxic elements without showing more serious burden or damage. It can be stated that these plant species could potentially be used in phytoremediation processes. The results of the bioconcentration factor (BCF) and translocation factor (TF) confirmed that P. australis and T. officinale appear to be suitable accumulators in the phytoextraction process, as they can not only accumulate potentially toxic elements in the roots but also transport them to the above-ground parts, especially Cd, Cr, and Mg (Figure 9). The bioconcentration factor in E. repens and A. stolonifera confirmed that these species accumulate and immobilize high concentrations of potentially toxic elements, especially in the roots, which confirms the suitability of their use in phytostabilization processes.
Our findings are also confirmed by the results of the principal component analysis (PCA) shown in Figure 10 and Figure 11.

4. Conclusions

Experimental research was focused on the evaluation of the environmental risks of soil and plant contamination in two areas of magnesite mining and processing in the Slovak Republic. Based on the obtained results, it can be stated that:
The soil reaction in the studied areas indicates a strong alkalization of the soil;
Soils in the Jelšava-Lubeník area are significantly contaminated with Cr, As, Mn, and Mg. Based on the average Igeo values, the content of potentially toxic elements increases in the order of Mn < Hg < Fe < Pb < Ni < Cr < As < Cu < Zn < Mg < Cd. The most significant enrichment based on the average values of EF was found in the order of Cd > Mg > Zn > Cu > As > Cr > Ni > Pb > Fe > Hg > Mn. The observed Cf and Cd values indicate a high degree of soil contamination, mainly for Cd and Cr;
In the territory of Košice, soils are significantly contaminated with Cr, Mn, Mg, and Ni. Based on the average values of Igeo, the content of potentially toxic elements increases in the order of Hg < Cr < Fe < Cu < As < Mg < Zn < Pb < Ni < Cd < Mn. The most significant enrichment was found in the order of Cd > Mn > Ni > Pb > Zn > Mg > Cu > As > Fe > Cr > Hg. Very high Cf was found for Pb and Cr;
The results of correlation and hierarchical cluster analysis showed that high correlation coefficients and groups of associations between potentially toxic elements indicate a similar origin of pollution sources, which is caused by significant anthropogenic interventions due to magnesite mining and processing near industrial areas;
The examined dominant plant species in environmentally polluted areas can accumulate high concentrations of monitored potentially toxic elements without more serious burden or damage. The results of the bioconcentration factor (BCF) and translocation factor (TF) confirmed that P. australis and T. officinale appear to be suitable accumulators in the phytoextraction process, as they can accumulate potentially toxic elements in the roots and at the same time transport them to the above-ground parts, especially Cd, Cr, and Mg. In the case of E. repens and A. stolonifera, it was confirmed that these species accumulate and immobilize high concentrations of potentially toxic elements, especially in the roots, which confirms the suitability of their use in phytostabilization processes.

Author Contributions

Conceptualization, L.Š., J.F. and D.F.; methodology, L.Š., J.F. and D.F.; formal analysis, L.Š. and D.F.; investigation, L.Š., J.F. and D.F.; resources, L.Š. and D.F.; data analysis, L.Š. and J.F.; writing—original draft preparation, L.Š., J.F. and D.F.; writing—review and editing, L.Š., J.F. and D.F. All authors have read and agreed to the published version of the manuscript.

Funding

This research was funded by Scientific Grant Agency of Ministry of Education, Science, Research and Sport of the Slovak Republic by VEGA grant number 1/0313/19, VEGA grant number 1/0309/22, and by Slovak Research and Development Agency by grant APVV-20-0140.

Institutional Review Board Statement

Not applicable.

Informed Consent Statement

Not applicable.

Data Availability Statement

Not applicable.

Acknowledgments

The study was supported by the VEGA 1/0313/19 ecosystem approach as a parameter of modern environmental research of contaminated areas, VEGA 1/0309/22 environmental aspects of ecosystem sustainability in risk areas, and APVV-20-0140 possibilities of critical raw material recovery by advanced methods of mining waste processing.

Conflicts of Interest

The authors declare no conflict of interest.

References

  1. Foley, J.A.; Ramankutty, N.; Brauman, K.A.; Cassidy, E.S.; Gerber, J.S.; Johnston, M.; Mueller, N.D.; O’Connell, C.; Ray, D.K.; West, P.C.; et al. Solutions for a cultivated planet. Nature 2011, 478, 337–342. [Google Scholar] [CrossRef] [PubMed] [Green Version]
  2. He, Z.; Shentu, J.; Yang, X.; Baligar, V.C.; Zhang, T.; Stoffella, P.J. Heavy metal contamination of soils: Sources, indicators, and assessment. J. Environ. Indust. 2015, 9, 17–18. [Google Scholar]
  3. Xu, J.; Liu, C.; Hsu, P.C.; Zhao, J.; Wu, T.; Tang, J.; Liu, K.; Cui, Y. Remediation of heavy metal contaminated soil by asymmetrical alternating current electrochemistry. Nat. Commun. 2019, 10, 1–8. [Google Scholar] [CrossRef] [PubMed] [Green Version]
  4. Tang, J.; Zhang, J.; Ren, L.; Zhou, Y.; Gao, J.; Luo, L.; Yang, Y.; Peng, Q.; Huang, H.; Chen, A. Diagnosis of soil contamination using microbiological indices: A review on heavy metal pollution. J. Environ. Manag. 2019, 242, 121–130. [Google Scholar] [CrossRef]
  5. Pelica, J.; Barbosa, S.; Reboredo, F.; Lidon, F.; Pessoa, F.; Calvão, T. The paradigm of high concentration of metals of natural or anthropogenic origin in soils—The case of Neves-Corvo mine area (Southern Portugal). J. Geochem. Explor. 2018, 186, 12–23. [Google Scholar] [CrossRef]
  6. Kronbauer, M.A.; Izquierdo, M.; Dai, S.; Waanders, F.B.; Wagner, N.J.; Mastalerz, M.; Hower, J.C.; Oliveira, M.L.S.; Taffarel, S.R.; Bizani, D.; et al. Geochemistry of ultra-fine and nano-compounds in coal gasification ashes: A synoptic view. Sci. Total Environ. 2012, 456, 95–103. [Google Scholar] [CrossRef]
  7. Yenilmez, F.; Kuter, N.; Emil, M.K.; Aksoy, A. Evaluation of pollution levels at an abandoned coal mine site in Turkey with the aid of GIS. Int. J. Coal Geol. 2011, 86, 12–19. [Google Scholar] [CrossRef]
  8. Bai, Z.K.; Fu, M.C.; Zhao, Z.Q. Soil environmental problems in mining area. Ecol. Environ. 2006, 15, 1122–1125. [Google Scholar]
  9. Liu, X.; Bai, Z.; Zhou, W.; Cao, Y.; Zhang, G. Changes in soil properties in the soil profile after mining and reclamation in an opencast coal mine on the Loess Plateau, China. Ecol. Eng. Times. 2017, 98, 228–239. [Google Scholar] [CrossRef] [Green Version]
  10. Loupasakis, C.; Angelitsa, V.; Rozos, D.; Spanou, N. Mining geohazards-land subsidence caused by the dewatering of opencast coal mines: The case study of the Amyntaio coal mine, Florina, Greece. Nat. Hazards. 2014, 70, 675–691. [Google Scholar] [CrossRef]
  11. Zhang, Y.; Lu, W.; Yang, Q. The impacts of mining exploitation on the environment in the Changchun-Jilin-Tumen economic area, Northeast China. Nat. Hazards. 2015, 76, 1019–1038. [Google Scholar] [CrossRef]
  12. Navrátil, T.; Minařík, L. Trace Elements and Contaminants; Eolss Publishers: Oxford, UK, 2002. [Google Scholar]
  13. Bhaskar, C.V.; Kumar, K.; Nagendrappa, G. Assessment of heavy metals in water samples of certain locations situated around Tumkur, Karnataka, India. E-J. Chem. 2010, 7, 349–352. [Google Scholar] [CrossRef] [Green Version]
  14. Keshavarzi, A.; Kumar, V. Spatial distribution and potential ecological risk assessment of heavy metals in agricultural soils of Northeastern Iran. Geol. Ecol. Landsc. 2020, 4, 87–103. [Google Scholar] [CrossRef] [Green Version]
  15. Panuccio, M.R.; Sorgonà, A.; Rizzo, M.; Cacco, G. Cadmium adsorption on vermiculite, zeolite and pumice: Batch experimental studies. J. Environ. Manag. 2009, 90, 364–374. [Google Scholar] [CrossRef]
  16. Guala, S.D.; Vega, F.A.; Covelo, E.F. The dynamics of heavy metals in plant–soil interactions. Ecol. Modell. 2010, 221, 1148–1152. [Google Scholar] [CrossRef]
  17. Cempel, M.; Nikel, G. Nickel: A review of its sources and environmental toxicology. Pol. J. Environ. Stud. 2006, 15, 375–382. [Google Scholar]
  18. Clemens, S. Toxic metal accumulation, responses to exposure and mechanisms of tolerance in plants. Biochimie 2006, 88, 1707–1719. [Google Scholar] [CrossRef]
  19. Fasani, E.; Manara, A.; Martini, F.; Furini, A.; Dalcorso, G. The potential of genetic engineering of plants for the remediation of soils contaminated with heavy metals. Plant Cell Environ. 2018, 41, 1201–1232. [Google Scholar] [CrossRef]
  20. Naila, A.; Meerdink, G.; Jayasena, V.; Sulaiman, A.Z.; Ajit, A.B.; Berta, G. A review on global metal accumulators-mechanism, enhancement, commercial application, and research trend. Environ. Sci. Pollut. Res. 2019, 26, 26449–26471. [Google Scholar] [CrossRef]
  21. Hall, J.L. Cellular mechanisms for heavy metal detoxification and tolerance. J. Exp. Bot. 2002, 53, 1–11. [Google Scholar] [CrossRef]
  22. Kabata-Pendias, A. Trace Elements in Soils and Plants, 4th ed.; CRC Press: Boca Raton, FL, USA, 2011. [Google Scholar]
  23. Badida, M.; Ladomerský, J.; Králiková, R.; Sobotová, L.; Bartko, L. Základy Environmentalistiky/Basics of Environmental Studies; Elfa s.r.o.: Košice, Slovakia, 2013. [Google Scholar]
  24. Ali, H.; Khan, E.; Sajad, M.A. Phytoremediation of heavy metals-concepts and applications. Chemosphere 2013, 91, 869–881. [Google Scholar] [CrossRef] [PubMed]
  25. Dalcorso, G.; Fasani, E.; Manara, A.; Visioli, G.; Furini, A. Heavy metal pollutions: State of the art and innovation in phytoremediation. Int. J. Mol. Sci. 2019, 20, 3412. [Google Scholar] [CrossRef] [PubMed] [Green Version]
  26. Sheoran, V.; Sheoran, A.; Poonia, P. Role of hyperaccumulators in phytoextraction of metals from contaminated mining sites: A review. Crit. Rev. Env. Sci. Technol. 2011, 41, 168–214. [Google Scholar] [CrossRef]
  27. Wuana, R.A.; Okieimen, F.E. Heavy metals in contaminated soils: A review of sources, chemistry, risks and best available strategies for remediation. Isrn Ecol. 2011, 2011. [Google Scholar] [CrossRef] [Green Version]
  28. Chibuike, G.U.; Obiora, S.C. Heavy Metal Polluted Soils: Effect on Plants and Bioremediation Methods. Appl. Environ. Soil Sci. 2014, 2014. [Google Scholar] [CrossRef] [Green Version]
  29. Shah, V.; Daverey, A. Phytoremediation: A multidisciplinary approach to clean up heavy metal contaminated soil. Environ. Technol. Inno. 2020, 18, 100774. [Google Scholar] [CrossRef]
  30. Aken, B.V.; Correa, P.A.; Schnoor, J.L. Phytoremediation of polychlorinated biphenyls: New trends and promises. Environ. Sci. Technol. 2009, 44, 2767–2776. [Google Scholar] [CrossRef] [Green Version]
  31. Garbisu, C.; Alkorta, I. Basic concepts on heavy metal soil bioremediation. European J. Miner. Process. Environ. Protect. 2003, 3, 58–66. [Google Scholar]
  32. Jacob, J.M.; Karthik, C.; Saratale, R.G.; Kumar, S.S.; Prabakar, D.; Kadirvelu, K.; Pugazhendhi, A. Biological approaches to tackle heavy metal pollution: A survey of literature. J. Environ. Manag. 2018, 217, 56–70. [Google Scholar] [CrossRef]
  33. Muthusaravanan, S.; Sivarajasekar, N.; Vivek, J.S.; Paramasivan, T.; Naushad, M.; Prakashmaran, J.; Gayathri, V.; Al-Duaij, O.K. Phytoremediation of heavy metals: Mechanisms, methods and enhancements. Environ. Chem. Lett. 2018, 16, 1339–1359. [Google Scholar] [CrossRef]
  34. Rascio, N.; Navari-Izzo, F. Heavy metal hyperaccumulating plants: How and why do they do it? And what makes them so interesting? Plant Sci. 2011, 180, 169–181. [Google Scholar] [CrossRef] [PubMed]
  35. Reeves, R.D. Hyperaccumulation of trace elements by plants. In Phytoremediation of Metal-Contaminated Soils; Morel, J.L., Echevarria, G., Goncharova, N., Eds.; Springer: New York, NY, USA, 2006; pp. 1–25. [Google Scholar]
  36. Salt, D.E.; Smith, R.D.; Raskin, I. Phytoremediation. Annu. Rev. Plant Biol. 1998, 49, 643–668. [Google Scholar] [CrossRef] [PubMed]
  37. Van Der Ent, A.; Baker, A.J.; Reeves, R.D.; Pollard, A.J.; Schat, H. Hyperaccumulators of metal and metalloid trace elements: Facts and fiction. Plant Soil. 2013, 362, 319–334. [Google Scholar] [CrossRef]
  38. Harrier, L.A.; Watson, C.A. The potential role of arbuscular mycorrhizal (AM) fungi in the bioprotection of plants against soil-borne pathogens in organic and/or other sustainable farming systems. Pest. Manag. Sci. 2004, 60, 149–157. [Google Scholar] [CrossRef]
  39. Janoušková, M.; Pavlíková, D.; Vosátka, M. Potential contribution of arbuscular mycorrhiza to cadmium immobilisation in soil. Chemosphere 2006, 65, 1959–1965. [Google Scholar] [CrossRef]
  40. Suman, J.; Uhlik, O.; Viktorova, J.; Macek, T. Phytoextraction of heavy metals: A promising tool for clean-up of polluted environment? Front Plant Sci. 2018, 9, 1476. [Google Scholar] [CrossRef] [Green Version]
  41. Ma, L.Q.; Komar, K.M.; Tu, C.; Zhang, W.; Cai, Y.; Kenelley, E.D. A fern that hyperaccumulates arsenic—A hardy, versatile, fast-growing plant helps to remove arsenic from contaminated soils. Nature 2001, 409, 579. [Google Scholar] [CrossRef]
  42. Schmidt, U. Enhancing phytoextraction: The effect of chemical soil manipulation on mobility, plant accumulation and leaching of heavy metals. J. Environ. Qual. 2003, 32, 1939–1954. [Google Scholar] [CrossRef] [Green Version]
  43. Scragg, A. Environmental Biotechnology; Oxford University Press: Oxford, UK, 2006. [Google Scholar]
  44. Boguská, Z.; Fazekašová, D.; Angelovičová, L. Diversity of vegetation on contaminated substrates. In Proceedings of the 17th International Conference on Environment and Mineral Processing, VŠB TU, Ostrava, Czech Republic, 6–8 June 2013. [Google Scholar]
  45. Mazúr, E.; Lukniš, M. Regionálne Geomorfologické členenie Slovenska/Regional Division SSR; Geografický Ústav SAV: Bratislava, Slovakia, 1980. [Google Scholar]
  46. Klinda, J.; Mičík, T.; Némethová, M.; Slámková, M. Environmental Regionalisation of the Slovak Republic 2016; Ministry of Environment of the Slovak Republic: Bratislava, Slovakia, 2016. [Google Scholar]
  47. Lapin, M.; Faško, P.; Melo, M.; Št’astný, P.; Tomlain, J. Climate Areas. Atlas of the Slovak Republic; Ministry of Environment of the Slovak Republic: Bratislava, Slovakia, 2002. [Google Scholar]
  48. Significant Historical Milestones. Available online: http://www.slovmag.sk/ (accessed on 20 January 2022).
  49. It Used to be the Dirtiest City in Slovakia. IKEA was Supposed to Stand here Instead of Magnesite, but only a Black Hole Remained. Available online: https://www.startitup.sk/kedysi-to-bolo-najspinavejsie-mesto-na-slovensku-namiesto-magnezitky-tu-mala-stat-ikea-ostala-vsak-len-cierna-diera/ (accessed on 20 January 2022).
  50. One Hundred Years Ago, Glory, now Horror Ruins. The Magnesite Factory was Deserted, Ikea and other Plans Fell Through. Available online: https://kosice.korzar.sme.sk/c/22638309/pred-sto-rokmi-slava-teraz-hororove-ruiny-magnezitka-pustne-ikea-aj-ine-plany-padli.html (accessed on 20 January 2022).
  51. Slovak Technical Standard ISO 10381-6; Soil Quality—Sampling—Part 6: Guidance on the Collection, Handling and Storage of Soil Under Aerobic Conditions for the Assessment of Microbiological Processes, Biomass and Diversity in the Laboratory. Available online: https://www.iso.org/standard/43691.html (accessed on 20 November 2021).
  52. Ministry of Agriculture of the Slovak Republic. Ministry of Agriculture Decree No. 338/2005; Ministry of Agriculture of the Slovak Republic: Bratislava, Slovakia, 2006. [Google Scholar]
  53. Kobza, J.; Barančíková, G.; Čumová, L.; Dodok, R.; Hrivňaková, K.; Makovníková, J. Methods of Determining Indicators of Agrochemical Soil Properties; SSCRI: Bratislava, Slovakia, 2011. [Google Scholar]
  54. Act of the National Council of the Slovak Republic No. 220/2004 Coll. Available online: https://www.mpsr.sk/zakon-c-220-2004-z-z/27-23-27-8366/ (accessed on 20 November 2021).
  55. Müller, G. The heavy metal pollution of the sediments of Neckars and its tributary: A stocktaking. Chem. Zeit. 1981, 105, 157–164. [Google Scholar]
  56. Čurlík, J.; Šefčík, P. Geochemický Atlas Slovenskej Republiky/Geochemical Atlas of the Slovak Republic; SSCRI: Bratislava, Slovakia, 1999. [Google Scholar]
  57. Buat-Menard, P.; Chesselet, R. Variable influence of the atmospheric flux on the trace metal chemistry of oceanic suspended matter. Earth Planet Sci. Lett. 1979, 42, 399–411. [Google Scholar] [CrossRef]
  58. Håkanson, L. An ecological risk index for aquatic pollution control: A sedimentological approach. Water Res. 1980, 14, 975–1001. [Google Scholar] [CrossRef]
  59. Baker, A.J.M. Accumulators and Excluders Strategies in Response of Plants to Heavy Metals. J. Plant Nutr. 1981, 3, 643–654. [Google Scholar] [CrossRef]
  60. Wu, Q.; Wang, S.; Thangavel, P.; Li, Q.; Zheng, H.; Bai, J.; Qiu, R. Phytostabilization Potential of Jatropha Curcas L. in Polymetallic Acid Mine Tailings. Int. J. Phytoremediation 2011, 13, 788–804. [Google Scholar] [CrossRef] [PubMed]
  61. Błońska, E.; Lasota, J.; Gruba, P. Effect of temperate forest tree species on soil dehydrogenase and urease activities in relation to other properties of soil derived from loess and glaciofluvial sand. Ecol. Res. 2016, 31, 655–664. [Google Scholar] [CrossRef] [Green Version]
  62. Gąsiorek, M.; Kowalska, J.; Mazurek, R.; Paja˛k, M. Comprehensive assessment of heavy metal pollution in topsoil of historical urban park on an example of the Planty Park in Krakow (Poland). Chemosphere 2017, 179, 148–158. [Google Scholar] [CrossRef]
  63. Weber, J.; Dradrach, A.; Karczewska, A.; Kocowicz, A. The distribution of sequentially extracted Cu, Pb, and Zn fractions in Podzol profiles under dwarf pine of different stages of degradation in subalpine zone of Karkonosze Mts (central Europe). J. Soils Sediments 2018, 18, 2387–2398. [Google Scholar] [CrossRef]
  64. Fuller, W.H. Movement of Selected Metals, Asbestos, and Cyanide in Soil: Applications to Waste Disposal Problems; EPA-600/2-77-020; U.S. Environmental Protection Agency, Office of Research and Development, Municipal Environmental Research Laboratory, Solid and Hazardous Waste Research Division: Cincinnati, OH, USA, 1977.
  65. Yang, D.; Zeng, D.H.; Zhang, J.; Li, L.J.; Mao, R. Chemical and microbial properties in contaminated soils around a magnesite mine in northeast China. Land Degrad. Dev. 2012, 23, 256–262. [Google Scholar] [CrossRef] [Green Version]
  66. Štofejová, L.; Fazekaš, J.; Fazekašová, D. Analysis of heavy metal content in soil and plants in the dumping ground of Magnesite Mining Factory Jelšava-Lubeník (Slovakia). Sustainability 2021, 13, 4508. [Google Scholar] [CrossRef]
  67. Fazekaš, J.; Fazekašová, D.; Hronec, O.; Benková, E.; Boltižiar, M. Contamination of soil and vegetation at a magnesite mining area in Jelšava-Lubeník (Slovakia). Ekológia 2018, 37, 101–111. [Google Scholar] [CrossRef] [Green Version]
  68. Hronec, O.; Adamišin, P. Management of Areas Revitalization with Innovative Processes. In Proceedings of the International Scientific Conference Sustainability-Environment-Safety, Bratislava, Slovakia, 27 November 2014. [Google Scholar]
  69. Tobiášová, E.; Barančíková, G.; Gömöryová, E. Pôdna Organická Hmota/Soil Organic Matter; Slovak University of Agriculture: Nitra, Slovakia, 2016. [Google Scholar]
  70. Fazekašová, D.; Barančíková, G.; Torma, S.; Ivanová, M.; Manko, P. Chemické a Environmentálne Aspekty Zložiek Životného Prostredia a Krajiny/Chemical and Environmental Aspects of the Environment and Landscape; University of Prešov: Prešov, Slovakia, 2014. [Google Scholar]
  71. Fazekašová, D.; Fazekaš, J. Soil Quality and Heavy Metal Pollution Assessment of Iron Ore Mines in Nizna Slana (Slovakia). Sustainability 2020, 12, 2549. [Google Scholar] [CrossRef] [Green Version]
  72. Zhong, X.; Chen, Z.; Li, Y.; Ding, K.; Liu, W.; Liu, Y.; Yuan, Y.; Zhang, M.; Baker, A.J.M.; Yang, W.; et al. Factors influencing heavy metal availability and risk assessment of soils at typical metal mines in Eastern China. J. Hazard. Mater. 2020, 400, 123289. [Google Scholar] [CrossRef] [PubMed]
  73. Stofejova, L.; Fazekasova, D.; Fazekas, J. Soil contamination in the area of magnesite mining in urban and agrarian land. In Proceedings of the IOP Conference Series: Earth and Environmental Science, Prague, Czech Republic, 25–26 November 2021; Volume 900, p. 012043. [Google Scholar]
  74. Wang, N.; Han, J.; Wei, Y.; Li, G.; Sun, Y. Potential Ecological Risk and Health Risk Assessment of Heavy Metals and Metalloid in Soil around Xunyang Mining Areas. Sustainability 2019, 11, 4828. [Google Scholar] [CrossRef] [Green Version]
  75. Dolezalova Weissmannová, H.; Mihočová, S.; Chovanec, P.; Pavlovský, J. Potential Ecological Risk and Human Health Risk Assessment of Heavy Metal Pollution in Industrial Affected Soils by Coal Mining and Metallurgy in Ostrava, Czech Republic. Int. J. Environ. Res. Public Health 2019, 16, 4495. [Google Scholar] [CrossRef] [PubMed] [Green Version]
  76. Fazekašová, D.; Petrovič, F.; Fazekaš, J.; Štofejová, L.; Baláž, I.; Tulis, F.; Tóth, T. Soil contamination in the problem areas of agrarian Slovakia. Land 2021, 10, 1248. [Google Scholar] [CrossRef]
  77. Ma, Y.; Egodawatta, P.; McGree, J.; Liu, A.; Goonetilleke, A. Human health risk assessment of heavy metals in urban stormwater. Sci. Total Environ. 2016, 557, 764–772. [Google Scholar] [CrossRef]
  78. Siedlecka, A.; Tukendorf, A.; Skórzyńska-Polit, E.; Maksymiec, W.; Wójcik, M.; Baszyński, T.; Krupa, Z. Angiosperms (Asteraceae, Convolvulaceae, Fabaceae and Poaceae; other than Brassicaceae). In Metals in the Environment. Analysis by Biodiversity; Prasad, M.N.V., Ed.; Marcel Dekket, Inc.: New York, NY, USA, 2001; pp. 171–217. [Google Scholar]
  79. Minkina, T.M.; Mandzhieva, S.S.; Chaplygin, V.A.; Bauer, T.V.; Burachevskaya, M.V.; Nevidomskaya, D.G.; Sushkova, S.N.; Sherstnev, A.K.; Zamulina, I.V. Content and distribution of heavy metals in herbaceous plants under the effect of industrial aerosol emissions. J. Geochem. Explor. 2017, 174, 113–120. [Google Scholar] [CrossRef]
  80. Barančíková, G.; Fazekašová, D. Environmentálna Chémia/Environmental Chemistry; University of Prešov: Prešov, Slovakia, 2014. [Google Scholar]
  81. Allen, S.E. Chemical Analysis of Ecological Material, 2nd ed.; Blackwell Scientific Publications: Oxford, UK, 1989; p. 368. [Google Scholar]
  82. Yruela, I. Copper in plants. Braz. J. Plant Physiol. 2005, 17, 145–156. [Google Scholar] [CrossRef] [Green Version]
  83. Williams, P.N.; Villada, A.; Deacon, C.; Raab, A.; Figuerola, J.; Green, A.J.; Feldmann, J.; Meharg, A.A. Greatly enhanced arsenic shoot assimilation in rice leads to elevated grain levels compared to wheat and barley. Environ. Sci. Technol. 2007, 41, 6854–6859. [Google Scholar] [CrossRef]
  84. Kabata-Pendias, A.; Mukherjee, A.B. Trace Elements in Soils and Plants; Springer: Berlin, Germany, 2007. [Google Scholar]
  85. Zeleňáková, E.; Hajdúk, J.; Holub, Z. Obsah horčíka a iných prvkov v rastlinách (Agropyrum repens P. Beauv., Secale cereale L., Triticum aestivum L.) ovplyvnených magnezitovými exhalačnými splodinami/Content of magnesium and other elements in plants (Agropyrum repens P. Beauv., Secale cereale L., Triticum aestivum L.) affected by magnesite exhalation fumes. Biológia 1966, 21, 365–375. [Google Scholar]
  86. Hronec, O.; Hajdúk, J. Remarkable resistance of Phragmites australis (Cav.) Trin. growing on soils intoxicated by magnesium immissions. Ekologia 1998, 17, 117–124. [Google Scholar]
Figure 1. Magnesite factory Jelšava-Lubeník (Slovakia).
Processes 10 00720 g001
Figure 2. (a) Magnesite factory in Ťahanovce; (b) Bankov Mine (Slovakia).
Processes 10 00720 g002
Figure 3. Location of sampling sites in the investigated areas (Slovakia).
Processes 10 00720 g003
Figure 4. Environmental indices for Jelšava-Lubeník (Slovakia) and Košice (Slovakia): (a) index of geoaccumulation (Igeo) for Košice; (b) enrichment factor (EF) for Košice; (c) contamination factor (Cf) for Košice; (d) index of geoaccumulation (Igeo) for Jelšava-Lubeník; (e) enrichment factor (EF) for Jelšava-Lubeník; (f) contamination factor (Cf) for Jelšava-Lubeník.
Processes 10 00720 g004
Figure 5. Dendrogram derived from hierarchical cluster analysis (HCA) of the potentially toxic elements in Jelšava-Lubeník (Slovakia).
Processes 10 00720 g005
Figure 6. Dendrogram derived from hierarchical cluster analysis (HCA) of the potentially toxic elements in Košice (Slovakia).
Processes 10 00720 g006
Figure 7. Content of potentially toxic elements (mg/kg) in individual parts of plants of the examined dominant species in Jelšava-Lubeník (Slovakia): (a) content of cadmium; (b) content of lead; (c) content of zinc; (d) content of chromium; (e) content of manganese; (f) content of magnesium (notes: ASf—A. stolonifera flower, ASs—A. stolonifera stem, ASr—A. stolonifera root, ERf—E. repens flower, ERs—E. repens stem, ERr—E. repens root, PAf—P. australis flower, PAs—P. australis stem, PAr—P. australis root,—limit value according to Act No. 220/2004 Coll. of Laws [54]).
Processes 10 00720 g007
Figure 8. Content of potentially toxic elements (mg/kg) in individual parts of plants of the examined dominant species in Košice (Slovakia): (a) content of copper; (b) content of arsenic; (c) content of chromium; (d) content of manganese; (e) content of magnesium (notes: ERf—E. repens flower, ERs—E. repens stem, ERr—E. repens root, TOl—T. officinale leaf, TOr—T. officinale root,—limit value according to Act No. 220/2004 Coll. of Laws [54]).
Processes 10 00720 g008
Figure 9. Translocation factor of investigated dominant plant species: (a) translocation factor for Jelšava-Lubeník; (b) translocation factor for Košice (notes: ASf—A. stolonifera flower, ASs—A. stolonifera stem, ASr—A. stolonifera root, ERf—E. repens flower, ERs—E. repens stem, ERr—E. repens root, PAf—P. australis flower, PAs—P. australis stem, PAr—P. australis root, TOl—T. officinale leaf, TOr—T. officinale root).
Processes 10 00720 g009
Figure 10. Principal component analysis (PCA) biplot of potentially toxic elements’ concentrations and dominant plant species in Jelšava-Lubeník (Slovakia). Notes: ASf—A. stolonifera flower, ASs—A. stolonifera stem, ASr—A. stolonifera root, ERf—E. repens flower, ERs—E. repens stem, ERr—E. repens root, PAf—P. australis flower, PAs—P. australis stem, PAr—P. australis root.
Processes 10 00720 g010
Figure 11. Principal component analysis (PCA) biplot of potentially toxic elements’ concentrations and dominant plant species in Košice (Slovakia). Notes: ERf—E. repens flower, ERs—E. repens stem, ERr—E. repens root, TOl—T. officinale leaf, TOr—T. officinale root.
Processes 10 00720 g011
Table 1. Measured content of potentially toxic elements in soil (mg/kg) and selected soil parameters in Jelšava-Lubeník (Slovakia) and Košice (Slovakia) expressed by descriptive statistics.
Study AreaParameterMeanMedianMinimumMaximumStandard DeviationLimit Value *
Jelšava-LubeníkCr157.08104.5078.00793.00141.9970.00
As25.8120.5011.0084.0015.3625.00
Mn1348.941307.50400.002817.00478.762.10–95.27 **
Mg30,411.9418,605.008400.00113,400.0024,493.51200.00–400.00 **
Hg0.070.060.010.140.030.50
Cd0.440.400.401.000.120.70
Pb29.6130.5016.0045.006.7770.00
Zn82.6182.0052.00113.0014.76150.00
Cu27.6426.5013.0064.0011.4160.00
Ni31.9229.5019.0054.009.1450.00
Fe (%)4.174.322.206.400.922.64 **
pH/KCl8.207.907.009.300.91-
Eh (mV)147.00133.0038.00230.0052.40-
SOM (%)3.693.331.276.281.66-
KošiceCr155.7082.0059.00682.00181.6070.00
As19.8019.508.0032.007.5825.00
Mn994.85947.00512.001500.00286.092.10–95.27 **
Mg16,828.359580.003855.0090,300.0023,827.98200.00–400.00 **
Hg0.290.160.080.980.280.50
Cd0.450.450.400.500.050.70
Pb42.4532.0023.00239.0046.6370.00
Zn91.4589.5051.00219.0038.03150.00
Cu41.9531.0016.00108.0027.1260.00
Ni56.8031.0014.00573.00121.6550.00
Fe (%)2.892.911.505.040.752.64 **
pH/KCl6.907.405.308.100.95-
Eh (mV)167.00174.00−6.00274.0080.75-
SOM (%)1.881.910.832.960.57-
Notes: * Act No. 220/2004 Coll. of Laws [54], ** average values for Slovakia [53], Eh—redox potential, SOM—soil organic matter.
Table 2. The index of geoaccumulation (Igeo) and enrichment factor (EF) for potentially toxic elements in the soil in Jelšava-Lubeník (Slovakia).
AreaHgCdPbCrZnCu
IgeoEFIgeoEFIgeoEFIgeoEFIgeoEFIgeoEF
JL 01−0.291.522.429.94−0.341.45−0.451.360.442.50−0.331.52
JL 02−0.462.522.4218.58−0.532.39−0.312.790.264.15−0.302.81
JL 03−0.871.322.4212.52−0.012.34−0.431.740.503.330.443.18
JL 040.042.062.6812.820.062.05−0.441.450.452.680.422.73
JL 05−0.761.462.4213.19−0.262.060.082.610.884.57−0.321.98
JL 06−0.091.772.6813.03−0.061.810.402.480.993.740.011.90
JL 07−0.851.042.8613.75−0.701.142.007.320.823.280.803.57
JL 08−0.871.662.4217.41−0.751.930.153.611.016.870.535.18
JL 09−1.870.592.6110.88−0.771.05−0.361.360.753.001.073.69
JL 10−0.371.462.428.52−0.730.97−0.231.370.752.691.283.93
JL 11−0.151.162.426.69−0.321.02−0.530.880.541.840.601.91
JL 120.141.202.526.39−0.140.99−0.220.950.681.770.501.60
AreaAsNiMnMgFe
IgeoEFIgeoEFIgeoEFIgeoEFIgeoEF
JL 01−0.581.24−0.541.27−0.8811.187.01−0.781.10
JL 02−0.692.14−0.532.39−1.7910.695.61−1.111.59
JL 03−0.162.10−0.082.21−1.2210.824.13−0.451.71
JL 040.603.22−0.051.92−0.9710.612.99−0.431.48
JL 05−0.521.73−0.611.62−1.3011.185.60−0.791.42
JL 06−0.271.56−0.311.52−0.9111.274.56−0.601.24
JL 071.445.710.352.42−0.8611.997.24−0.301.53
JL 080.414.430.193.72−1.4610.976.16−0.432.55
JL 090.723.020.482.45−0.7912.228.32−0.171.56
JL 100.762.710.372.08−0.6712.7511.18−0.021.57
JL 110.101.35−0.231.08−0.3312.9410.00−0.201.09
JL 120.041.14−0.270.92−0.1213.3110.92−0.180.97
Table 3. The index of geoaccumulation (Igeo) and enrichment factor (EF) for potentially toxic elements in the soil in Košice (Slovakia).
AreaHgCdPbCrZnCu
IgeoEFIgeoEFIgeoEFIgeoEFIgeoEFIgeoEF
1KE−5.790.01−0.420.57−0.970.39−1.190.33−1.580.25−3.410.07
2KE−2.840.12−0.420.64−0.890.46−1.330.34−1.120.39−1.340.34
3KE−2.450.12−0.420.50−0.870.37−1.250.28−0.970.34−1.760.19
4KE−0.660.731.573.182.546.782.406.070.721.720.301.29
5KE0.151.411.573.670.591.860.802.77−0.121.13−0.221.06
6KE−5.160.02−0.420.56−0.600.49−1.080.36−1.150.33−2.950.09
7KE1.262.001.572.450.411.09−0.600.53−0.600.54−0.580.54
8KE−0.590.541.572.340.931.49−0.360.62−0.850.43−1.150.35
9KE−0.700.750.571.810.031.24−1.240.510.531.770.021.24
10KE−1.470.240.571.01−0.280.54−0.960.34−0.390.51−0.710.41
AreaAsNiMnMgFe
IgeoEFIgeoEFIgeoEFIgeoEFIgeoEF
1KE−1.860.22−0.630.500.3710.090.82−0.640.49
2KE−1.460.31−0.630.560.201−0.470.62−0.720.52
3KE−1.500.23−0.520.470.561−0.310.54−0.470.48
4KE0.191.281.554.82−0.0511.513.43−0.670.65
5KE−0.530.89−0.710.77−0.3011.334.89−0.950.65
6KE−1.720.22−0.720.450.411−0.850.41−0.610.49
7KE−0.450.60−0.650.520.281−0.780.47−10.41
8KE−0.450.56−0.950.400.351−1.420.29−1.110.35
9KE−0.870.66−0.800.69−0.281−0.171.09−0.840.67
10KE−0.700.40−0.110.610.581−0.680.41−0.710.40
Table 4. Ranking order of soil contamination in Jelšava-Lubeník according to Cd –value and sequence of the contamination factors (Cf).
Contamination Factor (Cf)
Very HighConsiderableModerateLow
LocalityCdCf ≥ 63 ≤ Cf < 61 ≤ Cf < 3Cf < 1
Degree of contamination (Cd)Very highCd ≥ 32
Considerable16 ≤ Cd < 32JL 0729.88Cd > CrAsCu > ZnPb > Hg
JL 0420.72Cd As > Cu > Zn > Pb > Hg > Cr
JL 0620.62Cd Zn > Cr > Cu > Hg > Pb > As
JL 1020.44CdCuAs > Zn >Hg > CrPb
JL 0920.07CdCuZn > As > CrPb > Hg
JL 0819.26CdZnCu > As > CrPb > Hg
JL 1219.15Cd Zn > Cu > Hg > As > Cr > Pb
JL 1117.74Cd Cu > Zn > As > Hg > Pb > Cr
JL 0316.97Cd Zn > Cu > Pb > AS > CrHg
JL 0516.78Cd Zn > Cr > Pb > Cu > AsHg
Moderate8 ≤ Cd < 16JL 0115.84Cd Zn > Hg > Cu > Pb > Cr > As
JL 0215.34Cd Zn > Cu > Cr > Hg > PbAs
LowCd < 8
Table 5. Ranking order of soil contamination in Košice according to Cd –value and sequence of the contamination factors (Cf).
Contamination Factor (Cf)
Very HighConsiderableModerateLow
LocalityCdCf ≥ 63 ≤ Cf < 61 ≤ Cf < 3Cf < 1
Degree of contamination (Cd)Very highCd ≥ 32
Considerable16 ≤ Cd < 32KE 0431.68Pb > CrCdZn > Cu > AsHg
Moderate8 ≤ Cd < 16KE 0515.97 Cd > CrPb > Hg > Zn > Cu > As
KE 0714.20 Cd > HgPb > As > CuCr > Zn
KE 0812.22 CdPb > Cr > As > HgZn > Cu
KE 099.90 Cd > Zn > Pb > CrHg > As > Cr
LowCd < 8KE 107.79 Cd > Pb > ZnAs > Cu > Cr > Hg
KE 034.58 CdPb > Zn > Cr > As > Cu > Hg
KE 024.57 CdPb > Zn > Cr > As > Cu > Hg
KE 064.21 CdPb > Cr > Zn > As > Cu > Hg
KE 013.64 CdPb > Cr > Zn > As > Cu > Hg
Table 6. Correlation matrix (Spearman’s rho) between potentially toxic elements and selected soil parameters in Jelšava-Lubeník (Slovakia).
ParameterAsMnMgHgCdPbZnCuNiFepHEhSOM
Cr0.217−0.1890.007−0.2050.332−0.2660.781 **0.1260.1260.014−0.1550.347−0.042
As 0.5030.343−0.1620.465−0.3710.3400.895 **0.916 **0.825 **0.563−0.2000.559
Mn 0.902 **0.3490.262−0.1260.0280.625 *0.3850.811 **0.739 **−0.3640.895 **
Mg 0.1870.059−0.3220.2310.5400.2170.706 *0.627 *−0.1190.783 **
Hg 0.1460.579 *−0.223−0.188−0.3350.0390.291−0.592 *0.483
Cd 0.1640.1860.2330.3360.2270.232−0.3370.387
Pb −0.301−0.530−0.483−0.385−0.099−0.298−0.175
Zn 0.2850.2310.242−0.1340.5190.000
Cu 0.912 **0.926 **0.721 **−0.2280.642 *
Ni 0.797 **0.500−0.1160.406
Fe 0.768 **−0.2310.769 **
pH −0.702 *0.838 **
Eh −0.609 *
Note: * p < 0.05, ** p < 0.01, Eh—redox potential, SOM—soil organic matter.
Table 7. Correlation matrix (Spearman’s rho) between potentially toxic elements and selected soil parameters in Košice (Slovakia).
ParameterAsMnMgHgCdPbZnCuNiFepHEhSOM
Cr0.4170.2490.621 **−0.3570.3470.3290.3930.3500.530 *0.526 *−0.1420.648 *−0.139
As −0.1090.527 *0.192−0.2520.1180.462 *0.613 **0.779 **0.478 *0.0280.2070.335
Mn −0.130−0.1730.2780.022−0.308−0.1060.0840.484 *−0.2880.3150.012
Mg 0.0410.2250.2110.721 **0.591 **0.602 **0.4150.634 *0.188−0.236
Hg −0.182−0.3440.2770.575**0.0970.0560.272−0.5490.598
Cd 0.1500.1650.096−0.0430.104...
Pb 0.524 *0.073−0.0350.0180.0120.286−0.012
Zn 0.745 **0.4390.3450.431−0.0550.236
Cu 0.574 **0.488 *0.283−0.0300.261
Ni 0.699 **0.1600.2240.285
Fe −0.0280.4270.378
pH −0.234−0.258
Eh −0.382
Note: * p < 0.05, ** p < 0.01, Eh—redox potential, SOM—soil organic matter.
Publisher’s Note: MDPI stays neutral with regard to jurisdictional claims in published maps and institutional affiliations.

