1. Introduction
Screen-printed electrodes (SPEs) are electrochemical sensing devices fabricated by printing various types of inks on plastic, alumina, or ceramic media, allowing rapid in situ analysis with high reproducibility, sensitivity, and accuracy. The composition of the different inks (carbon, silver, gold, platinum) used in the manufacturing of the electrode determines its selectivity and sensitivity [
1].
Screen-printed electrodes can be mass-produced at low cost and can be easily used as simple transducers. Nowadays, the use of automatic and semi-automatic screen-printing machines has made the whole process fast and clean, so that billions of screen-printed sensors can be produced worldwide every year. They are successfully used in various fields where methods of electrochemical analysis are employed, such as quality control, research, and the detection of a wide range of analytes such as antigens, enzymes, heavy metal ions, with a high degree of efficiency and sensitivity. Almost all of the glucose bands produced for blood glucose monitoring are screen-printed [
2]. The specialized literature presents a variety of screen-printed electrode modifiers, depending on the structure of the analyte under investigation, which needs to be immobilized on the working electrode in order to be detected/quantified by electrochemical methods. These modifications of the surface of the screen-printed working electrodes are made by different functionalization techniques, which are suitable for different applications. One way is to change the composition of the ink used by adding various substances such as metals, metal oxides, enzymes, polymers, electrochemical mediators, complexing agents, or materials with nanostructures such as gold, silver, platinum, palladium, or other metallic nanoparticles from ready-made solutions [
3]. In recent years, it has been found that the use of inks based on carbon nanotubes and graphene is of particular interest for the development of screen-printed electrodes. The modified electrodes are very effective in immobilizing biological molecules and are also more conductive, thus improving the electrochemical signal. The development of these electrochemical cells arises from the need to reduce the size of the devices, which means a reduction in the volume of samples required in each experiment and a reduction in production costs, and above all, customizing the device according to the application [
3]. Screen-printed electrodes often have a working electrode (WE), a reference electrode (RE) and a counter electrode (CE) of different inks. Usually, the counter electrodes are made of carbon because they are cheaper than metal, but the counter electrodes can also be made of gold, silver or other metals. Reference electrodes are usually a mix of silver and silver chloride, which makes them more stable. Because of the low price, screen-printed electrodes can be made for single-use purposes.
In order to select the proper cleaning method, we need to understand the basic principle of screen-printed electrode manufacturing and the surface modifications that occur when they are exposed to certain reagents or materials.
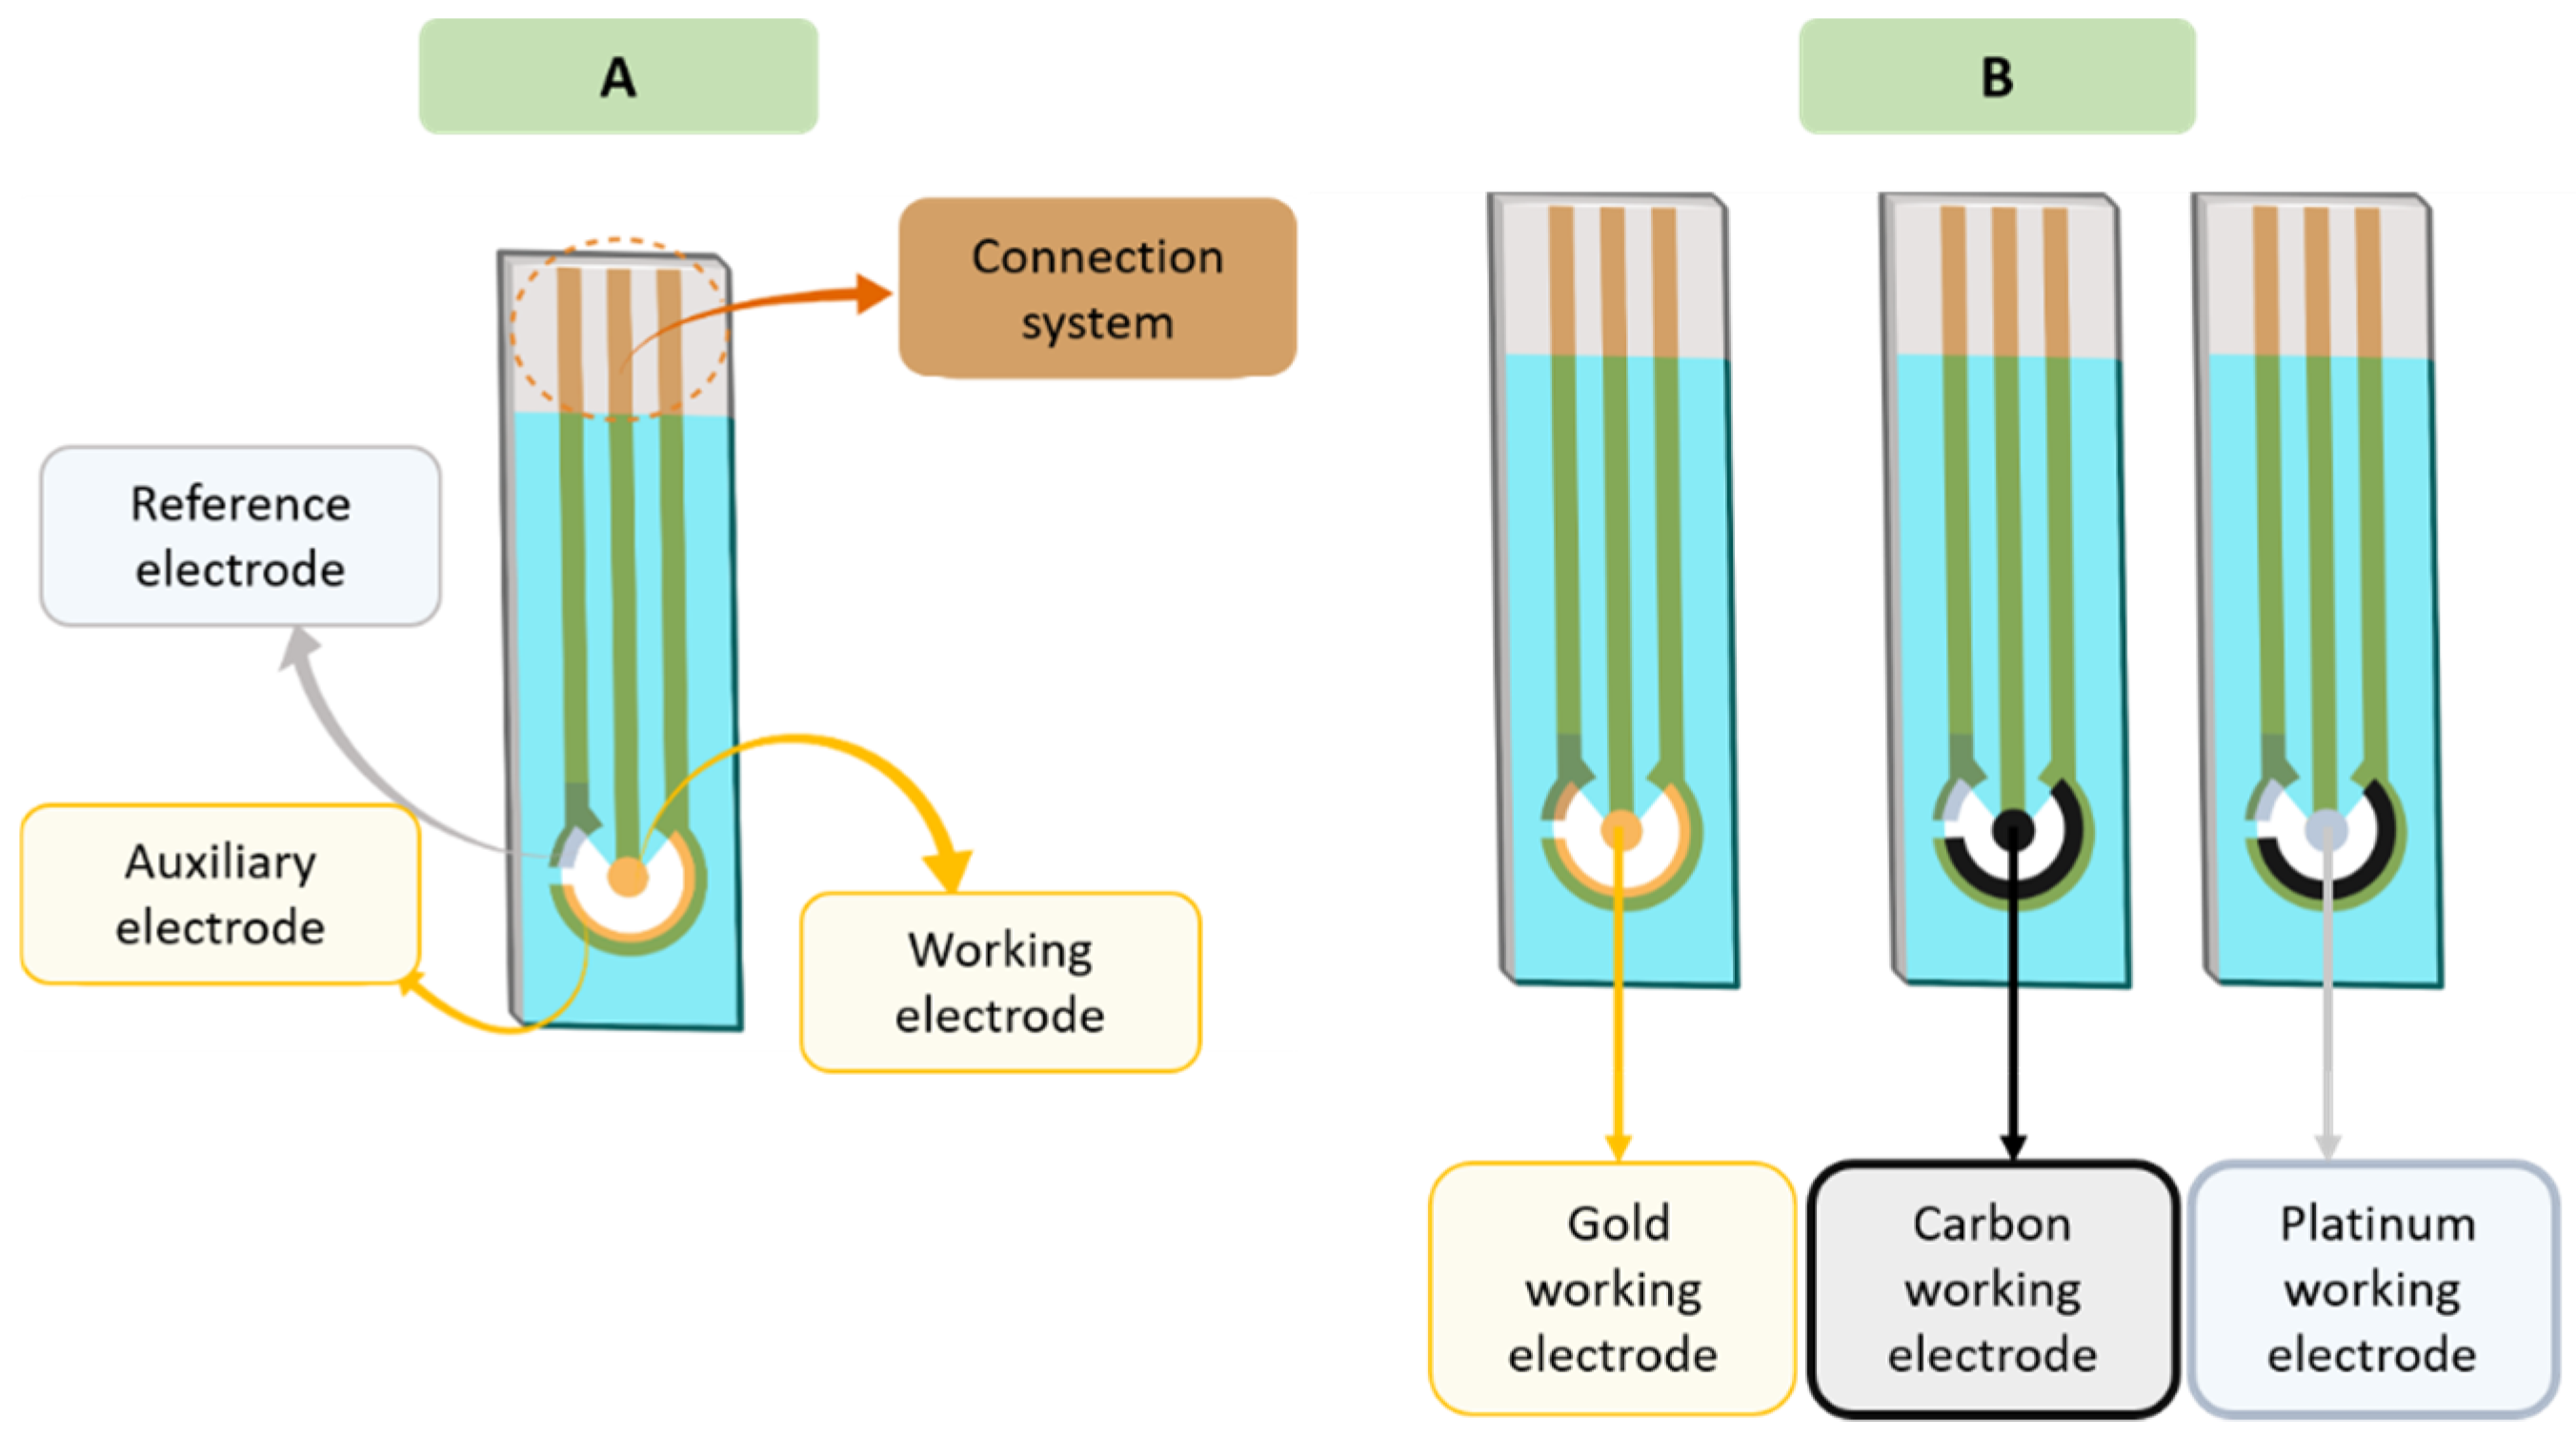
The three electrode system is the most common type and consists of (
Figure 1):
A working electrode (sensitive to analyte concentration);
A reference electrode (allows the application of a known potential, which is independent of the concentration of analyte and other ions);
An auxiliary or counter electrode (completes the circuit of the cell because it allows the passage of current).
The three electrodes can be printed on different types of substrates (plastic, alumina, or ceramic) and can be fabricated with a variety of inks [
4,
5].
The electrode manufacturing process involves the sequential deposition of different layers of conductive and/or insulating inks on the inert substrate (
Figure 2).
The process consists of several stages [
6,
7]:
Placing the film usually on plastic or ceramic;
Drying the printed films to remove possible organic solvents, which is necessary for proper adhesion. Drying can be done in an oven, at room temperature, or the ink can be treated with UV light, etc.
Each type of ink has its own particularities, for instance silver ink acts as a conductor [
4]. Silver/silver chloride is a preferred reference electrode because it has a stable electrochemical potential under various measurement conditions. This makes silver ink/silver chloride a good choice for a variety of medical and industrial applications that require a conductive ink, such as biometric monitoring or heavy metal detection. The properties of the ink can be adjusted by changing the ratio of silver to silver chloride [
7].
The composition of the electrodes is usually information that is confidential to the manufacturing company. However, there are key elements in the composition of the electrodes, such as binders used to promote the adhesion between the ink and substrate, and the ink and solvents used to improve the printing process [
4]. The type, size, or charge of the graphite particles, as well as the printing and drying conditions, can affect the electron transfer and analytical efficiency of carbon sensors [
4]. Gold ink is currently attracting greater interest because self-assembling monolayers (SAMs) can be obtained with alkanethiols or any thiolated molecule via the strong Au–S bond.
Various treatments are used during manufacturing to remove organic impurities from the electrode surface. This improves their electrochemical properties by increasing the surface roughness [
5].
The cleaning phase of the screen-printed electrodes is a very important step in the development of biosensors because efficient cleaning can lead to an improved signal, excellent binding of the biomolecules and increased active surface [
8,
9].
In recent years, SPEs have been used to generate surface-enhanced Raman spectroscopy (SERS) substrates in situ for analytical purposes. The increase in electrode roughness is a factor that is considered fundamental for the generation of a significant SERS effect [
4]. Martín-Yerga et al. investigated the effect of SERS on the working electrode surface by applying an intense cathodic potential in the range of 0 V–0.4 V and an initial anodic potential between +0.30 V and 0 V, and producing a new, rougher electrode surface. The electroactive area of screen-printed electrodes is larger than the surface area of the geometric electrode: carbon nano tubes (CNT) have the highest value, followed by carbon nano fibers (CNF) and graphene-SPE (GPH) [
10]. The roughness factor is given by the ratio between the electroactive surface and the geometric surface, where the roughness factor for CNT-SPE has a value of 9.40, for CNF-SPE of 7.74 and for GPH-SPE of 7.70. The nanostructure for CNT imparts excellent catalytic activity which significantly improves the electroactive area.
The nanomaterial structure improves the functionalization of the active surface, immobilization and stability of biological receptors. The nanocarbon structure can be used as a marker in the fabrication of electrochemical immunosensors and immunoassays as it improves the response properties of biosensors. The tremendous improvement in signal associated with the use of carbon nanomaterials is the basis for extremely sensitive electrochemical detection of protein biomarkers or infectious agents with good stability, excellent reproducibility and favorable selectivity [
11,
12].
There is not much published literature on the topic of cleaning screen-printed electrodes, most studies focus on their production and functionalization. However, some methods for cleaning gold screen-printed electrodes, such as UV-ozone, Aqua regia, potassium hydroxide, sulfuric acid potential cycling and hydrochloric acid potential cycling have been tested and the potassium hydroxide sweep method appears to be the most efficient one [
13]. The UV-ozone cleaning method is usually employed for the removal of organic contaminants, but it can affect the insulating layer of the electrode [
14]. Not much data on the effect of organic solvents cleaning is available, yet some reports state that this type of treatment does not affect the formation of SAMs [
14]. One of the most widely used methods is CV sweeping using Fe [CN]63−/Fe [CN]64− solution [
15].
A recent study conducted by Ho et al., showed that some treatments can lead to low sensor repeatability [
16]. Cleaning-induced surface modifications can also have beneficial results, which was the case in carbon electrodes treated with ethanol and soaked in 0.01 M hydrochloric acid solution. The solution reacted with the carbon surface and –COO
− Na
+ moieties were formed [
17]. This surface modification proves that some chemical treatments can not only remove contaminants from the electrode’s surface, but can also generate certain functional groups, which can serve as ligands for target molecules.
Another study evaluated cleaning methods such as UV-ozone treatment, soaking in N, N-dimethylformamide, soaking and anodizing in aqueous NaOH solution, ultrasonication in tetrahydrofuran and mechanical polishing. The study concluded that mechanical polishing appears to improve hydrogen absorption on the platinum electrode and increase the active surface [
18].
2. Materials and Methods
2.1. Materials
In our experimental study, we used screen-printed electrodes with a platinum ink working electrode from GAMRY Instruments, Warminster, USA and screen-printed electrodes with a gold ink working electrode manufactured at NANOM MEMS SRL, Rasnov, Romania. The gold electrodes were printed with a semiautomatic screen-printer (LC-TA-250 Model) using alumina 96% as the substrate (0.6 mm thickness). The working electrode and the counter electrode were made of Au ink, and the pseudo-reference electrode was made of Ag ink. Au and Ag inks were printed and heat treated at 850 °C for 15 min. The conductive paths connecting the working electrode, the counter electrode and the pseudo-reference electrode were protected with a dielectric layer obtained from a borosilicate glass paste. All pastes were made by NANOM MEMS. The platinum/gold screen-printed electrodes used for the study had the following technical specifications: thickness: 1 mm; length: 5 cm; width: 1 cm; substrate: alumina; contacts and paths: silver paste; coating: chemical resistant dielectric paste; working electrode: area 12 mm2, paste: platinum or gold; auxiliary or counter electrode: area 30 mm2, paste: charcoal or gold; and reference electrode: area 0.6 mm2, paste: Ag/AgCl.
Potassium hexacyanoferrate (II) trihydrate (98.5%), potassium hexacyanoferrate (III) (99%) and acetone (99.5%) were purchased from VWR Chemicals, Radnor, USA. The phosphate buffered saline (PBS) and H2O2 (30%) were supplied by Sigma Aldrich, St. Louis, USA and the absolute ethanol (99.5%) was provided by ChimReactiv, Bucharest, Romania.
2.2. Methods
Electrochemical experiments were performed using the potentiostat from GAMRY Instruments. The interface 1010E is fully functional and can perform all the techniques of voltammetry measurement and electrochemical impedance spectroscopy up to 2 MHz with temperature monitoring. For the voltammetry and impedance spectroscopy, the software Echem Analyst version 7.07 was used.
The surface morphology was evaluated by scanning electron microscopy (SEM), using Nova NanoSEM 630 (FEI Company, Hillsboro, OR, USA). TEAM™ EDS Smart Quant, Element version V4.4.1 was used to identify the elemental composition of the surfaces before and after treatment with various cleaning methods.
3. Results
3.1. Cleaning Screen-Printed Electrodes Using Chemical Methods
There are a number of cleaning methods for screen-printed electrodes, but their applicability depends on the target surface (gold, platinum, carbon, etc.), the degree of contamination and the type of contamination (organic or inorganic). Therefore, we have developed a series of cleaning methods based on the information in the literature that were reviewed and adapted based on the results obtained in the evaluation of the degree of purity of the electrode.
In the literature, the most frequently given method for chemical cleaning is the use of a solution such as piranha, a mix of H2SO4 and hydrogen peroxide in a ratio of 3:1. It is used to remove organic residues from various surfaces, but due to its high aggressiveness, it should only be used as a last resort. In our experience, resins/polymers used as insulators for electrode circuits are severely affected by treatment with strong acid solutions such as sulfuric or hydrochloric acid.
3.1.1. Degreasing Screen-Printed Electrodes Using Polar Solvents
Two types of electrodes were used, one with a gold working electrode and one with a platinum working electrode. First, 1 µL of acetone was deposited twice on each electrode and left to work for about 10 min at a time. The electrodes were rinsed three times with PBS prior to the measurements. Another set of electrodes were treated in the same manner, only this time using absolute ethanol. The characterization of the electrodes was carried out using cyclic voltammetry and impedance spectroscopy techniques in a solution of ferric/ferro cyanide potassium 5 mM. The CV and EIS measurements revealed that the degree of cleaning for both the gold and platinum electrodes did not significantly improve after treatment with acetone.
The characterization and electrochemical measurement of the electrode surface by cyclic voltammetry (CV) technique, before and after the degreasing stage with polar solvent, is presented in
Figure 3. The technical specifications of the method are as follows: the scanning rate was 100 mV/s and potential range was between −0.200 V and 0.600 V.
The difference between the height of the faradaic current peak measured before degreasing and after degreasing with polar solvent for the gold electrode was insignificant (0.01 µA). However, the measurements obtained for the platinum electrode showed a difference of 7.88 µA.
Therefore, there was a remarkable increase in the intensity of the faradaic current, which confirms the necessity and efficiency of the degreasing stage for platinum electrodes by removing the organic traces present after the manufacture of the screen-printed electrode. The difference in the Faradaic current peak height I
m and faradaic potential V
f by reference electrode potential, before degreasing with acetone, versus the faradaic current peak height I
m and the faradaic potential V
f versus the reference electrode potential after degreasing, in the potential range of −0.200 V–0.600 V in a 5 mM solution of K
4[Fe(CN)
6]/K
3[Fe(CN)
6] is shown in
Table 1.
Comparing the Nyquist impedance plots for the screen-printed electrode with gold paste before and after the degreasing phase with the polar solvent acetone, a significant improvement of the diffusion redox process can be observed, which is reflected in a reduction in the value of the polarization resistance R
p by 140.7 ohms (
Figure 4). Additionally, for the platinum electrode, the R
p difference was even more obvious and a difference of 482.2 ohms was registered. The measured voltage (V
f) appears to decrease after the acetone cleaning step for both the gold and platinum electrodes. V
f is measured as the difference between the working and the reference electrode.
The EIS measurements were obtained using a frequency range of 0.1 mHz to 100 kHz, an alternating current with an amplitude of 10 mV for the Nyquist plots obtained before and after degreasing with acetone, and the results are presented in
Table 2.
The characterization through electrochemical measurement of the platinum electrode surface by the cyclic voltammetry (CV) technique, before and after the degreasing stage with ethanol can be seen in
Figure 5.
Again, it is obvious that the gold electrode electrochemical signal did not improve, but the platinum one had a peak increase of about 5.59 µA (
Table 3). Additionally, the V
f value for the gold electrode did not change, while the V
f value of the platinum electrode decreased with 34.1 mV.
Figure 6 shows the characterization and electrochemical measurement of the platinum electrode surface by the impedance spectroscopy technique before and after the degreasing stage with polar solvent, absolute ethanol, made in redox solution with a concentration of 5 mM.
The EIS measurements for Rp, intercept and the correlation coefficient before and after degreasing with ethanol are presented in
Table 4. Comparing the Nyquist impedance plots for the screen-printed electrode with platinum paste, before and after the degreasing step with anhydrous ethanol, a clear improvement in the diffusion redox process can be seen, which is reflected in the decrease in the R
p by 2460 ohms.
These results suggest that the improvement in the redox diffusion process is significantly clearer when performing EIS, as opposed to the CV results, which only showed better contouring of the oxidation and reduction peaks. Thus, the EIS characterization is obviously more suitable for the evaluation of the cleaning efficiency than CV.
3.1.2. Cleaning of Screen-Printed Electrodes Using H2O2 Solution and CV
Screen-printed electrodes with gold and platinum working electrodes were electrochemically cleaned in the presence of a 10 mM hydrogen peroxide solution in PBS buffer, pH 7.4 ± 0.2. This type of treatment is not only efficient in the removal of contaminants but can also improve the electrode sensitivity by introducing new C-O groups, as previously reported [
19].
The electrochemical cleaning method used was cyclic voltammetry with a potential range of −0.7 V to +1.0 V, 10 cycles and a scanning rate of 10 mV/second.
After the electrochemical cleaning stage, the electrode was washed with deionized water (5X), dried at 37 °C for 10 min and then rinsed with PBS, before transfer to a fresh redox solution and the cleaning level was evaluated by CV and EIS (
Figure 7 and
Figure 8).
This cleaning method proved to be efficient for both types of working electrodes, the gold electrode had a peak increase of 2.8 µA and the platinum one of about 7.02, and the R
p values had a proportional decrease
(Table 5 and
Table 6). In this case, the V
f values of the gold and platinum electrodes after cleaning with hydrogen peroxide are almost identical, which suggests that the electric potential is very close to the reference. The presence of hydrogen peroxide had a slightly beneficial effect on the silver reference electrode during the experiment, compared to the cleaning of screen-printed electrodes without the addition of hydrogen peroxide. The silver electrode appeared cleaner and light in color after the H
2O
2 treatment, as opposed to untreated ones, which tend to darken after a series of cycles in Fe [CN]63−/Fe [CN]64− solution.
3.2. Cleaning Screen-Printed Electrodes Using Negative Potential
Cleaning of the screen-printed electrodes with a gold or platinum working electrode was carried out electrochemically, by cyclic voltammetry in 5 mM redox solution K4[Fe (CN)6]/K3[Fe(CN)6], prepared in 0.01 M phosphate buffer solution, pH 7.4. The CV specifications were: potential range between −0.7 V and 0 V, scan rate of 10 mV/s and 2 cycles. Increasing the number of cycles can lead to electrode damage, and the tolerance limit is conditioned by the type and nature of the electrode, as well as by the manufacturing process. After the electrochemical cleaning phase using the CV technique, the 5 mM redox solution is changed and the surface of the electrode is characterized by the cyclic voltammetry technique. Changing the solution is extremely important, as the detached matter can be fixed back by applying the positive current.
The characterization by electrochemical measurement of the gold and platinum working electrodes before and after the cleaning step is shown in
Figure 9.
The difference in the peak of the faradaic current measured before electrochemical cleaning and after electrochemical cleaning of the gold paste working electrode surface was 1.06 µA, which is an improvement compared to the degreasing with polar solvents (
Table 7). The platinum electrode had a peak difference of 2.6 µA, which compared to the other previously-described methods (solvents, electrochemical-H
2O
2) was less efficient. However, solvents can leave traces that will interact with the functionalization process, leading to poor binding of biomolecules, and thus to the poor performance parameters of the biosensor [
13].
The EIS plots also reveal the efficiency of the cleaning method. Comparing the Nyquist impedance plots for the gold screen-printed electrode, before and after the electrochemical cleaning step, a small improvement in the diffusion redox process can be observed, reflected by a 10.3 Ohms reduction in the R
p (
Figure 10).
The EIS measurements performed in the frequency range of 0.1 m Hz to 100 kHz, in an alternating current with an amplitude of 10 mV are presented in
Table 8, for the Nyquist diagrams obtained before and after the electrochemical cleaning.
The CV characterization of the platinum working electrode before and after the cleaning stage, can be seen in
Figure 10. The post-cleaning CV revealed a firmness in the contouring of the diffusion current peaks for both the oxidation and the reduction current and a significant increase in the faradaic diffusion current.
The difference between the height of the faradaic current measured before and after the electrochemical cleaning of the working electrode surface was 2.60 µA.
A comparison of the Nyquist impedance diagrams for the platinum electrode before and after the electrochemical cleaning, shows an obvious and significant improvement in the diffusion process, reflected by the decrease in R
p by 1090.7 ohms (
Figure 10). The redox process takes place at a much higher speed than in the stage before electrochemical cleaning. EIS measurements were performed in the frequency range of 0.1 mHz to 100 kHz and an alternating current amplitude of 10 mV.
The EIS measurements had an excellent correlation coefficient before and after cleaning with values above 0.99; also, a significant decrease in the electrochemical gradient suggests that potential organic contaminants have been removed from the surface.
3.3. SEM Analysis
In order to evaluate the potential degradation/changes on the surface of the working electrodes, we evaluated their morphology before and after each cleaning method. The images obtained for the gold working electrode are presented in
Figure 11.
It appears that there are some visible differences in the appearance of the surfaces. As reported in the literature, the surfaces that appear smoother and more regular also showed an improved electrochemical response to CV and EIS. The SEM images confirm that the H2O2/CV cleaning method was the most efficient in eliminating any residues on the surface of the gold working electrode.
The platinum electrodes’ surface was also characterized by SEM and the results are presented in
Figure 12. In this case, the uniformization and smoothness of the surface is even more obvious for the electrode treated with H
2O
2 while applying CV cycles, and also for the absolute ethanol treated one. By comparing the surfaces of the untreated gold and platinum electrodes, we can also clearly see that the platinum surface appears to have more debris and thus, in this case we were able to see more pronounced changes in terms of surface quality and electrochemical signal.
3.4. Energy Dispersive X-ray Analysis (EDX)
For each cleaning treatment, we selected 3–5 spots for the EDX analysis. The elemental analysis data revealed that all the cleaning methods introduced new elements on to the surface of the gold electrode, such as Na, Cd and Fe, except the H
2O
2/CV method, which only introduced Na (
Supplementary Materials). In addition, by analyzing the weight of Au in every spot, we observed that although the percentages for the H
2O
2/CV electrode were smaller than those obtained for the untreated one, their uniformity was clear (
Table 9. The weight% difference between the treated and the untreated electrodes could be attributed to the lack of uniformity, thus leading to the false conclusion that it has reduced after treatment. The analyzed spots were selected randomly, so large variations may occur.
After the chemical cleaning method was used, the platinum electrodes seemed to develop a lot of bright spots, which the EDX analysis revealed to be aluminum (
Figure 13). These findings suggest that the conductivity is not attributed to platinum, but largely to the aluminum layer below. In contrast, in the case of methods based on H
2O
2/CV and negative sweeping, an analysis of the spots revealed the absence of bright spots.
4. Discussion
According to the measurements taken before and after the treatments, the gold and platinum R
p values decreased as follows: acetone—35.33% for gold and 49.94% for platinum; ethanol—44.50% for gold and 81.68% for platinum; H
2O
2—47.34% for gold and 92.78% for platinum; and the electrochemical method—3.70% for gold and 67.96% for platinum. We observed a significant difference in the degree of cleaning between the platinum and gold electrodes, although the same measuring conditions, a scanning rate of 100 mV/s and a potential range of −0.200 V to 0.600 V were used. One explanation for the fact that we obtained very different results for the two tested electrodes is that the surface of the platinum electrode was more contaminated, most likely with organic matter, during production or transportation. Compared to the other studied methods, the H
2O
2/CV treatment gave good results for both gold and platinum electrodes, as demonstrated by the I
m and R
p values, while also preventing degradation in the silver reference electrode. It is a well-known fact that the reliability of the reference electrode is crucial for potentiometric and voltametric measurements [
20]. One disadvantage of the H
2O
2/CV and negative sweeping methods is the time it takes to perform the sweeping, especially if more than 2 are required, due to the very low scan rate (10 mV/s).
The platinum electrode cleaning methods are comparable in terms of efficacy according to the data provided by the CV and EIS measurements, except for the acetone treatment. However, an advantage of electrochemical cleaning by negative sweeping is that it increases the surface roughness of the screen-printed electrodes, which generates a SERS substrate in situ, which can improve the analytical performance of the sensor. The increase in the working electrode roughness is a factor that is considered fundamental to produce a significant SERS effect [
4].
Choosing the technique of electrochemical cleaning, with/without H2O2, results in a significant decrease in the polarization resistance in the initial cleaning stage, when it must have a value as small as possible because the dominant process is the diffusion process, which ideally should approach 60 ohms. The Rp value increases in the electrode functionalization stage and especially when adding different levels of the target analyte.
As reported in the literature, mechanical polishing for instance, which was shown to have beneficial effects on platinum electrodes resulted in a decrease in R
p by a factor of 10 [
18]. We, on the other hand, concluded that the most significant R
p decrease for the platinum electrode was after the ethanol cleaning, by a factor of around half that (approximately 5.6). Another study focused on testing various chemical cleaning methods for gold screen-printed electrodes, with potassium hydroxide–hydrogen peroxide; potassium hydroxide (KOH) potential sweep; sulfuric acid hydrogen peroxide; sulfuric acid potential cycling; hydrochloric acid potential cycling; dimethylamine borane reducing agent solutions at 25 °C and 65 °C and Aqua Regia [
13]. They reported that the KOH sweeping method was the most efficient, with a difference between the pre- and post-cleaning R
ct values of 71 ohms, which is lower compared to the 145.6 ohms R
ct value obtained by us using acetone, the 105.2 ohms obtained by H
2O
2, respectively, and 87.0 ohms after ethanol cleaning. The R
ct values were calculated from the obtained R
p and Z”
max values [
21].
The SEM images confirmed that the surface of the treated electrodes appeared to be smoother and more regular, which is in accordance with the effects described in the literature for mechanical activation, and correlated with an increased oxidation peak at CV [
22].
The EDX analysis of the gold electrodes revealed that the most constant weight % of gold in the analyzed spots was obtained for the H2O2/CV method. This suggests that the improvement in the electrochemical signal and the Rp reduction could be due to a better distribution of the gold on the surface of the electrode, or it could be induced after eliminating the contaminants along with a thin layer of gold. The analyzed spots on the platinum electrodes for most of the tested methods revealed bright spots, which were found to contain aluminum.
Because the cleaning with polar solvents was performed only on the working electrodes, as opposed to the H2O2/CV and negative sweeping methods, which involve immersing all electrodes (WE, CE and RE) in solution, we aim to investigate the effect of the solvent treatment of the entire device, as well as testing mixed methods, consisting of two steps: (1) degreasing the working electrode; and (2) electrochemical cleaning with/or without H2O2.
5. Conclusions
It is clear that the performance of an electrochemical sensor is influenced by the characteristics of the working electrode surface and that the cleaning method can significantly improve the performance. Based on our findings, chemical cleaning methods, using acids or alcohols can be very efficient, especially when coupled with cyclic voltammetry, yet some questions remain on the complete disposal of their residues, which may affect further processes such as functionalization and analyte detection. Additionally, based on our findings, acetone and ethanol appear to affect the platinum electrodes, although their conductivity is enhanced, which is due to the aluminum layer in their composition.
The electrochemical cleaning method based on negative sweeping only, is very efficient for the removal of contaminants, but can also improve the biosensor’s performance by generating SERS-like surfaces, which were shown to enhance the detection limit of target analytes by a factor as much as 1010 to 1011. Therefore, we recommend that the cleaning of screen-printed electrodes be carried out in a 5 mM K4[Fe(CN)6]/K3[Fe(CN)6] solution, by applying a potential range of −0.700 V–0 V, and a scan rate of 10 mV/s for a maximum of 2–3 cycles. The number of cycles is dependent on the type of electrode and the manufacturing characteristics, the optimum number of cleaning cycles should be established based on the electrode’s behavior. However, the most efficient cleaning method turned out to be a combination of a H2O2 solution and multiple CV at low sweep speed.


 ,
, 


