
Numerical Simulation of Influencing Factors of Hydraulic Fracture Network Development in Reservoirs with Pre-Existing Fractures


 ,
,
Abstract
:1. Introduction
2. Governing Equations
3. Numerical Model for Hydraulic Fracturing Simulation
4. Results and Discussion
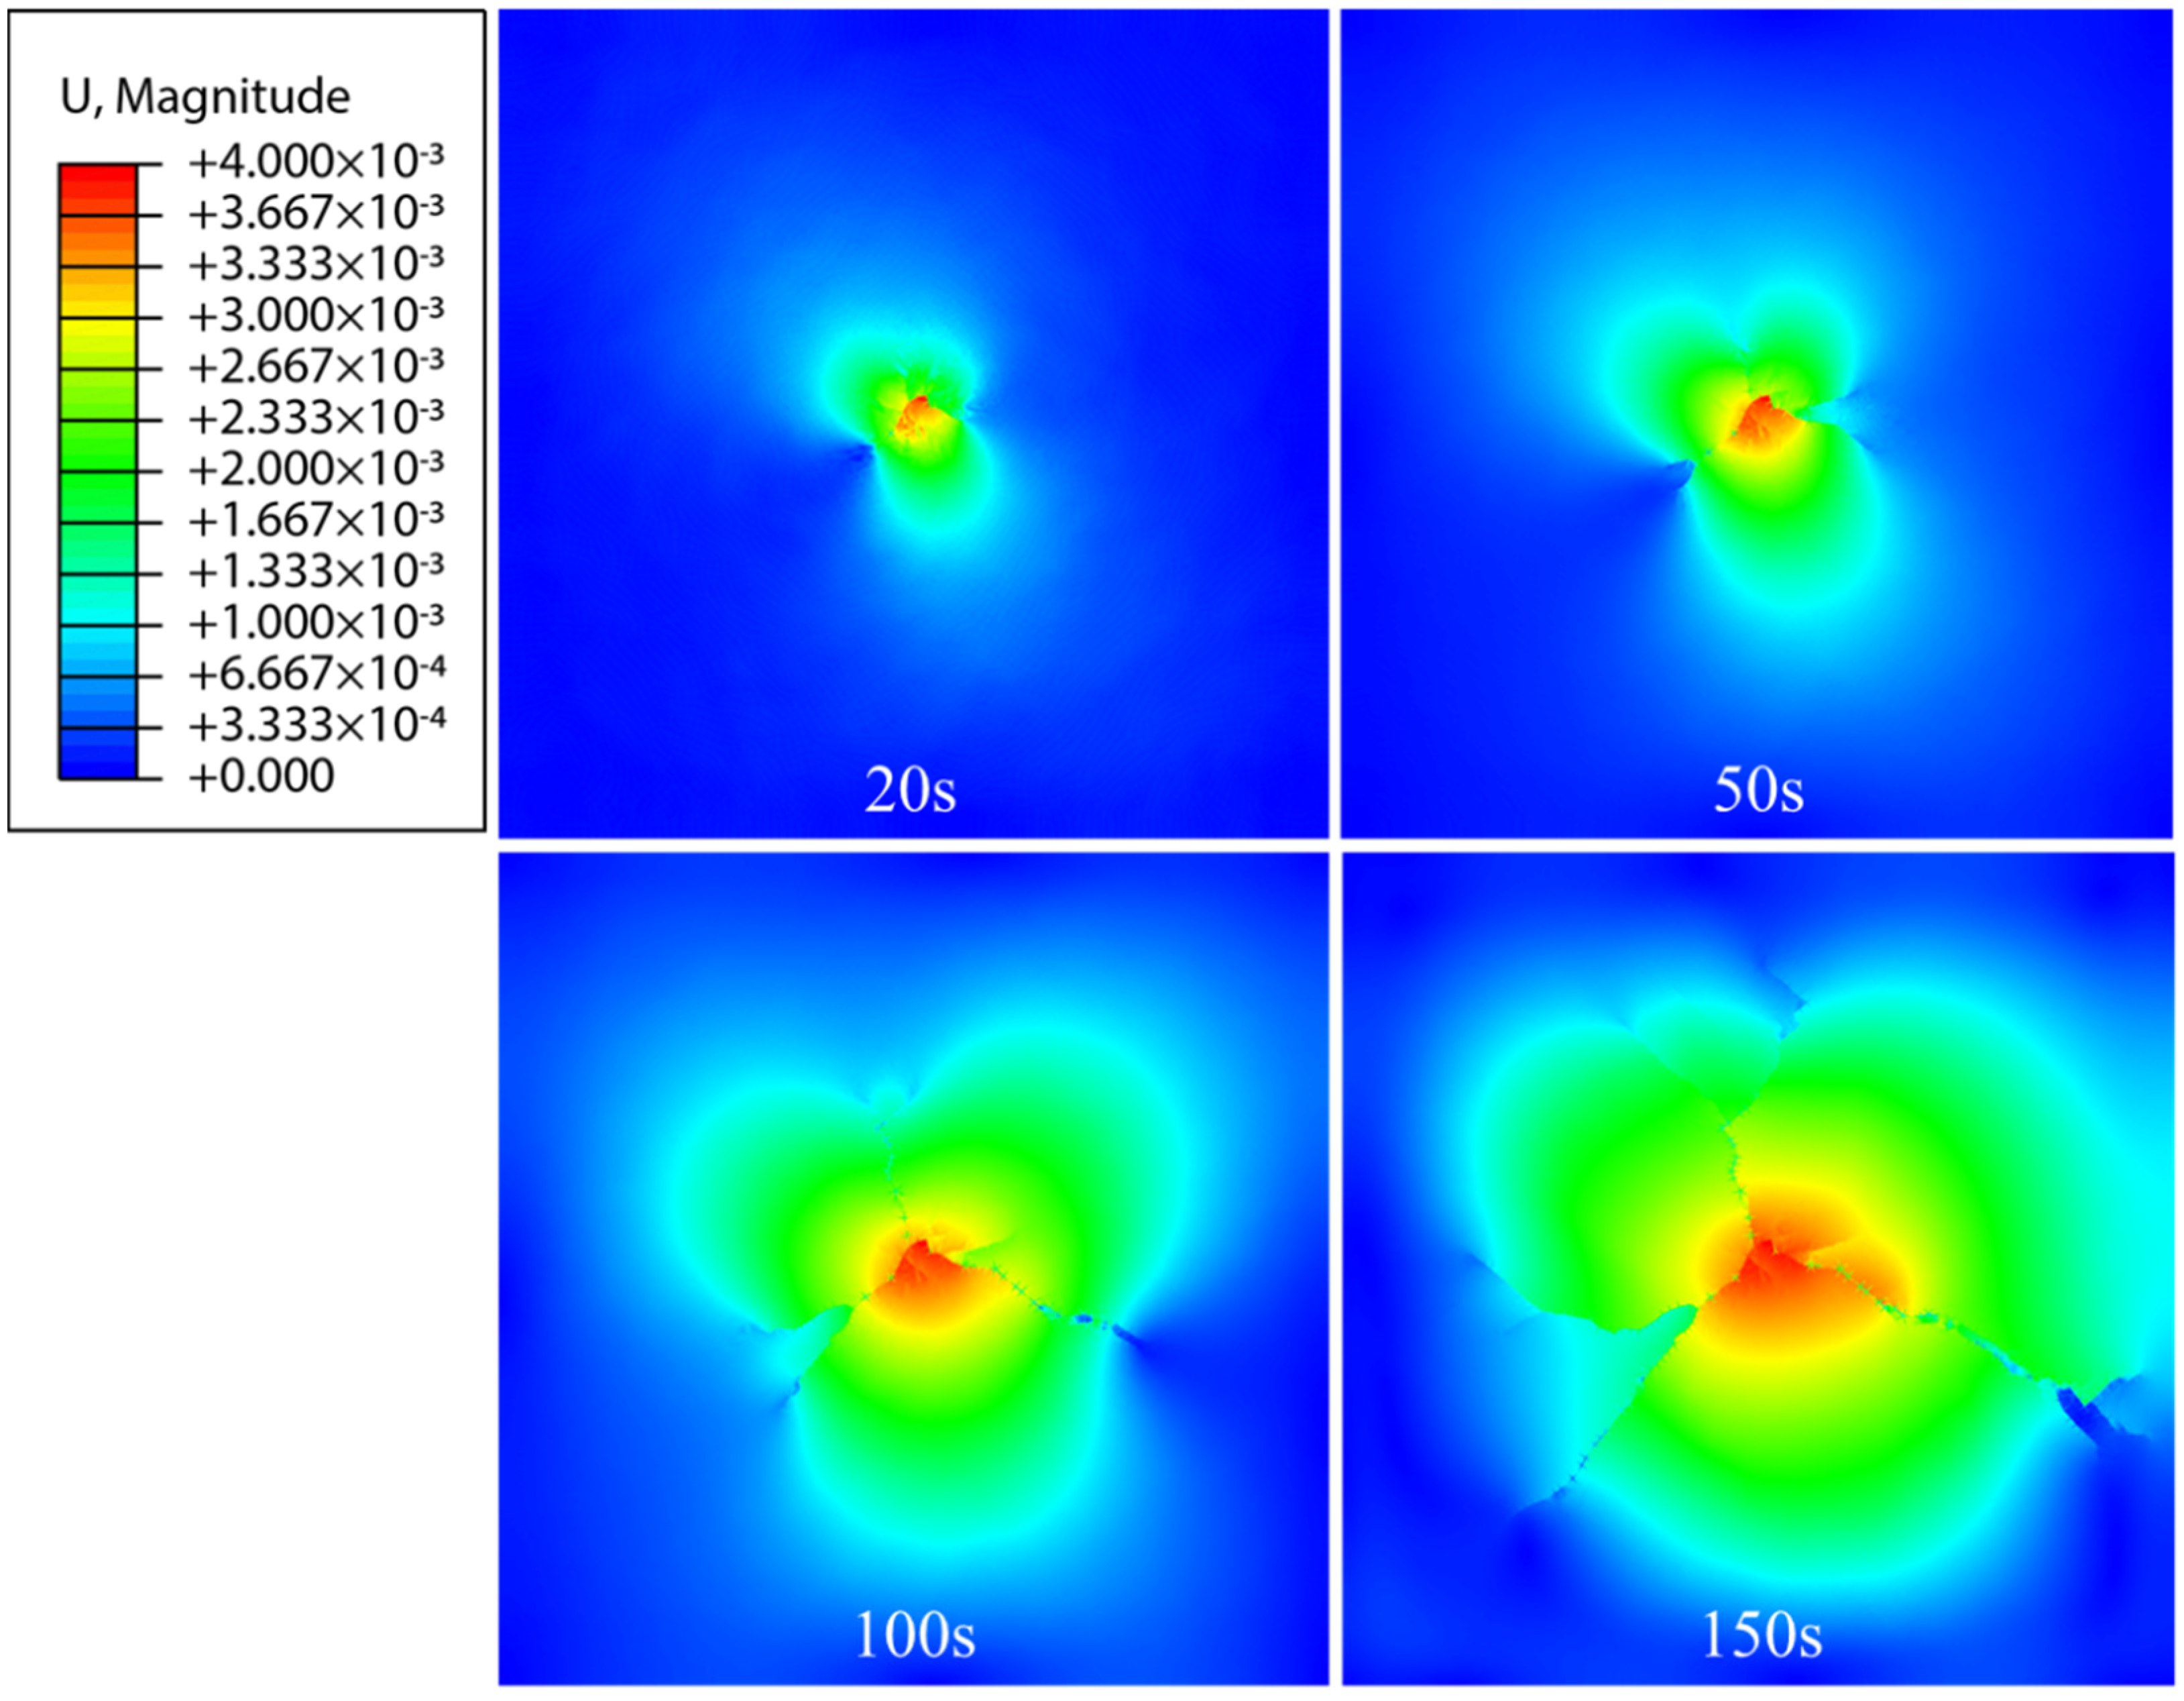
4.1. Fracture Pressure Characteristics
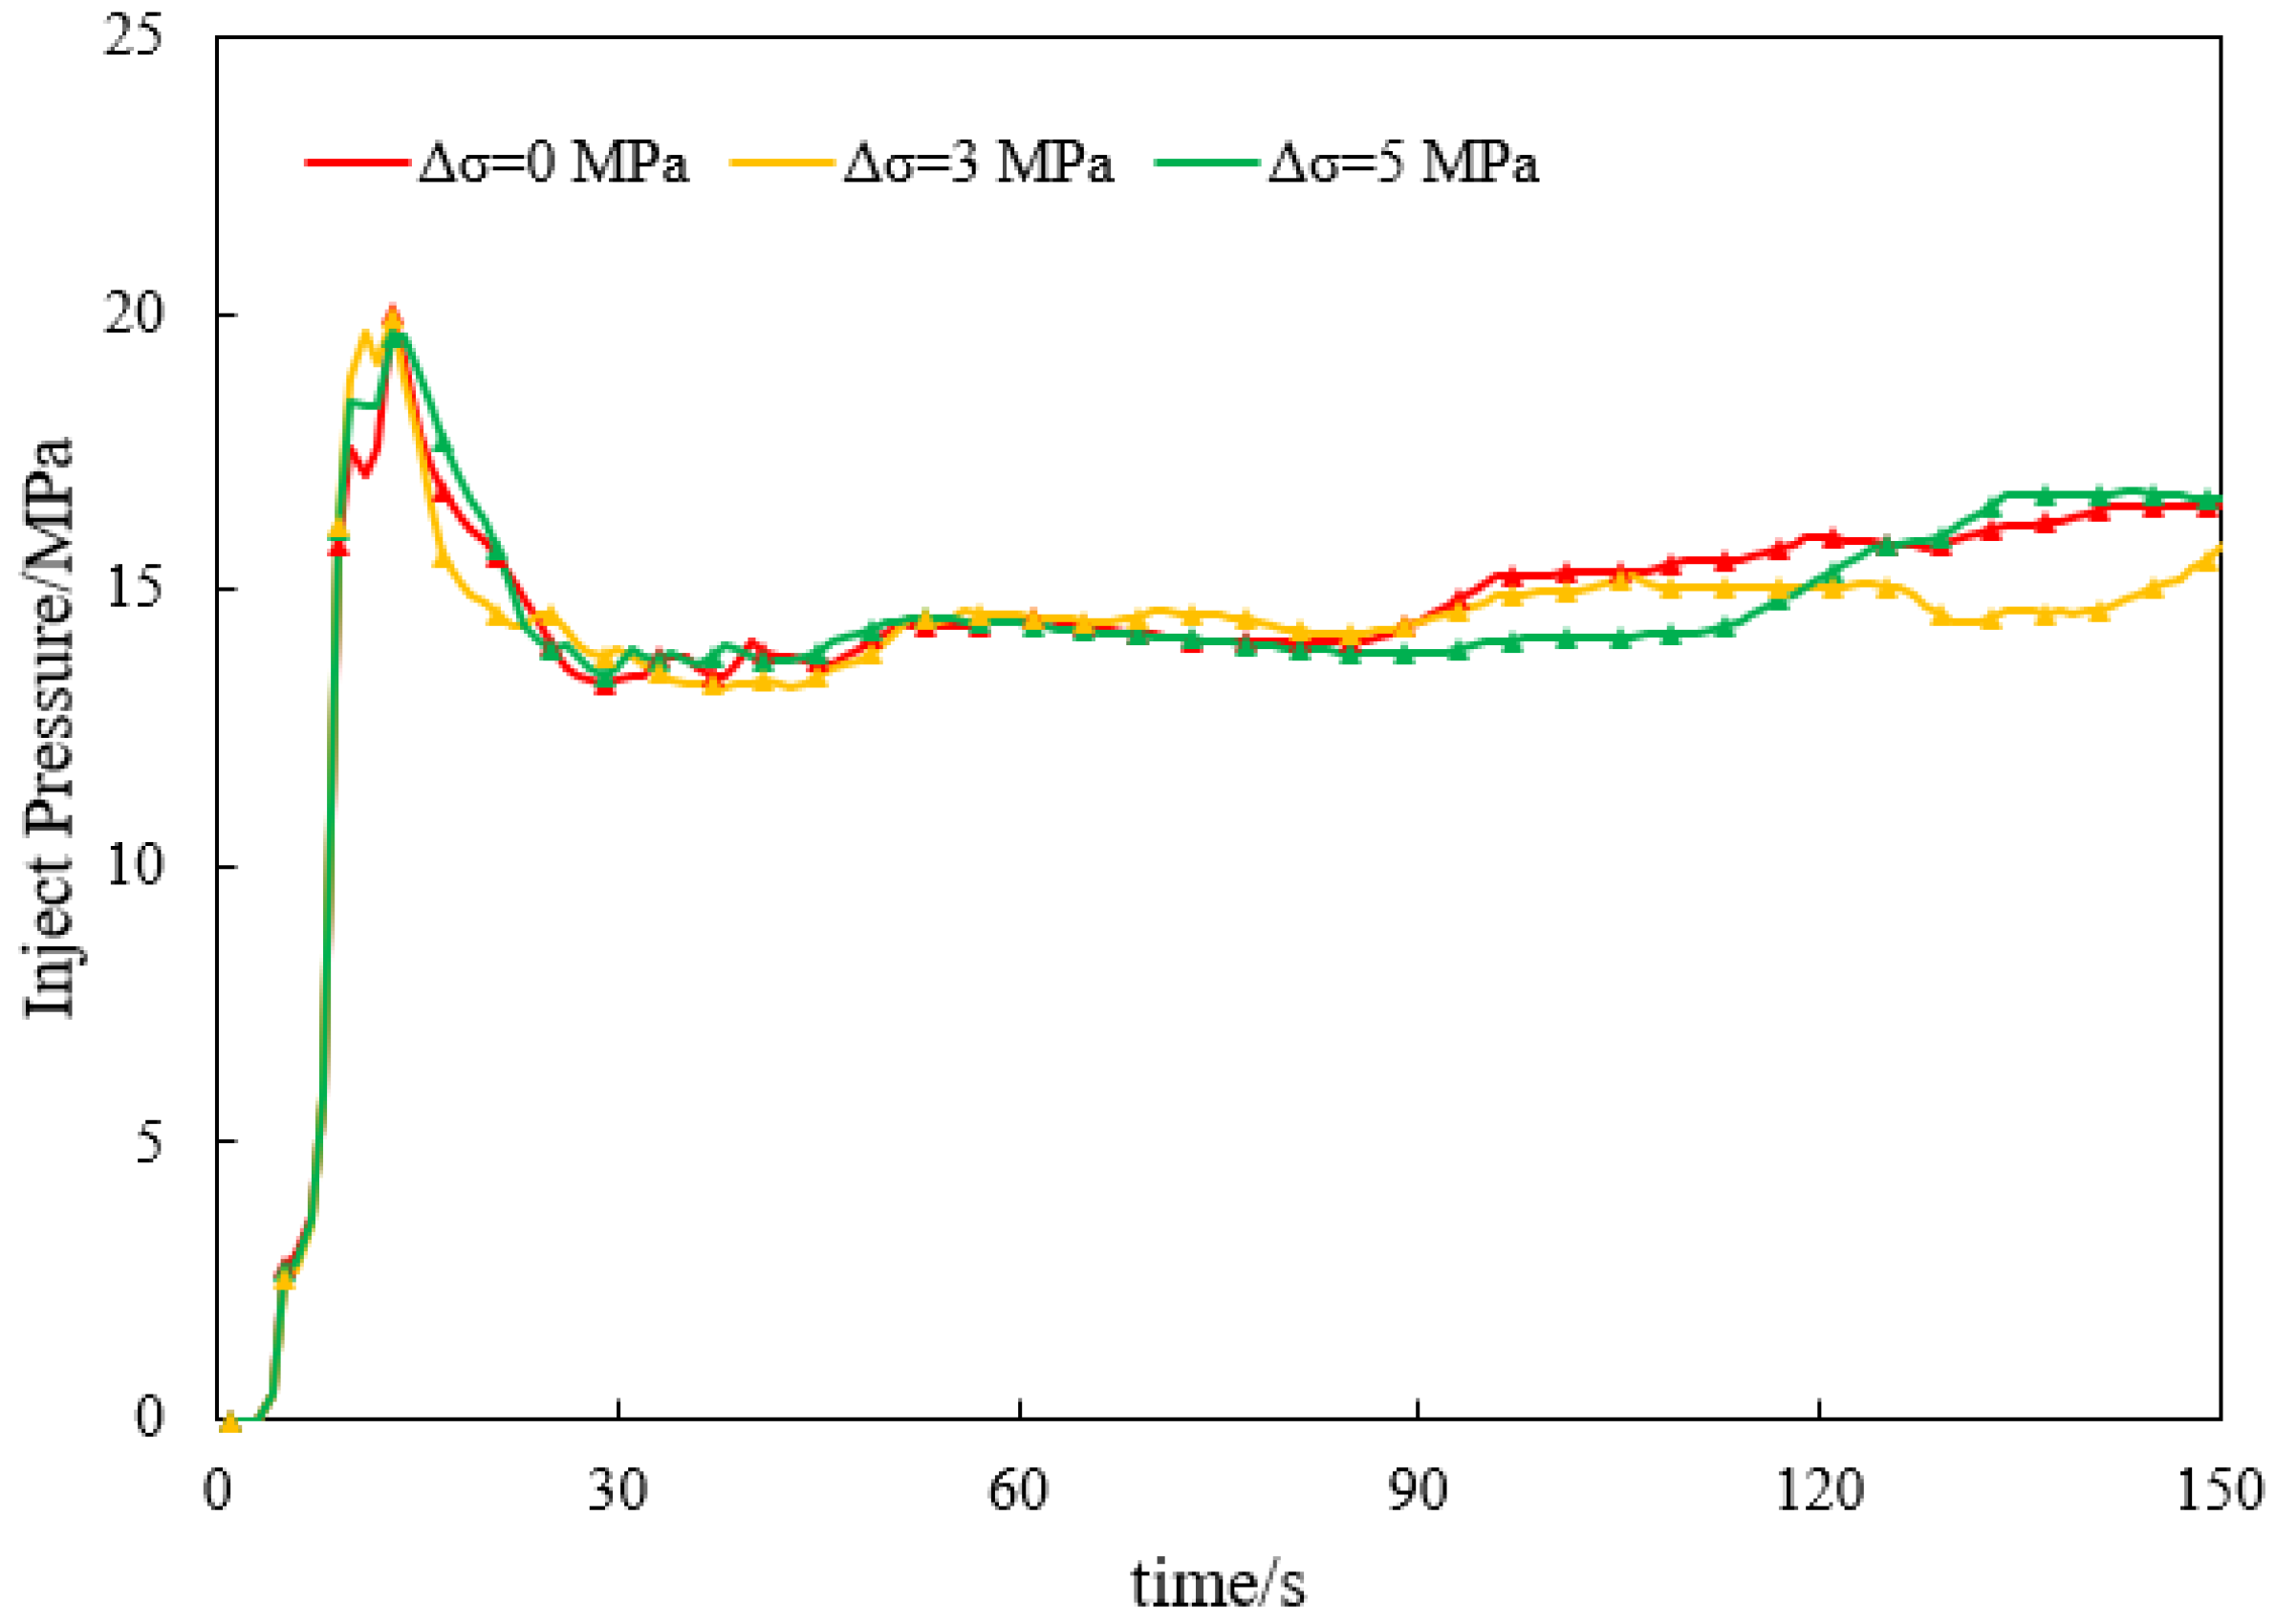
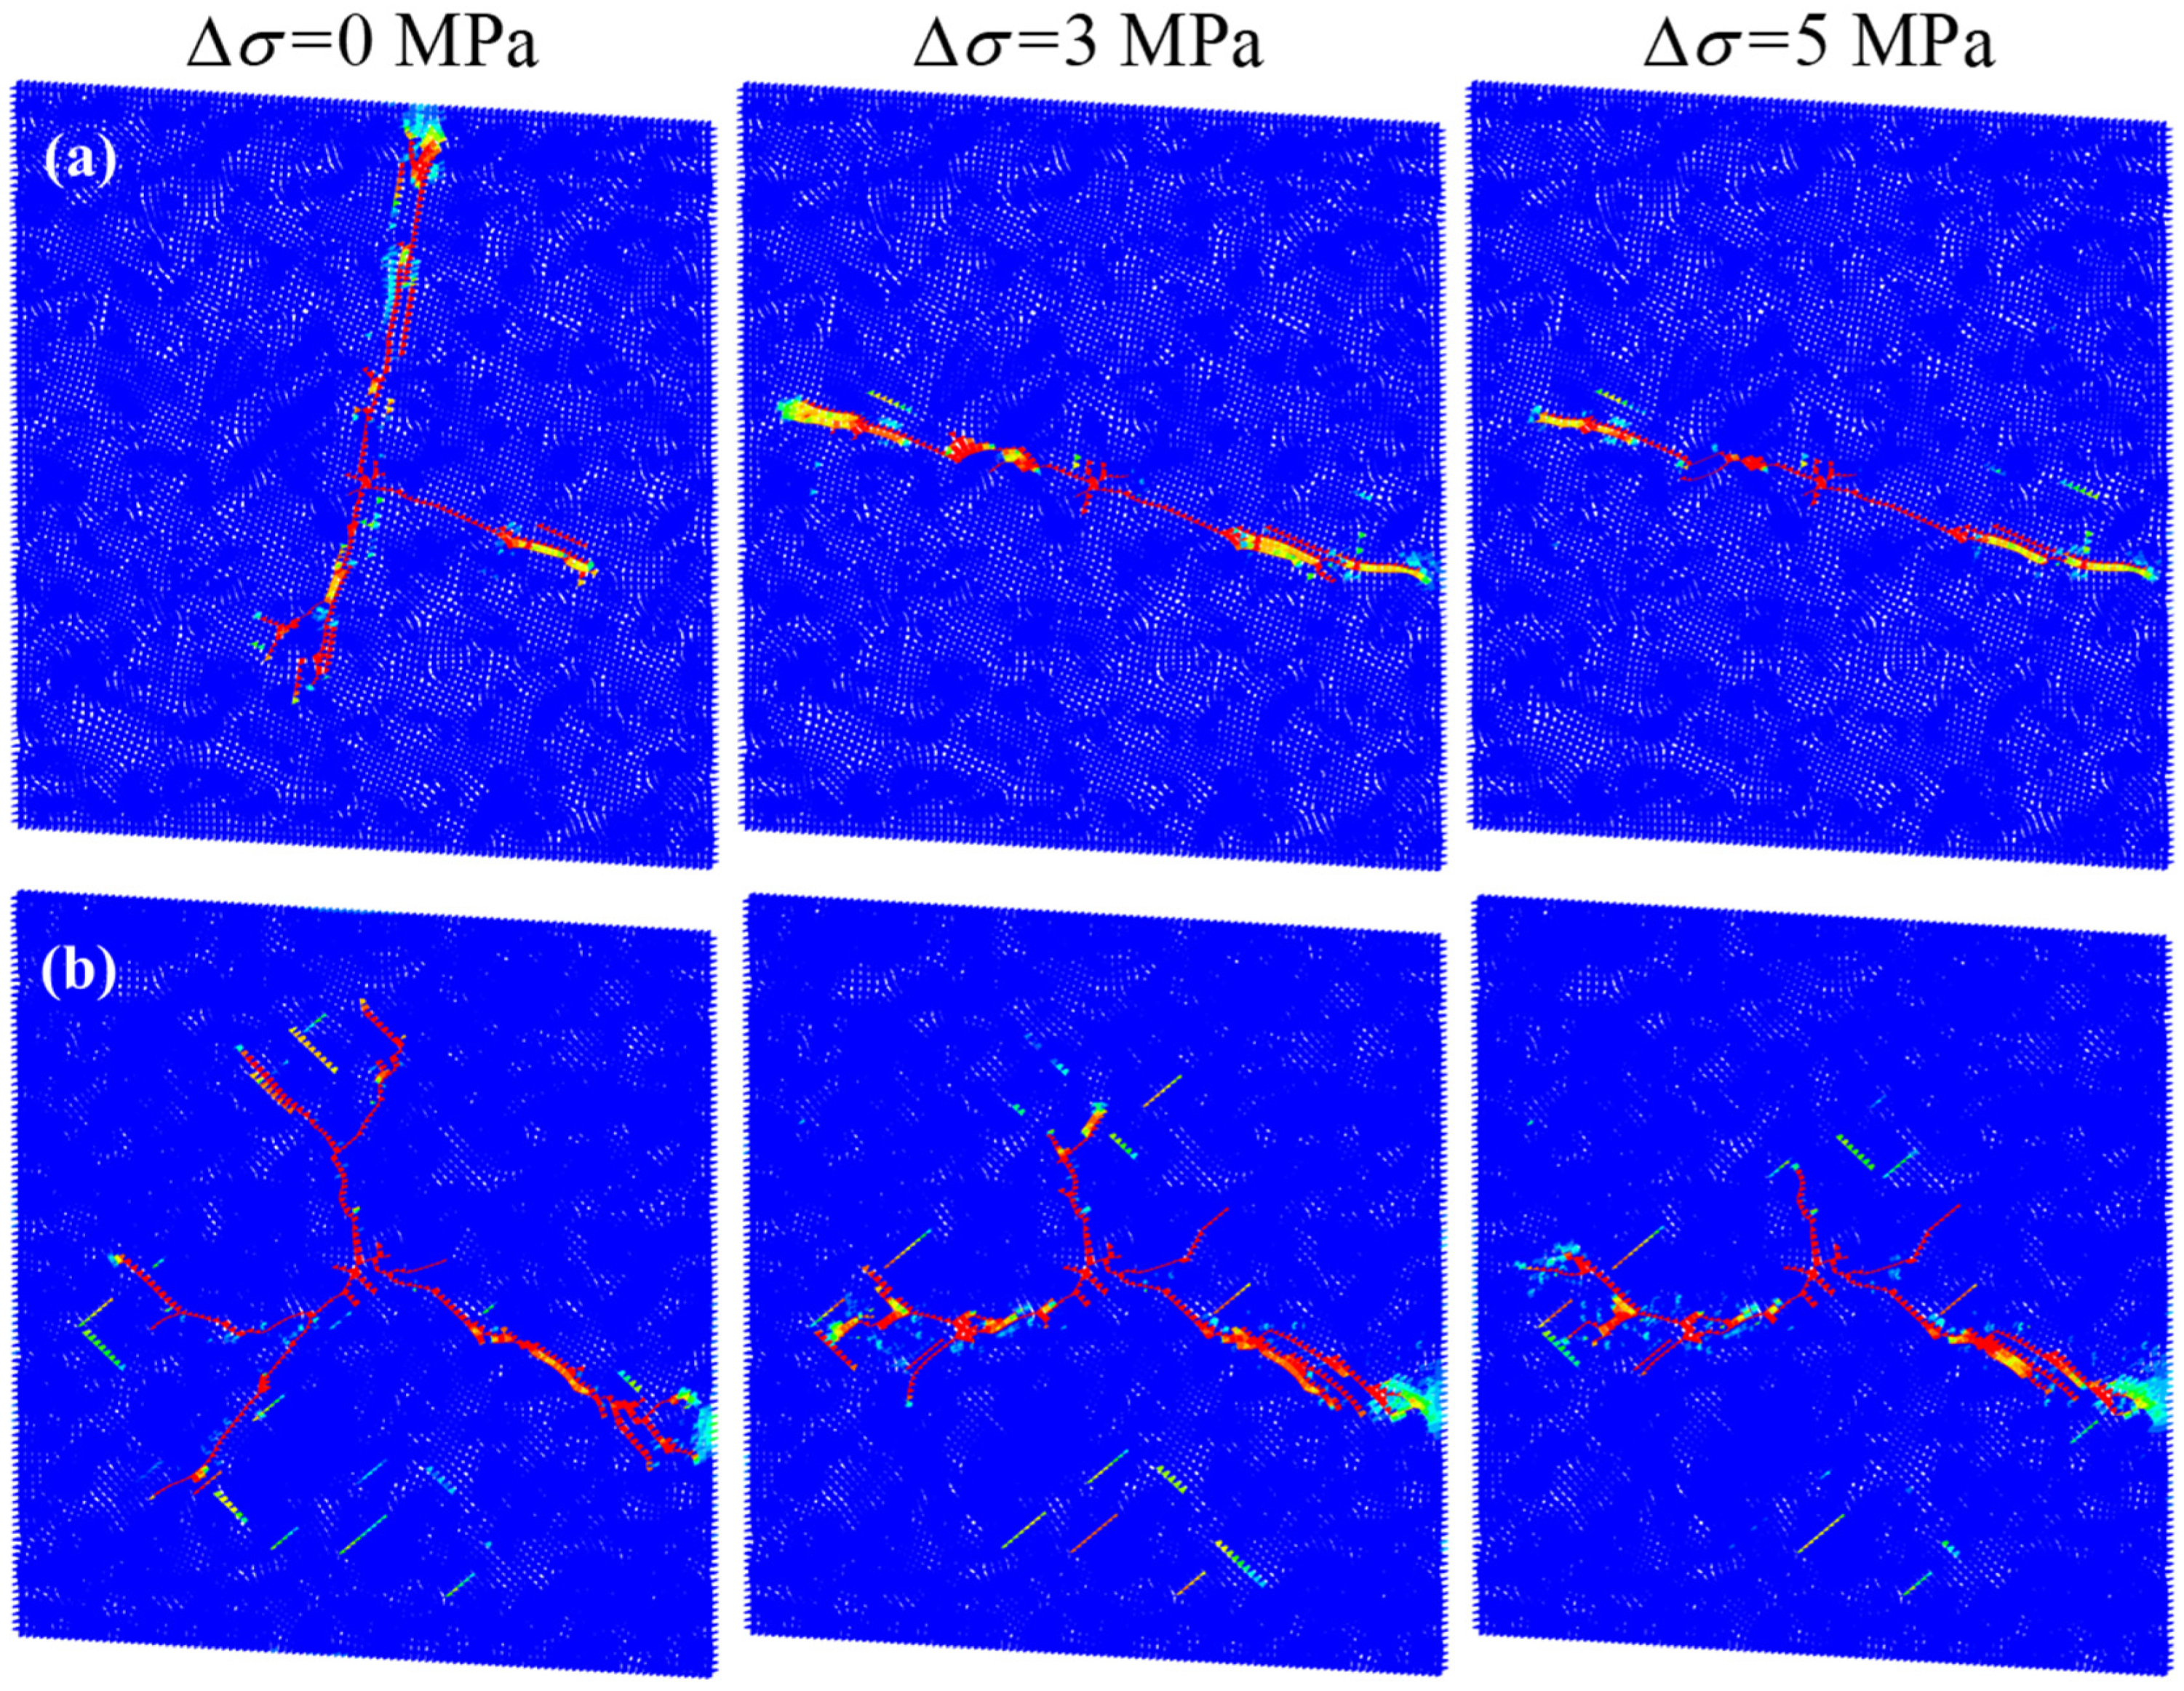
4.2. Effects of In-Situ Stress Difference
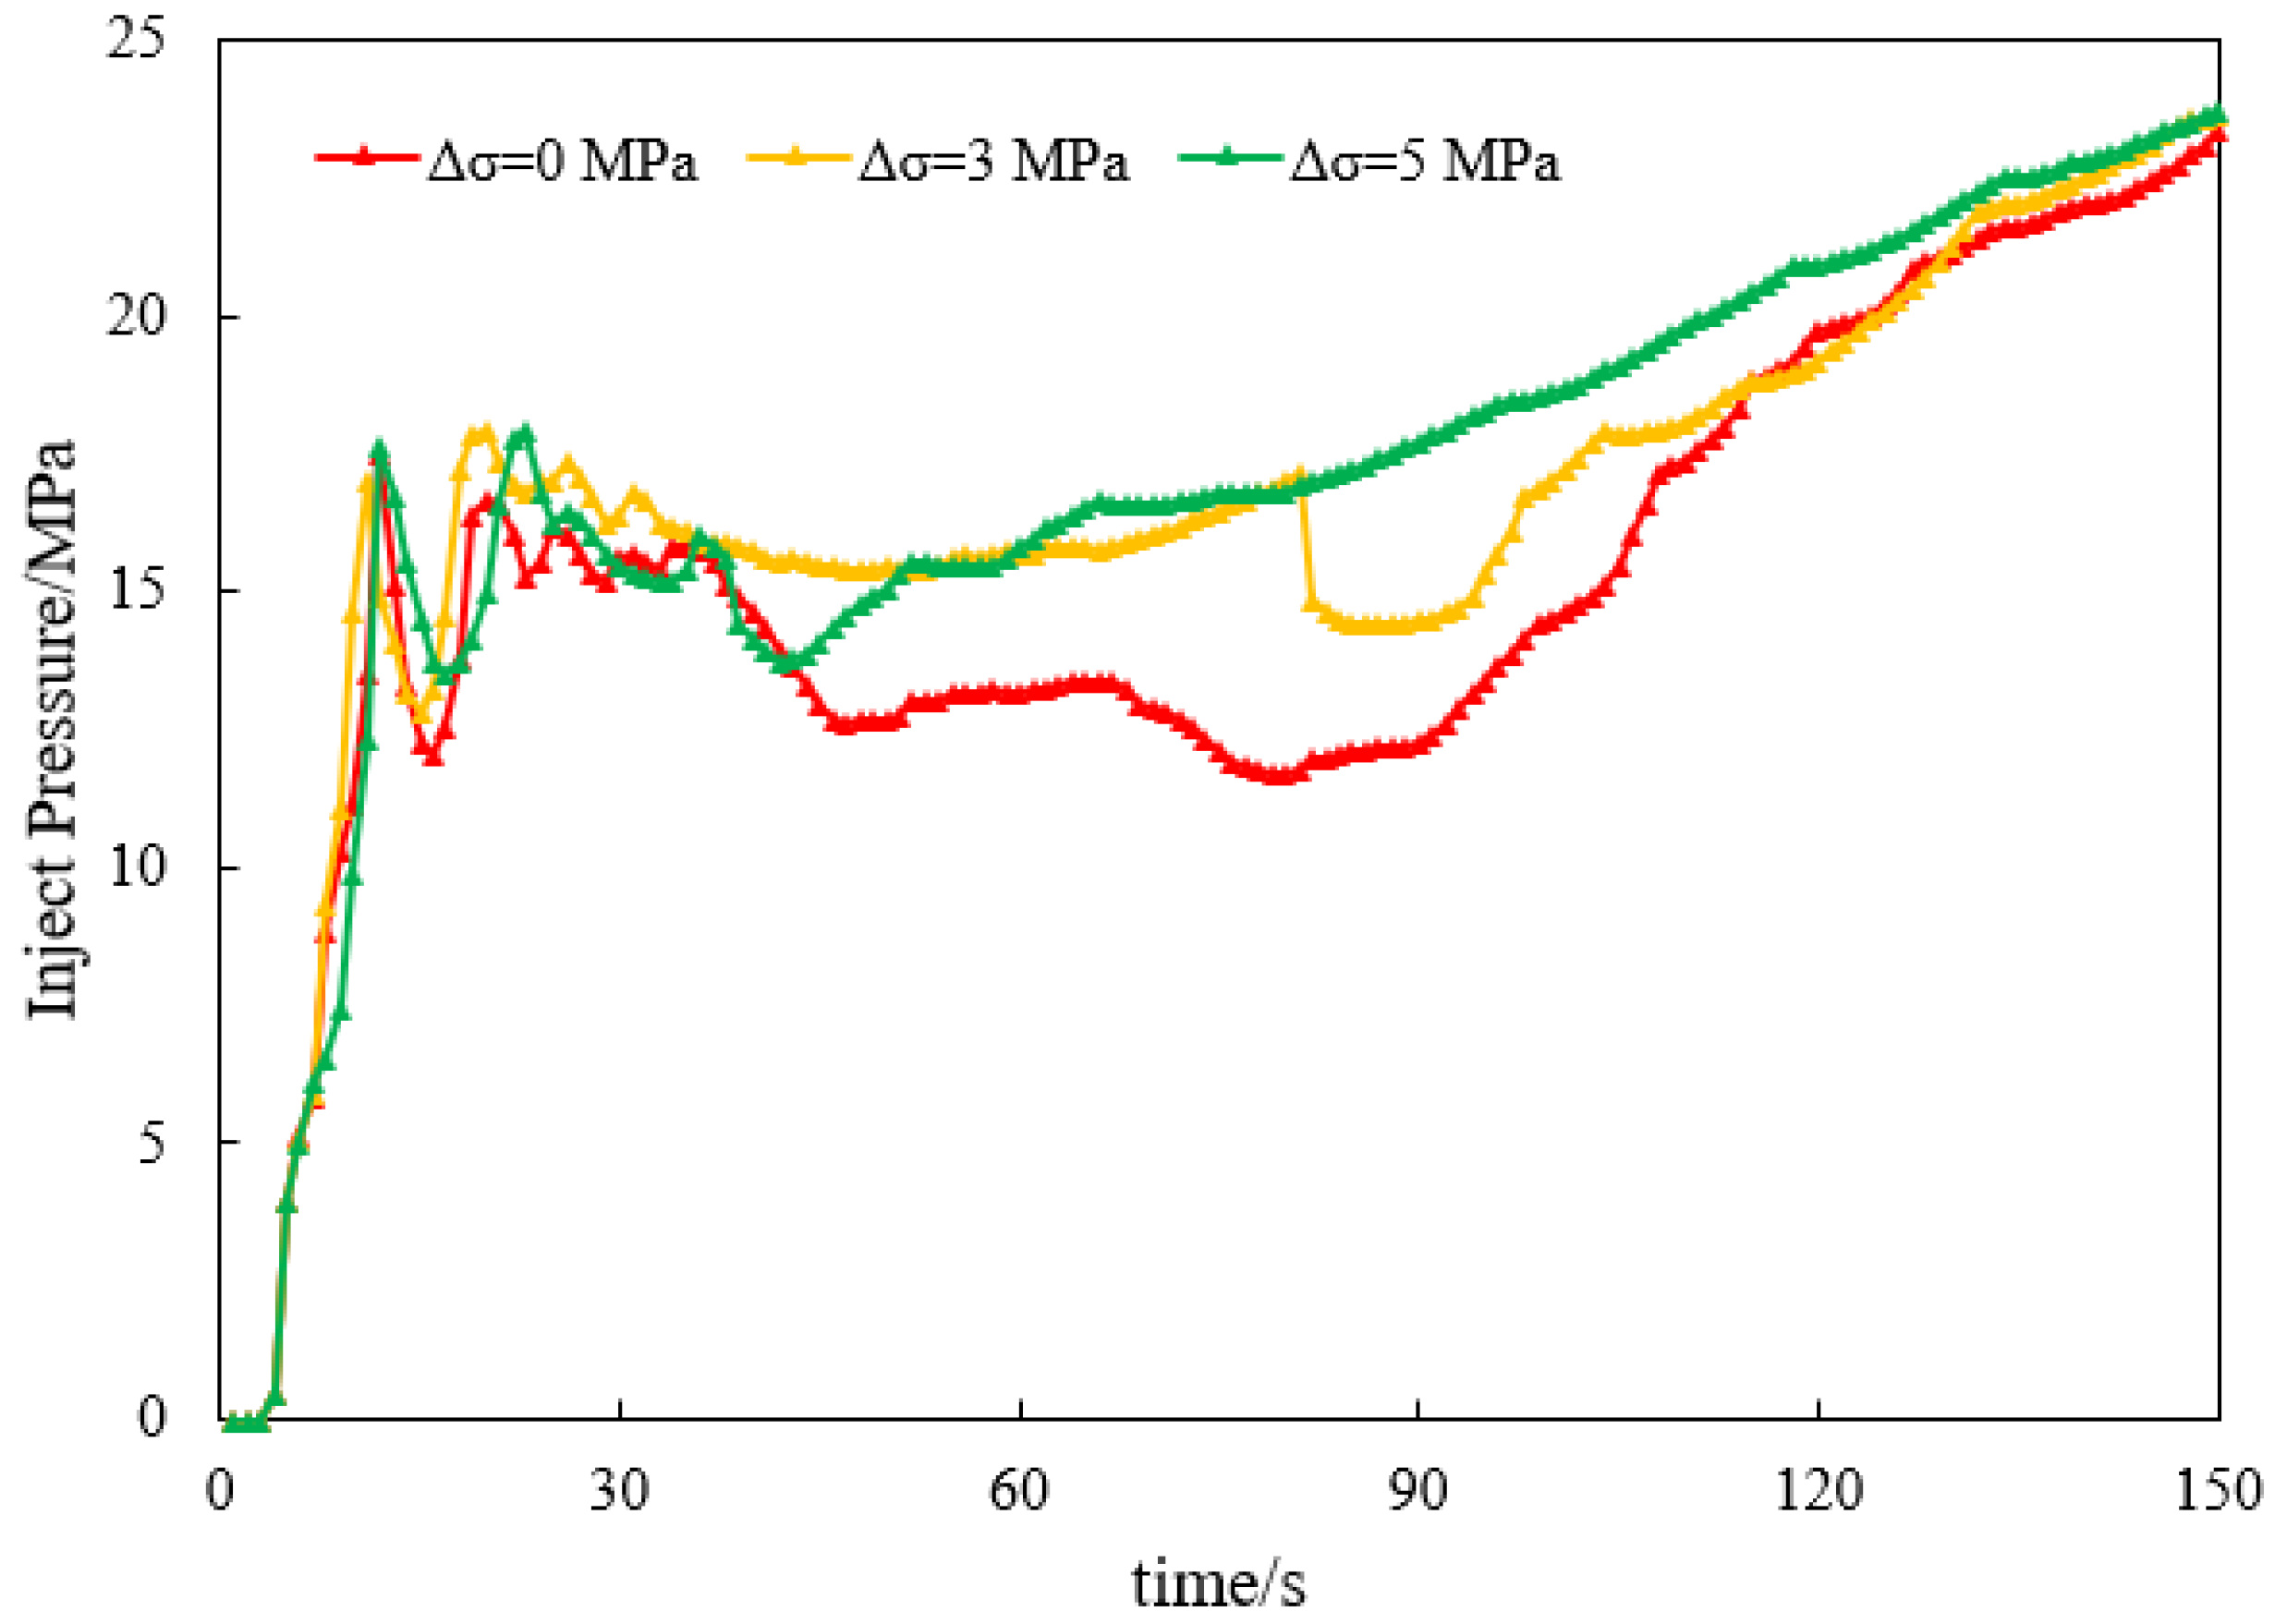
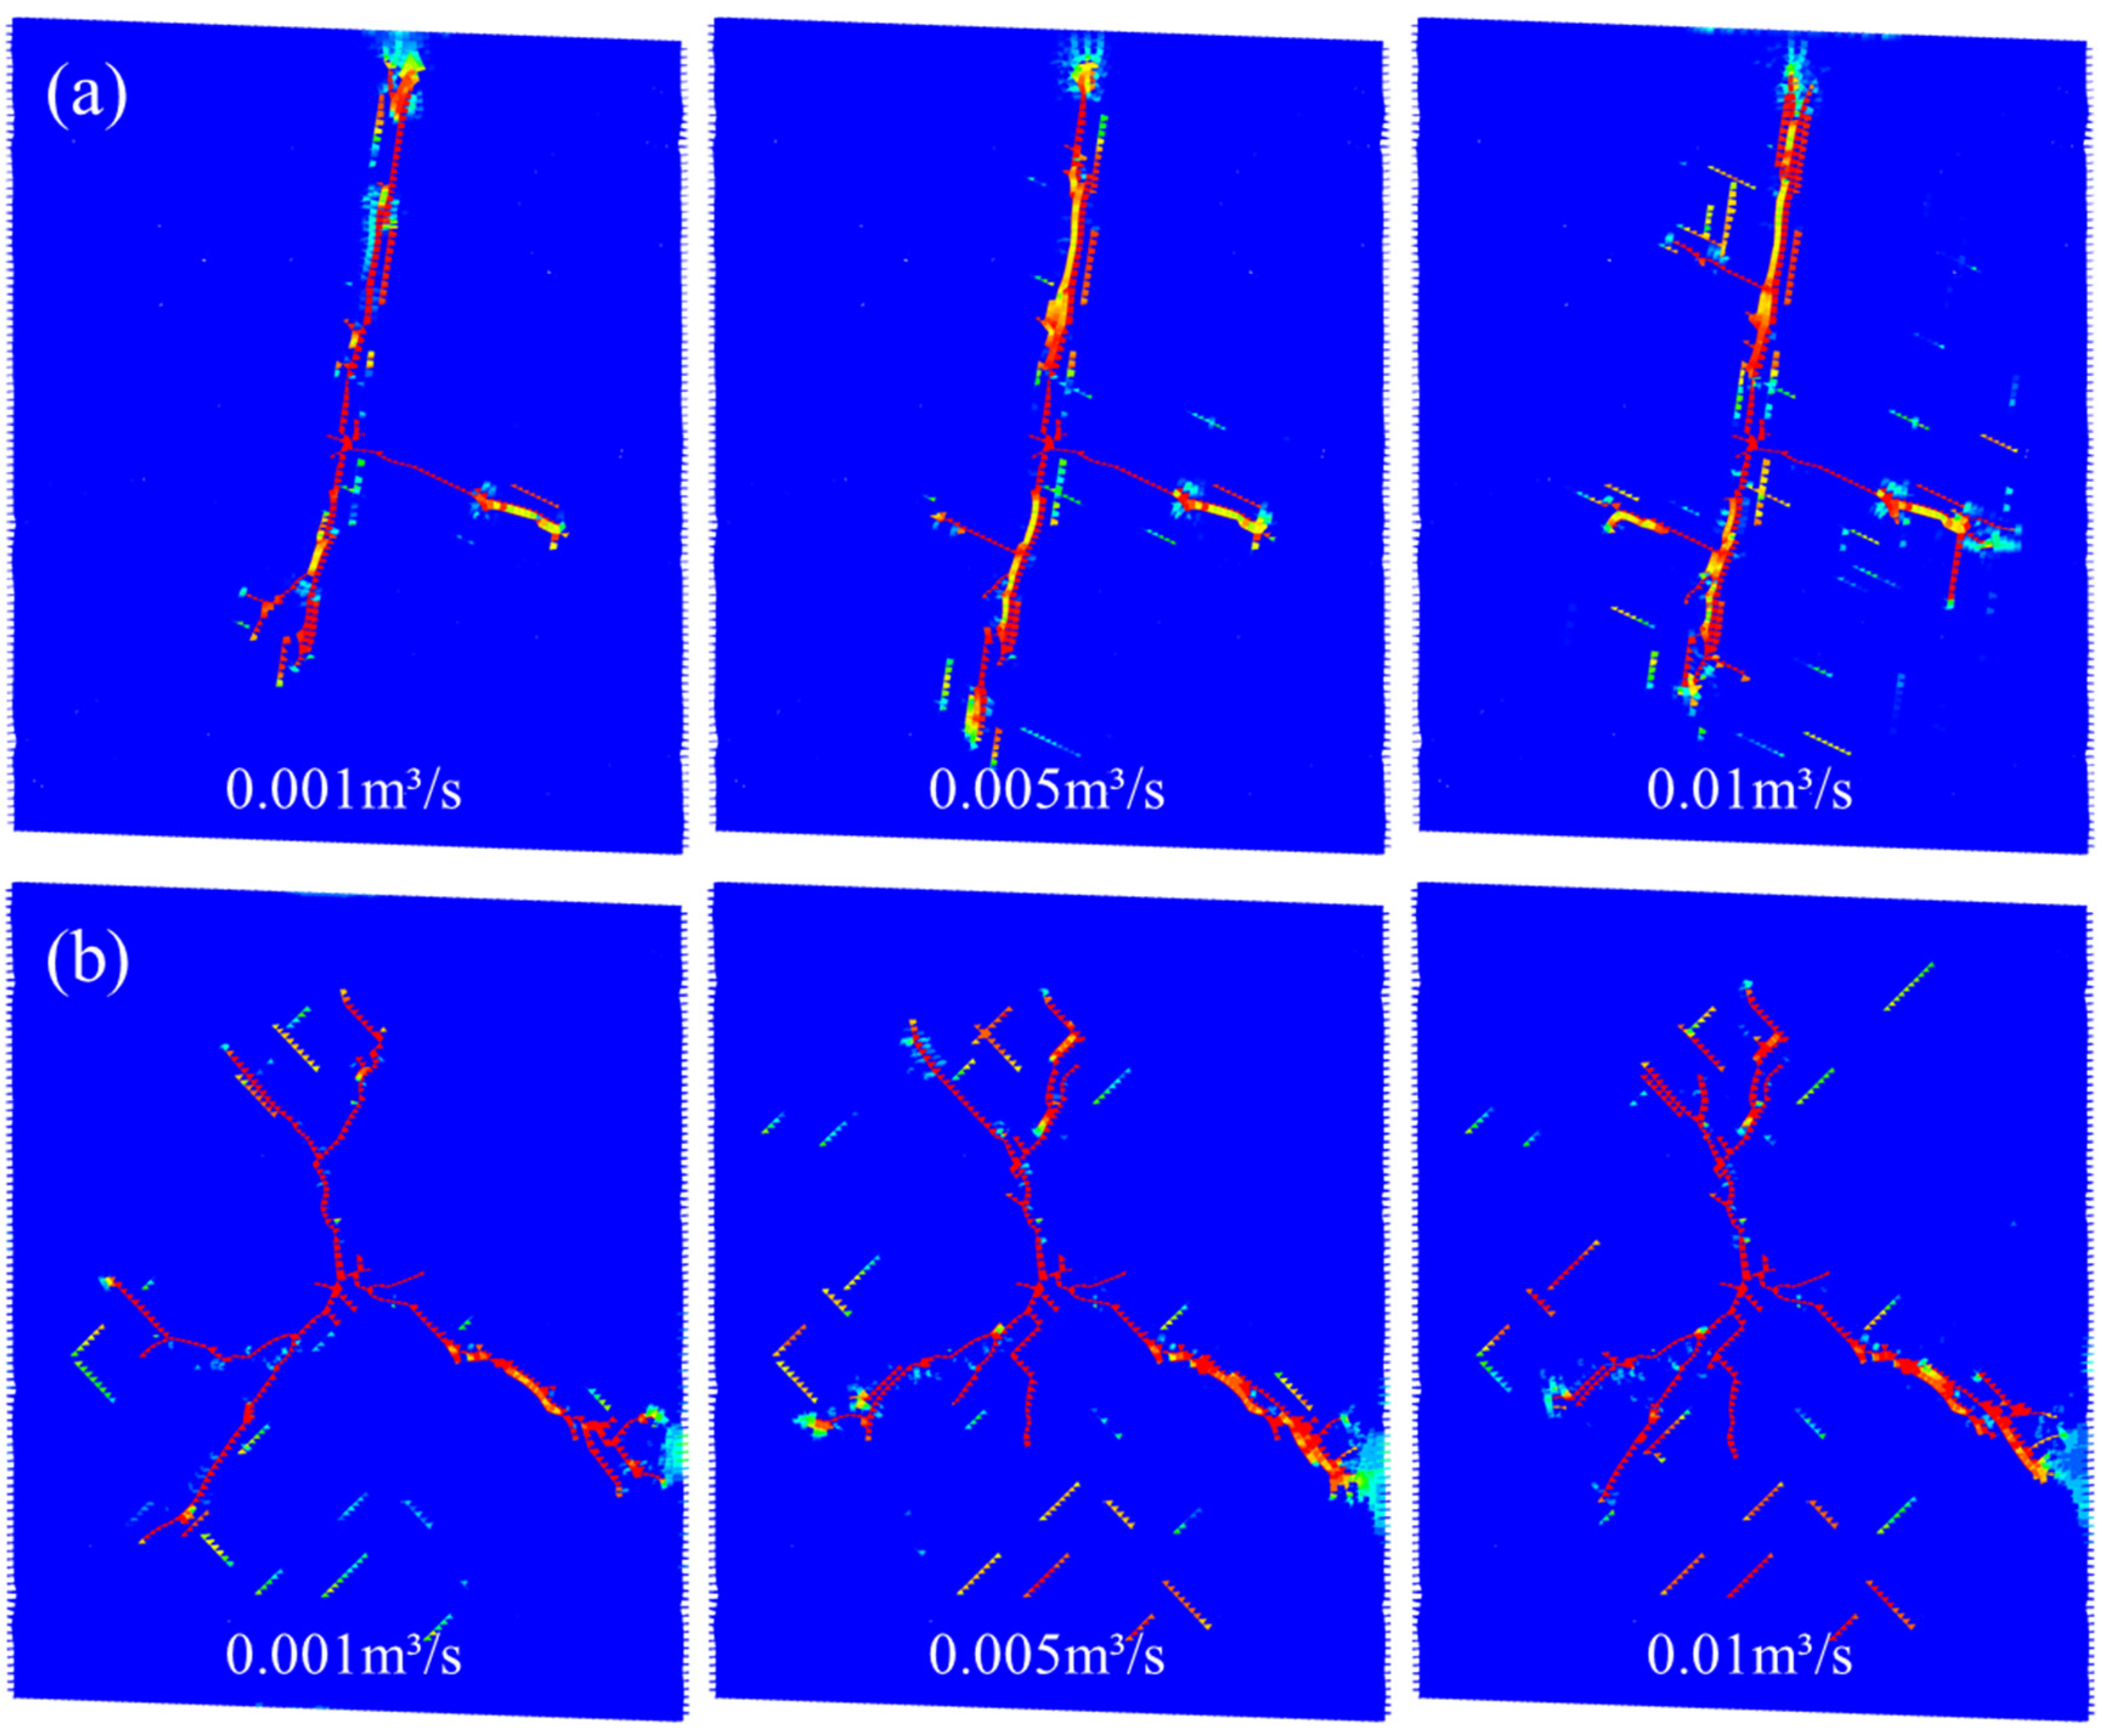
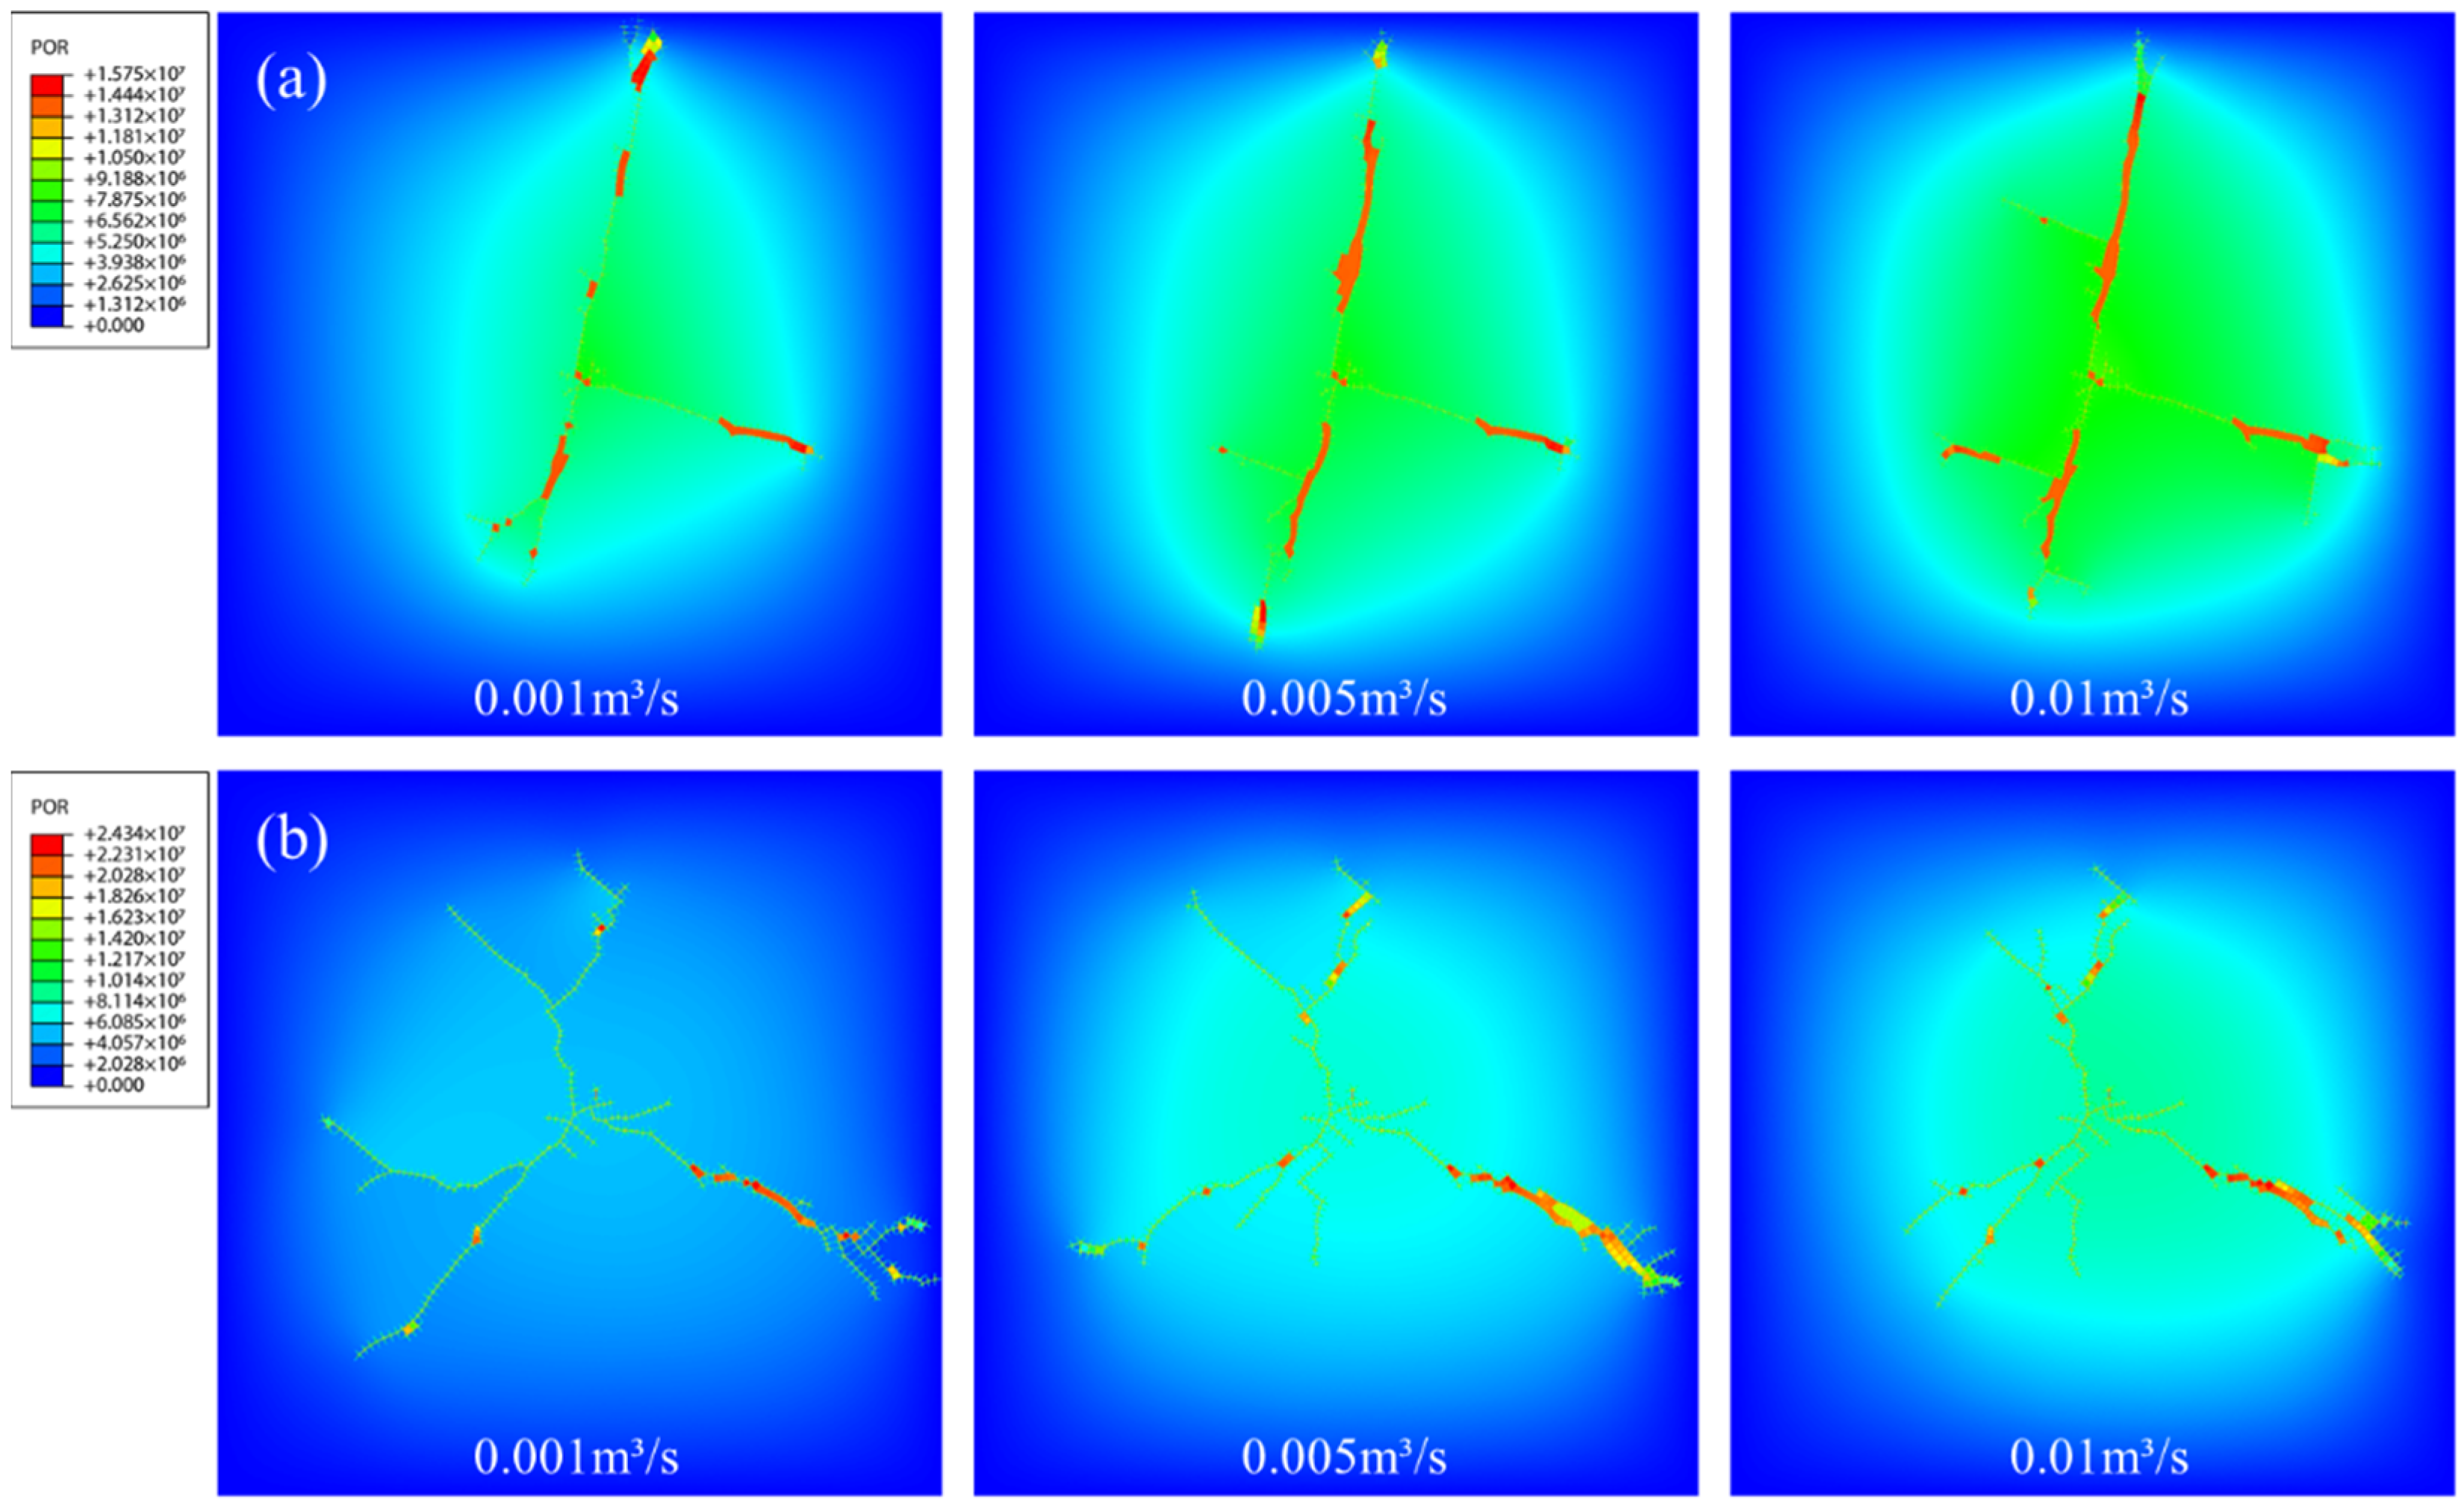
4.3. Effects of Fracturing Fluid Inject Rate
5. Conclusions
- (1).
- With the increase in the in situ stress difference from 0 MPa to 3 MPa, the fracture that was formed by the fracturing process gradually changed from a complex multi-cluster fracture network into a simple single fracture and the fracturing effect decreased gradually. This change was especially obvious when the natural fracture direction was close to the principal stress direction;
- (2).
- The greater the flow rate of the injection point, the higher the fluid pressure in the fracture; however, there was no obvious change in pore pressure in the formation around the fracture. Meanwhile, the greater the flow rate of the injection point, the larger the scale of the fracture network that was formed;
- (3).
- The natural fracture direction had an influence on the fracture network scale and the fracture extension pressure during the fracturing process. In the uniform stress field, while the natural fracture trend was closer to the direction of principal stress, the scale of the fracture network was smaller and the extension pressure was lower.
Author Contributions
Funding
Institutional Review Board Statement
Informed Consent Statement
Conflicts of Interest
Nomenclature
| , , | The stiffness in the three principal directions of the cohesive element, Pa/m; |
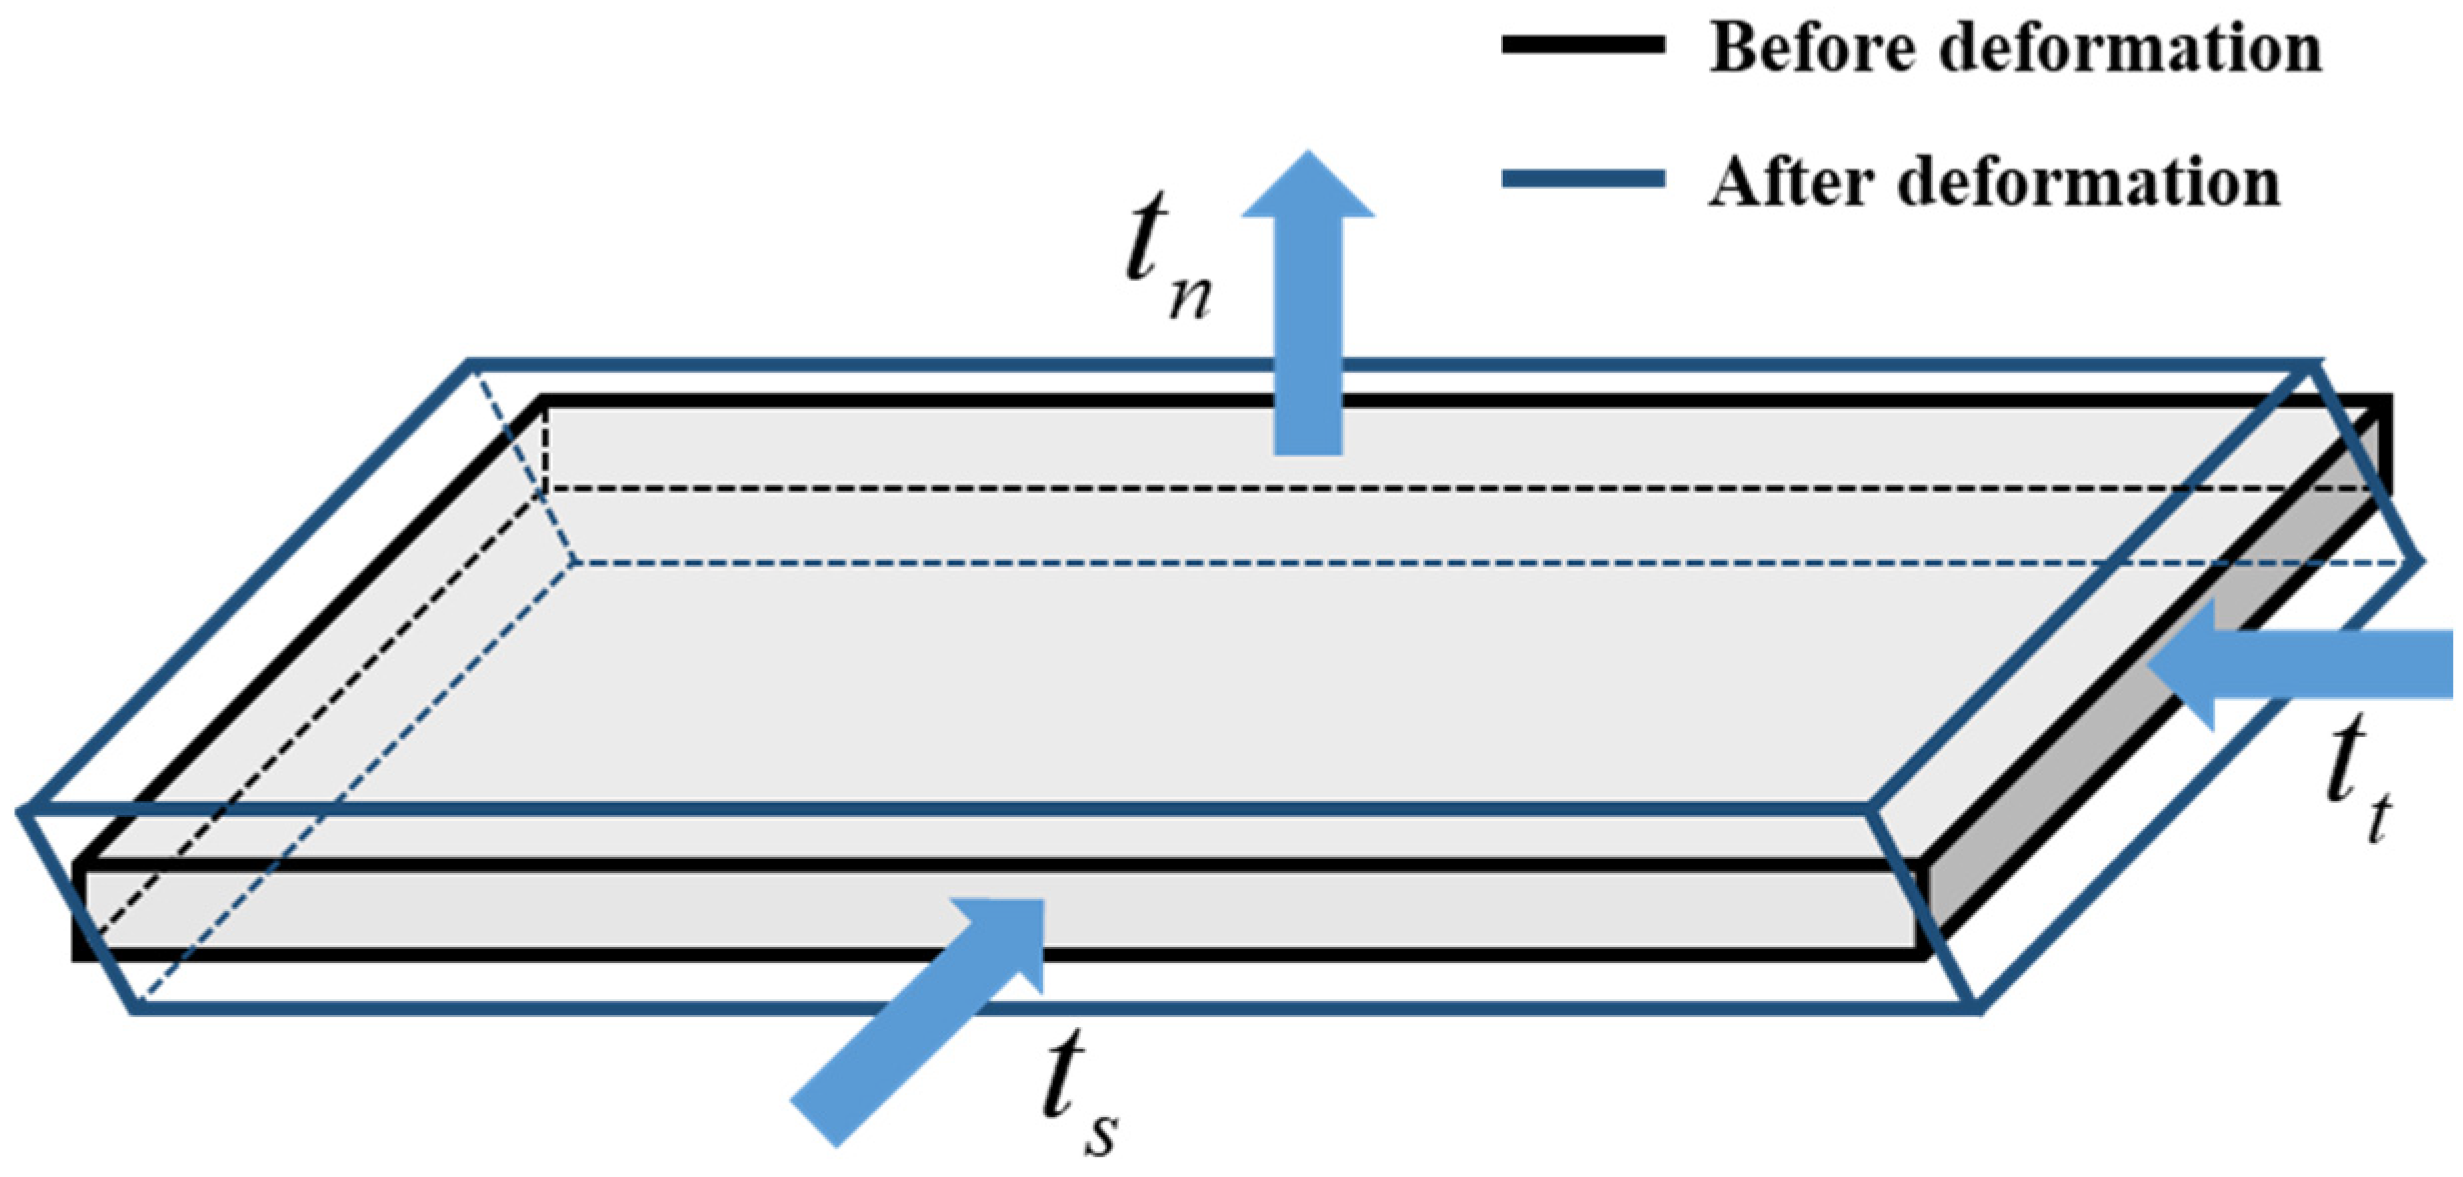
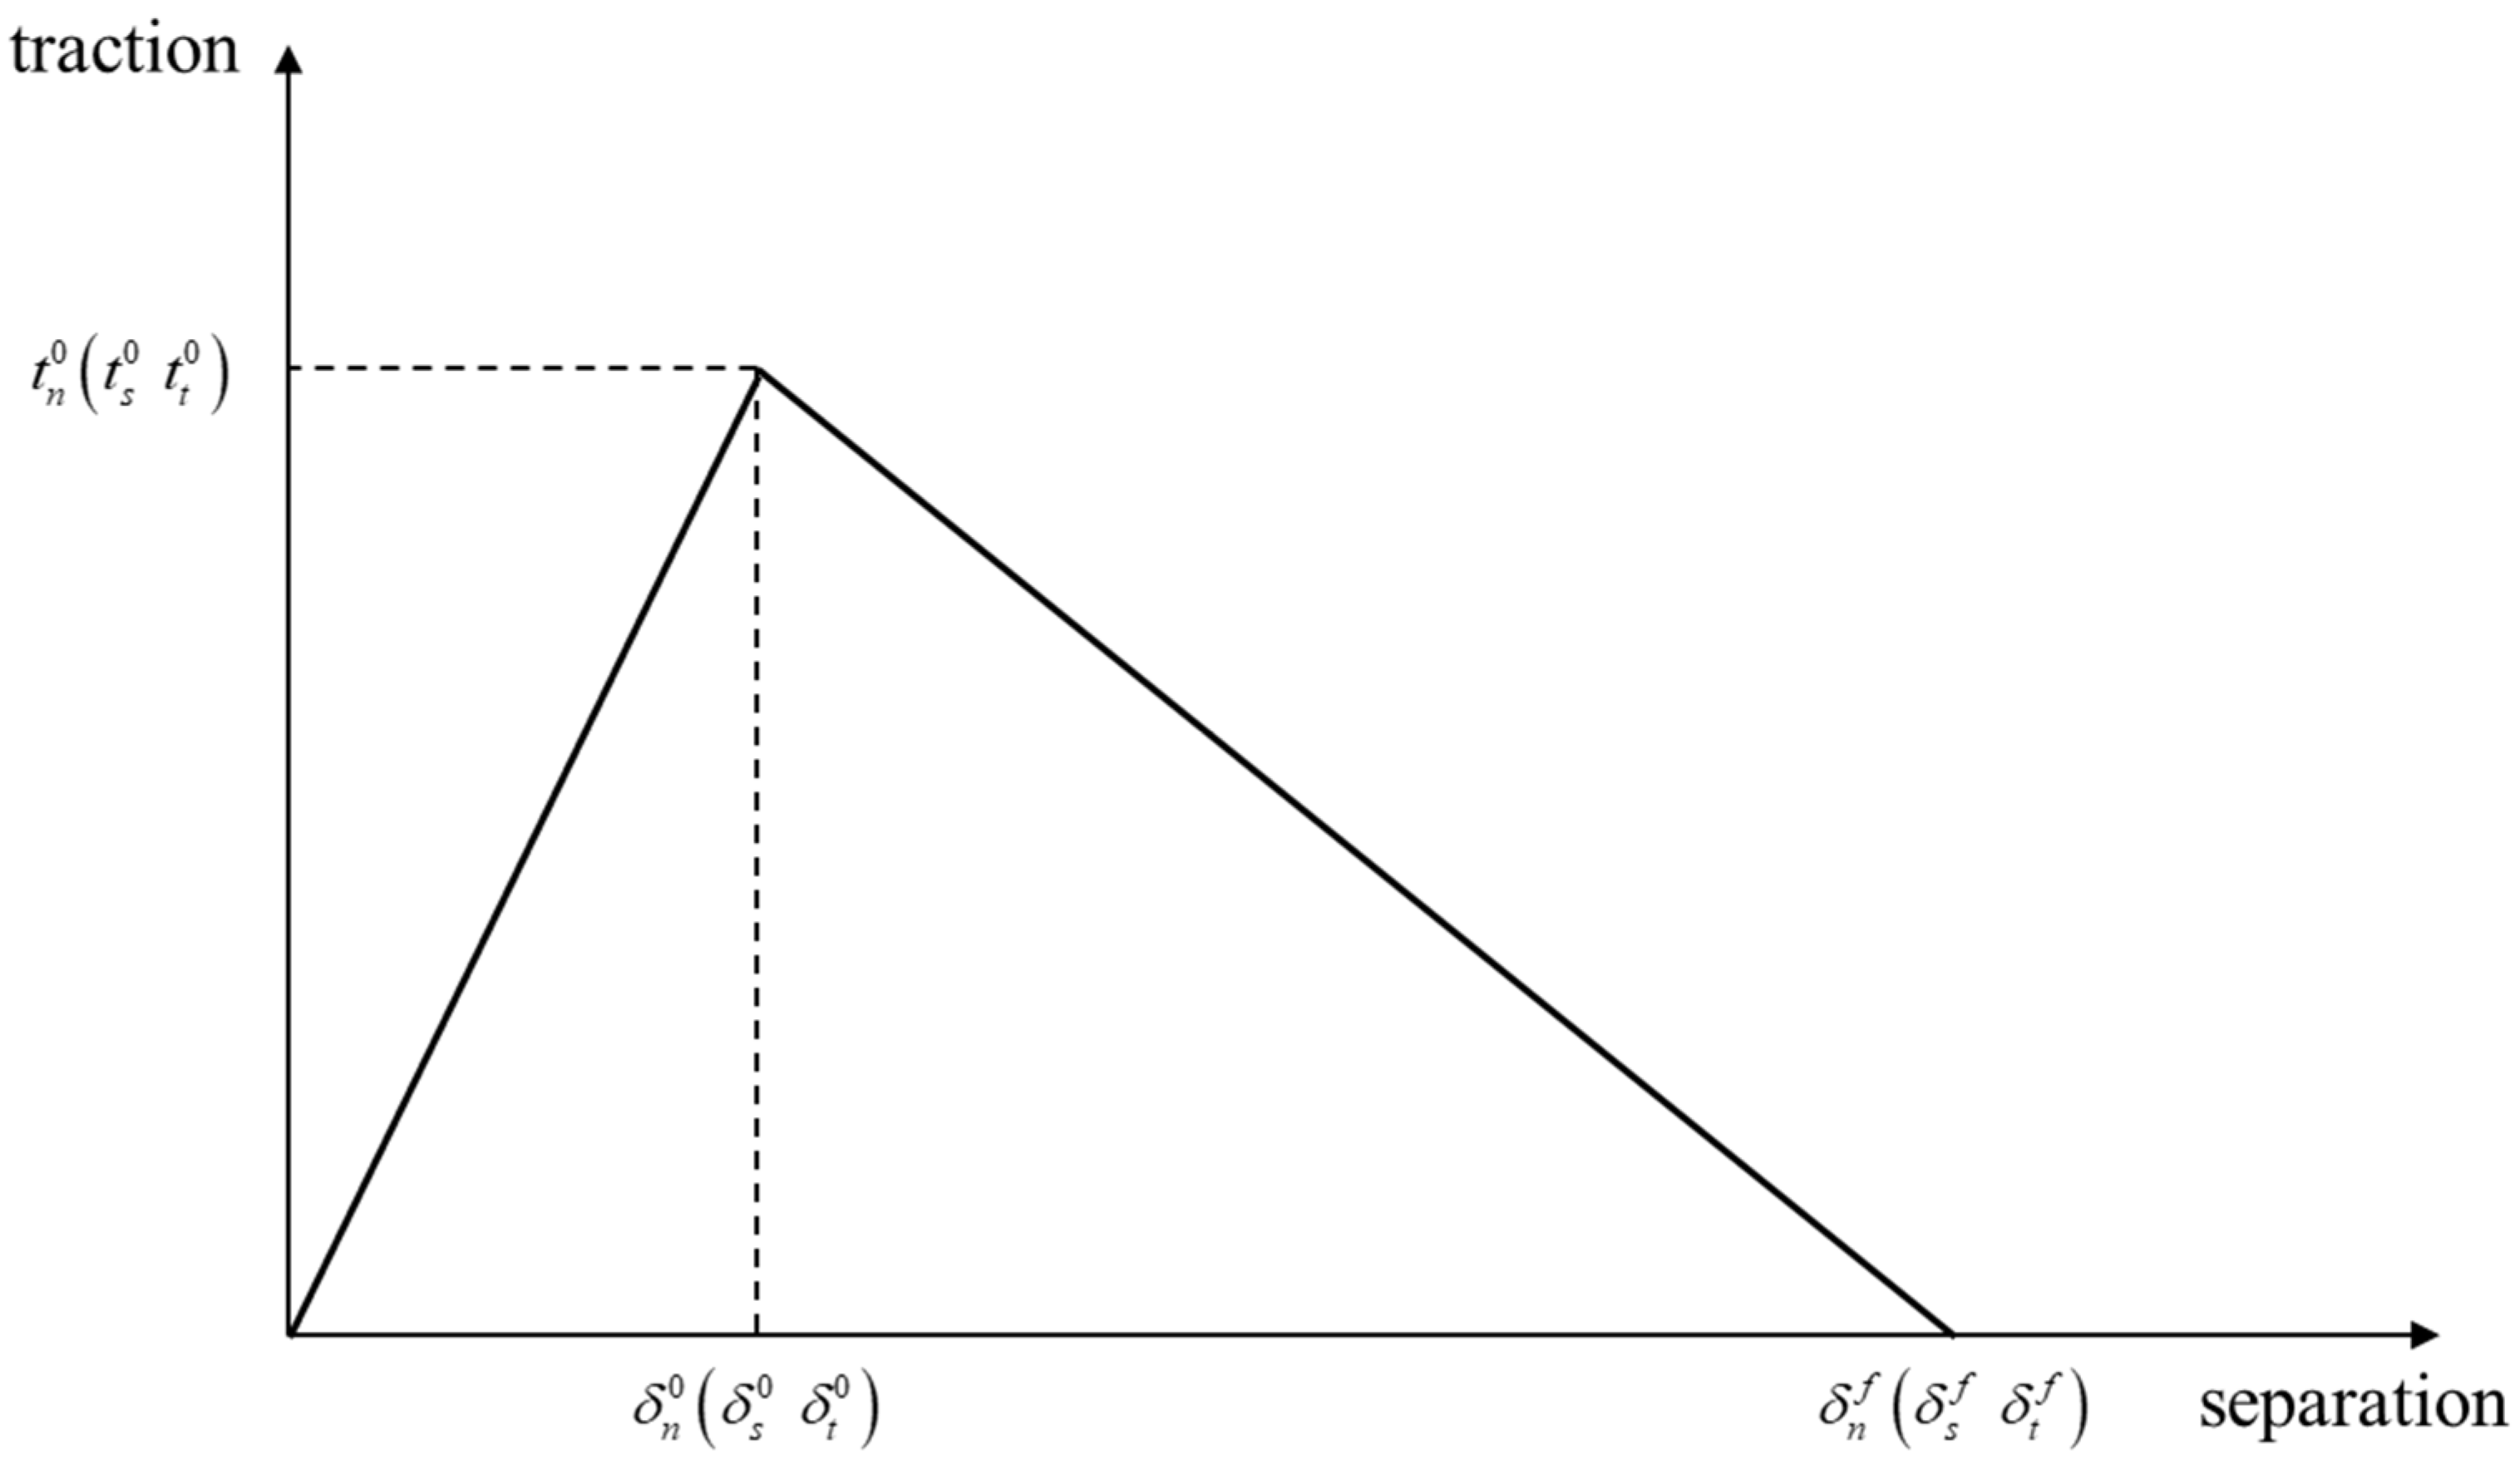
| , , | The traction in the three principal directions of the cohesive element, Pa; |
| , , | The separation in the three principal directions of the cohesive element, m; |
| Macaulay brackets; | |
| , , | The strength of the cohesive element in the three principal directions, Pa; |
| The damage variable; | |
| , , | The predicted tractions; |
| The flow velocity in porous media, m/s; | |
| The permeability of the formation, m2; | |
| The viscosity of the fluid, ; | |
| The gradient of pore pressure; | |
| The tangential flow rate in the fracture, m/s; | |
| The tangential fluid pressure gradient in the fracture, Pa/m; | |
| The fracture opening, m; | |
| , | The flow rate of the fluid in a fracture leakoff to both sides of the fracture wall, m/s; |
| , | The pore pressure on the outside of the fracture wall, Pa; |
| , | The leakoff coefficient, . |
References
- Dahi-Taleghani, A.; Olson, J.E. Numerical Modeling of Multistranded-Hydraulic-Fracture Propagation: Accounting for the Interaction Between Induced and Natural Fractures. SPE J. 2011, 16, 575–581. [Google Scholar] [CrossRef]
- Fu, S.; Hou, B.; Xia, Y.; Chen, M.; Wang, S.; Tan, P. The study of hydraulic fracture height growth in coal measure shale strata with complex geologic characteristics. J. Pet. Sci. Eng. 2022, 211, 110164. [Google Scholar] [CrossRef]
- Hou, B.; Wu, A.; Chang, Z. Experimental study on vertical propagation of fractures of multi-sweet of spots shale oil reservoir. Chin. J. Geotech. Eng. 2021, 43, 1322–1330. [Google Scholar]
- Hou, B.; Chen, M.; Cheng, W.; Diao, C. Investigation of Hydraulic Fracture Networks in Shale Gas Reservoirs with Random Fractures. Arab. J. Sci. Eng. 2016, 41, 2681–2691. [Google Scholar] [CrossRef]
- Hou, B.; Chen, M.; Li, Z.; Wang, Y.; Diao, C. Propagation area evaluation of hydraulic fracture networks in shale gas reservoirs. Pet. Explor. Dev. 2014, 41, 763–768. [Google Scholar] [CrossRef]
- Hou, B.; Dai, Y.; Zhou, C.; Zhang, K.; Liu, F. Mechanism study on steering acid fracture initiation and propagation under different engineering geological conditions. Geomech. Geophys. Geo-Energy Geo-Resour. 2021, 7, 73. [Google Scholar] [CrossRef]
- Li, P.; Dong, Y.; Wang, S.; Li, P. Numerical Modelling of Interaction between Hydraulic Fractures and Natural Fractures by Using the Extended Finite Element Method. Adv. Civ. Eng. 2020, 2020, 8848900. [Google Scholar] [CrossRef]
- Li, Z.Q.; Li, X.L.; Yu, J.B.; Cao, W.D.; Liu, Z.F.; Wang, M.; Wang, X.H. Influence of existing natural fractures and beddings on the formation of fracture network during hydraulic fracturing based on the extended finite element method. Geomech. Geophys. Geo-Energy Geo-Resour. 2020, 6, 58. [Google Scholar] [CrossRef]
- Luo, Z.; Zhang, N.; Zhao, L.; Liu, F.; Li, N. General criterion for intersection between hydraulic induced fractures and pre-existing natural fractures. Petroleum 2019, 5, 315–320. [Google Scholar] [CrossRef]
- Tang, Y.; Ma, T.; Chen, P.; Ranjith, P.G. An analytical model for heat extraction through multi-link fractures of the enhanced geothermal system. Geomech. Geophys. Geo-Energy Geo-Resour. 2020, 6, 1. [Google Scholar] [CrossRef]
- Vasilyeva, M.; Babaei, M.; Chung, E.T.; Spiridonov, D. Multiscale modeling of heat and mass transfer in fractured media for enhanced geothermal systems applications. Appl. Math. Model. 2019, 67, 159–178. [Google Scholar] [CrossRef] [Green Version]
- Wang, S.; Li, H.; Li, D. Numerical Simulation of Hydraulic Fracture Propagation in Coal Seams with Discontinuous Natural Fracture Networks. Processes 2018, 6, 113. [Google Scholar] [CrossRef] [Green Version]
- Wang, X.; Shi, F.; Liu, C.; Lu, D.; Liu, H.; Wu, H. Extended finite element simulation of fracture network propagation in formation containing frictional and cemented natural fractures. J. Nat. Gas Sci. Eng. 2018, 50, 309–324. [Google Scholar] [CrossRef]
- Yao, Y.; Wang, W.; Keer, L.M. An energy based analytical method to predict the influence of natural fractures on hydraulic fracture propagation. Eng. Fract. Mech. 2018, 189, 232–245. [Google Scholar] [CrossRef]
- Zhang, F.; Wu, J.; Huang, H.; Wang, X.; Luo, H.; Yue, W.; Hou, B. Technological parameter optimization for improving the complexity of hydraulic fractures in deep shale reservoirs. Nat. Gas Ind. 2021, 41, 125–135. [Google Scholar]
- Zhang, F.; Damjanac, B.; Maxwell, S. Investigating Hydraulic Fracturing Complexity in Naturally Fractured Rock Masses Using Fully Coupled Multiscale Numerical Modeling. Rock Mech. Rock Eng. 2019, 52, 5137–5160. [Google Scholar] [CrossRef]
- Zhang, F.; Dontsov, E.; Mack, M. Fully coupled simulation of a hydraulic fracture interacting with natural fractures with a hybrid discrete-continuum method. Int. J. Numer. Anal. Methods Geomech. 2017, 41, 1430–1452. [Google Scholar] [CrossRef]
- Zhang, F.; Zhu, H.; Zhou, H.; Guo, J.; Huang, B. Discrete-Element-Method/Computational-Fluid-Dynamics Coupling Simulation of Proppant Embedment and Fracture Conductivity After Hydraulic Fracturing. SPE J. 2017, 22, 632–644. [Google Scholar] [CrossRef]
- Zhang, W.; Qu, Z.; Guo, T.; Wang, Z. Study of the enhanced geothermal system (EGS) heat mining from variably fractured hot dry rock under thermal stress. Renew. Energy 2019, 143, 855–871. [Google Scholar] [CrossRef]
- Zhang, Z. Numerical simulation on the formation of complex fracture network in fractured reservoirs. Pet. Geol. Recovery Effic. 2018, 25, 109–114. [Google Scholar]
- Hou, B.; Cui, Z.; Ding, J.; Zhang, F.; Zhuang, L.; Elsworth, D. Perforation optimization of layer-penetration fracturing for commingling gas production in coal measure strata. Pet. Sci. 2022. [Google Scholar] [CrossRef]


| Main Parameter | Value |
|---|---|
| Young’s modulus (GPa) | 40 |
| Poisson’s ratio | 0.16 |
| Density (kg/cm3) | 2300 |
| Horizontal maximum in situ stress (MPa) | 66 |
| Horizontal minimum in situ stress (MPa) | 61 |
| Vertical in situ stress (MPa) | 78 |
| Pore pressure (MPa) | 30 |
| Permeability (mD) | 1 |
| Porosity | 0.01 |
| Hydraulic fracture tensile strength (MPa) | 6 |
| Nature fracture tensile strength (MPa) | 0 |
| Hydraulic fracture shear strength (MPa) | 6 |
| Nature fracture shear strength (MPa) | 0 |
| Leakoff coefficient (×10−11 ) | 5 |
Publisher’s Note: MDPI stays neutral with regard to jurisdictional claims in published maps and institutional affiliations. |
© 2022 by the authors. Licensee MDPI, Basel, Switzerland. This article is an open access article distributed under the terms and conditions of the Creative Commons Attribution (CC BY) license (https://creativecommons.org/licenses/by/4.0/).
Share and Cite
Zhao, K.; Li, R.; Lei, H.; Gao, W.; Zhang, Z.; Wang, X.; Qu, L. Numerical Simulation of Influencing Factors of Hydraulic Fracture Network Development in Reservoirs with Pre-Existing Fractures. Processes 2022, 10, 773. https://doi.org/10.3390/pr10040773
Zhao K, Li R, Lei H, Gao W, Zhang Z, Wang X, Qu L. Numerical Simulation of Influencing Factors of Hydraulic Fracture Network Development in Reservoirs with Pre-Existing Fractures. Processes. 2022; 10(4):773. https://doi.org/10.3390/pr10040773
Chicago/Turabian StyleZhao, Kai, Runsen Li, Haoran Lei, Wei Gao, Zhenwei Zhang, Xiaoyun Wang, and Le Qu. 2022. "Numerical Simulation of Influencing Factors of Hydraulic Fracture Network Development in Reservoirs with Pre-Existing Fractures" Processes 10, no. 4: 773. https://doi.org/10.3390/pr10040773
APA StyleZhao, K., Li, R., Lei, H., Gao, W., Zhang, Z., Wang, X., & Qu, L. (2022). Numerical Simulation of Influencing Factors of Hydraulic Fracture Network Development in Reservoirs with Pre-Existing Fractures. Processes, 10(4), 773. https://doi.org/10.3390/pr10040773