
Evaluating the Energy Efficiency and Environmental Impact of COVID-19 Vaccines Coolers through New Optimization Indexes: Comparison between Refrigeration Systems Using HFC or Natural Refrigerants


Abstract
:1. Introduction
- Practices that exaggerate the protection of vaccines against heat by exposing them to freezing—this problem represented 31% of the failures found;
- Non-specific refrigerators for storing vaccines with temperatures lower than 0 °C—accounted for 21.9%;
- Lack of rigorous temperature monitoring;
- Freezing during transport, which occurred with 75% of vaccines;
- Understanding this weakness in the cold chain, in 2013, the Ministry of Health (MS), through the National Health Foundation (FUNASA), published a version of the Cold Chain Manual [5]. In addition to this, manuals from Australia, England, New Zealand, and the CDC are also used to strengthen good practices in immunizations with different modes of refrigerated storage between different brands.
- With ultra-low temperature equipment, which can be purchased on the market, and which will increase the useful life of vaccines by up to 6 months;
- Pfizer thermal transport equipment, which will arrive with vaccine doses. Can be used as a temporary storage unit, refilling with dry ice every 5 days for up to 30 days;
- Refrigeration units in hospitals. In such a unit, vaccines will be stored at a temperature of 2 °C to 8 °C for 5 days, totaling up to 35 days. Once the vaccines have been thawed and stored at these temperatures, they cannot be refrozen. There are several options for vaccination centers, storing Pfizer vaccine in areas with different infrastructure.
- A refrigerator at 2 °C to 8 °C can be used to store vaccine vials for a maximum of 30 days;
- Thawed vaccine cannot be refrozen;
- To track how long the vaccine has been in the refrigerator, a label with the date and other information is used;
- Complete the information on the storage label and attach it to the box that holds the vaccine vials;
- Once labeled, store the vaccine refrigerated;
- For 1 h, store it at room temperature of 15 °C to 25 °C;
- Unused vials can be kept for 12 h at a temperature of 8 °C to 25 °C;
- During transport, the vaccine is frozen from −25 °C to −15 °C and must be kept in storage at this temperature [11].
- Protect from light;
- A common refrigerator can be used, working between 2 °C to 8 °C;
- Must not be frozen;
- After using the first dose, the vial with the remaining vaccines must be used quickly, within 6 h. When handling it, it should always be stored at a temperature of 2 °C to 25 °C.
- What refrigerants are commonly used for these temperatures?
- How can the environmental impact of these devices (cold rooms) be measured?
- What are the attitudes to be taken to reduce environmental impacts, as vaccinations will be constant and more frequent?
2. Materials and Methods
- The use of refrigerants with null ozone depletion potential (ODP) is encouraged by the Montreal protocol, disregarding the elimination of refrigerants such as R-12 and R-502 [26].
- It is not usual to find vaccine refrigerators using natural refrigerants. As an example, an ammonia system is not used in small systems because of its complexity and dangerous toxicity [27].
2.1. Vaccine Energy Usage Effectiveness Design (Vaccine EUED) Index
2.2. Vaccine TEWI—Total Equivalent Warming Impact
- Direct Emission—Refrigerant released in the lifetime of the equipment, including losses not recovered at the destination.
- Indirect Emission—CO2 emissions of fossil fuel systems to generate the electric energy used throughout its useful life.
3. Discussion and Analysis of Results
3.1. Vaccine EUED World Yearly
3.2. Vaccine TEWI World Yearly
4. Conclusions
Author Contributions
Funding
Institutional Review Board Statement
Informed Consent Statement
Data Availability Statement
Acknowledgments
Conflicts of Interest
References
- NCIRD. Divisões de Doenças Virais. Centro Nacional Para Doenças Respiratórias e Imunizações (NCIRD). 2021. Available online: https://www.cdc.gov/coronavirus/2019-ncov/vaccines/different-vaccines.html (accessed on 14 December 2021).
- PFIZER. Vacina ma Mensageiro. 2021. Available online: https://www.pfizer.com.br/noticias/ultimas-noticias%20/vacina-de-rna-mensageiro (accessed on 14 December 2021).
- SBIm. Vacinas de Vetores Virais–Vacinas não Replicantes. Sociedade Brasileira de Imunizações (SBIm). 2021. Available online: https://familia.sbim.org.br/COVID19/Comofunciona (accessed on 23 December 2021).
- SBIm. Conservação de Vacinas. Sociedade Brasileira de Imunizações (SBIm). 2021. Available online: https://familia.sbim.org.br/seguranca/conservacao. (accessed on 23 December 2021).
- Ministério da Saúde-MS. Manual de Rede de Frio do Programa Nacional de Imunizações. FUNASA. Secretaria de Vigilância em Saúde; Departamento de Vigilância das Doenças Transmissíveis, Coordenação-Geral do Programa Nacional, de Imunizações (CGPNI): Brasília, Brazil, 2013. [Google Scholar]
- Ledford, H. Moderna COVID Vaccine Becomes Second to Get US Authorization. Nature 2020. [Google Scholar] [CrossRef] [PubMed]
- Kaoru, T.; Fernandes, D. Anvisa Approves Emergency Use of Oxford and CoronaVac Vaccine; CNN: São Paulo, Brazil; Available online: https://www.cnnbrasil.com.br/saude/2021/01/17/votos-anvisa-vacina-coronavac-oxford (accessed on 26 December 2021).
- Gamba, L. Argentina 1st Latin American Nation to OK Sputnik Vaccine. Plan Expected to Bring 300,000 Doses of Vaccine to the Country Thursday. AA News. Anadolu Agency: Ankara, Turkey, 2020; Available online: https://www.aa.com.tr/en/americas/argentina-1st-latin-american-nation-to-ok-sputnik-vaccine/2086848 (accessed on 24 December 2021).
- Lu Agency. Available online: https://www.aa.com.tr/en/americas/argentina-1st-latin-american-nation-to-ok-sputnik-vaccine/2086848 (accessed on 26 December 2021).
- Pfizer. Covid-19 Vaccine U.S. Distribution Fact Sheet. Available online: https://www.pfizer.com/news/hot-topics/covid_19_vaccine_u_s_distribution_fact_sheet (accessed on 26 December 2021).
- CDC. Moderna COVID-19 Vaccine. Storage and Handling Summary. Available online: https://www.cdc.gov/vaccines/covid-19/info-by-product/moderna/downloads/storage-summary.pdf (accessed on 26 December 2021).
- CDC. Informação Vacina Moderna COVID-19. Available online: https://www.cdc.gov/vaccines/covid-19/info-by-product/moderna/index.html (accessed on 26 December 2021).
- Jones, I.; Roy, P.; Sputnik, V. COVID-19 Vaccine Candidate Appears Safe and Effective. Lancet 2021, 397, 642–643. [Google Scholar] [CrossRef]
- CDC. Storage and Handling Summary. 2021. Available online: https://www.cdc.gov/vaccines/covid-19/info-by-product/janssen/downloads/janssen-storage-handling-summary.pdf (accessed on 26 December 2021).
- Kim, M.; Liu, R. Sinovac’s COVID-19 Vaccine Induces Quick Immune Response Study; REUTERS: Toronto, ON, Canada, 2020. [Google Scholar]
- Medicines & Healthcare products Regulatory Agency. Decision: Information for UK Recipients on COVID 19 Vaccine AstraZeneca; Medicines & Healthcare Products Regulatory Agency: London, UK, 2021. [Google Scholar]
- IEC 60335-2-89; Household and Similar Electrical Appliances-Safety-Part 2-89: Particular Requirements for Commercial Refrigerating Appliances and Ice-Makers with an Incorporated or Remote Refrigerant Unit or Motor-Compressor. International Electrotechnical Commission (IEC): Geneva, Switzerland, 2019.
- CDC. Pfizer-BioNTech COVID-19 Vaccine. Available online: https://www.cdc.gov/vaccines/covid-19/info-by-product/pfizer/index.html (accessed on 27 December 2021).
- COOLPACK. Software COOLPACK Version 1.49; IPU & Department of Mechanical Engineering Technical University of Denmark: Lynby, Denmark, 2011. [Google Scholar]
- ASHRAE 90.1; Standard 90.1-2019 (I-P Edition)-Energy Standard for Buildings Except Low-Rise Residential Buildings (ANSI Approved; IES Cosponsored). ASHRAE: Atlanta, GA, USA, 2019.
- AHRI 1201-2013. Performance Rating of Commercial Refrigerated Display Merchandisers and Storage Cabinets (SI); AHRI: Arlington, TX, USA, 2013. [Google Scholar]
- AHRI 210/240-2017. Performance Rating of Unitary Air-Conditioning & Air-Source Heat Pump Equipment; AHRI: Arlington, TX, USA, 2017. [Google Scholar]
- Standard 72–2018; Standard 72-2018-Method of Testing Open and Closed Commercial Refrigerators and Freezers (ANSI Approved). ANSI: Arlington, TX, USA, 2018.
- Gong, M.; Sun, Z.; Wu, J.; Zhang, Y.; Meng, C.; Zhou, Y. Performance of R170 Mixtures as Refrigerants for Refrigeration at −80 °C Temperature Range. Int. J. Refrigeration. 2009, 32, 892–900. [Google Scholar] [CrossRef]
- ASHRAE. Practical Guidance for Vaccine Refrigerated Transportation and Storage. Available online: https://www.ashrae.org/file%20library/technical%20resources/covid-19/practical-guidance-for-vaccine-refrigerated-transportation-and-storage-abstract.pdf (accessed on 4 January 2022).
- UNenviroment. The Kigali Amendment to the Montreal Protocol: HFC Phase-Down. Available online: https://www.unenvironment.org/ozonaction/resources/factsheet/kigali-amendment-montreal-protocol-hfc-phase-down.layer (accessed on 29 December 2021).
- EPA. International Actions-The Montreal Protocol on Substances that Deplete the Ozone Layer. United States Environmental Protection Agency–EPA. Available online: https://www.epa.gov/ozone-layer-protection/international-actions-montreal-protocol-substances-deplete-ozone-layer (accessed on 29 December 2021).
- IPCC. Fourth Assessment Report 2021. Available online: https://www.ipcc.ch/assessment-report/ar4/ (accessed on 29 December 2021).
- WHO. Guideline for Establishing or Improving Primary and Intermediate Vaccine Stores Vaccines and Biologicals; World Health Organization, Department of Vaccines and Biologicals, CH-1211: Geneva, Switzerland, 2002. [Google Scholar]
- Fioria, J.J.; Limab, C.U.S.; Junior, V.S. Theoretic-experimental evaluation of a cascade refrigeration system for low temperature applications using the pair r22/r404a. Brasil. Rev. Da Eng. Térmica. 2012, 11, 7–14. [Google Scholar]
- Santos, A.F.; Gaspar, P.D.; Souza, H.J.L. Refrigeration of COVID 19 vaccines: Ideal storage characteristics, Energy efficiency and Environmental impacts of various vaccine options. Energies 2021, 14, 1849. [Google Scholar] [CrossRef]
- Refrigerationclub. Know CO2. Available online: https://refrigerationclub.com/know-CO2-propane/ (accessed on 10 January 2021).
- OPTEON. Chemours Refrigerant Expert 1.0 Software. Available online: https://www.opteon.com/en/support/helpful-resources/refrigerant-expert-tool (accessed on 29 December 2021).
- Santos, A.F.; Souza, H.J.L.; Cantão, M.P.; Gaspar, P.D. Analysis of temperatures for geothermal heat pumps application in Paraná (Brazil). In Proceedings of the International Conference on Engineering–Engineering for Society (ICEUBI2015), University of Beira Interior, Covilhã, Portugal, 3–4 December 2015. [Google Scholar]
- Santos, A.F.; Souza, H.J.L.; Cantão, M.P.; Gaspar, P.D. Analysis of temperatures for geothermal heat pumps application in Paraná (Brazil). Open Eng. 2016, 6, 485–491. [Google Scholar] [CrossRef]
- Santos, A.F.; de Souza, H.J.L.; Gaspar, P.D. Avaliação do desempenho térmico e energético de um datacenter por um novo índice de eficiência: Energy Usage Effectiveness Design–EUED. In Proceedings of the 11º Congresso Brasileiro de Ar Condicionado, Refrigeração, Aquecimento e Ventilação, Porto Alegre, Brazil, 25–27 September 2018. [Google Scholar]
- Santos, A.F.; Gaspar, P.D.; Souza, H.J.L. Avaliação do desempenho térmico e energético de um datacenter por um novo índice de eficiência: Energy Usage Effectiveness Design–EUED. In Proceedings of the Congresso Brasileiro de Refrigeração, Ar-Condicionado, Ventilação, Aquecimento e Tratamento de Ar (XVI CONBRAVA), São Paulo, Brazil, 10–13 September 2019. [Google Scholar]
- Santos, A.F.; de Souza, H.J.L.; Gaspar, P.D. Evaluation of the heat and energy performance of a datacenter by a new efficiency index: Energy Usage Effectiveness Design-EUED. In Proceedings of the 25th IIR International Congress of Refrigeration (ICR 2019), Montreal, QC, Canada, 23–30 August 2019. [Google Scholar] [CrossRef]
- Santos, A.F.; de Souza, H.J.L.; Gaspar, P.D. Evaluation of the heat and energy performance of a datacenter for a new efficiency index: Energy Usage Effectiveness Design-EUED. Braz. Arch. Biol. Technol. 2019, 62. [Google Scholar] [CrossRef]
- Santos, A.F.; Gaspar, P.D.; de Souza, H.J.L. New datacenter performance index: Perfect Design Datacenter-PDD. Climate 2020, 8, 110. [Google Scholar] [CrossRef]
- Santos, A.F.; Gaspar, P.D.; Souza, H.J.L. New index for sustainability-TWI (Total Water Impact). Energies 2020, 13, 1590. [Google Scholar] [CrossRef] [Green Version]
- Santos, A.F.; Gaspar, P.D.; de Souza, H.J.L. Ecoenergetic simulation of HVAC systems in Datacenters. Climate 2021, 9, 42. [Google Scholar] [CrossRef]
- AHRI Standard 1361 (SI); 2017 Standard for Performance Rating of Computer and Data Processing Room Air Conditioners. AHRI: Arlington, VA, USA, 2017.
- EPE Balanço Energético Nacional 2019. Relatório Síntese / Ano Base 2018; Ministério de Minas e Energia–MME/Empresa de Pesquisa Energética–EPE. Available online: https://www.epe.gov.br/sites-pt/publicacoes-dados-abertos/publicacoes/PublicacoesArquivos/publicacao-377/topico-470/Relat%C3%B3rio%20S%C3%ADntese%20BEN%202019%20Ano%20Base%202018.pdf (accessed on 3 January 2022).
- EPE. Anuário Estatístico ee Energia Elétrica 2020. Ano Base 2019. Available online: https://www.epe.gov.br/sites-pt/publicacoes-dados-abertos/publicacoes/PublicacoesArquivos/publicacao-160/topico-168/EPEFactSheetAnuario.pdf (accessed on 3 January 2022).
- CNBC. J&J CEO Says People May Need Annual Covid Vaccine Shots for the Next Several Years. Available online: https://www.cnbc.com/2021/02/09/covid-vaccine-jj-ceo-says-people-may-get-annual-shots-for-the-next-several-years.html (accessed on 3 January 2022).
- ECCAPLAN. Calculadora para Emissão de Carbono. Available online: https://calculadora.eccaplan.com.br (accessed on 3 January 2022).
- United Nation. Available online: https://news.un.org/en/story/2021/12/1107632 (accessed on 3 January 2022).


| Vaccines | Storage Temperature (°C) |
|---|---|
| Pfizer–BioNTech | −70 |
| Moderna | −25 |
| Sputnik V | −18 |
| CoronaVac | 2 |
| AstraZeneca–Oxford–Covishield | 2 |
| Janssen COVID-19 | 2 |
| Parameter | Symbol | Unit | Value |
|---|---|---|---|
| Height | H | m | 2.05 |
| Length | L | m | 1.60 |
| Width | W | m | 0.79 |
| Gross volume | Vg | m3 | 2.59 |
| Useful volume | Vu | m3 | 1.05 |
| Estimated dose capacity | n | 100,000 | |
| Dose volume | Vd | m3 | 3.0 × 10⁻⁷ |
| Vaccines | Inlet Vaccine Temperature [°C] | Cold Room Temperature [°C] | Cooling Load [kW] |
|---|---|---|---|
| Pfizer–BioNTech | −60 | −70 | 2.23 |
| Moderna | −15 | −25 | 1.38 |
| Sputnik V | −12 | −18 | 1.28 |
| CoronaVac | 8 | 2 | 1.02 |
| AstraZeneca–Oxford–Covishield | 8 | 2 | 1.02 |
| Janssen COVID-19 | 8 | 2 | 1.02 |
| Vaccines | Inlet Condenser Temperature [°C] | RFCT [°C] | Cold Room Temperature [°C] | RFET [°C] | EFISEN | SHG/SCG |
|---|---|---|---|---|---|---|
| * Pfizer–BioNTech | 24 | 34 | −70 | −80 | 0.7 | 10/3 |
| Moderna | 24 | 34 | −25 | −35 | 0.7 | 10/3 |
| Sputnik V | 24 | 34 | −18 | −28 | 0.7 | 10/3 |
| CoronaVac | 24 | 34 | 2 | −8 | 0.7 | 10/3 |
| AstraZeneca–Oxford–Covishield | 24 | 34 | 2 | −8 | 0.7 | 10/3 |
| Janssen COVID-19 | 24 | 34 | 2 | −8 | 0.7 | 10/3 |
| Temperature Class | Typical Range (°C) | Vaccines | Common Storage Systems | Common Transport Systems |
|---|---|---|---|---|
| Medium Temperature Refrigeration | 2 to 8 † |
|
|
|
| Low Temperature Refrigeration | −50 to −15 |
|
|
|
| Ultra-Low Temperature Refrigeration | −80 to −60 |
|
|
|
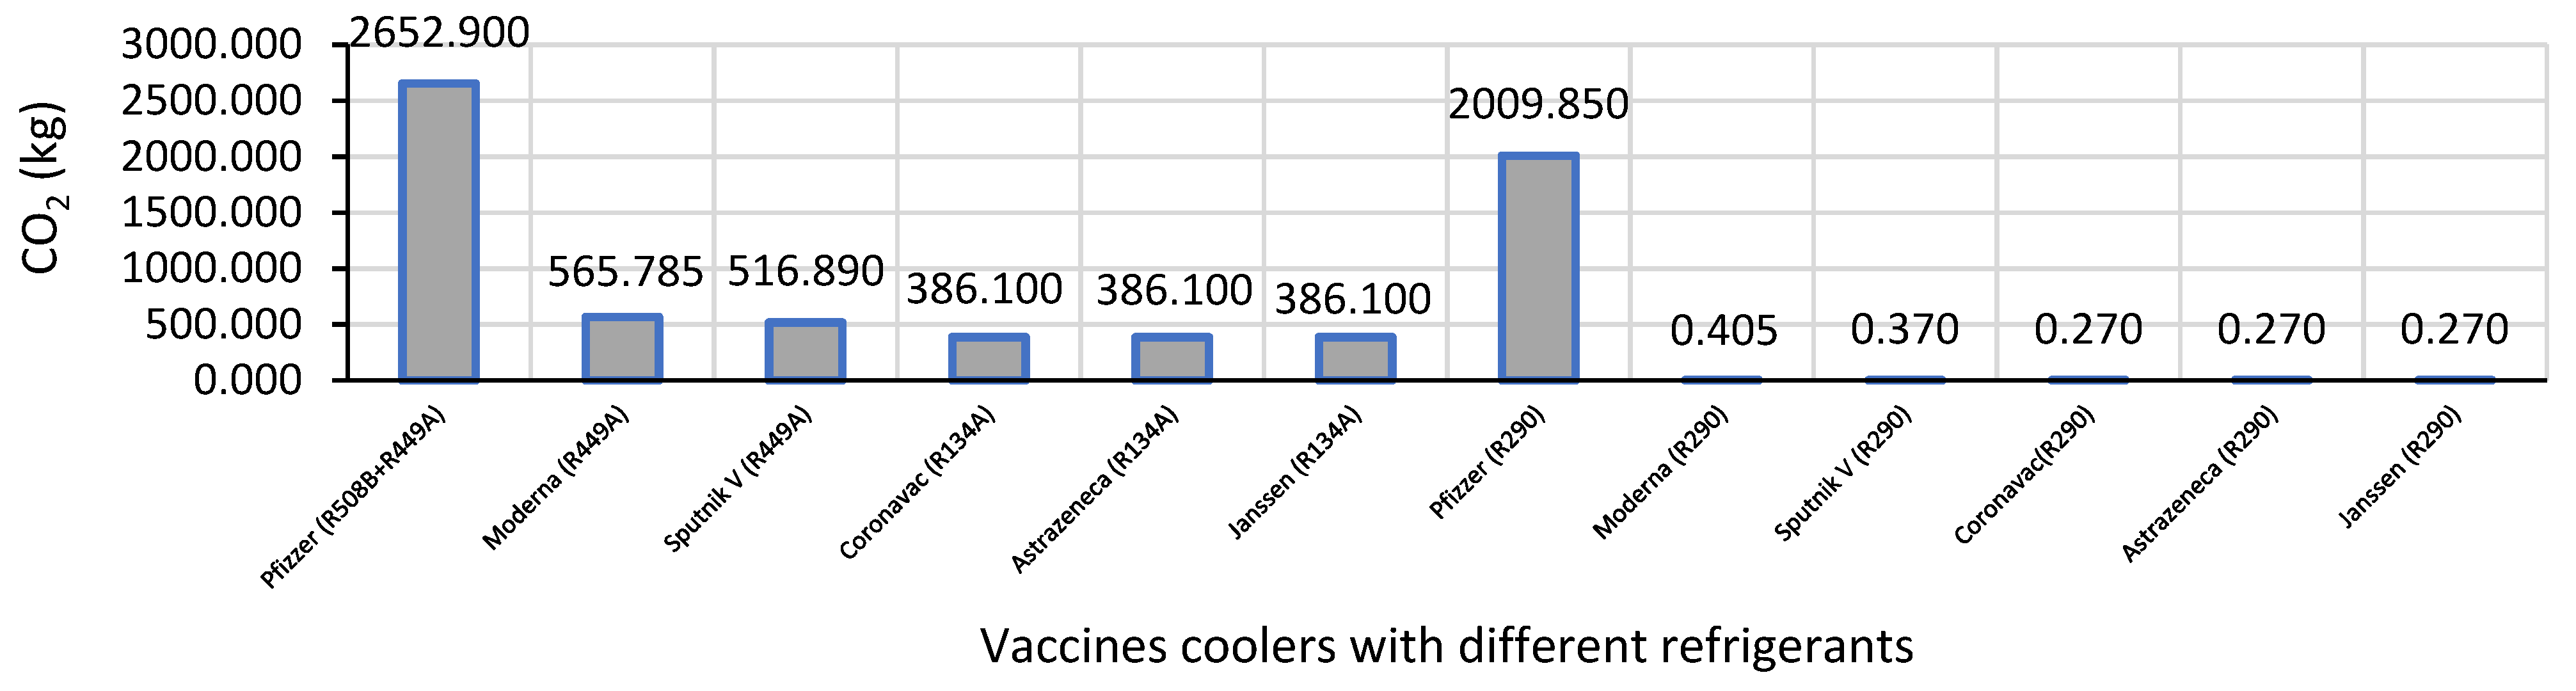
| Vaccines | Refrigerant(s) | GWP | Load Refrigerant Gas (kg) | CO2 kg |
|---|---|---|---|---|
| Pfizer | R-508B & R-449A | 13,396 & 1430 | 0.15 + 0.45 | 2652.9 |
| Moderna | R-449A | 1397 | 0.405 | 565.785 |
| Sputnik V | R-449A | 1397 | 0.37 | 516.89 |
| CoronaVac | R-134A | 1430 | 0.27 | 386.1 |
| AstraZeneca | R-134A | 1430 | 0.27 | 386,1 |
| Janssen | R-134A | 1430 | 0.27 | 386.1 |
| Pfizer | R-508B & R-290 | 13,396 & 3 | 0.15 + 0.15 | 2010.21 |
| Moderna | R-290 | 3 | 0.243 | 0.729 |
| Sputnik V | R-290 | 3 | 0.243 | 0.729 |
| CoronaVac | R-290 | 3 | 0.162 | 0.486 |
| AstraZeneca | R-290 | 3 | 0.162 | 0.486 |
| Janssen | R-290 | 3 | 0.162 | 0.486 |
| Vaccines | CO2 kg | EUED (kWh/yr) | TEWIe Direct | TEWI Indirect Brasil | TEWI Indirect USA | TEWI Total Brazil | TEWI Total USA |
|---|---|---|---|---|---|---|---|
| Pfizer | 2652.90 | 18,904.65 | 4112.00 | 16,636.09 | 78,832.39 | 20,748.09 | 82,944.39 |
| Moderna | 565.79 | 4968.00 | 876.97 | 4371.84 | 20,716.56 | 5248.81 | 21,593.53 |
| Sputnik V | 516.89 | 4004.57 | 876.97 | 3524.02 | 16,699.06 | 4400.99 | 17,576.02 |
| Coronavac | 386.10 | 2023.06 | 598.46 | 1780.29 | 8436.16 | 2378.75 | 9034.62 |
| AstraZeneca | 386.10 | 2023.06 | 598.46 | 1780.29 | 8436.16 | 2378.75 | 9034.62 |
| Janssen | 386.10 | 2023.06 | 598.46 | 1780.29 | 8436.16 | 2378.75 | 9034.62 |
| Pfizzer (R-290) | 2010.21 | 18,904.65 | 2780.36 | 16,636.09 | 78,832.39 | 19,416.45 | 81,612.75 |
| Moderna (R-290) | 0.73 | 4968.00 | 1.13 | 4371.84 | 20,716.56 | 4372.97 | 20,717.69 |
| Sputnik V (R-290) | 0.67 | 4004.57 | 1.13 | 3524.02 | 16,699.06 | 3525.15 | 16,700.19 |
| Coronavac (R-290) | 0.49 | 2023.06 | 0.75 | 1780.29 | 8436.16 | 1781.05 | 8436.91 |
| AstraZeneca (R-290) | 0.49 | 2023.06 | 0.75 | 1780.29 | 8436.16 | 1781.5 | 8436.91 |
| Janssen (R-290) | 0.49 | 2023.06 | 0.75 | 1780.29 | 8436.16 | 1781.05 | 8346.91 |
| Vaccines | Vaccine EUED [MWh/yrs] |
|---|---|
| Pfizer–BioNTech | 1,323,325.5 |
| Moderna | 347,760.0 |
| Sputnik V | 280,319.9 |
| CoronaVac | 141,614.2 |
| AstraZeneca–Oxford–Covishield | 141,614.2 |
| Janssen COVID-19 | 141,614.2 |
| Vaccines | TEWI Total Brazil [ton CO2 10 yrs] | TEWI Total USA [ton CO2 10 yrs] |
|---|---|---|
| Pfizer–BioNTech | 1,452,366,090 | 5,806,106,985 |
| Moderna | 367,416,472.5 | 1,511,546,873 |
| Sputnik V | 166,512,346 | 632,423,064 |
| CoronaVac | 166,512,346 | 632,423,064 |
| AstraZeneca–Oxford–Covishield | 302,764,077 | 1,225,016,548 |
| Janssen COVID-19 | 1,359,136,590 | 5,712,877,485 |
| Pfizer–BioNTech (R290) | 306,072,742.5 | 1,450,203,143 |
| Moderna (R290) | 124,649,791 | 590,560,509 |
| Sputnik V (R290) | 124,649,791 | 590,560,509 |
| CoronaVac (R290) | 1,246,721,657 | 1,168,974,128 |
| AstraZeneca–Oxford–Covishield (R290) | 1,452,366,090 | 5,806,106,985 |
Publisher’s Note: MDPI stays neutral with regard to jurisdictional claims in published maps and institutional affiliations. |
© 2022 by the authors. Licensee MDPI, Basel, Switzerland. This article is an open access article distributed under the terms and conditions of the Creative Commons Attribution (CC BY) license (https://creativecommons.org/licenses/by/4.0/).
Share and Cite
Santos, A.F.; Gaspar, P.D.; de Souza, H.J.L. Evaluating the Energy Efficiency and Environmental Impact of COVID-19 Vaccines Coolers through New Optimization Indexes: Comparison between Refrigeration Systems Using HFC or Natural Refrigerants. Processes 2022, 10, 790. https://doi.org/10.3390/pr10040790
Santos AF, Gaspar PD, de Souza HJL. Evaluating the Energy Efficiency and Environmental Impact of COVID-19 Vaccines Coolers through New Optimization Indexes: Comparison between Refrigeration Systems Using HFC or Natural Refrigerants. Processes. 2022; 10(4):790. https://doi.org/10.3390/pr10040790
Chicago/Turabian StyleSantos, Alexandre F., Pedro D. Gaspar, and Heraldo J. L. de Souza. 2022. "Evaluating the Energy Efficiency and Environmental Impact of COVID-19 Vaccines Coolers through New Optimization Indexes: Comparison between Refrigeration Systems Using HFC or Natural Refrigerants" Processes 10, no. 4: 790. https://doi.org/10.3390/pr10040790