Article

Effect of Liquid Properties on Frictional Pressure Drop in a Gas-Liquid Two-Phase Microchannel

Beijing Key Laboratory of Fuels Cleaning and Advanced Catalytic Emission Reduction Technology, College of Chemical Engineering, Beijing Institute of Petrochemical Technology, Beijing 102617, China
*
Author to whom correspondence should be addressed.
Processes 2022, 10(5), 799; https://doi.org/10.3390/pr10050799
Submission received: 1 March 2022 / Revised: 24 March 2022 / Accepted: 25 March 2022 / Published: 19 April 2022
(This article belongs to the Special Issue Advanced Processes Creating New Technologies in Tomorrow's Industry)

Abstract

:
The flow characteristics in a ring-shaped microchannel with an inner diameter of 1 mm were studied in two-phase flow systems with air-water, air-glycerol aqueous solution and air-ethanol aqueous solution using the differential pressure method. The effects of liquid properties (surface tension and viscosity) and gas/liquid superficial velocity on frictional pressure drop were discussed. The experimental results show that the frictional pressure gradient increases with the increase of superficial gas velocity, superficial liquid velocity and liquid viscosity, and increases with the decrease of liquid surface tension, which has a good agreement with the literature values. The friction pressure drop data are compared with the classical models and correlations in literature, and a reliable correlation is proposed for prediction of two-phase friction coefficient in microchannels.

1. Introduction

Because of their green, efficient, safe, and controllable advantages, gas-liquid microchannel reactors have attracted more attention in the fields of chemical and petrochemical industries, chemical synthesis, biochemical analysis, nanoparticles, environmental engineering and so on. The two-phase frictional pressure drop in microchannels is caused by the decrease of channel diameter, the main role of surface tension, and the increase in friction between gas or liquid and pipe wall [1]. Lalegani et al. [2] findings results show that the value of the frictional factor decreases nonlinearly as the Reynolds number increases. However, as the Reynolds number increases, the pressure decreases and the Poiseuille number in the microchannels increases. Kawahara [3] found that the coefficient of friction is consistent with that of the Hagen-Poiseuille flow. The pressure drop for two-phase flow of gas and non-Newtonian liquid in a horizontal circular microchannel (0.25 mm I.D.) was examined using the generalized Reynolds number. Ronshin et al. [4] investigated the hydraulic resistance of various working liquids. It is shown that during the transition to the churn flow regime, drastic jumps in the superficial gas velocity are observed for water. Moradikazerouni et al. [5] discussed an innovative technique for flow modeling inside a closed pressurized cryogenic tank. They show that the presented 0D/3D connection of the CFD and Nodal with proper temporal coupling at their interfaces can be employed to study the flow and thermal physics of storage tanks efficiently. Estebe [6] proposed a new computational fluid dynamics algorithm for simulating sloshing and evaporation in cryogenic fuel tanks. The numerical method represents the (complex) deforming liquid/vapor interface as an idealized sharp interface. The frictional pressure drop of the two-phase flow in the microchannel is significantly different from that in the conventional pipeline. Therefore, it is necessary to improve the accuracy of the calculation model of frictional pressure drop.
With the rapid development of microchannel reactors, many scholars, at home and abroad, have conducted in-depth and systematic research on the frictional pressure drop of two-phase flow in microchannels. Triplett et al. [7] found that the two-phase frictional coefficient in the microchannel is in good agreement with the coefficient calculated by the uniform flow model. It is considered that the momentum transfer and pipe wall friction at the gas-liquid interface of annular flow in microchannels may be significantly different from those in conventional pipelines. Fujioka et al. [8] used CFD to simulate the pressure drop of the liquid plug in the channel. When the length of the liquid plug is short, the Laplace force plays a leading role. Song [9] investigated the effect of liquid properties on the pressure drop of two-phase flow. With the increase in liquid viscosity, the total pressure drop of the system gradually increased but did not show the effect of surface tension on the pressure drop in the channel. Chisholm [10] proposed the relationship between the pressure drop when flowing in the microchannel and the pressure drop when flowing in the microchannel at the same time; Lee and Lee [11] studied the frictional pressure drop of air-water two-phase in a rectangular channel with small length-width ratio. Kawahara et al. [1] studied the characteristics of nitrogen water two-phase flow in a circular microchannel with an inner diameter of 100 mm. The frictional coefficient of single-phase flow is in good agreement with the prediction results of laminar flow correlation. Dukler et al. [12] found that the prediction value of the homogeneous flow model is in good agreement with the experimental value. However, there is still a certain gap between the calculated values of the above models and the experimental results, and scholars still need to comprehensively investigate the factors affecting the pressure drop. In this paper, a differential pressure sensor is used to record the pressure changes under different liquid properties and gas-liquid superficial velocities in the microchannel. We reconsider the effect of viscosity on frictional pressure drop, and propose a correlation to correct the inadequacies of previous ones.

2. Experimental

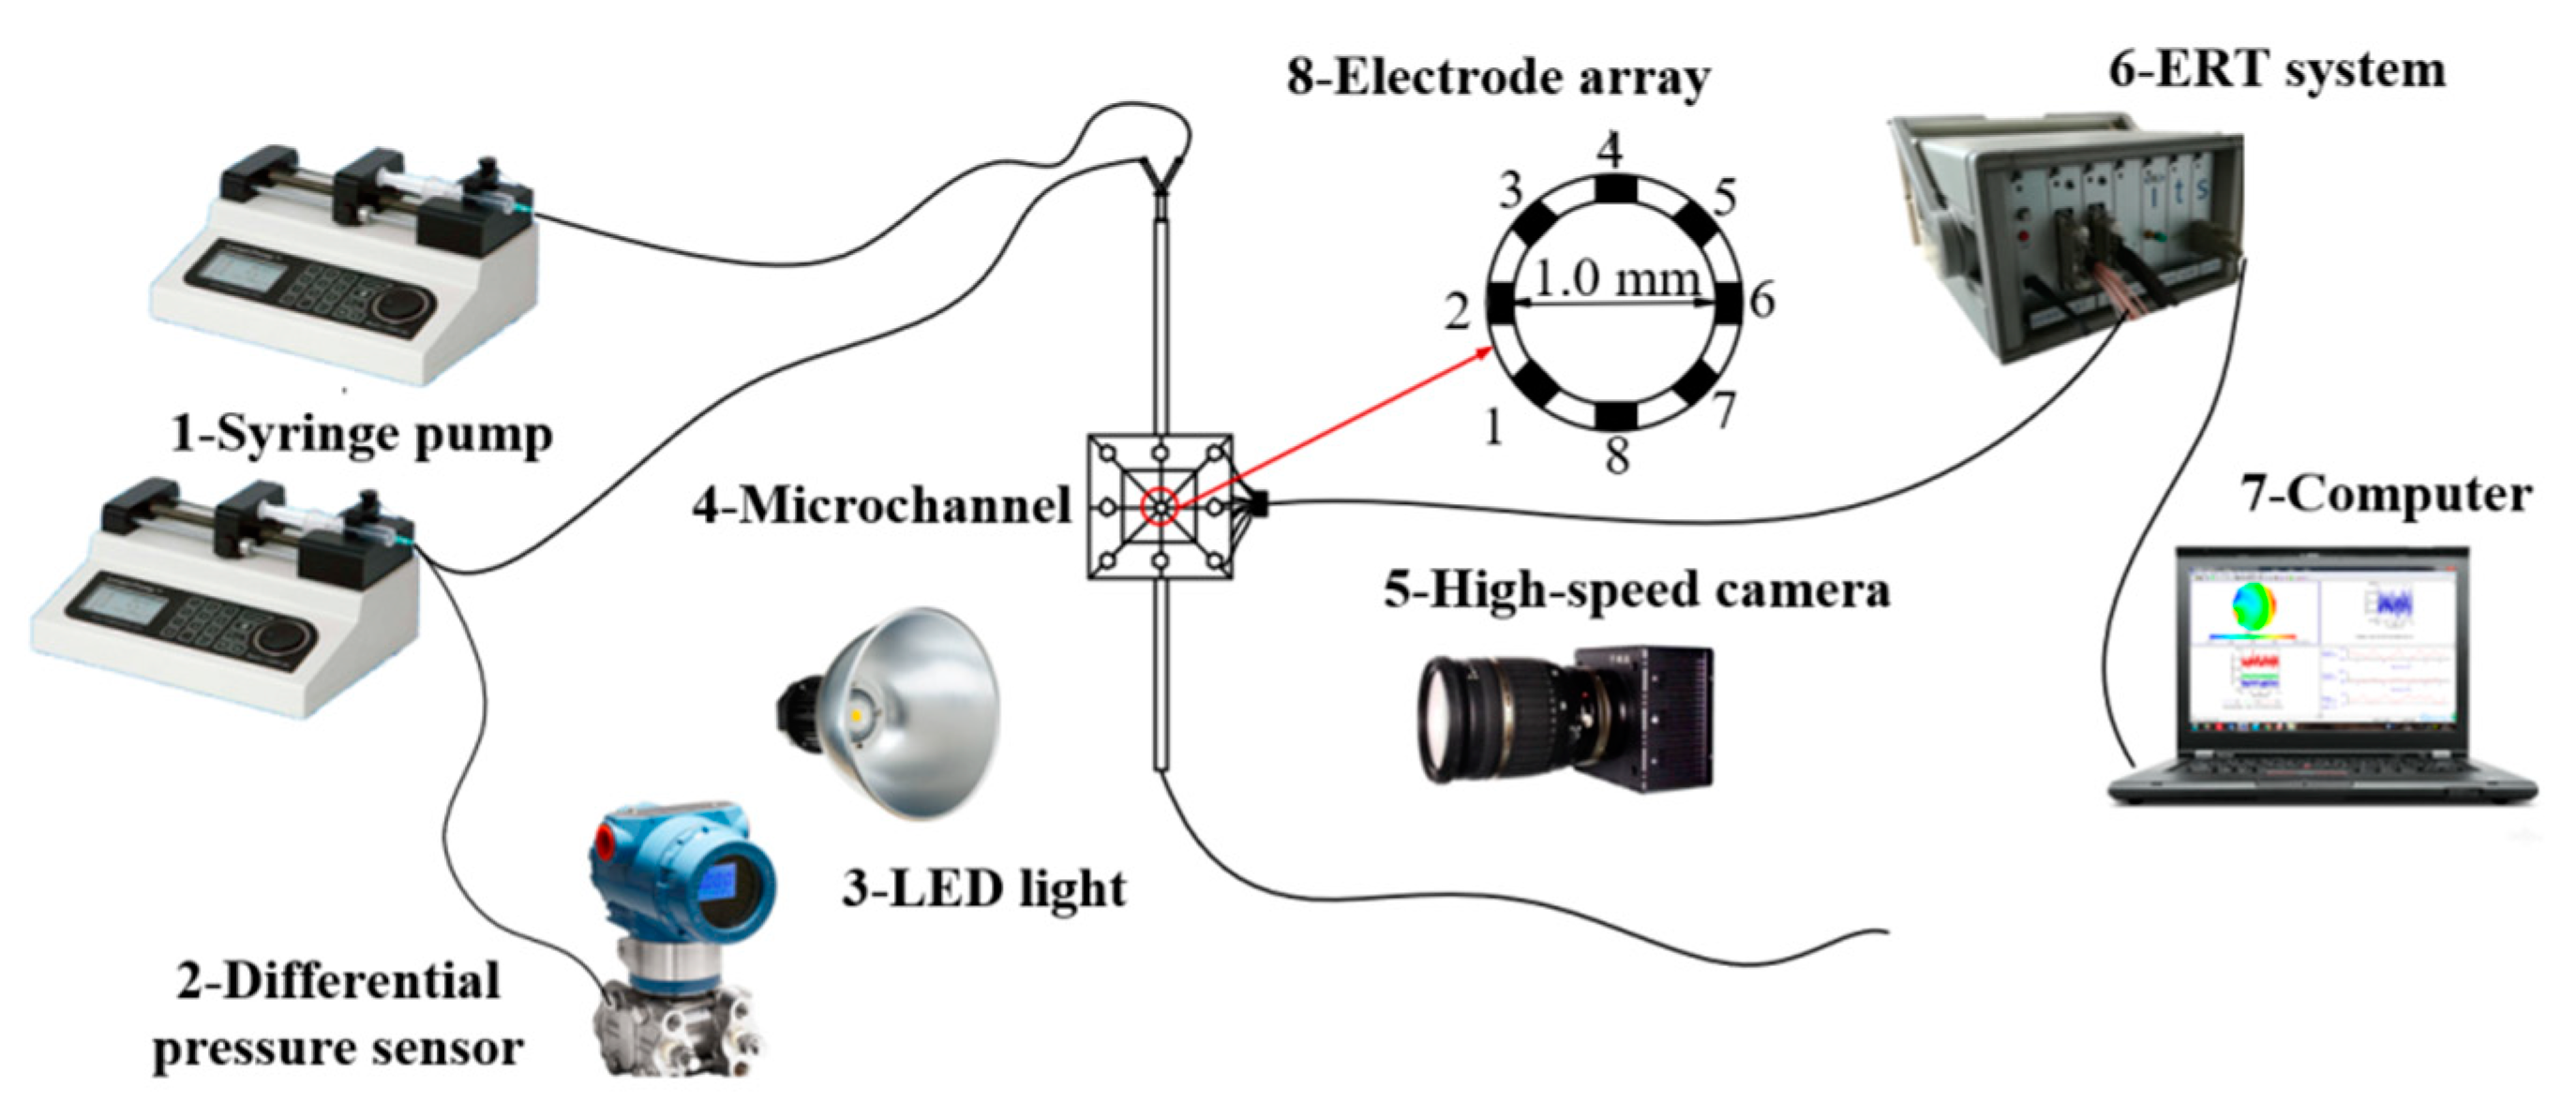
2.1. Experimental Equipment

The transparent circular microchannels used in this study were self-made in the laboratory. The microchannel adopts a Y-type mixing mode with an included angle of 60° and each interface is connected by a catheter. The material is polytetrafluoroethylene. The microchannel is bonded together by two upper and lower plexiglass tubes with a hydraulic diameter of 1 mm and a length of 15 cm. L/D ≈ 150, which is enough to eliminate the effect of the outlet section on the fluid flow. The upper and lower two pieces of plexiglass (1 × 1 × 1 cm) are the cover sheets, and the middle piece of plexiglass (4 × 4 × 0.3 cm) is the mainboard. In the experiment, the air was used as the dispersed phase, water, glycerin aqueous solution and ethanol aqueous solution were used as continuous phases. The experiments were carried out at room temperature (25 °C) and atmospheric pressure. We use Capacitive differential pressure sensor and ERT to monitor the pressure drop in microchannels. The experimental process is shown in Figure 1.
In this experiment, a capacitive differential pressure sensor (htj300) manufactured by the Institute of metrology, China Aerospace Science and Technology Group is used, and the range is 2 kPa. The margin of error is 0.5%. The pressure information measured by the differential pressure sensor is output as a current signal (4–20 mA), converted into a voltage signal (1–5 V) by 250 Ω resistance, and then converted into a digital signal through an A/D data acquisition card, and stored on the computer. The automatic and real-time acquisition of electrical output signal is realized. Before each experimental measurement, the two ends of the differential pressure sensor should be filled with complete experimental fluid, and the sampling frequency should be set at 1000 Hz. The ERT system is mainly composed of four parts: the sensor array (ERT Sensor), the data acquisition and processing unit (Data Acquisition System), the image reconstruction unit (Image Reconstruction System) and the computer. The system (09-P2000-04) conducted an online real-time analysis of the flow in the microchannel. The gas-liquid two-phase flow state in the microchannel was observed and recorded in real-time by a high-speed camera (2F04C) manufactured by Hefei Fuhuang Junda Hi-Tech Information Technology Company. The maximum pixel resolution of the high-speed camera is 2320 × 1720, the exposure time range is 1/1,000,000–1/50 s, and the acquisition frequency is up to 32,400 fps.

2.2. Physical Properties of Fluids

The physical properties of the fluid used in the experiment are shown in Table 1.

2.3. Frictional Pressure Drop

Pressure drop is the most important parameter in gas-liquid two-phase fluid dynamics, and it is also the basic element of pipeline design. The hydraulic diameter, flow pattern and liquid properties of microchannels all have certain effects on the pressure drop of gas-liquid two-phase flow in microchannels. The pressure drop in microchannels is thought to be made up of frictional pressure drop, gravity-induced pressure drop, and acceleration pressure drop (Equation (1)). However, gravity can be ignored due to the characteristics of gas-liquid two-phase flow in microchannels, and no heat exchange occurs during the flow, so the pressure drop and acceleration pressure drop caused by gravity are ignored, and only studied the frictional pressure drop. That is the total pressure drop measured by the experiment is equal to the frictional pressure drop.
Δ P M e a s u r e d = Δ P F r i c t i o n + Δ P G r a v i t a t i o n + Δ P A c c e l e r a t i o n ,
The frictional pressure drop of gas-liquid two-phase flow in microchannels is calculated by the homogeneous flow model and the separated phase flow model.

2.3.1. The Homogeneous Flow Model

The homogeneous flow model (HFM) is the simplest gas-liquid two-phase flow model, that can be used to evaluate the frictional pressure gradient of the system according to the correlation formula (Equations (2) and (3)) in the One-way flow state. The homogeneous flow model assumes that the two fluids have completely mixed and have the same flow velocity. Based on the average physical properties of a two-phase mixture, the frictional pressure drop of a two-phase flow can be calculated by using the formula used for one-way flow, as shown in Equations (2) and (3).
Δ P F r i c t i o n L = Δ P M e a s u r e d L = 2 f G 2 ρ D h
ρ = [ ( x ρ G ) + ( 1 x ρ L ) ] 1
where G is the mass flux, L is the length of the mixing section, D h is the hydraulic diameter of the microchannel, ρ is the density of the mixture, X is the mass fraction of the gas, ρ G is the gas density, ρ L is the liquid density, f is the frictional coefficient of two phases.
In the case of laminar flow, the relationship between the two-phase frictional coefficient and Reynolds number in a circular cross-section channel can be expressed by Equation (4)
f = 16 Re ,
At present, there are many correlations for the viscosity of two-phase mixtures, but the key to the application of the HFM model in microchannels is to select the correlations correctly. Therefore, this paper selects the typical correlations of six viscosities in the literature [12,13,14,15,16,17]. The results are shown in Figure 2. In this study, the bubbly flow accounts for a relatively large proportion of the data.

2.3.2. The Separated Flow Model

Lockhart and Martinelli proposed the separated flow model. The model suggests that liquid and gas flow in opposite directions in the microchannel and have different transient velocities. The formula for calculation is as follows (5):
( Δ p F L ) = ϕ L 2 ( Δ p F L ) L ,
where Δ P F / L is the pressure drop of the two-phase mixture, ( Δ P F / L ) L is the pressure drop of liquid single-phase flow, ϕ L 2 is the two-phase frictional coefficient, expressed as Equations (6) and (7):
ϕ L 2 = 1 + C X + 1 X 2 ,
X = ( U L U G ) 0.5 ( μ L μ G ) 0.5 ,
where μ L is liquid viscosity, μ G is gas viscosity, U L is apparent liquid velocity, U G is apparent gas velocity, and parameter C is related to microchannel structure and fluid flow.
In the separated flow model (SFM), most scholars use the correlation proposed by Lockhart and Martinelli to predict the frictional pressure drop in microchannels and modify the value of parameter C according to the experimental results. Tao et al. [18] studied the comparison between the experimental value of frictional coefficient and the literature value, and found that the average relative error between the experimental data and the predicted value of Zhang et al. is the smallest, which is 16.47%. In this study, five typical correlations, Lockhart and Martinelli [19], Zhang et al. [20], Lee and Lee [11], Mishima and Hibiki [21], Li and Wu [22] were used to evaluate the frictional pressure gradient in microchannels, as shown in Table 2.

3. Experimental Results and Discussion

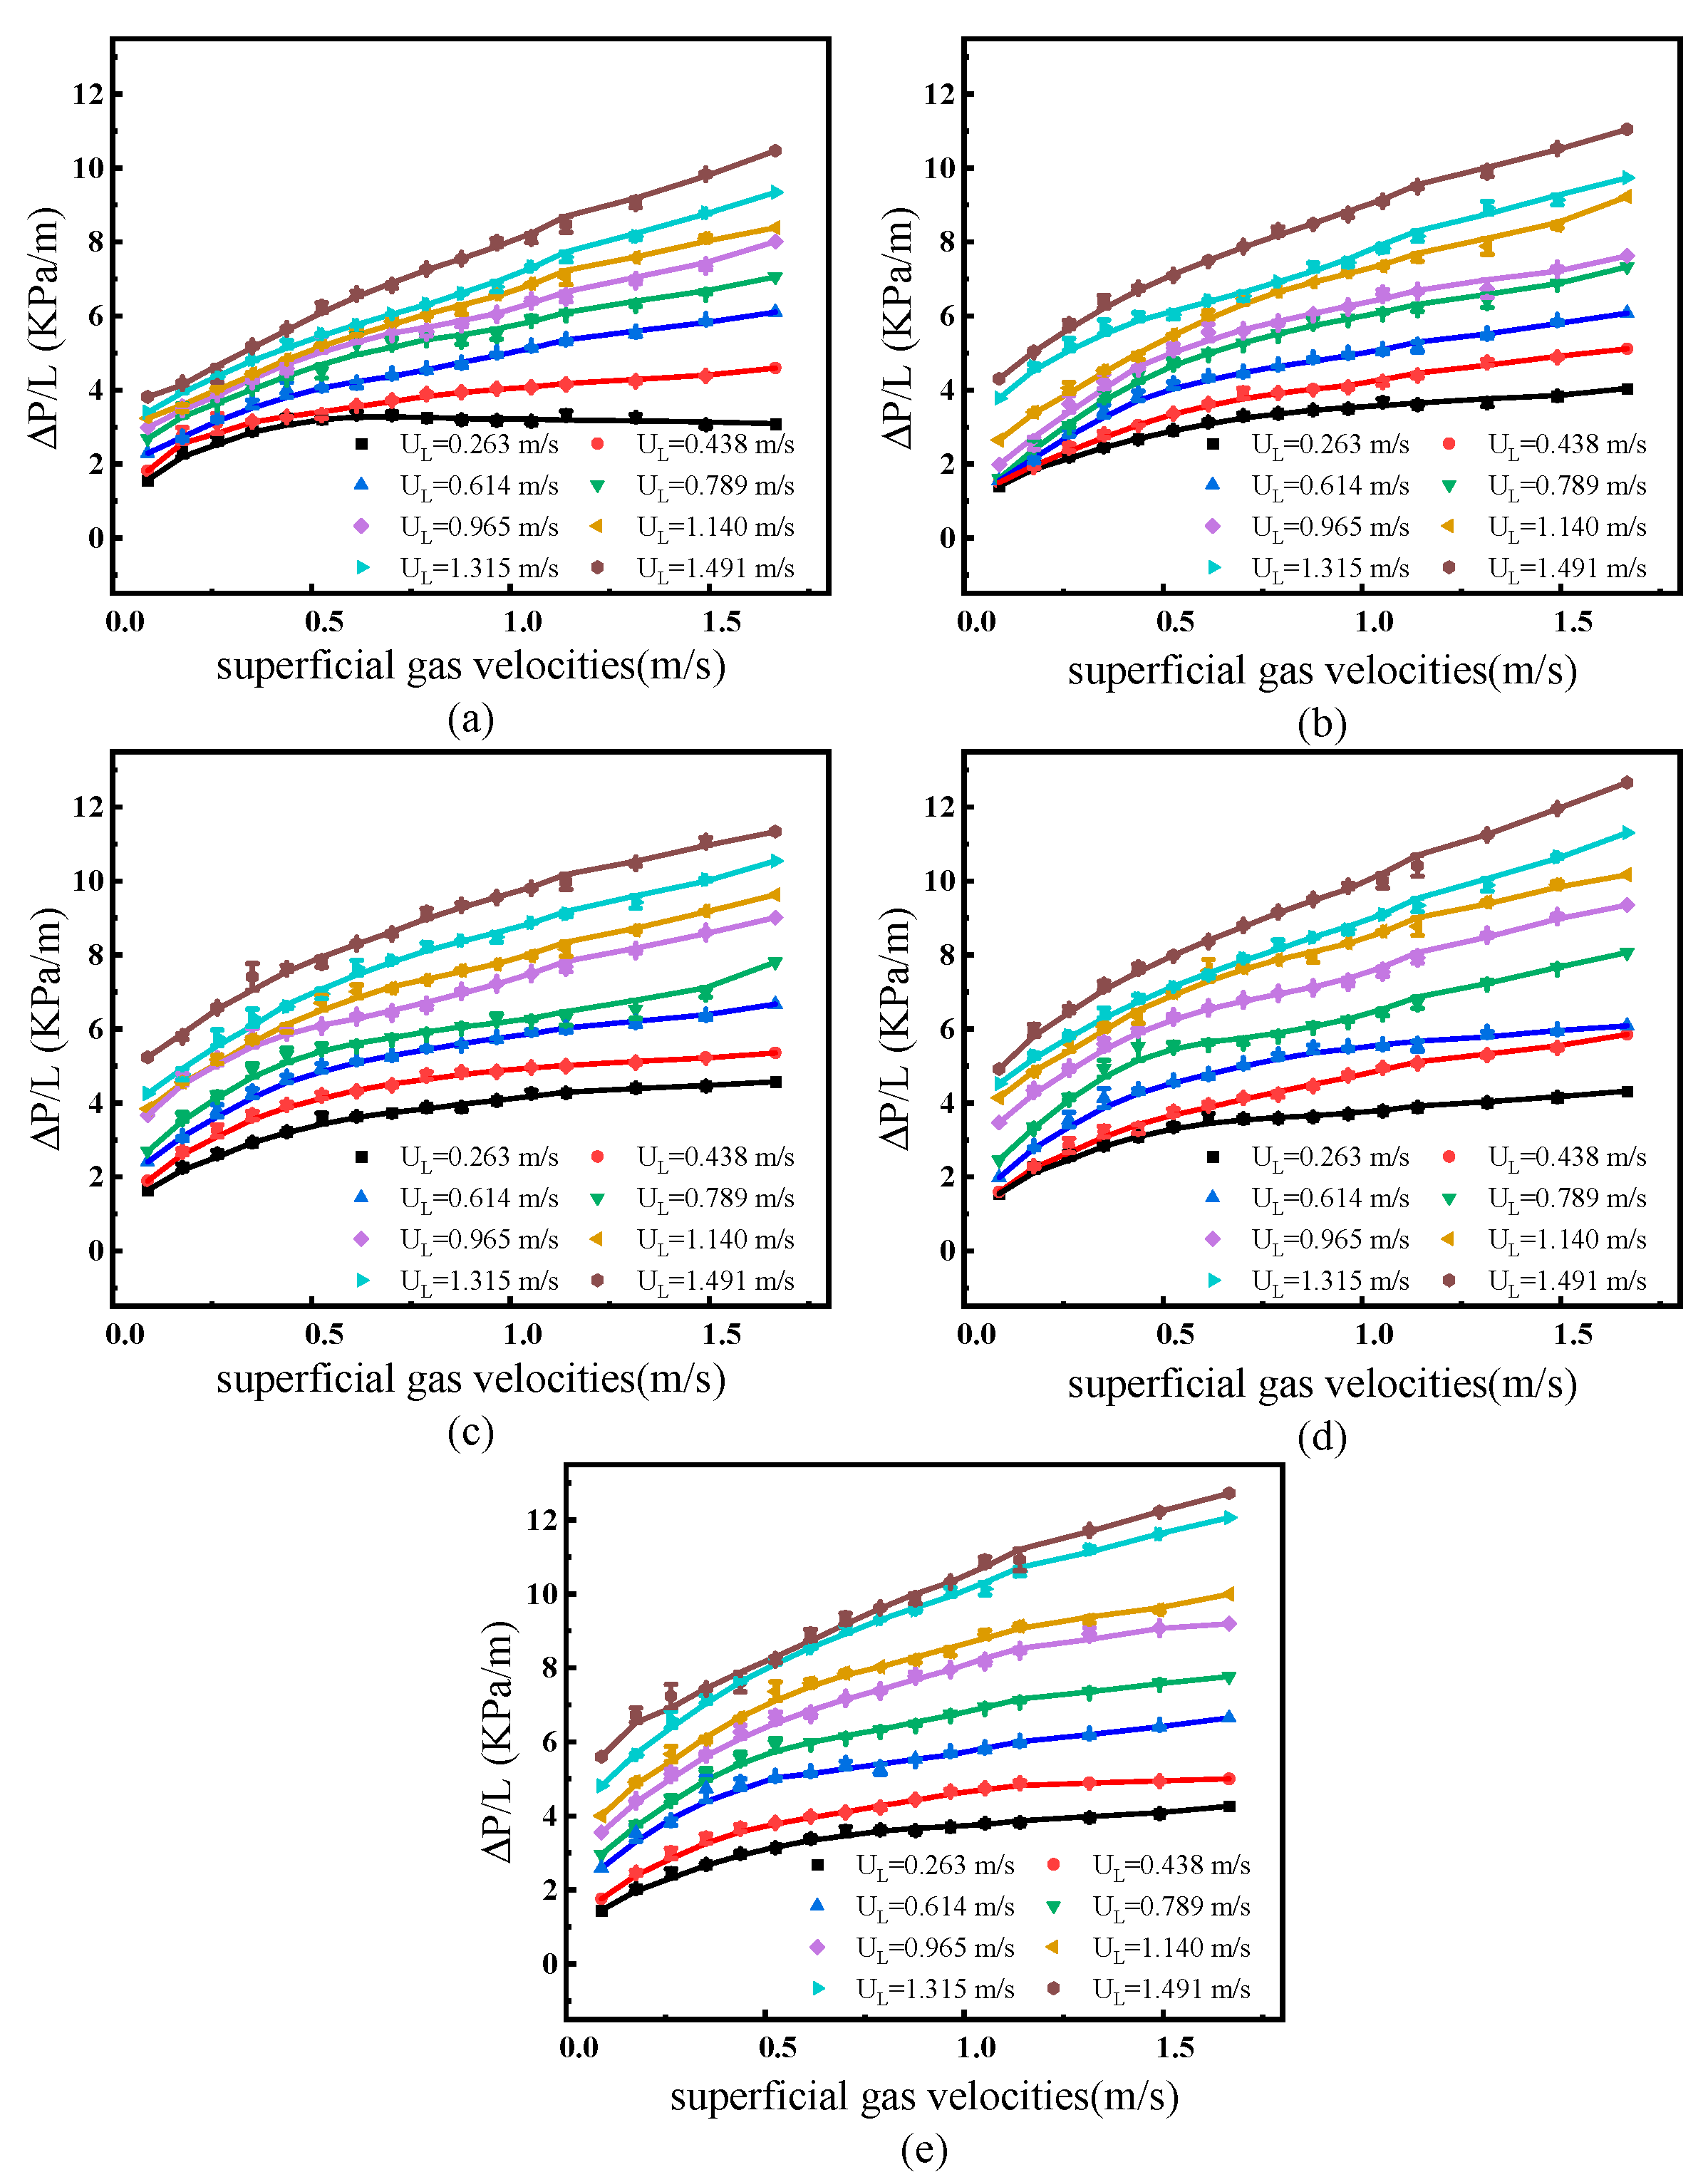
3.1. Experimental Results and Analysis of Frictional Pressure Drop

The flow characteristics in microchannels are different from that in conventional channels. Based on ERT technology, the two-phase flow pattern of glycerol aqueous solution (5–25 wt%)-air in vertical circular cross-section microchannels was studied. In the study, the apparent gas velocity ranged from 0.088 m/s to 1.666 m/s, the apparent liquid velocity ranged from 0.263 m/s to 1.491 m/s. The main flow states observed were: bubble flow, bubbly-cap flow, slug flow, elongated slug flow, unstable slug flow. The results are shown in Figure 3. The pressure drop in microchannels is mainly caused by frictional pressure drop. Therefore, the frictional pressure drop of air-water two-phase flow in microchannels with a vertical circular cross-section is studied in this experiment. The results are shown in Figure 4.
When only liquid flows in the microchannel, it can be seen that as the apparent liquid velocity increases, so does the frictional pressure gradient of the liquid phase. When two phases of gas and liquid pass through the microchannel at the same time, the frictional pressure gradient raises as the apparent flow rate of the liquid increases. On the contrary, when the apparent liquid velocity is constant, the frictional pressure gradient increases as the apparent gas velocity increases. Furthermore, as the bubble flow transits to the slug flow, the frictional pressure gradient decreases. It indicates that there is a correlation between the frictional pressure gradient and the flow pattern, as shown in Figure 5.

3.2. Influence of Liquid Surface Tension

In the paper, the effects of liquid surface tension and gas-liquid apparent velocity on two-phase frictional pressure drop are studied. The results are shown in Figure 6. When the apparent liquid velocity is constant, the experimental results are consistent with the results of glycerol aqueous solution air two-phase flow. That is, the frictional pressure drop increases with the increase in superficial gas velocity and apparent liquid velocity. When the gas-liquid apparent velocity is constant, with the decrease of the liquid surface tension, the pipe wall is easily wet. The smaller the equivalent diameter of the bubble, the higher the liquid plug velocity and length, the more bubbles per unit time.
The results of frictional pressure drop are compared with the six viscosity correlations based on the HFM model. The results are shown in Table 3, and compared with the results of five correlations of the SFM model, the results are shown in Figure 7 and Table 4. Based on the HFM model, it is found that 80.2% of the prediction points fall within the error range of 30%, and the frictional pressure drop predicted by the correlation is generally higher than the experimental value. The average relative error is smaller than that of glycerol aqueous solution air two-phase flow. In addition, the predicted value of the Hibiki and Mishima correlation is in good agreement with the experimental data in the SFM model. Except for the big difference between the predicted values of Lee and Lee, Zhang et al. The experimental results show that the other predicted values have good agreement with the experimental results, which verifies the reliability of the experimental data.

3.3. Influence of Liquid Viscosity

In fact, the frictional pressure drop is the result of the interaction of gas pressure with liquid pressure. The pressure of the gas phase is affected by the velocity of bubbles, the contact area between bubbles, the number of bubbles and the length of bubbles. The liquid pressure is affected by the liquid plug speed and the liquid plug length. In this article, the effects of liquid viscosity and gas-liquid apparent velocity on the frictional pressure drop of two-phase systems are studied. The results are shown in Figure 8. When the apparent liquid velocity is constant, the bubble length increases with the increase of the apparent gas velocity, while the number of bubbles decreases, which leads to an increase in the frictional pressure gradient. When the apparent velocity is constant, the frictional pressure drop increases with the increase in liquid viscosity. For bubbly flow and transition flow, the increase in liquid viscosity significantly increases the rising rate and the upper and lower limits of the frictional pressure gradient. For slug flow, the increase in liquid viscosity only slightly increases the upper and lower limits of the frictional pressure gradient. It indicates that the liquid viscosity plays an important part in the frictional pressure gradient of bubble flow.
The results of two-phase frictional pressure drop were compared with six viscosity correlations based on the HFM model. The results are shown in Table 5. The results are compared with those of Lockhart and Martinelli, Zhang, Lee and Lee, Mishima and Hibiki, Li and Wu in the SFM model. The results are shown in Figure 9 and Table 6.
Based on the HFM model, it is found that 78.7% of the prediction points fall within the error range of 30%. When the liquid viscosity is close to the tap water viscosity, the viscosity values predicted by the above six viscosity correlations are generally lower than the experimental values, the data is scattered, and the average error of bubble flow is small. When the liquid viscosity gradually deviates from the tap water viscosity, the predicted viscosity value is gradually higher than the experimental value. And the error rate of slug flow is small.
In the SFM model, there is a large deviation between the predicted value and the experimental value. There is a certain gap between the existing correlation prediction value and the experimental value. Second, as the viscosity of the liquid increases, the viscous stress hinders the relative motion between the two-phase fluids during the flow process. It causes the ϕ L 2 numerical value to drop.
Based on the SEM model, the effect of liquid viscosity on frictional pressure drop was reconsidered. The corrected correlations are as follows. expressed as Equation (8) to Equation (9):
X = ( U L U G ) 0.5 ( μ L μ G ) 0.4
C = 21 ( 1 e 395 D h ) ,
The comparison results between the experimental value of the two-phase friction coefficient and the predicted value of the modified correlation are shown in Figure 10. The calculation results of the modified correlation are highly consistent with the experimental values. It verifies that the modified formula can accurately predict the two-phase friction coefficient in the microchannel within the experimental range.

4. Conclusions

In this paper, the gas-water two-phase flow characteristics in a vertical circular microchannel with an inner diameter of 1 mm were investigated using a differential pressure sensor and ERT technology. Based on ERT technology, the effect of liquid properties on the gas-liquid two-phase flow characteristics and characteristic parameters in vertical circular microchannels was studied. In addition, capacitive differential pressure sensor technology is used to measure changes in the frictional pressure gradient in the system. Based on the SEM model, the effect of viscosity on frictional pressure drop is reconsidered, and X and C are corrected.
The frictional pressure drop increases with the increase in the apparent gas velocity, the apparent liquid velocity and the liquid viscosity. And it increases with the decrease of the liquid surface tension.
In the gas-water two-phase flow, the frictional pressure gradient increases with the increase in the superficial velocity, but decreases with the change in the flow pattern. The experimental results are in good agreement with the literature results.
In the SFM model, the correlation prediction results in the literature have a low degree of agreement, and cannot accurately predict the frictional pressure drop in the microchannel in this study. Based on the experimental data, the correlations of X and C are corrected, which can predict the gas-phase friction coefficient in the microchannel well.

Author Contributions

R.Z. (Ruijie Zhang): Writing—original draft, Writing—review & editing; F.T.: Investigation, Resources; G.H.: Methodology, Formal Analysis; X.G.: Methodology; H.J.: Supervision, Project administration; L.M.: Formal Analysis, Methodology; R.Z. (Rongyue Zhang): Methodology; Q.G.: Methodology; S.Y.: Formal Analysis. All authors have read and agreed to the published version of the manuscript.

Funding

This research was funded by the National Natural Science Foundation of China, grant number 91634101, and The Project of Construction of Innovative Teams and Teacher Career Development for Universities and Colleges under Beijing Municipality, grant number IDHT20180508.

Institutional Review Board Statement

Not applicable.

Informed Consent Statement

Not applicable.

Data Availability Statement

Not applicable.

Conflicts of Interest

The authors declare no conflict of interest.

References

  1. Kawahara, A.; Chung, M.Y.; Kawaji, M. Investigation of two-phase flow pattern, void fraction and pressure drop in a microchannel. Int. J. Multiph. Flow 2002, 28, 1411–1435. [Google Scholar] [CrossRef]
  2. Lalegani, F.; Saffarian, M.R.; Moradi, A.; Tavousi, E. Effects of different roughness elements on friction and pressure drop of laminar flow in microchannels. Int. J. Numer. Methods Heat Fluid Flow 2018, 28, 1664–1683. [Google Scholar] [CrossRef]
  3. Kawahara, A.; Yonemoto, Y.; Arakaki, Y. Pressure Drop for Gas and Polymer Aqueous Solution Two-Phase Flows in Horizontal Circular Microchannel. Appl. Sci. Res. 2020, 105, 1325–1344. [Google Scholar] [CrossRef]
  4. Ronshin, F.V.; Dementyev, Y.A. Influence of Liquid Properties on Gas-Liquid Flow Regimes and Pressure Drop in a Flat Microchannel. J. Eng. Thermophys. 2021, 30, 661–671. [Google Scholar] [CrossRef]
  5. Moradikazerouni, A.; Shoele, K.; Alireza Moradikazerouni Team; Kourosh Shoele Team. Computational study of Rayleigh-Bernard convection in a cylindrical pressurized cryogenic tank. APS Div. Fluid Dyn. Meet. Abstracts 2021, F06.001. Available online: https://ui.adsabs.harvard.edu/abs/2021APS..DFDF06001M (accessed on 27 March 2022).
  6. Estebe, C.; Liu, Y.; Vahab, M.; Sussman, M.; Moradikazerouni, A.; Shoele, K.; Guo, W. A Low Mach Number, Adaptive Mesh Method for Simulating Multi-phase Flows in Cryogenic Fuel Tanks. In Proceedings of the SIAM Conference on Computational Science and Engineering, Philadelphia, PA, USA, 25 August 2021. [Google Scholar]
  7. Triplett, K.A.; Ghiaasiaan, S.M.; Abdelkhalik, S.I.; Sadowski, D.L. Gas-liquid two-phase flow in microchannels Part I: Two-phase flow patterns. Int. J. Multiph. Flow 1999, 25, 377–394. [Google Scholar] [CrossRef]
  8. Fujioka, H.; Grotberg, J. Steady propagation of a liquid plug in a two-dimensional channel. J. Biomech. Eng. 2004, 126, 567–577. [Google Scholar] [CrossRef]
  9. Jing, S. Characteristics of gas-liquid two-phase flow in microchannels. J. Qingdao Univ. Sci. Technol. 2006, 27, 299–303. [Google Scholar]
  10. Chisholm, D. A theoretical basis for the Lockhart-Martinelli correlation for two-phase flow. Int. J. Heat Mass Transf. 1967, 10, 1767–1778. [Google Scholar] [CrossRef]
  11. Lee, H.J.; Lee, S.Y. Pressure drop correlations for two-phase flow within horizontal rectangular channels with small heights. Int. J. Multiph. Flow 2001, 27, 783–796. [Google Scholar] [CrossRef]
  12. Dukler, A.E.; Wicks, M.; Cleveland, R.G. Frictional pressure drop in two-phase flow: A. A comparison of existing correlations for pressure loss and holdup. AIChE J. 1964, 10, 38–43. [Google Scholar] [CrossRef]
  13. Mcadams, W.H.; Woods, W.K.; Bryan, R.L. Vaporization inside horizontal tubes-II-benzene-oil mixtures. Trans. ASME 1942, 64, 193. [Google Scholar]
  14. Chicchitti, A.; Lombardi, C.; Silvestri, M.; Soldaini, G.; Zavattarelli, R. Two-phase cooling experiments-pressure drop, heat transfer and burnout measurements. Energia Nucl. 1960, 7, 407–425. [Google Scholar]
  15. Beattie, D.R.H.; Whalley, P.B. A simple two-phase frictional pressure drop calculation method. Int. J. Multiph. Flow 1982, 8, 83–87. [Google Scholar] [CrossRef]
  16. Lin, S.; Kwok, C.C.K.; Li, R.-Y.; Chen, Z.-H.; Chen, Z.-Y. Local frictional pressure drop during vaporization of R-12 through capillary tubes. Int. J. Multiph. Flow 1991, 17, 95–102. [Google Scholar] [CrossRef]
  17. Awad, M.M.; Muzychka, Y.S. Effective property models for homogeneous two-phase flows. Exp. Therm. Fluid Sci. 2008, 33, 106–113. [Google Scholar] [CrossRef]
  18. Tao, F.; Jin, H.; He, G.; Guo, X.; Ma, L.; Zhang, R. Two-phase flow characteristics of gas-liquids in microchannels using electrical resistance tomography. Int. J. Heat Mass Transf. 2021, 58, 99–114. [Google Scholar] [CrossRef]
  19. Lockhart, R.W.; Martinelli, R.C. Proposed correlation of data for isothermal two-phase, two-component flow in pipes. Chem. Eng. Sci. 1949, 45, 39–48. [Google Scholar]
  20. Zhang, T.; Cao, B.; Fan, Y. Gas-liquid flow in circular microchannel. Part I: Influence of liquid physical properties and channel diameter on flow patterns. Chem. Eng. Sci. 2011, 66, 5791–5803. [Google Scholar] [CrossRef]
  21. Mishima, K.; Hibiki, T.; Zhang, W. Correlations of two-phase frictional pressure drop and void fraction in mini-channel. Heat Mass Transf. 2010, 53, 453–465. [Google Scholar]
  22. Li, W.; Wu, Z. A general correlation for adiabatic two-phase pressure drop in micro/mini-channels. Int. J. Heat Mass Transf. 2010, 53, 2732–2739. [Google Scholar] [CrossRef]
Figure 1. Experimental setup of gas-liquid two-phase flow in microchannel.
Processes 10 00799 g001
Figure 2. Comparison of frictional pressure gradient of air-water two-phase flow in a microchannel with correlation predictions.
Processes 10 00799 g002
Figure 3. Flow patterns of air-glycerol aqueous solution (5–25 wt%) two-phase flow: (a) Bubble flow, (b) Small Bubble, (c) Smooth Slug flow, (d) Slug flow, (e) Bubbly-cap flow, (f) Slug-bubble flow, (g) Elongated slug flow, (h) Unstable slug flow.
Processes 10 00799 g003
Figure 4. A frictional pressure gradient of air-water two-phase flow in microchannels at different gas-liquid superficial velocities.
Processes 10 00799 g004
Figure 5. Frictional pressure gradient of air-water two-phase flow in microchannels under different flow patterns.
Processes 10 00799 g005
Figure 6. Frictional pressure gradient of ethanol aqueous solution (5–25 wt%)-air two-phase flow in microchannel: (a) 5 wt% ethanol aqueous solution, (b) 10 wt% ethanol aqueous solution, (c) 15 wt% ethanol aqueous solution, (d) 20 wt% ethanol aqueous solution, (e) 25 wt% ethanol aqueous solution.
Processes 10 00799 g006
Figure 7. Comparison of correlation predicted value and experimental value under different liquid surface tension: (a) Lockhart and Martinelli correlation, (b) Mishima and Hibiki correlation, (c) Lee and Lee. correlation, (d) Zhang et al. correlation, (e) Li and Wu. correlation.
Processes 10 00799 g007
Figure 8. Frictional pressure gradient of glycerol aqueous solution (5–25 wt%)-air two-phase flow in microchannel: (a) 5 wt% glycerol aqueous solution, (b) 10 wt% glycerol aqueous solution, (c) 15 wt% glycerol aqueous solution, (d) 20 wt% glycerol aqueous solution, (e) 25 wt% glycerol aqueous solution.
Processes 10 00799 g008
Figure 9. Comparison of correlation predicted value and experimental value under different liquid viscosity: (a) Lockhart and Martinelli correlation, (b) Mishima and Hibiki correlation, (c) Lee and Lee. correlation, (d)Zhang et al. correlation, (e) Li and Wu. correlation.
Processes 10 00799 g009
Figure 10. Comparison of correlation calculation value and experiment result under different liquid viscosity.
Processes 10 00799 g010
Table 1. Experimental fluid properties.
FluidDensity
ρ (Kg/m3)
Viscosity
η (mPa·s)
η fluidwaterSurface Tension
σ (mN/m)
σ fluidwaterRange of
Re
Air1.180.018---
Water997.050.8851721296–1680
5 wt% Ethanol aqueous solution989.911.1701.3257.70.80233–1321
10 wt% Ethanol aqueous solution981.601.3301.5050.10.70194–1100
15 wt% Ethanol aqueous solution975.541.5101.71480.67170–963
20 wt% Ethanol aqueous solution967.321.7001.92400.56150–848
25 wt% Ethanol aqueous solution961.801.8202.0638.70.54139–788
5 wt% Glycerin aqueous solution1010.591.1001.24721242–1370
10 wt% Glycerin aqueous solution1025.981.2281.3971.40.99220–1246
15 wt% Glycerin aqueous solution1041.651.4311.6171.10.99191–1085
20 wt% Glycerin aqueous solution1052.511.6531.8770.50.98168–949
25 wt% Glycerin aqueous solution1061.211.9122.1670.00.97146–828
margin of error0.1–8%0–9%0–10%1–7%0.01–0.1%-
Note: All measurements were performed at room temperature (25 °C); viscosity was measured by Ubbelohde viscometer; surface tension and density were measured by surface tensiometer and densitometer.
Table 2. Modified correlation of Lockhart-Martinelli parameter C in literature.
ResearchersCorrelationRanges
Lockhart and Martinelli C = 5Laminar flow of gas and liquid
Mishima and Hibiki C = 21 ( 1 e 333 D h ) D h = 1–4 mm, circular section
Lee and Lee C = 6 . 833 × 10 8 ( μ L 2 ρ L σ D h ) 1 . 317 ( U μ L σ ) 0 . 719 ( ρ L U D h μ L ) 0 . 557 Laminar flow of gas and liquid
Zhang et al. C = 21 ( 1 e 358 / L a )   L a = [ σ / ( ρ L ρ G ) g ] 1 / 2 D h Modified Mishima and Hibiki’s correlation to extend to microscale
Li and Wu C = 11.90 B o 1 / 2 Circular   sec tion ,   rectangular   sec tion ,   multi - channel   D h = 0.148–3.25 mm
Table 3. Comparison of two-phase frictional pressure gradient and experimental results based on HFM model (ethanol aqueous solution-air).
ReferencesEthanol Aqueous Solution, MAE (%)
5 wt%10 wt%15 wt%20 wt%25 wt%Mean
McAdams et al.22.7223.0218.8421.0725.3522.2
Cicchitti et al.23.5926.3621.7432.4038.4728.512
Dukler et al.49.9949.9147.2044.5145.3647.394
Beattie and Whalley20.9329.2323.7437.5241.3630.556
Lin et al.23.1825.6720.9330.8636.7027.468
Awad and Myuztchka22.8524.6319.7926.9632.4825.342
Table 4. Comparison of the two-phase pressure drop correlations based on the separated flow model with the experimental results (ethanol aqueous solution-air).
ReferencesEthanol Aqueous Solution, MAE (%)
5 wt% 10 wt% 15 wt% 20 wt% 25 wt% Mean
Lockhart and Martinelli29.2832.5732.9930.9037.5932.67
Mishima and Hibiki25.3728.6729.1727.1734.0528.89
Lee and Lee48.7561.8551.6048.7452.6652.72
Zhang et al.51.7740.1535.7237.9326.0238.32
Li and Wu29.8131.7031.7427.7932.6330.73
Table 5. Comparison of two-phase frictional pressure gradient and experimental results based on HFM model.
ReferencesGlycerin Aqueous Solution MAE (%)
5 wt% 10 wt% 15 wt% 20 wt% 25 wt% Mean
McAdams et al.27.0727.1225.7426.1424.5126.13
Cicchitti et al.26.5926.3528.8628.5133.3428.73
Dukler et al.54.7253.9551.0850.8849.2751.98
Beattie and Whalley25.1024.5728.7231.7939.5829.95
Lin et al.26.3626.0928.1327.6931.9728.05
Awad and Myuztchka26.3326.2027.0326.6628.8027.00
Table 6. Comparison of two-phase frictional pressure gradient and experimental results based on HFM model.
ReferencesGlycerin Aqueous Solution, MAE (%)
5 wt% 10 wt% 15 wt% 20 wt% 25 wt% Mean
Lockhart and Martinelli31.7126.3125.8427.2927.2727.68
Mishima and Hibiki27.7622.9422.5524.2824.0924.32
Lee and Lee47.9344.4744.0644.2945.6045.27
Zhang et al.34.2469.2566.5358.8254.0456.58
Li and Wu51.7228.2527.6528.7328.7233.01
Publisher’s Note: MDPI stays neutral with regard to jurisdictional claims in published maps and institutional affiliations.

