Abstract
Preparation of a novel TpBD (synthesized from phloroglucinol and benzidine) covalent organic framework (COF) immobilized open-tubular (OT) capillary is described by in situ growth strategy. The stationary phase in the column was characterized by Fourier transform infrared (FTIR) spectra, X-ray diffraction (XRD), thermogravimetric analysis (TGA), nitrogen adsorption–desorption isotherms, scanning electron microscope (SEM), transmission electron microscopy (TEM) and energy-dispersive X-ray spectrum (EDS). Several families of compounds with different properties (alkylbenzenes, parabens, sulfonamides and benzoic acids) were selected to evaluate the performance of the TpBD COF immobilized capillary. The results showed that the stationary phase was uniform with about 6.0 μm thickness under the optimal preparation conditions, and the relative standard deviations (RSDs) were no more than 3.13% of alkylbenzenes on the TpBD COF immobilized capillary for 11 consecutive runs, which exhibited its excellent reproducibility and stability. A rapid baseline separation of each family of the analytes (neutral parabens, amphoteric sulfonamides and acidic benzoic acids) was obtained in less than 6 min with a resolution (Rs) of 2.79~9.30, which sufficiently verified the rapid separation, high resolution and wide application range of the TpBD COF immobilized capillary, and further revealed this strategy of fabricating COF to capillary column to show great promise in capillary electrochromatography.
1. Introduction
As interest in new complex mixtures develops and increases, the need for efficient, universal, reliable and sensitive instrumental analytical methods also increases. For the separation of complex mixtures, various chromatographic methods are frequently applied, including gas chromatography (GC) [1,2,3,4,5,6], high performance liquid chromatography (HPLC) [7,8,9] and capillary electrochromatography (CEC) [10]. Among them, CEC is a powerful separation technique that combines the high selectivity of HPLC and the high separation efficiency of capillary electrophoresis (CE) [11]. Open-tubular (OT) column, as one kind of separation columns used in CEC, has the advantages of easy fabrication and modification, no plug effect, no bubble effect, and especially, accessibility to employ functionalized materials as a stationary phase [12]. However, OT–CEC has some inherent limitations of low sample capacity and phase ratio.
Construction and application of novel covalent organic frameworks (COFs) are one of the most efficient and promise methods to solve these problems due to their fascinating properties [13,14], such as rigid structures, high thermal stabilities, low densities and permanent porosity with specific surface areas [15,16]. However, there have been only a few papers on this topic so far [17,18,19,20]. Bao et al. [17] developed a multilayer COF-5-coated capillary by a polydopamine-supported method and layer-by-layer strategy, and applied it for separation of neutral, acidic and basic analytes, which demonstrated the great potential for COFs as stationary phases of OT–CEC for the first time. In contrast, a high stable immobilization of COFs on the inner wall of the capillary column is a challenge to carry out. On the one hand, the stationary phases obtained by the dynamic coating method through physical absorption are unstable and have a short lifespan [18]. On the other hand, the classical COFs, such as COF-1 and CTF-1, also cannot be at the stable stationary phase due to the lack of appropriate reactive groups [19]. Immobilization of COFs to the inner wall of the capillary by chemical bonding and in situ synthesis is attracting researchers’ attention [20]. The TpBD COF, synthesized from phloroglucinol (Tp) and benzidine (BD), has a large number of amino groups, which have the possibility to react with aldehyde groups by Schiff’s base reaction to form the stable stationary phase. By searching relevant publications over the past 15 years (2005–2021) using SciFinder, 17 results were found for “TpBD and chromatography”. Most of them were focused on GC [21], HPLC [22,23] and solid phase extraction [24,25].
Therefore, TpBD COF immobilized capillary was designed and prepared by immobilizing TpBD COF to the inner surface of the capillary column [26], and its performance was evaluated through the rapid separation of three families of small molecular compounds with different properties (neutral parabens, amphoteric sulfonamides and acidic benzoic acids) by CEC.
2. Materials and Methods
2.1. Reagents and Materials
Phloroglucinol (Tp), benzidine (BD), glutaraldehyde (50%) and 3-aminoprophy-triethoxysilane (APTES) were purchased from Aladdin Industrial Co. (Shanghai, China). A solution of glutaraldehyde (2%) (v/v) with pH 11 was obtained by diluting 50% glutaraldehyde with ultrapure water and adjusting it with 0.5 M NaOH solution, respectively. Benzene, toluene, m-xylene, p-xylene, o-xylene and benzoic acids (2,5-diaminoterephthalic acid (DPA), 4-formylbenzoic acid (FLBA), 2-fluorobenzoic acid (FBA) and benzoic acid (BA)) were obtained from Kemel Chemical Reagent Co. (Tianjin, China). Sulfonamides (sulfamerazine (SM1), sulfadimethoxine (SDM), sulfamethazine (SM2), sulfamethoxazole (SMZ), sulfisoxazole (SIZ) and sulfaclozine (Esb3)) (purity > 98%) were purchased from the National Institute for the Control of Pharmaceutical and Biological Products (Beijing, China). Parabens (methyl 4-hydroxybenzoate (MHB), ethyl 4-hydroxybenzoate (EHB) and propyl 4-hydroxybenzoate (PHB)) were ordered from Jiuding Chemical Co. (Shanghai, China). Sulfamethoxazole tablets were produced by the sixth pharmaceutical factory of Harbin Pharmaceytical Group (Harbin, China). Hand cream and drinking water were purchased from a local shopping mall (Qiqihar, China). All other reagents used were of analytical grade unless otherwise stated. All solvents used in CEC were of chromatographic grade. Fused-silica capillaries (50 μm i.d. and 375 μm o.d.) were purchased from Yongnina Optical Fiber Factory (Hebei, Handan, China).
2.2. Instrumentation
All CEC separations were conducted on a CE system (Agilent 7100, Waldbronn, Germany) equipped with a diode array detector. Fourier transform infrared spectra (FTIR) were obtained by using a Spectrum One FTIR spectrometer (PerkinElmer, Waltham, Mass, USA). X-ray diffraction (XRD) pattern was measured with a D8 X-ray diffractometer (Bruker AXS, Karlsruhe, Germany). Surface morphology and the element distribution of TpBD COF immobilized capillary were observed by a H7650 transmission electron microscopy (TEM) (Hitachi, Tokyo, Japan) and a S-4300 scanning electron microscope (SEM) equipped with energy-dispersive X-ray spectrum (EDS) (Hitachi, Tokyo, Japan). Thermogravimetric analysis (TGA) was performed in a thermogravimetric analyzer (TA Instruments, Milford, CT, USA). The nitrogen adsorption–desorption isotherms were recorded by a surface area and pore size analyzer (Conta, Boynton Beach, FL, USA).
2.3. Preparation of Aldehyde Group-Functionalized Capillary
To achieve the growth of TpBD COF on the inner wall of the capillary column, two commercial reagents, APTES and glutaraldehyde, were used as cross linkers. Firstly, the capillary column pretreated [27] was rinsed with an aqueous solution of APTES (10%, v/v) for 5 min, then was kept for 30 min at 95 °C after sealing on both ends with a Teflon tube. The process was repeated once to obtain an amino-coated capillary. Secondly, the resulted capillary was continually flushed with the glutaraldehyde solution (2%, v/v) for 60 min at room temperature, then sonicated for 10 min at 40 °C after sealing on both ends. The procedure was repeated once more, and an aldehyde-coated capillary was obtained. It was flushed with water to remove the residuals, and dried by nitrogen blowing [28].
2.4. Preparation of the TpBD COF Immobilized Capillary
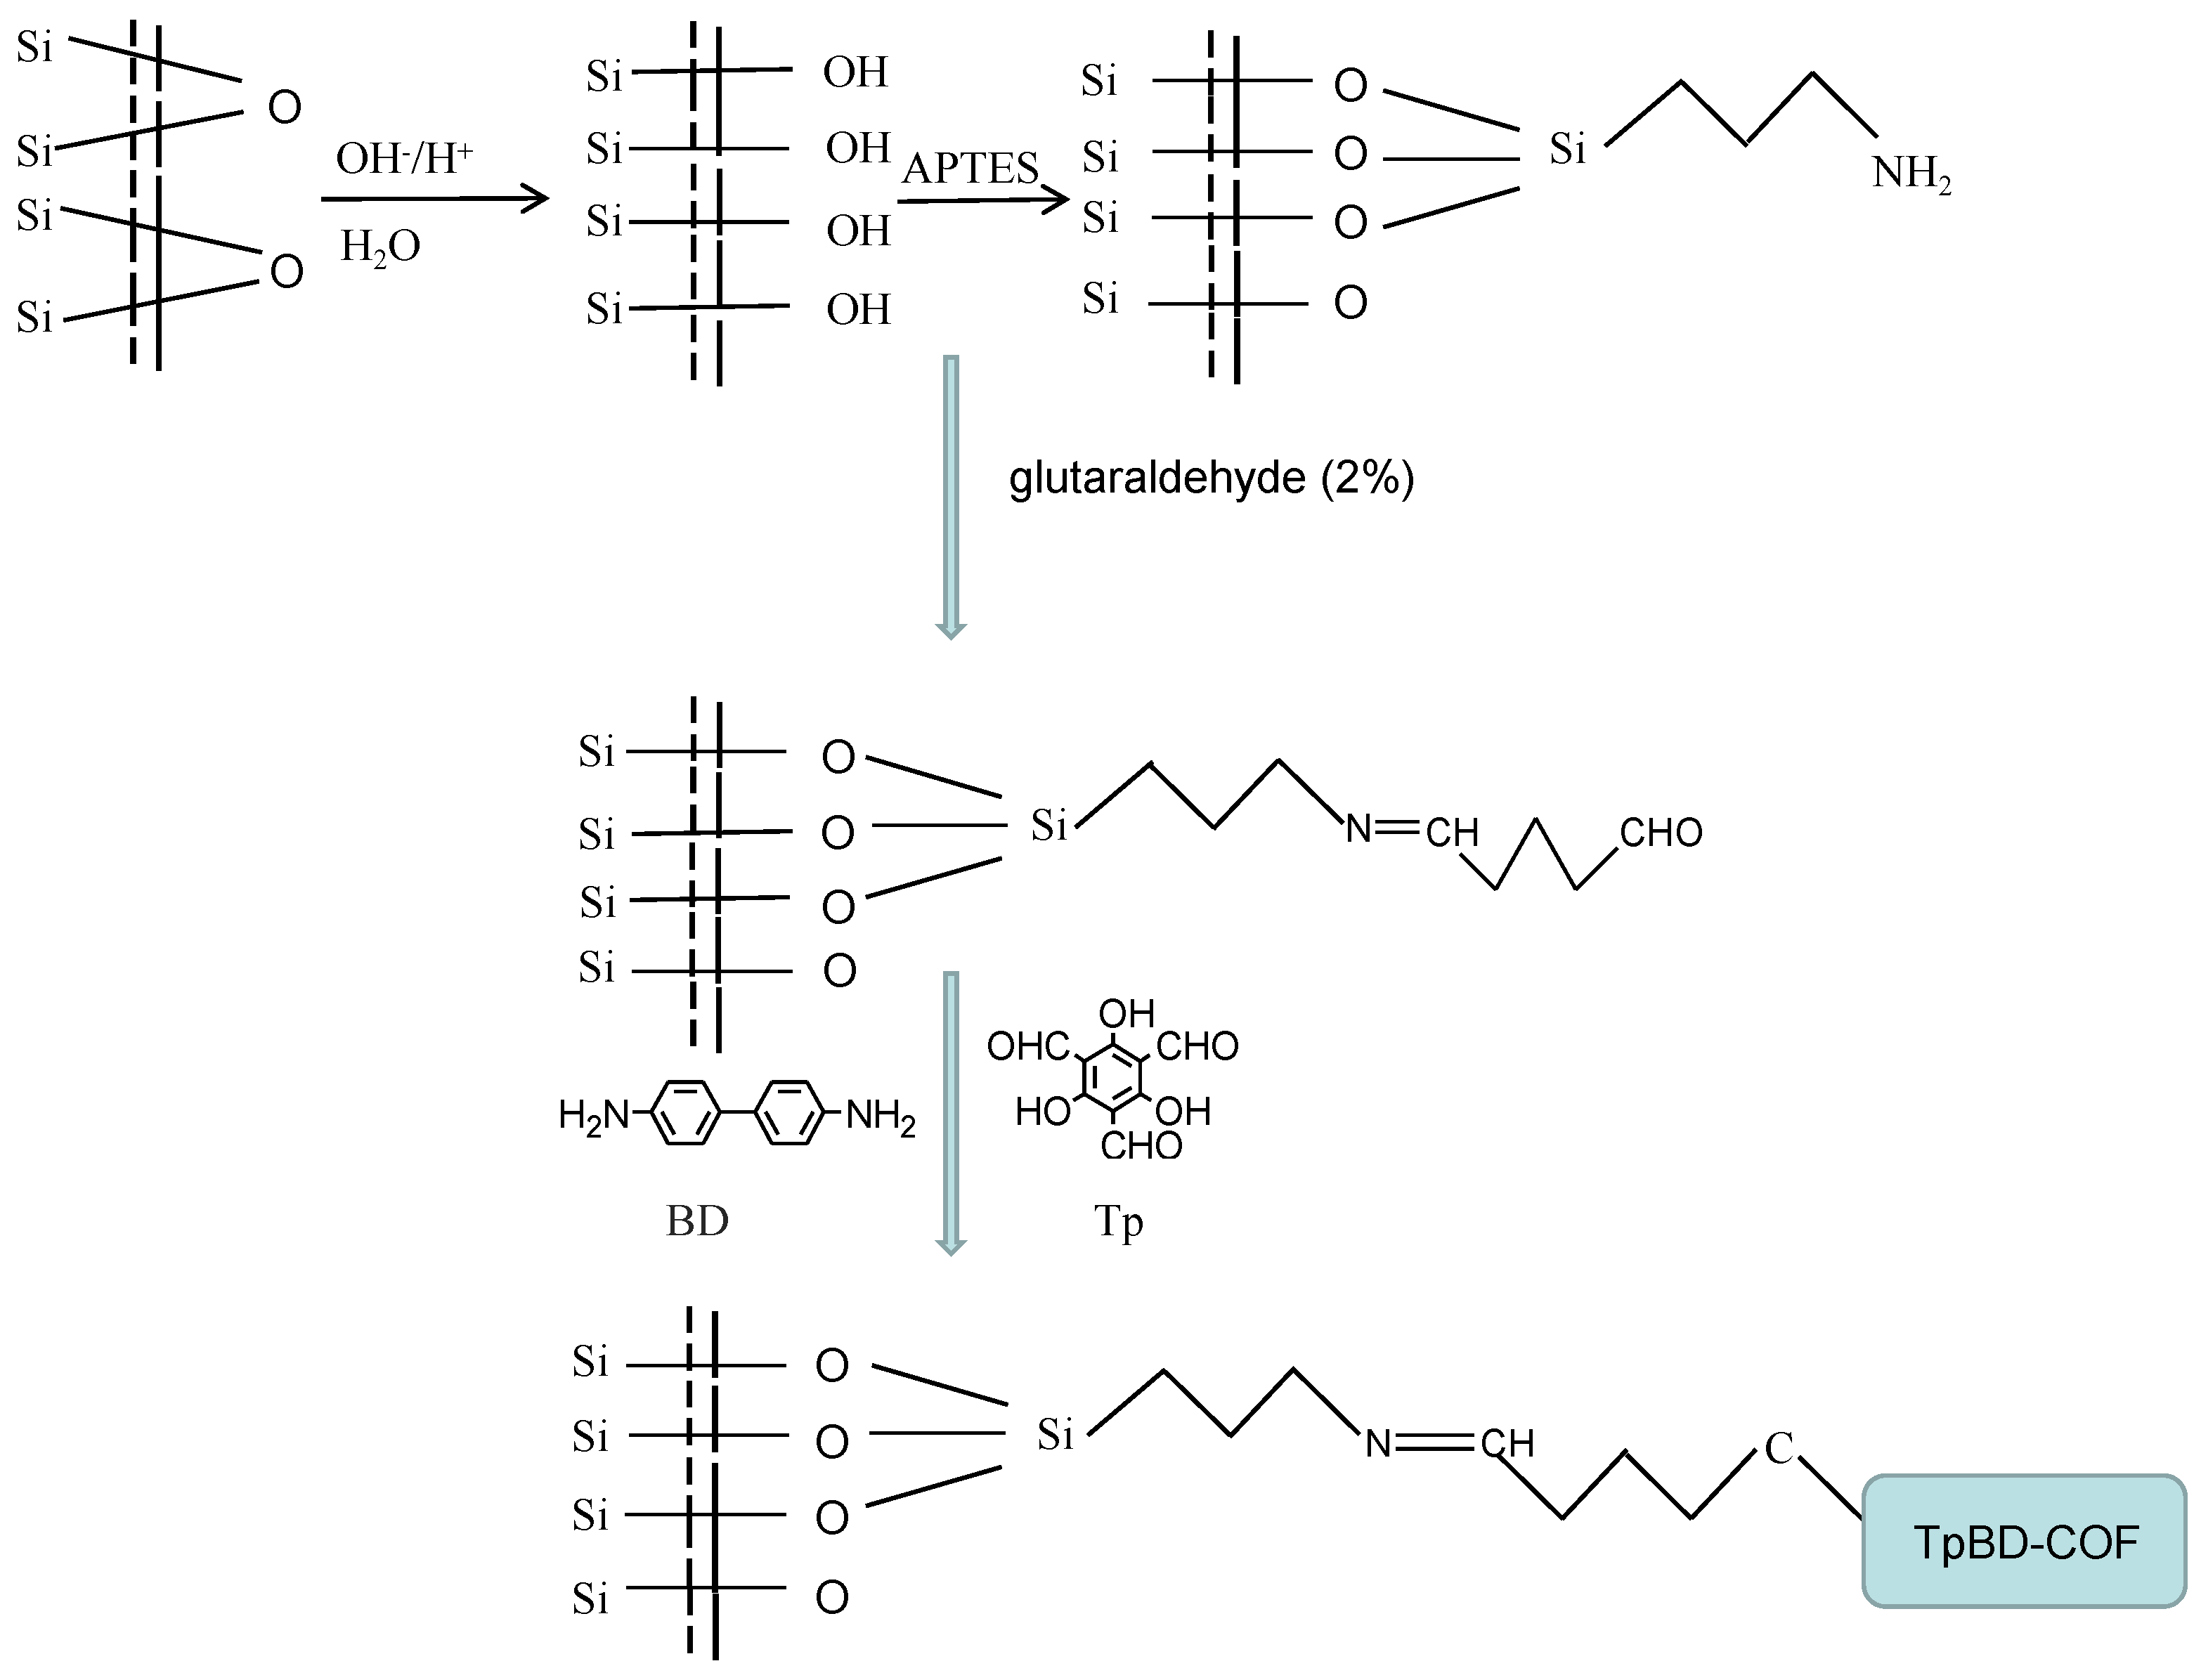
For the immobilization of TpBD COF on the inner wall of the capillary column, the aldehyde-coated capillary was filled with a 1:1.5 molar ratio mixture of Tp (0.7 mmol) and BD (1.05 mmol) as the monomers, and kept for 12 h in a water bath at 80 °C with sealing at both ends [29]. This procedure was repeated twice. During this period, the amino group of BD reacted with both the aldehyde groups of Tp and on the inner wall of the capillary column, which resulted in TpBD COF being immobilized to the capillary by C=N groups acting as a bridge. The TpBD COF immobilized capillary was obtained, then washed with methanol thoroughly to remove the residual of reactants and dried with nitrogen (Figure 1).
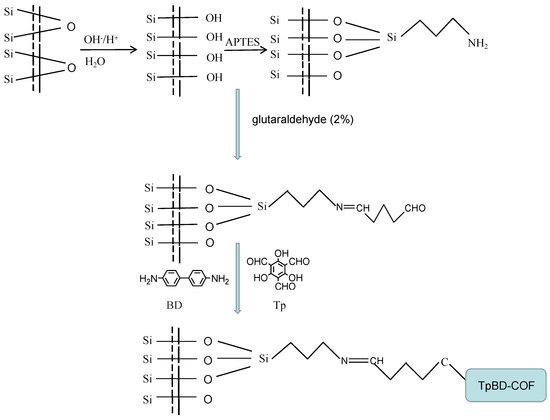
Figure 1.
Preparation scheme for the TpBD COF immobilized capillary.
Meanwhile, the TpBD COF immobilized fused-silica plate was prepared according to the same process for the preparation of TpBD COF immobilized capillary, then the stationary phase was scraped for FTIR, TG, SEM, EDS, XRD and nitrogen adsorption–desorption characterization.
2.5. CEC Conditions
The total length of the OT column was 40.0 cm and the effective length was 26.5 cm. Before CEC experiment, the OT column placed in the CEC instrument was balanced with running buffer at a low voltage of 5 kV. The pressure injection was 50 mbar × 3 s and the running temperature was kept at room temperature (20 °C). The CEC was performed with phosphate buffer of different pH values (pH 3.0–9.0). The operating voltage was in the range 5–25 kV. The detection wavelengths were set at the maximum absorption wavelength of the analytes. For the alkyl benzenes, parabens, sulfonamides and benzoic acids, 254 nm, 290 nm, 250 nm and 200 nm were applied, respectively. The standard stock solutions (100.0 mg·mL−1) of benzene, toluene, o-xylene, m-xylene, p-xylene, MHB, EHB, PHB, SM1, SDM, SM2, SMZ, SIZ, Esb3, DPA, FLBA, FBA and BA were made by dissolving analytes in a small volume of methanol individually, then being diluted with ultrapure water, and stored at 4 °C in a refrigerator. The test solutions were obtained by diluting the standard stock solutions or the mixture stock solutions to appropriate concentrations. Before use, all the solutions were filtered through a 0.45 μm membrane and degassed by sonication.
2.6. Preparation of Sample Solution
Approximately 0.10 g of the fine powder of the sulfamethoxazole tablets was weighed precisely, placed into a 100 mL volumetric flask, ultrasonically dissolved with 50 mL of a water/acetonitrile mixture (1:1 volume ratio), and diluted by water to the mark. The mixture was centrifuged at 4000 rpm for 10 min and the clear supernatant was collected and passed through a 0.45 μm filter membrane. Hand cream (5.0 g) was weighed precisely and placed into a 50 mL volumetric flask, accompanied by the addition of 50 mL of a water/methanol mixture (1:1 volume ratio). After 20 min of the ultrasound in ice water bath, the mixture was treated with the same process mentioned above [30]. The resulting solutions were injected into the CEC system.
3. Results and Discussion
3.1. Preparation and Characterization of the TpBD COF Immobilized Capillary
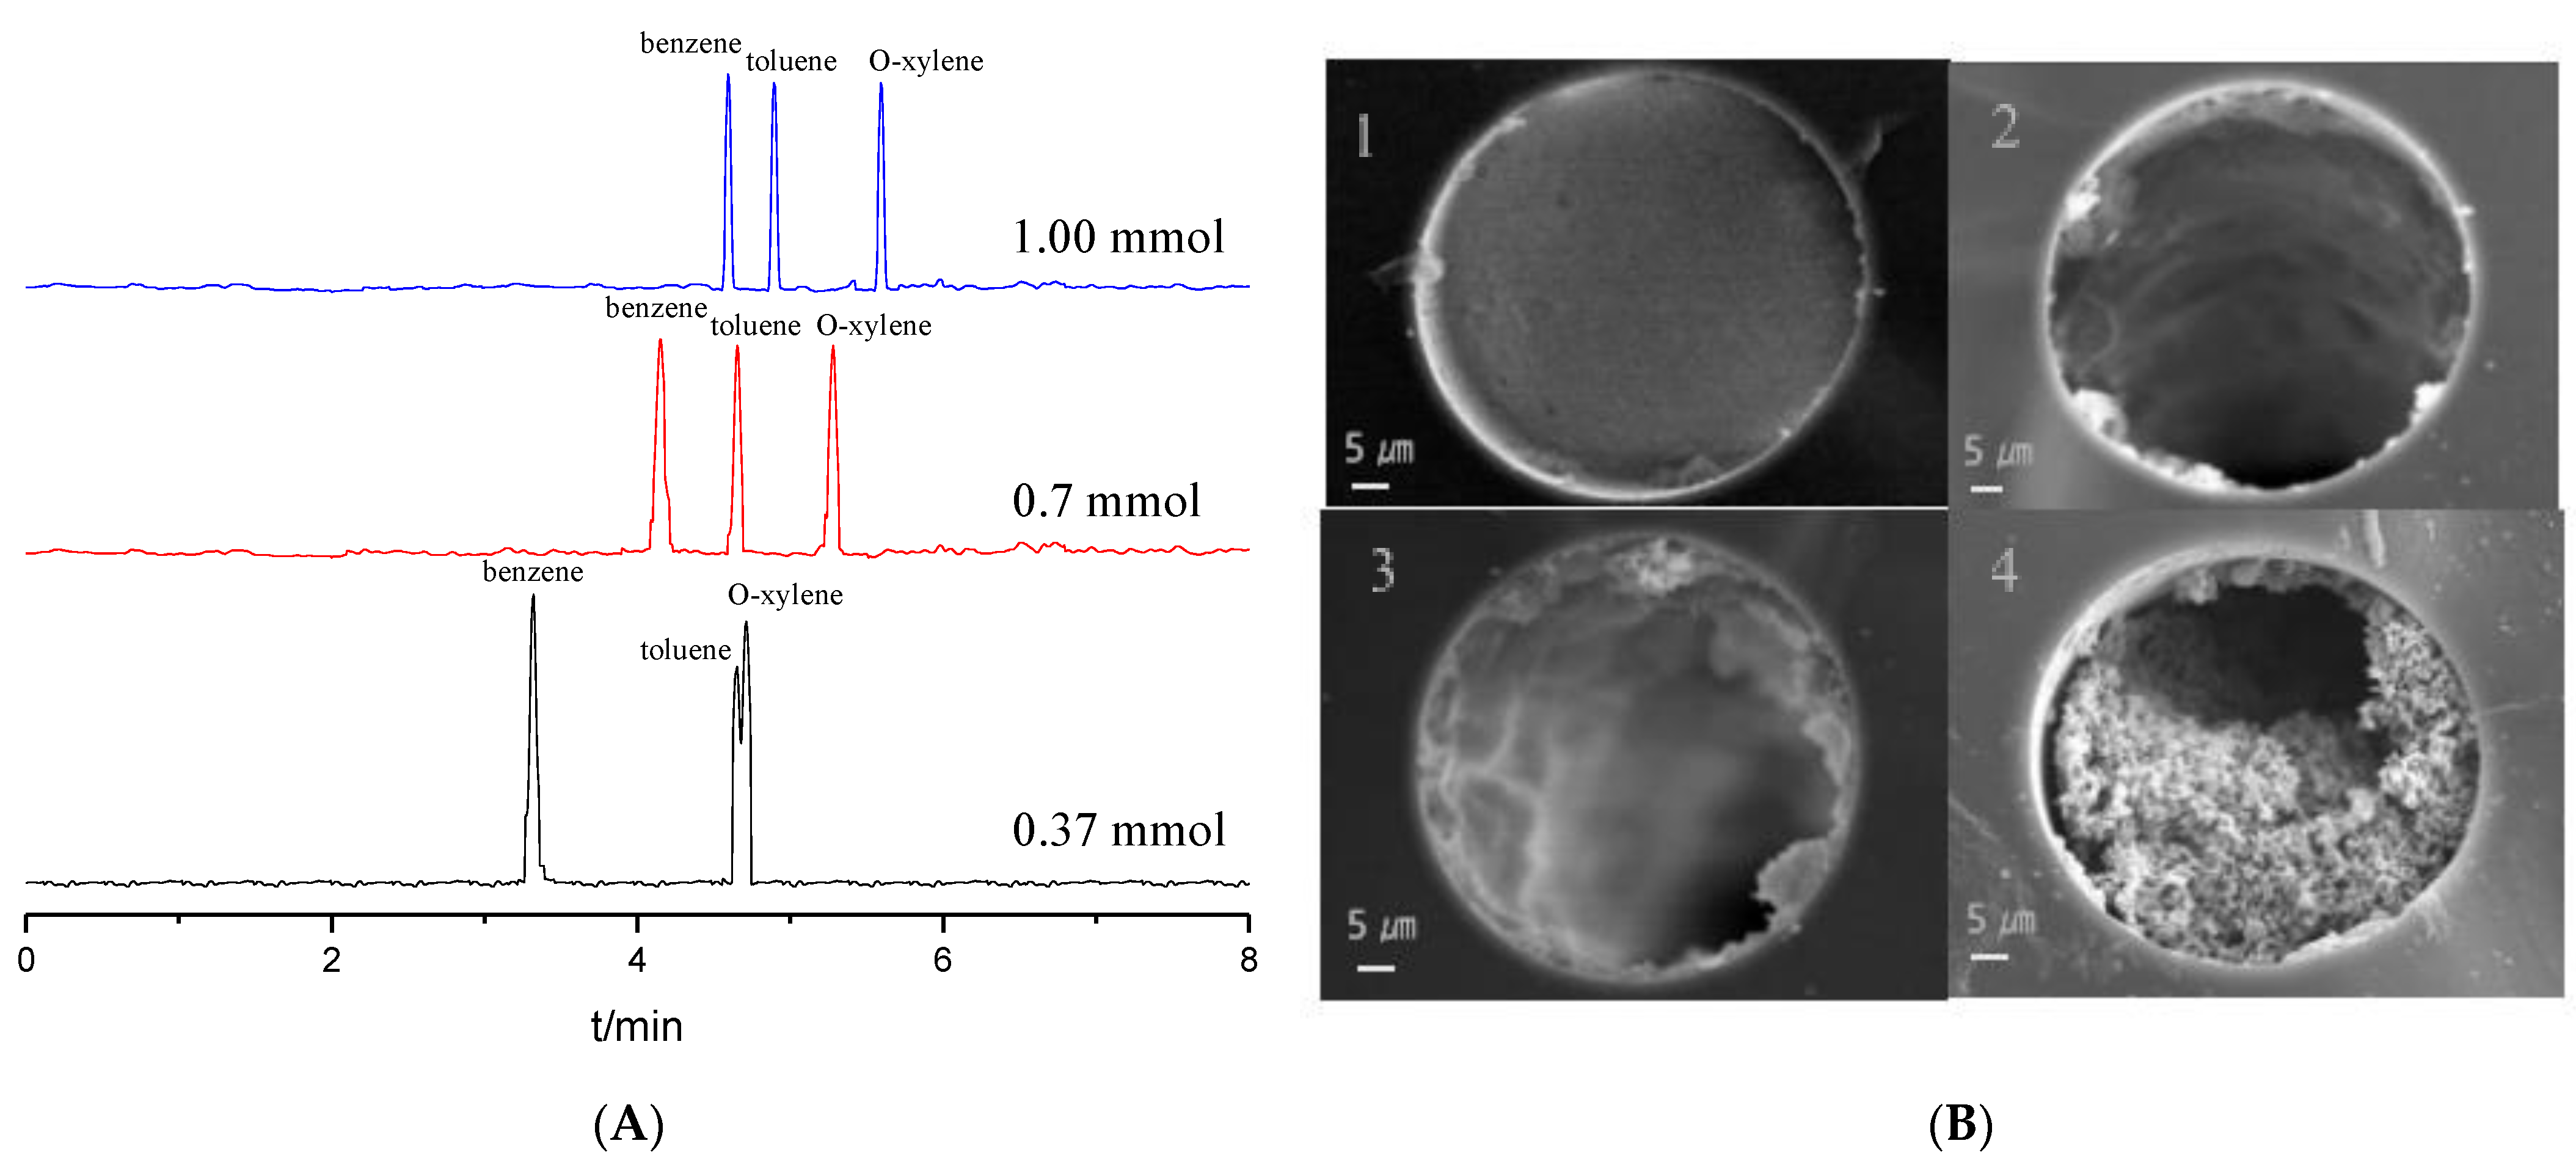
The dosage of the monomers is the most important factor during the OT column preparation. Effects of the dosages of 0.37, 0.70 and 1.00 mmol Tp with a 1:1.5 molar ratio mixture of Tp and BD on the separation of benzene, toluene and o-xylene were studied, as shown in Figure 2A. The migration times of the analytes increased with the increase in the Tp dosage. The analytes could be partly separated at 0.37 mmol of Tp due to fewer reaction sites from the stationary phase. Baseline separation was obtained at 0.70 mmol and 1.00 mmol of Tp; however, the migration times of the latter lengthened. Therefore, 0.70 mmol was chosen as the optimal dosage of Tp.
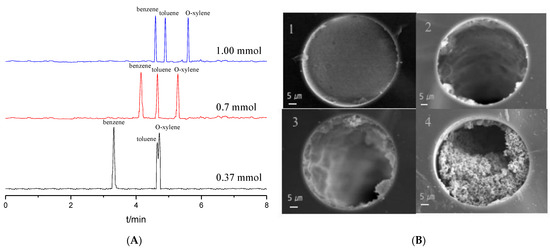
Figure 2.
Separation chromatograms for benzene, toluene and o-xylene with different Tp dosage when coating times were three (A); SEM images for the cross section of the TpBD COF immobilized capillary (×1.0 k) with different coating times when the Tp dosages was 0.70 mmol (B). Experimental conditions: 20 mM phosphate buffered solution (pH 8.0); operating voltage, 15 kV.
Coating times is another crucial factor in separation performance. The OT columns coated from one to four times were prepared (Figure 2B). The distribution in the stationary phase in the column is not uniform and very thin when the column was coated once with low column efficiency. When a process with two coatings was performed, both the thickness of the stationary phase and column efficiency slightly increased but uniformity remained poor. The stationary phase in the OT column bonded well and distributed uniformly after three coatings, and the OT column showed the highest column efficiency of 26,776 plates/m. When coating times was four, the capillary column was almost blocked. So, a process with three coating times was chosen optimal.
To verify if TpBD COF was bonded to the inner wall of the capillary, TpBD COF immobilized capillary, as prepared, was characterized by FTIR, XRD, TG, SEM, TEM, EDS and nitrogen adsorption–desorption (Figure 3 and Figure 4).
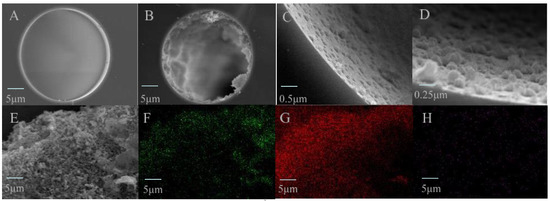
Figure 3.
SEM images for the cross section of the TpBD COF immobilized capillary. (A) The bare column (×1.0 k), (B–E) TpBD COF immobilized capillary (×1.0 k, ×10.0 k and ×20.0 k) and (E–H) EDS images for the stationary phase in the TpBD COF immobilized capillary (×4.0 k, green, red and purple dots represent C, O and N atoms, respectively).
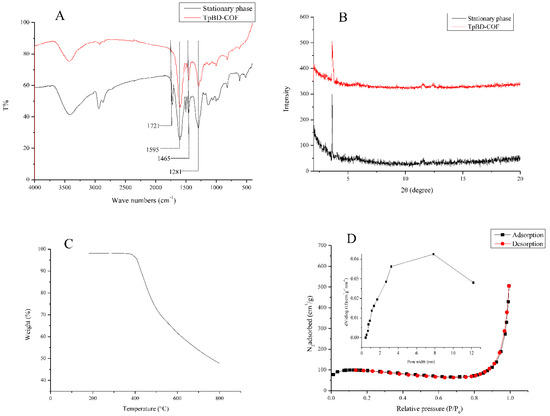
Figure 4.
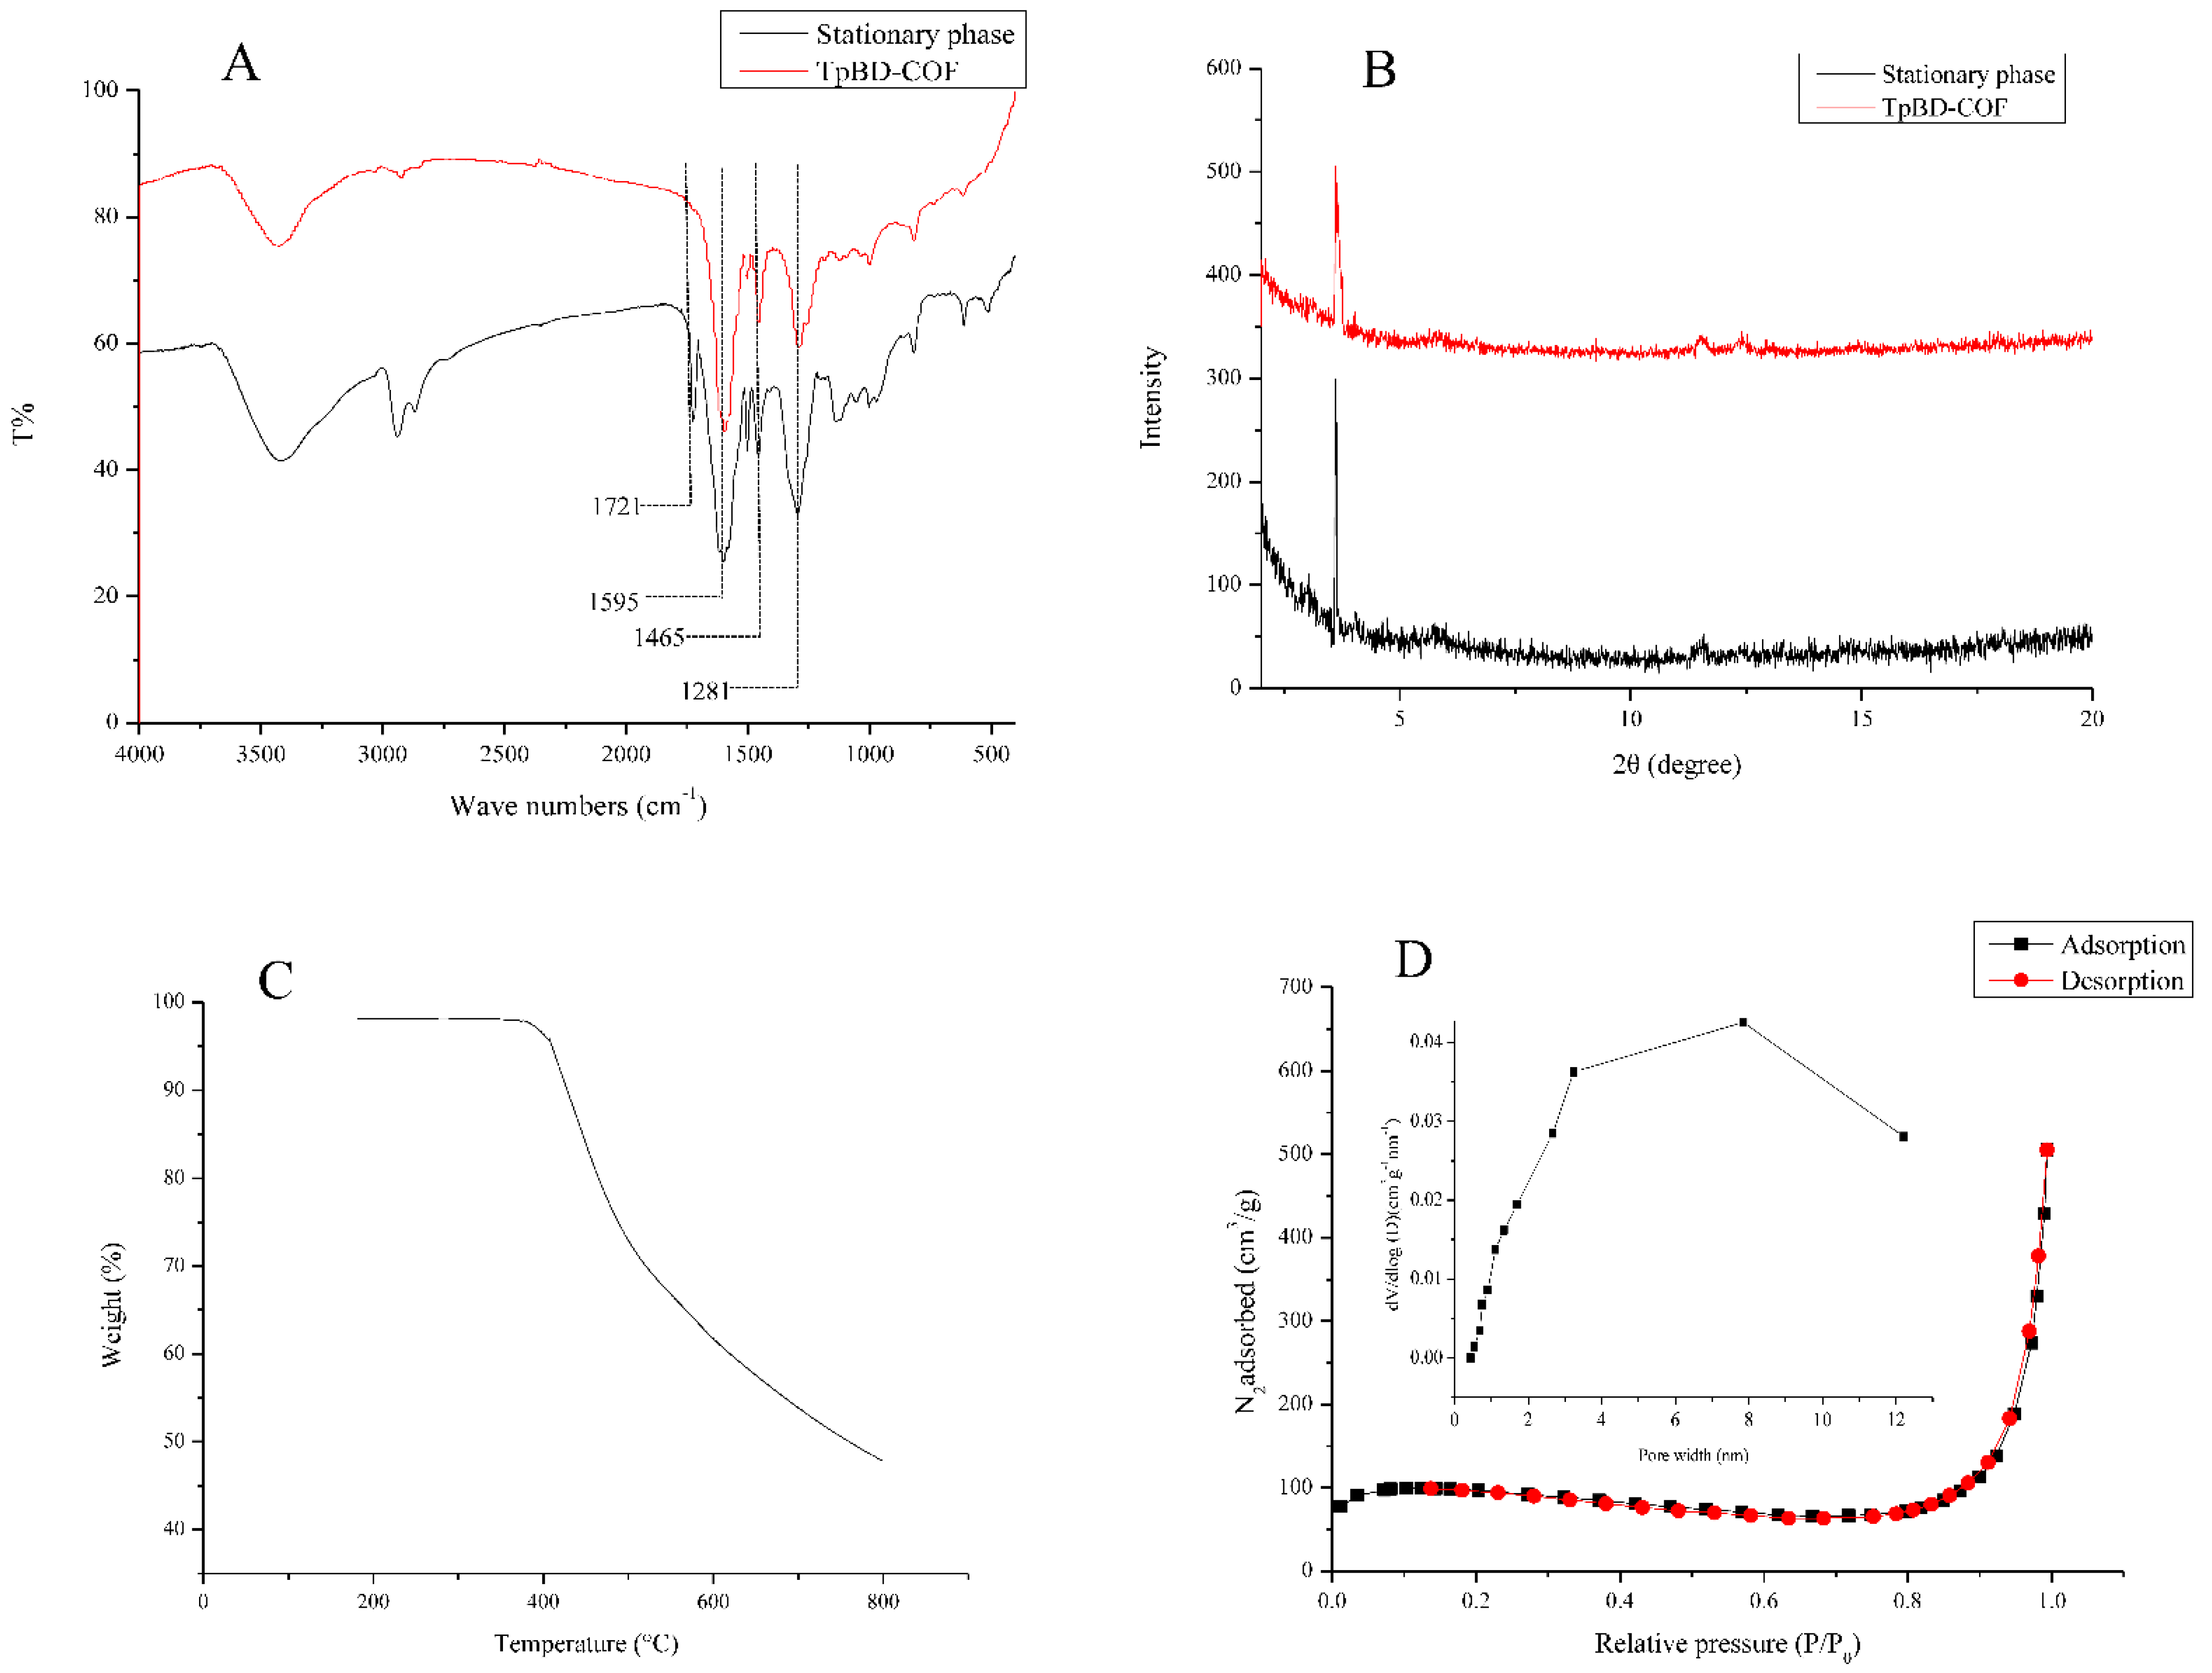
Characterization of the stationary phase in the TpBD COF immobilized capillary. (A) FTIR spectra, (B) X-ray diffraction, (C) TGA curve and (D) nitrogen adsorption-desorption isotherms. Insert: Pore size distribution.
It was observed that the inner surface of the bare capillary column was very smooth, and that of the TpBD COF immobilized capillary was significantly roughened with uniformly visible aggregates, and thickness was about 6.0 μm (Figure 3A–D). Although the normal sphere particles of TpBD COF were not observed in TEM images (Figure 3E), EDS maps showed uniform elemental distributions in the stationary phase (Figure 3F–H). The results indicated that TpBD COF particles grew on the inner wall of the capillary by chemical bonding.
A stretching vibration band of 1721 cm−1 (C=O) showed the reaction of the aldehyde group with the hydroxyl group on the benzene ring. The appearance of the characteristic bands at 1595 cm−1, 1465 cm−1 (C=C), and 1281 cm−1 (C–N) indicated the existence of TpBD COF in the stationary phase (Figure 4A) [31]. Only one intense peak at 3.6° in XRD patterns showed that the moderate crystallinity of TpBD COF was observed in the stationary phase (Figure 4B). TGA analysis was performed under a nitrogen atmosphere at a heating rate of 10 °C·min−1 from room temperature to 800 °C. The stationary phase lost weight at around 410 °C, revealing good thermal stability (Figure 4C). Nitrogen adsorption–desorption isotherm in the stationary phase was measured at the temperature of liquid nitrogen (77 K). The surface area and the total pore volume were 524.38 m2·g−1 and 0.84 cm3·g−1, respectively. A typical type-IV isotherm with H3 hysteresis loops was observed, it was indicative for the stationary phase with mesopores structure, which was consistent with the pore size of 3.50–7.80 nm in Figure 4D. These results suggested that TpBD COF was modified to the inner wall of the capillary.
3.2. Evaluation of the TpBD COF Immobilized Capillary
3.2.1. EOF Analysis
A flat electroosmotic flow (EOF) can support a high efficiency in CEC separation system. The EOF values of bare capillary column and the TpBD COF immobilized capillary at different pH values were measured and compared with benzene as the neutral marker (Figure 5). The EOF velocity (μeof) was calculated by the following equation:
where L, l, V and t represent the total capillary length (40.0 cm), effective capillary length (26.5 cm), applied voltage (15 kV) and migration time for benzene, respectively.
μeof = (L × l)/(V × t)
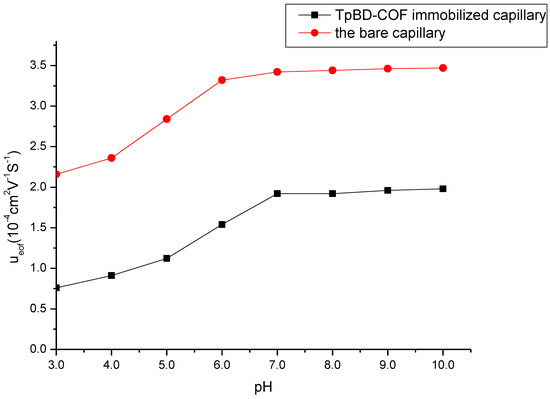
Figure 5.
Effect of buffer pH on the electroosmotic flow. Experimental conditions: sample, 5.0 mg/mL benzene; 5.0 mg/mL the mixture solution of benzene, toluene and o-xylene; 20 mM of phosphate buffer solution; operating voltage, 15 kV; temperature, 20 °C.
As seen in Figure 5, EOF of the TpBD COF immobilized capillary increased progressively with the pH increasing from 3.0 to 7.0, and mainly due to the increase in the dissociation of NH3+ on the surface of TpBD COF and the ionization of the residual silanol groups (Si–OH). As the increase in the pH value from 7.0 to 10.0, the dissociation of NH3+ was complete and the ionization of the residual Si–OH were hardly affected the change of pH values, so EOF was unchanged. EOF values of the TpBD COF immobilized capillary were lower than those of the bare capillary column due to the block of Si–OH by TpBD COF.
3.2.2. Reproducibility and Stability
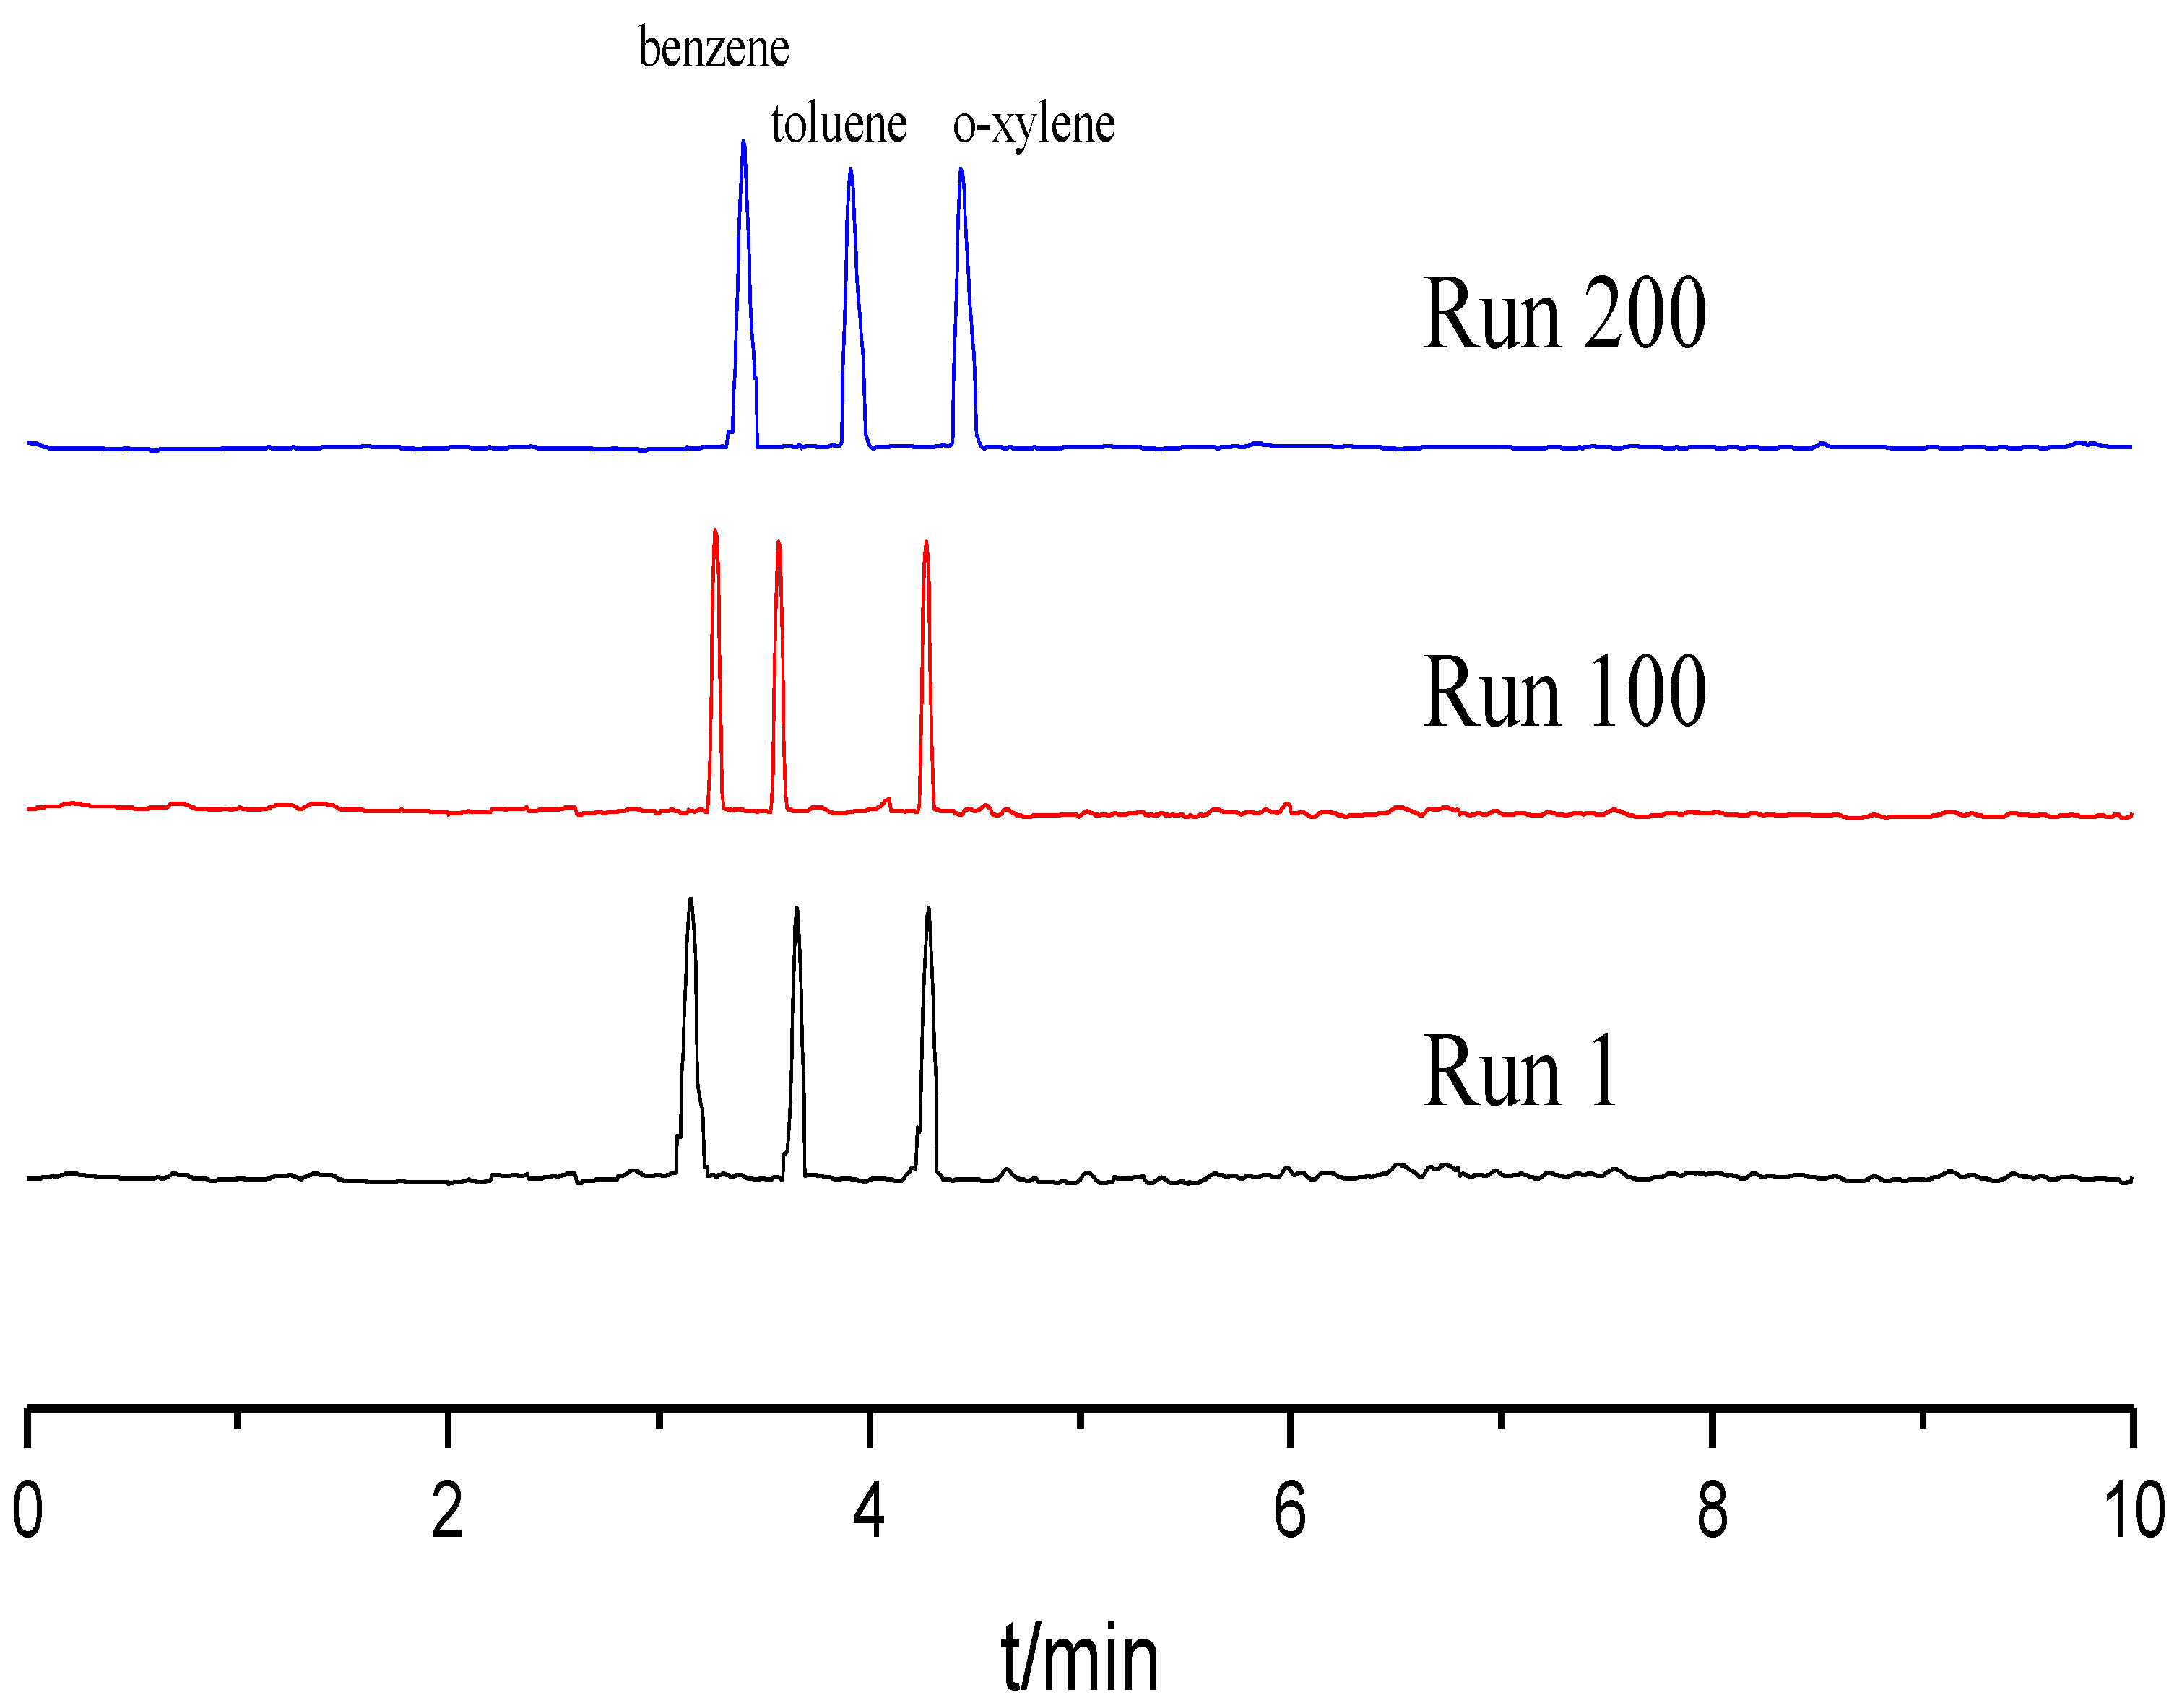
Reproducibility and stability of the TpBD COF immobilized capillary were evaluated in terms of the relative standard deviations (RSDs) of the column efficiency, retention time and resolution (Rs) using the mixture of benzene, toluene and o-xylene as the testing sample. All experiments were repeated 11 times. As shown in Table 1, the RSDs for run to run, day to day and column to column were less than 3.0%. Moreover, the column efficiency of the TpBD COF immobilized capillary did not obviously decrease over 200 runs (Figure 6). These results demonstrate that the TpBD COF immobilized capillary prepared have excellent reproducibility and stability.

Table 1.
Reproducibility and stability of the TpBD COF immobilized capillary.
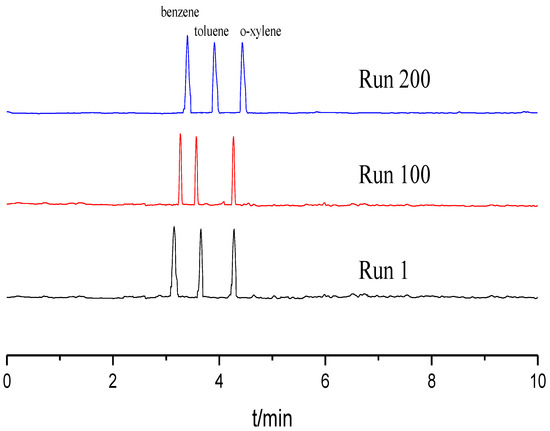
Figure 6.
Separation chromatograms for benzene, toluene and o-xylene with different runs. Experimental conditions: sample, 5.0 mg/mL benzene; 5.0 mg/mL the mixture solution of benzene, toluene and o-xylene; 20 mM of phosphate buffer solution; operating voltage, 15 kV; temperature, 20 °C.
3.2.3. Separation Performance
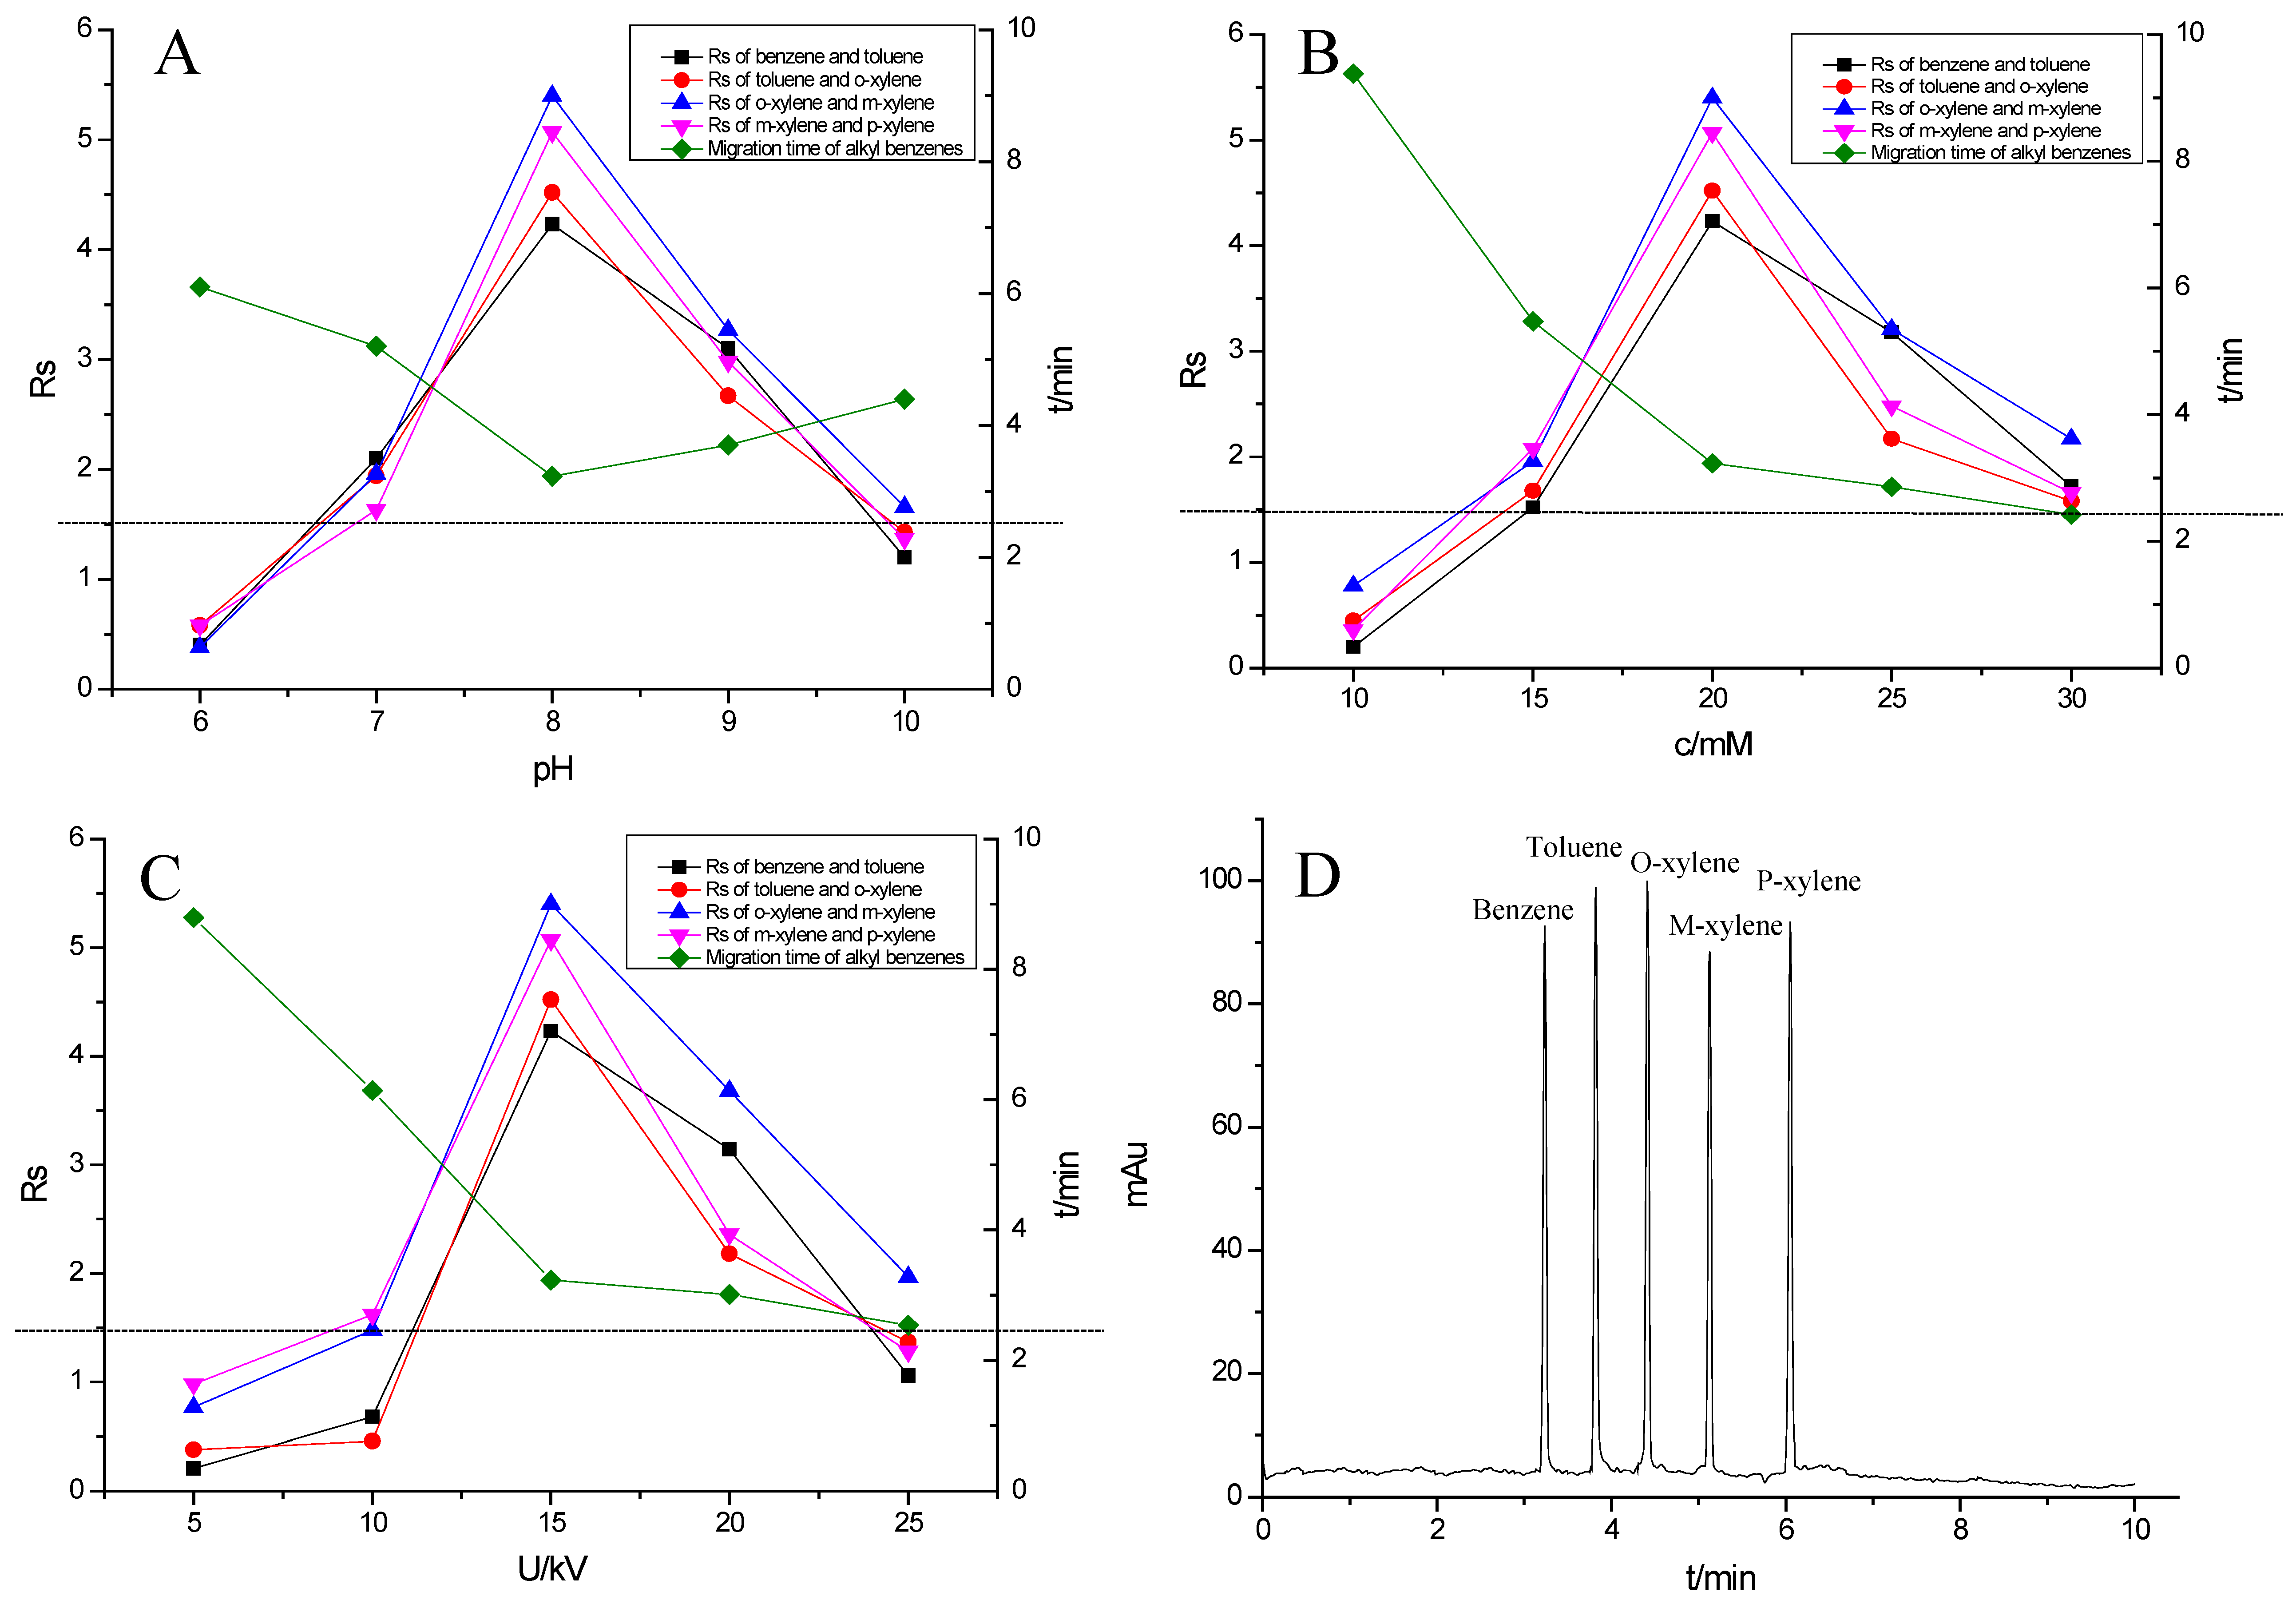
Alkyl benzenes (benzene, toluene, o-xylene, m-xylene and p-xylene) were used as analytes to investigate the separation performance of the TpBD COF immobilized capillary (Table 2). CEC conditions influencing their separation were investigated, including pH and concentration of buffer solution and operating voltage (Figure 7A–C). The results showed that the baseline separation (Rs > 1.5) of the analytes could be realized under the very broad experimental conditions. Under the optimal conditions of 20 mM phosphate buffer (pH = 8.0) and 15 kV operating voltage, all the analytes achieved the optimal baseline separation with a resolution of 4.68–9.30 and a separation coefficient (α) of 1.15–1.18 (Figure 7D and Table 2) [32]. The excellent separation performance was due to the hydrophobic interactions between the aromatic compounds and TpBD COF in the stationary phase on the inner wall of the capillary. The hydrophobicity of the aromatic compounds can be judged by the oil–water partition coefficient (log P) (Table 2). The greater log P means the stronger hydrophobic effect and the longer migration time. According to their log P values, the migration time for the analytes should follow the order of benzene < methylbenzene < o-xylene < m-xylene = pxylene. In addition, the molecular size and structure are the other main factors affecting the migration order. From Table 2, the molecular size of the five analytes is smaller than the pore size of the TpBD COF, so they can freely go in and out of the pores of the stationary phase. It should be noted that the molecular diameter of p-xylene is larger than that of m-xylene, leading to the last elution of p-xylene.
Table 2.
Basic information, resolution (Rs) and separation coefficient (α) of the alkyl benzenes.
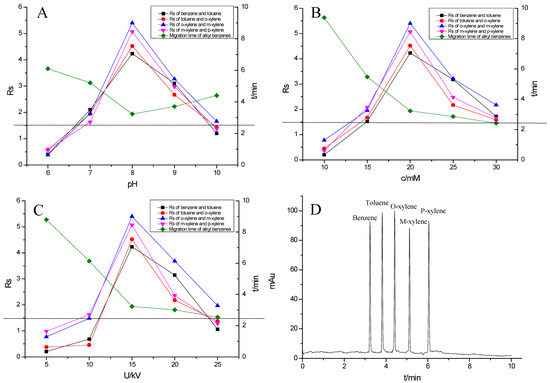
Figure 7.
Effect of experimental conditions on the separation of the alkyl benzenes: (A) pH, (B) buffer concentration, (C) operating voltage and (D) separation chromatogram of the alkyl benzenes on the TpBD COF immobilized capillary. Experimental conditions: sample, 5.0 mg·mL−1 mixture solution of alkyl benzenes; temperature, 20 °C.
3.3. Separation of the Small Molecular Compounds
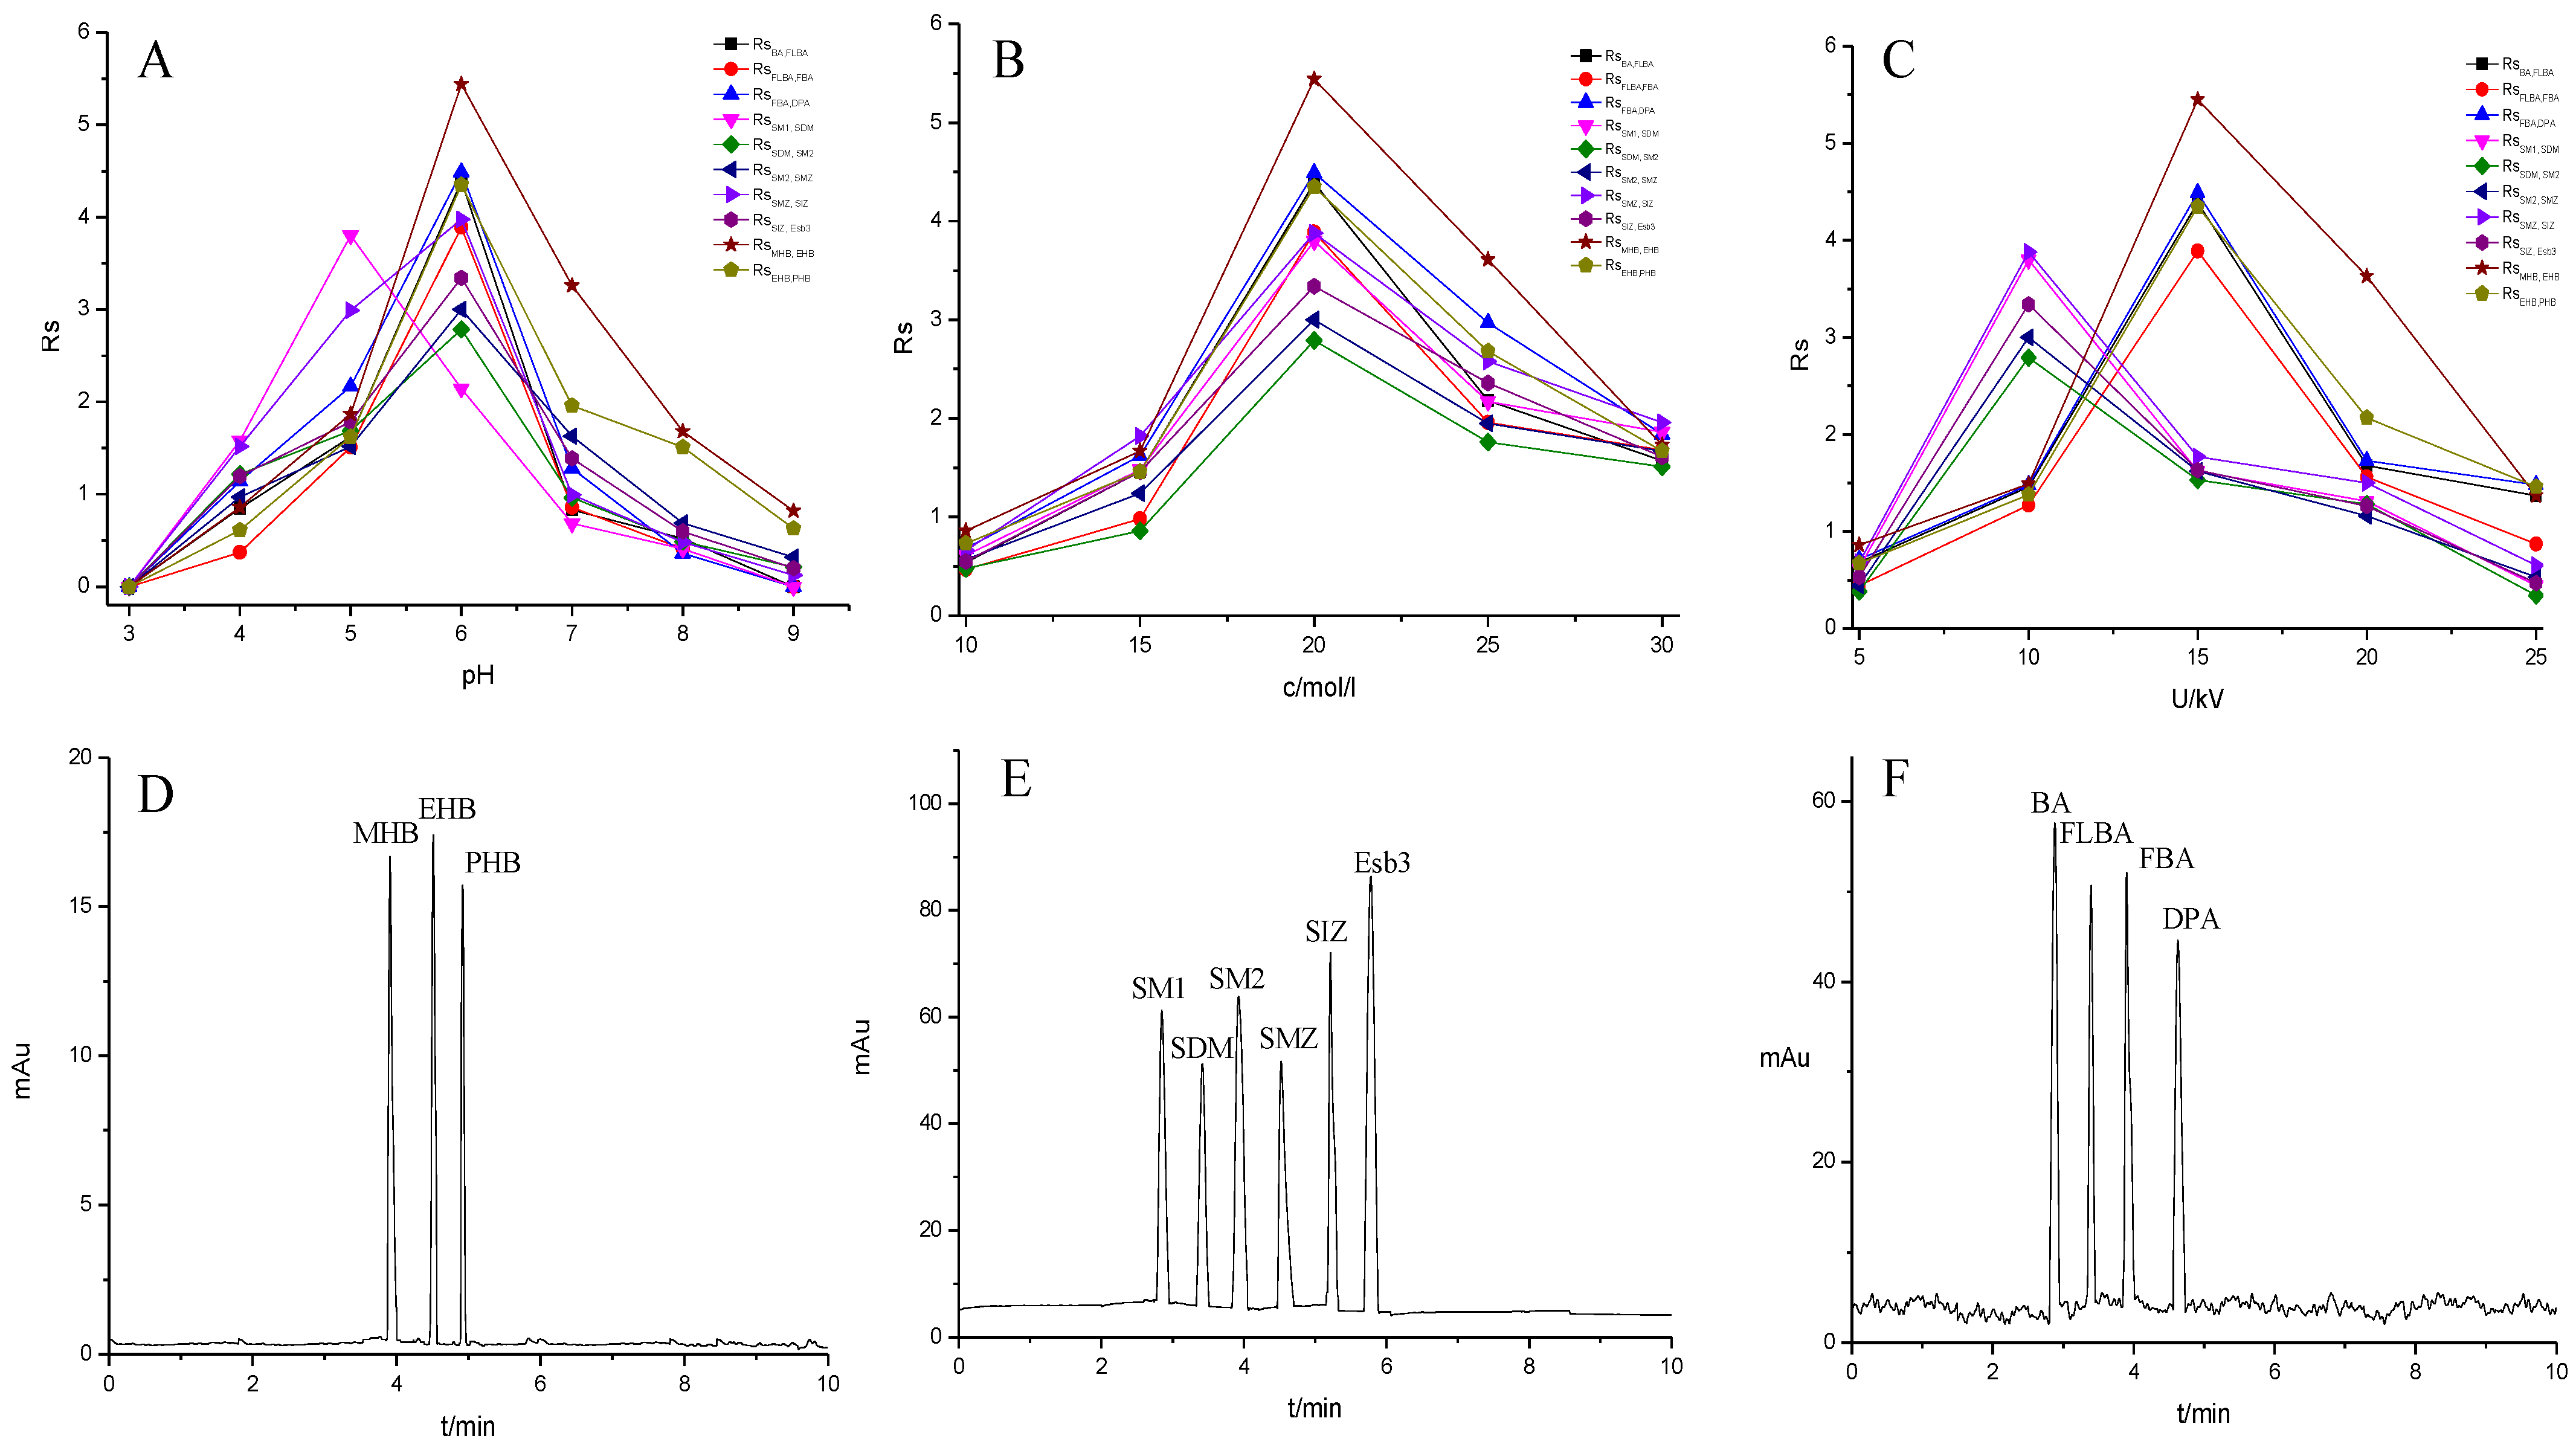
To further demonstrate the performance of the TpBD COF immobilized capillary, mixtures of neutral parabens (MHB, EHB and PHB), amphoteric sulfonamides (SM1, SDM, SM2, SMZ, SIZ and Esb3) and acidic benzoic acids (BA, FLBA, FBA and DPA) were analyzed (Table 3). The influence of pH and concentration of buffer solution and operating voltage on their separation were investigated (Figure 8A–C).
Table 3.
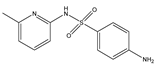
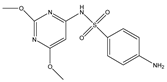
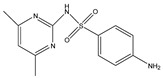
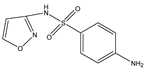
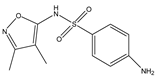
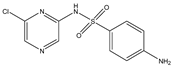
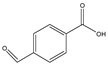
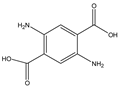
Structures, pka values, Rs and α of the small molecular compounds studied.
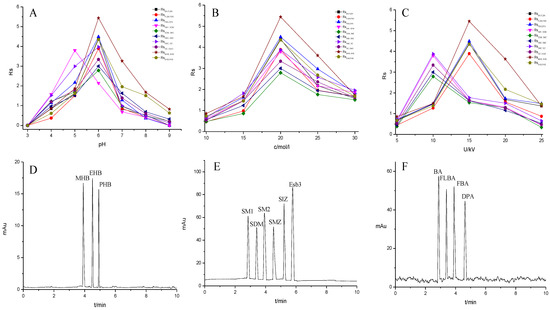
Figure 8.
Effect of experimental conditions on the separation of the small molecular compounds. (A) pH, (B) buffer concentration, (C) operating voltage and separation chromatograms for the analytes on the TpBD COF immobilized capillary: (D) parabens, (E) sulfonamides and (F) benzoic acids. Experimental conditions: temperature, 20 °C.
The pH of buffer solutions is a crucial parameter in CEC, which may influence the separation of the analytes through altering the mobility of charged analytes and the magnitude of EOF. The effect of buffer pH on separation was studied over the range from 3.0 to 9.0 (Figure 8A). The resolutions of all the analytes firstly increased and then decreased with the pH value increasing, and the maximum resolutions were reached at pH 6.0, except for that of SM1 and SDM at pH 5.0. These could result from the combined effect of hydrogen bonding or dipole–dipole, electrostatic interaction, π-π interaction and hydrophobic interaction between the analytes and the TpBD COF in the stationary phase [34]. In the case of the parabens and the sulfonamides, the hydrogen bond among the hydroxyl groups and the π-π interaction, the hydrophobic interaction among the benzene rings between the parabens and the stationary phase played a dominant role in their separation. Moreover, they were electroneutral in the pH range studied because the neutral parabens were unaffected by the change in pH. In addition, the sulfonamides were almost uncharged at the optimal pH 5.0 or 6.0 according to the formula in the Henderson–Hasselbalch equation for acids and bases [35]. So, their retention time mainly depended on the EOF. For the parabens, because their electrophoretic migration rate decreased and dipole–dipole interaction between the parabens and the stationary phase strengthened with the increased length of the alkyl chain in the order of MHB, EHB and PHB, the migration order of the parabens was MHB < EHB < PHB (Figure 8D). With respect to the sulfonamides, the difference in each interaction between them and the stationary phase also had a role in the migration order. For example, more hydrogen bonds formed by –O– of ester bonds and –N– of the pyrimidine ring in SDM than in SM1, which resulted in the elution of SDM followed by SM1. The migration order of the sulfonamides was SM1, SDM, SM2, SMZ, SIZ and Esb3, as shown in Figure 8E. It was noticeable that the longest retention time for Esb3 was due to the strong polarity of the chlorine element (Cl) on Esb3, which has a strong π-π interaction with the TpBD COF in the stationary phase [36].
In contrast to the two families of the analytes mentioned above, the benzoic acids mainly existed in the negative ion form (pH > pKa). Thus, electrostatic repulsion between them and the negatively charged stationary phase was predominant, which caused a shorter interaction time in the analytes and stationary phase. While the electrophoretic migration rate of the analytes was the opposite direction with the EOF, their interaction time lengthened. Both made the optimal interaction time between the analytes and the stationary phase exist, resulting in a best separation obtained at pH 6.0. The migration order of the benzoic acids was BA, FBLA, FBA and DPA (Figure 8F), which was consistent with the ascending order of their ionization constants calculated from their pKa values (4.19, 3.77, 3.27, 1.95) (Table 3).
The migration behavior of the analytes could be affected by the buffer concentration. The influence of phosphate buffers concentration on resolutions of the analytes were investigated in the range from 10 to 30 mM (Figure 8B). It was found that the resolutions of all analytes increased as the increase in the buffer concentration from 5 mM to 20 mM, and a further increase in buffer concentration from 20 mM to 30 mM resulted in an inferior separation. The reason may be that excessive Joule heating leads to higher electric current. Therefore, 20 mM phosphate buffer was chosen in the following experiment.
The effect of applied voltage on the migration time and resolution were investigated in the range 5–25 kV. The resolutions of all analytes showed the optimal values and the migration time shortened with applied voltage increasing (Figure 8C). And the resolutions of the parabens and the benzoic acids reached the maximum when the voltage was 15 kV. However, the sulfonamides showed the best resolution when the voltage was 10 kV. It might be caused by the generation of Joule heating and the enlargement of the EOF with the increase in applied voltage. In particular, the latter significantly affected the interaction time between the analytes and the stationary phase. Therefore, the operating voltage of 15 kV was applied for the separation of the parabens and the benzoic acids, and 10 kV was chosen for the sulfonamides.
Under the optimal CEC conditions, all the small molecular compounds achieved baseline separation. The column efficiencies, resolutions and separation coefficients were 23,696–28,642 plates/m, 2.79–5.45 and 1.09–1.20, respectively (Table 3).
3.4. Methodological Validation
A series of standard solutions for the parabens, the sulfonamides or the benzoic acids (1.0, 5.0, 10.0, 20.0, 40.0, 60.0, 80.0 and 100.0 mg/mL) were prepared and injected into the CEC system for separation and detection. A graph for linearity was plotted using the peak area (y) and the mass concentration (x, mg/mL) of each analyte for each standard solutions, and correlation coefficient (r2) and linear equations were obtained. A standard solution of 5 mg/mL was measured seven times under the optimal CEC conditions. The RSDs for the migration time and the peak area, limitation of detection (LOD) and limitation of quantitation (LOQ) were calculated [37]. It was obvious that the peak area had a good linear relationship with the concentration change in the range LOQ–100 mg/mL, the correlation coefficient and the LOD were 0.9916–0.9988 and 0.09–0.38 mg/mL, respectively. The RSDs for migration time and peak area were not more than 0.45% and 3.11%, respectively (Table 4).
Table 4.
Linear ranges, linear equation, LODs and the RSDs for the small molecular compounds.
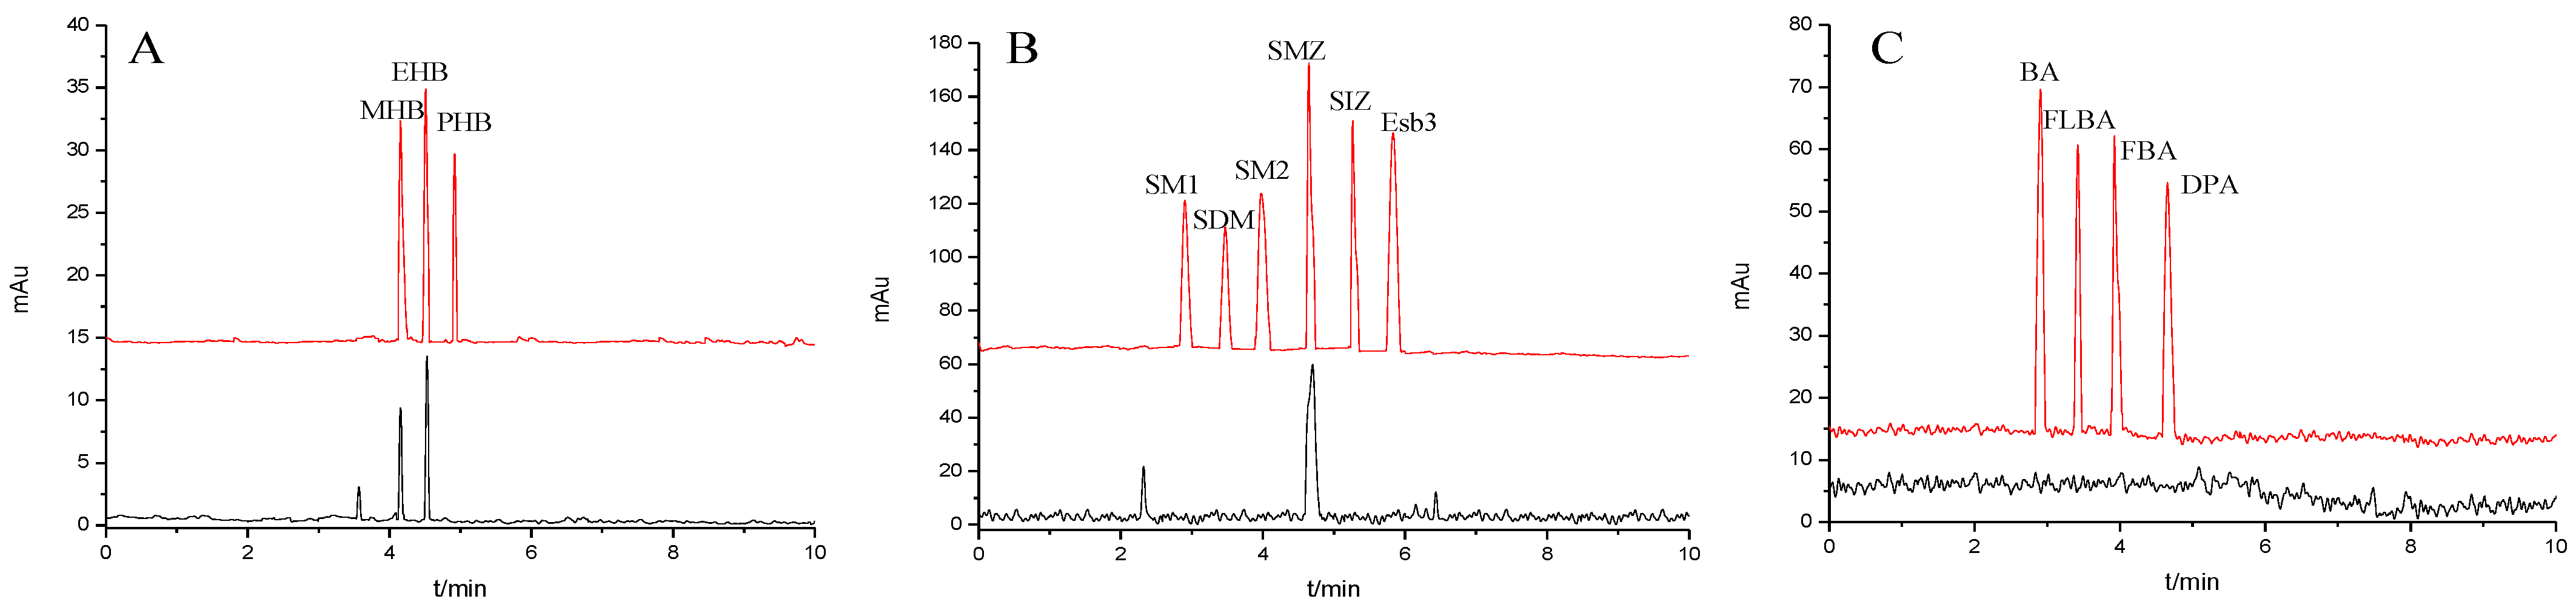
To validate the application of the method, the recoveries for the parabens, the sulfonamides or the benzoic acids were investigated by using the hand cream, the commercial sulfamethoxazole tablets or the drinking water samples spiked with their corresponding standard solutions at three different levels (1.0, 20.0 and 50.0 mg/mL). Sample solutions were prepared as described under section “Preparation of sample solution” and were analyzed in five replicates in the optimum CEC conditions (Table 5). The assay results showed that the average recoveries of all analytes were in the range 91.20–103.18% with RSD values below 1.24%. Contents of MHB (0.27 ± 0.03 %) and EHB (0.24 ± 0.04%) in the hand cream were obtained according to the linear equation, which met the Cosmetic Health Criterion requirements [38]. SMZ content (96.5 ± 2.25%) in the sulfamethoxazole tablets was agreed with that of the label claimed and also satisfied Chinese Pharmacopoeia (2020 edition) [38] and no benzoic acids were detected in the drinking water (Table 6). These results were in accordance with those of HPLC analysis [37,38,39], which indicated that the established method was accurate and reliable. The typical chromatograms for the samples before and after being spiked at 20.0 mg/mL were displayed in Figure 9A–C.
Table 5.
Recoveries and RSDs for the small molecular compounds investigated (n = 5).
Table 6.
Assay data for the practical samples.
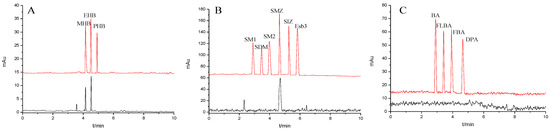
Figure 9.
Separation chromatograms for actual samples: (A) hand cream (black line) and spiked with 20.0 mg/mL the mixture standard solution of the parabens (red line), (B) sulfamethoxazole tablets (black line) and spiked with 20.0 mg/mL the mixture standard solution of the sulfonamides (red line) and (C) drinking water (black line) and spiked with 20.0 mg/mL the mixture standard solution of the benzoic acids (red line). Experimental conditions: 20 mM of phosphate buffer (pH = 6); operating voltage, 15 kV; temperature, 20 °C.
To evaluate the current method, it was compared with the previously reported analytical methods [33,38,39,40,41,42,43,44,45,46,47]. As shown in Table 7, the method in this work was found to be very rapid (baseline separation of the analytes studied within 6 min), simple (only phosphate buffer as separation media), sensitive and accurate (recovery rate 92.44–103.41%). Furthermore, the method did not use the toxic organic solvents. Of course, the performance and mechanism of the TpBD COF immobilized capillary needs to be further studied and explored to broaden its application field.
Table 7.
Comparison of the data from this work with those from the relevant studies.
4. Conclusions
In this work, a novel open tubular column immobilized with TpBD COF was prepared and characterized. The results confirmed the successful formation of TpBD COF by chemical bonding on the inner wall of the capillary. The capillary exhibited good electrochromatographic separation performance with respect to column efficiency, reproducibility and stability. The feasibility of the column for the separation of the families of the small molecular compounds with different structures and properties (neutral parabens, amphoteric sulfonamides and acidic benzoic acids) were demonstrated, which means a broad application prospect for TpBD COF in chromatographic separation fields. Furthermore, all the analytes investigated were completely baseline separated within 6 min under optimal conditions, which clearly shows the benefits of the combination of COFs and CEC.
Author Contributions
S.Q. and L.G. are responsible for the examination of the thesis topic and the arrangement of the entire experimental project; L.G. is responsible for the revision of the article language; Q.D., X.Z. and X.H. are responsible for the operation of the entire experiment, the writing of the first draft of the paper and the analysis of the data.; R.L. and H.C. are responsible for the use of the instrument. All authors have read and agreed to the published version of the manuscript.
Funding
We gratefully acknowledge the support from the Young Creative Program of the Fundamental Research Funds in Heilongjiang Provincial Universities (2020), Grant/Award Number: No. 135509206.
Institutional Review Board Statement
Not applicable.
Informed Consent Statement
Not applicable.
Data Availability Statement
The data presented in this study will be available on request from the corresponding author.
Conflicts of Interest
The authors declare no conflict of interest.
References
- Xie, S.M.; Yuan, L.M. Recent progress of chiral stationary phases for separation of enantiomers in gas chromatography. J. Sep. Sci. 2017, 40, 124–137. [Google Scholar] [CrossRef] [PubMed]
- Han, N.; Guo, X.; Cheng, J.; Liu, P.; Zhang, S.; Huang, S.; Rowles, M.; Fransaer, J.; Liu, S. Inhibiting in situ phase transition in Ruddlesden-Popper perovskite via tailoring bond hybridization and its application in oxygen permeation. Matter 2021, 4, 1720–1734. [Google Scholar] [CrossRef]
- Han, N.; Shen, Z.; Zhao, X.; Chen, R.; Thakur, V. Synthesis, characterization, and catalytic study of caffeine-derived n-heterocyclic carbene palladium complexes. Sci. Total Environ. 2022, 806, 151213. [Google Scholar] [CrossRef] [PubMed]
- Wei, Q.; Zhang, S.; Meng, B.; Han, N.; Zhu, Z.; Liu, S. Enhancing O2-permeability and CO2-tolerance of La2NiO4+δ membrane via internal ionic-path. Mater. Lett. 2018, 230, 161–165. [Google Scholar] [CrossRef]
- Gionfriddo, E. The Role of Microextraction Techniques in Facilitating Gas Chromatography Separation of Complex Mixtures. J. Lc Gc N. Am. 2021, 39, 13–15. [Google Scholar]
- Han, N.; Zhang, C.; Tan, X.; Wang, Z.; Kawi, S.; Liu, S. Re-evaluation of La0.6Sr0.4Co0.2Fe0.8O3-delta hollow fiber membranes for oxygen separation after long-term storage of five and ten years. J. Membr. Sci. 2019, 587, 117180. [Google Scholar] [CrossRef]
- Han, N.; Wang, S.; Yao, Z.; Zhang, W.; Zhang, X.; Zeng, L.; Chen, R. Superior three-dimensional perovskite catalyst for catalytic oxidation. EcoMat. 2020, 2, e12044. [Google Scholar] [CrossRef]
- Li, Y.; Wei, M.; Chen, T.; Zhu, N.; Ma, Y. Self-assembled cyclodextrin-modified gold nanoparticles on silica beads as stationary phase for chiral liquid chromatography and hydrophilic interaction chromatography. Talanta 2016, 160, 72–78. [Google Scholar] [CrossRef]
- Han, N.; Yao, Z.; Ye, H.; Zhang, C.; Liang, P.; Sun, H.; Wang, S.; Liu, S. Efficient removal of organic pollutants by ceramic hollow fibre supported composite catalyst. Sustain. Mater. Technol. 2019, 20, e00108. [Google Scholar] [CrossRef]
- Ping, G.; Hou, W.; Shi, Q.; Ding, H.; Gong, X.; Li, Z.; Xu, H. Preparation of monolithic silica and polymer capillary columns with ultrahigh column efficiencies and comparisons between van deemter plots of alkylbenzenes on these two kinds of columns. J. Chromatogr. Sci. 2021, 60, 7–15. [Google Scholar] [CrossRef]
- Szwed, K.; Ou, J.; Huang, G.; Lin, H.; Liu, Z.; Wang, H.; Zou, H. Preparation of cyclodextrin-modified monolithic hybrid columns for the fast enantioseparation of hydroxy acids in capillary liquid chromatography. J. Sep. Sci. 2016, 39, 1110. [Google Scholar] [CrossRef] [PubMed]
- Kong, D.; Bao, T.; Chen, Z. In situ synthesis of the imine-based covalent organic framework LZU1 on the inner walls of capillaries for electrochromatographic separation of nonsteroidal drugs and amino acids. Microchim. Acta. 2017, 184, 1169–1176. [Google Scholar] [CrossRef]
- Ning, H.; Ping, W.; Jiang, D. Covalent organic frameworks: A materials platform for structural and functional designs. Nat. Rev. Mater. 2016, 94, 1215–1231. [Google Scholar]
- Wang, R.; Wei, M.; Wang, Y. Secondary growth of covalent organic frameworks (COFs) on porous substrates for fast desalination. J. Membr. Sci. 2020, 604, 118090. [Google Scholar] [CrossRef]
- Wang, T.; Wu, H.; Zhao, S.; Zhang, W.; Wang, J. Interfacial polymerized and pore-variable covalent organic framework composite membrane for dye separation. Chem. Eng. J. 2019, 384, 123347. [Google Scholar] [CrossRef]
- Waller, P.J.; Gandara, F.; Yaghi, O.M. Chemistry of Covalent Organic Frameworks. Acc. Chem. Res. 2015, 48, 3053–3063. [Google Scholar] [CrossRef] [PubMed]
- Bao, T.; Tang, P.; Kong, D.; Mao, Z.; Chen, Z. Polydopamine-supported immobilization of covalent-organic framework-5 in capillary as stationary phase for electrochromatographic separation. J. Chromatogr. A 2016, 1445, 140–148. [Google Scholar] [CrossRef]
- Pan, C.; Wang, W.; Bao, T.; Chen, X. In situ rapid preparation of homochiral metal-organic framework coated column for open tubular capillary electrochromatography. J. Chromatogr. A 2016, 1427, 125–133. [Google Scholar] [CrossRef]
- Geng, K.; He, T.; Liu, R.; Dalapati, S.; Tan, K.T.; Li, Z.; Tao, S.; Gong, Y.; Jiang, Q.; Jiang, D. Covalent organic frameworks: Design, synthesis, and functions. Chem. Rev. 2020, 120, 8814–8933. [Google Scholar] [CrossRef]
- Wang, F.L.; Zhang, Y.L.; Wang, G.X.; Qi, S.D.; Lv, W.J.; Liu, J.J.; Chen, H.L.; Chen, X.G. Synthesis of a covalent organic framework with hydrazine linkages and its application in open-tubular capillary electrochromatography. J. Chromatogr. A 2022, 1661, 462681. [Google Scholar] [CrossRef]
- Niu, X.; Ding, S.; Wang, W.; Xu, Y.; Xu, Y.; Chen, H.; Chen, X. Separation of small organic molecules using covalent organic frameworks-LZU1 as stationary phase by open-tubular capillary electrochromatography. J. Chromatogr. A 2016, 1436, 109–117. [Google Scholar] [CrossRef] [PubMed]
- Wen, L.J.; Long, Q.; Yin, X.P.; Zang, W.T.; Dong, X.Y.; Liu, C.Y.; Pharmacry, S.O. Research progress on enantiomeric separations of drug by open tubular capillary electrochromatography. Guangzhou Chem. Ind. 2019, 47, 16–19. [Google Scholar]
- Wang, L.L.; Yang, C.X.; Yan, X.P. In situ growth of covalent organic framework shells on silica microspheres for application in liquid chromatography. Chempluschem 2017, 1487, 83–88. [Google Scholar] [CrossRef] [PubMed]
- Liu, J.M.; Wang, X.Z.; Zhao, C.Y.; Hao, J.L.; Fang, G.Z.; Wang, S.J. Fabrication of porous covalent organic frameworks as selective and advanced adsorbents for the on-line preconcentration of trace elements against the complex sample matrix. Hazard. Mater. 2018, 344, 220–229. [Google Scholar] [CrossRef] [PubMed]
- Li, Y.; Yang, C.X.; Yan, X.P. Controllable preparation of core–shell magnetic covalent-organic framework nanospheres for efficient adsorption and removal of bisphenols in aqueous solution. Chem. Commun. 2017, 53, 2511. [Google Scholar] [CrossRef]
- Li, L.L.; Liu, S.; Zhang, Q.; Hu, N.T.; Wei, L.M.; Yang, Z.; Wei, H. Advances in covalent organic frameworks. Acta Phys. Chim. Sin. 2017, 33, 1960–1977. [Google Scholar]
- Schio, L.; Datta, A. Salicylideneaniline-based covalent organic frameworks: A new family of multistate second-order nonlinear optical switches. J. Phys. Chem. C 2020, 124, 24451–24459. [Google Scholar]
- Yang, X.; Sun, X.; Feng, Z.; Du, Y.; Chen, J.; Ma, X.; Li, X. Open-tubular capillary electrochromatography with β-cyclodextrin-functionalized magnetic nanoparticles as stationary phase for enantioseparation of dansylated amino acids. Microchim. Acta 2019, 186, 1–8. [Google Scholar] [CrossRef]
- Yang, R.F.; Shi, Z.G.; Feng, Y.Q.; Da, S.L. Study on separation of sulfonamides by capillary high-performance liquid chromatography and electrochromatography. Yao Xue Xue Bao Acta Pharm. Sin. 2003, 38, 129–132. [Google Scholar]
- Memon, N.; Bhanger, M.I.; Khuhawer, M.Y. Determination of preservatives in cosmetics and food samples by micellar liquid chromatography. J. Sep. Sci. 2015, 28, 635–638. [Google Scholar] [CrossRef]
- Wang, X.; Ye, N. Recent advances in metal-organic frameworks and covalent organic frameworks for sample preparation and chromatographic analysis. Electrophoresis 2017, 38, 3059–3078. [Google Scholar] [CrossRef] [PubMed]
- Niu, X.; Lv, W.; Sun, Y.; Dai, H.; Chen, X. In situ fabrication of 3D COF-300 in a capillary for separation of aromatic compounds by open-tubular capillary electrochromatography. Microchim. Acta 2020, 187, 233. [Google Scholar] [CrossRef] [PubMed]
- Liu, L.; Meng, W.K.; Li, L.; Xu, G.J.; Wang, X.; Chen, L.Z.; Wang, M.L.; Lin, J.M.; Zhao, R.S. Facile room-temperature synthesis of a spherical mesoporous covalent organic framework for ultrasensitive solid-phase microextraction of phenols prior to gas chromatography-tandem mass spectrometry. Chem. Eng. J. 2019, 369, 920–927. [Google Scholar] [CrossRef]
- Dube, S.; Smith, R. Separation of sulfonamides by capillary electrochromatography. Chromatographia 2001, 53, 51–56. [Google Scholar] [CrossRef]
- Hou, J.; Yan, J.; Zhang, F.; Zhao, Q.; Chen, H.; Zhang, Y.; Li, G.; Li, Y.; Ding, L. Evaluation of intercalated α-zirconium phosphate as sorbent in separation and detection of sulfonamides in honey. Food Chem. 2014, 150, 58–64. [Google Scholar] [CrossRef]
- Qin, S.; Jin, F.; Gao, L.; Su, L.; Li, Y.; Han, S.; Wang, P.R. Determination of sulfamerazine in aquatic products by molecularly imprinted capillary electrochromatography. Soc. Open Sci. 2019, 6, 190119. [Google Scholar] [CrossRef] [Green Version]
- Technical Specification for Cosmetics Safety; Ministry of Health of the People’s Republic of China: Beijing, China, 2015.
- National Pharmacopoeia Commission. Pharmacopoeia of the People’s Republic of China; China Medical Science Press: Beijing, China, 2020. [Google Scholar]
- GB 2760-2014; National Food Safety Standards for the Use of Food Additives of the People’s Republic of China. National Health and Family Planning Commission: Beijing, China, 2014.
- Jian, C.; Yang, L.; Zhang, J.J.; Guo, C.; Feng, S.; Wu, Z.; Zhao, L. Separation of nine sulfonamides by capillary electrophoresis. Anal. Instrum. 2018, 3, 51–56. [Google Scholar]
- Li, S.; Tan, H.; Qi, K. Simultaneous separation of fluoroquinolones and sulfonamides by high performance capillary electrophoresis. China Feed 2008, 16, 36–39. [Google Scholar]
- Thompson, T.S.; Noot, D.K. Determination of sulfonamides in honey by liquid chromatography–tandem mass spectrometry. Anal. Chim. Acta 2005, 551, 168–176. [Google Scholar] [CrossRef]
- Gao, X.; Xu, K.; Chi, M.; Li, J.; Mu, J. Determination of four parabens in cosmetics by high-performance liquid chromatography with magnetic solid-phase and ionic dispersive liquid–liquid extraction. Rev. Anal. Chem. 2021, 40, 161–172. [Google Scholar] [CrossRef]
- Blanco, E.; Casais, M.; Mejuto, M.; Cela, R. Simultaneous determination of p-hydroxybenzoic acid and parabens by capillary electrophoresis with improved sensitivity in nonaqueous media. Electrophoresis 2010, 29, 3229–3238. [Google Scholar] [CrossRef] [PubMed]
- Nogami, C.; Sawada, H. Positional and geometrical anionic isomer separations by capillary electrophoresis-electrospray ionization-mass spectrometry. Electrophoresis 2010, 26, 1406–1411. [Google Scholar] [CrossRef] [PubMed]
- Wang, L.; Zhou, Y.; Zheng, Y.; Zhang, Y.; Dandan, L.I.; Hua, X.; Customs, L. Simultaneous determination of 5 food additives in beverage by high performance liquid chromatography(HPLC). Farm Prod. Processing 2019, 22, 50–54. [Google Scholar]
- Feng, H.E.; Hui, Y.U.; Yin, T.T. Rapid programmed temperature gas chromatography for simultaneous determination of six common preservatives in vinegar sample. China Condiment 2010, 35, 108–110. [Google Scholar]


Publisher’s Note: MDPI stays neutral with regard to jurisdictional claims in published maps and institutional affiliations. |
© 2022 by the authors. Licensee MDPI, Basel, Switzerland. This article is an open access article distributed under the terms and conditions of the Creative Commons Attribution (CC BY) license (https://creativecommons.org/licenses/by/4.0/).