1. Introduction
Climate change effects and the continuous rise in global greenhouse gas emissions have prompted the unprecedented increase in the development of renewable energy-based technologies [
1]. İn recent years, scholars have focused on the development and application of different renewable energy sources such as wind [
2], solar [
3], geothermal [
4], biomass [
5], etc. to meet different energy demands. Bioenergy is the largest renewable energy source today providing heat, electricity, and fuel for transport vehicles. Biomass power has the potential to greatly reduce emissions from electricity generating systems by providing a stable source of low carbon baseload electricity [
6]. Anaerobic digestion (AD) is a process whereby microorganisms break down biomass in the absence of oxygen. This process produces biogas, which can be burnt in power generation devices to generate electricity or to provide heat. AD is a well-established treatment option for treating feedstocks such as sewage sludge, agricultural residues, and an organic fraction of municipal solid waste [
7]. It stabilizes the sludge into reusable biosolids which are processed to generate a methane-rich biogas fuel (around 60% methane and 40% carbon dioxide) [
8]. AD for biogas production involves four processes called hydrolysis, acidogenesis, acetogenesis, and methananogenesis. Hydrolysis breaks down polymers like cellulose, starch, and proteins into monomers by exoenzymes [
9]. Acetate, H
2, CO
2, and volatile fatty acids (VFA) are produced during acidogenesis while acetogenesis produces acetic acid. The final process, methanogenesis runs parallel to the third to transform the CO
2 and H
2 into methane [
10].
Animal waste as a substrate for AD remains a popular choice due to its high buffering capacity and its richness in many nutrients necessary for bacterial growth. The high carbohydrate content in some food waste also makes them prime candidates as the substrate for biogas production. The co-digestion of the combination of both substrates has the potential to increase efficiency and provide a better nutrient balance of the produced biogas [
11]. Prajapati et al. [
12] performed experiments on the anaerobic co-digestion of wheat straw (WS), organic fraction of municipal solid waste (OFMSW), and mung bean husk (MBH) at five mixing ratios. They found that when the mixture ratio of OFMSW: WS: MBH is 25:5:70, the methane yield increases in comparison to the mono-digestion of each of the substrates. The methane yield increased by 37%, 20%, and 4% in comparison to the OFMSW, WS, and MBH mono-digestion respectively.
Microturbines are suitable electricity generation engines when utilizing biogas as fuel. They possess certain properties which make them able to function by burning a variety of fuels such as landfill gas, digester gas, and coal mine methane [
13]. The exhaust heat from the microturbines is usable for a couple of other purposes such as cooling, heating, and additional power generation. Organic Rankine cycles (ORC) which operate at temperatures ranging from 90 °C to 300 °C can make use of this exhaust heat to supplement the electricity generation. ORC’s have been subjected to numerous studies since they first appeared in the 1970s. Major suppliers like Turboden and ORMAT have produced commercial ORC units ranging from 10 kW to 5000 kW with a lot more systems from several other manufacturers under development. The operation of the ORC is similar to the steam Rankine cycles; the major difference being the working fluid. Popular fluids that are employed in ORCs include butane, R234fa, pentane, R11, R22, methane. These fluids can operate with a low energy heat source such as geothermal, biomass, solar, and waste heat due to their favorable properties.
Kamyar Darvish et al. [
14] conducted a study on optimum working fluid selection for ORC systems based on exergy and exergoeconomic analysis. They compared 9 different working fluids using exergy efficiency and cost rate of electricity as objective functions for system optimization. R134a and isobutene exhibited the highest performance with both fluids having 19.6% and 20.3% exergy efficiencies respectively. Besides, the cost of electricity of the R134a working fluid system varied from 0.08 USD/kWh to 0.12 USD/kWh. Kontokostas and Goulos [
15] researched the techno-economic assessment of biogas-powered gas turbine cogeneration cycles. They investigated the influence of gas turbine technology level on the economic sustainability of gas turbine plants utilizing AD products of animal manure and energy crops. Their modeling methods examined the biogas fuel yield, thermodynamic evaluation of cogenerated gas turbine cycles, exergy analysis, and economic evaluation of power plant operation. Their results showed that the performance of the recuperator is the most important variable affecting the system’s electrical performance. They also showed that optimizing the cogenerated cycle for maximum electrical power output is paramount in securing investment sustainability. They concluded that the AD of animal manure and energy crops to produce biogas can constitute a sustainable investment especially in large systems where substantial volumes of substrates are available. Yağli et al. [
16] performed a comparative analysis of subcritical and supercritical ORC powered by waste heat from biogas-fueled CHP engine. The supercritical cycles gave better performance displaying an exergy efficiency of up to 27.76% compared to the 27.2% from the subcritical systems.
Many studies exist in literature about electricity generation using biogas obtained from the co-digestion of food and animal waste. Some of this research included a comparative analysis that was conducted by Banja et al. [
17] on a comparative analysis of dynamism of biogas electricity markets in EU. Another study explored the co-digestion of anaerobic processes by various wastes containing high levels of organic matter and indicate the synergistic effect of co-digestion with cattle manure [
18]. However, due to the need for the renewable-based system, there is a need for more research that explores and compares different renewable energy sources for the generation of electricity, cooling, and other useful products. Furthermore, it has been explained in literature that the stability of anaerobic co-digestion is enhanced by utilizing food and animal waste because of a better carbon to Nitrogen (C/N) balance [
19]. Furthermore, due to an improved buffer ability, co-digestion can mitigate the inhibitory effect of high ammonia and sulfide concentrations, resulting in more stable biogas output [
20]. A study by Oladejo et al. [
21] stated that food waste is highly perishable, containing large amounts of volatile fatty acids (VFAs) and ammonium compounds, which, when accumulated, can impair microbial activity and digestion rate when it is digested alone. Their study went further to explain that animal, lignocelluloses, and sewage sludge are often co-digested with food waste to help dilute toxic compounds, improve nutrient balance, and enhance microbial processes. The progress in experimentations involving biogas production from co-digestion of food and animal waste inspired the implementation of their products for electricity generation as modeled in this study. Therefore, in this study, a multigeneration system that is based on the anaerobic co-digestion of different biomass sources is studied thermodynamically for the production of electricity, hot water, and cooling. To the best of the knowledge of the authors, there is not any study that has offered a comparative analysis of electricity generation utilizing biogas from different co-substrate combinations. This study, therefore, aims to provide a performance analysis that will cover both energetic and exergetic aspects of biogas electricity generation from food and animal waste. The biogas yield from three different previous studies conducted on co-digestion of different food and animal wastes will be used to model a combined system made up of a microturbine unit and an ORC powered by the biogas. For each substrate combination, the amount of substrate needed to provide the right amount of biogas for the system will then be determined. The optimum mass flow rate and methane content for each co-substrates used are also investigated. In the comprehensive thermodynamic analysis presented in this study, the multigeneration, co-generation, and power energy/exergy efficiencies of the system developed are also analyzed in accordance with literature [
2,
22] to further justify the viability of this system.
2. Systems Modeling
The biogas utilized in this multigeneration system is according to research on co-digestion of poultry manure and food waste which was studied by Yusof et al. [
15], co-digestion of cattle manure and food waste as studied by Zhang et al. [
16], and co-digestion of swine manure and corn straw, also studied by Mao et al. [
11].
Figure 1 shows the proposed biogas powered multigeneration system. Yusof et al. in their study optimized the generation of bio-methane. The characteristics of PM used in the study based on TSS, VSS, and pH were 90,100 mg/L, 48,500 mg/L, and 8.25. The maximum predicted methane yield was discovered to be 535.82 mL CH4/g. Zhang et al. studied the anaerobic co-digestion of food waste and cattle manure. The outcome of the batch and semi-continuous tests demonstrated that the total methane creation is upgraded in co-digestion with an optimum food waste (FW) to cattle manure (CM) proportion of 2. At this proportion, the total methane creation in batch tests in their study was improved by 41.1%, and the relating methane yield was 388 mL/g-VS. In the semi-continuous mode, the all-out methane creation in co-digestion, at the organic loading rate (OLR) of 10 g-VSFW/L/d, expanded by 55.2%, compared to the methane yield of 317 mL/g-VS. Mao et al. in their experiment assessed the procedure execution concentrating on beginning pH and substrate synthesis; the impacts of initial pH and swine manure to corn straw proportion on biogas creation and these parameters and linkages of these parameters were additionally analyzed. The outcomes uncovered that the maximum methane yield and methane creation rate were achieved with initial pH 7.5 and SM/CS proportion of 70:30. The optimum initial pH and SM/CS proportion were 7.15 and 0.62, separately, with an anticipated maximum methane substance of 55.12%. A summary of the experimental factors and results obtained in all 3 studies is presented in
Table 1.
The variables that will be analyzed in the results are the fuel mass flow rate, the LHV of the biogas, the daily substrate amount, the energy efficiency, the exergy efficiency, and the exergy destruction rate. The fuel mass flow rate and LHV will help to determine the input heat that the system will produce which will be used to obtain the specified result (the 1200 kW power output of the system). The daily substrate amount will give the required volatile solid amount of each substrate considered. The efficiency variables will also reveal the performance of the system and the exergy destruction rates will indicate where system improvement measures can be centered.
The substrate for digestion (state 1) is poured into the biogas digester to begin the process. The digestate (state 2) that is left behind after digestion is collected to be used as fertilizers. The biogas obtained from the digestion (state 3) is then passed into the combustion chamber of the microturbine engine. A stream of air collected from the atmosphere (state 4) is compressed in the air compressor of the engine and then the high-pressure air (state 5) is passed through a recuperator which enables heat exchange between the air and the high-temperature gas leaving the turbine of the microturbine engine. The emerging air (state 6), now at a higher temperature, is then passed into the combustion chamber where it mixes with biogas before combustion. After the combustion, the flue gas (state 7) which is now at a very high temperature (>900 °C) and high pressure will pass through the micro-gas turbine. The resultant rotational work from the turbine is used to generate electricity with the aid of generator 1. The flue gas then leaves the turbine (state 8), at a reduced temperature and pressure, and then passes through the recuperator. Here, it loses heat which is then gained by the compressed air (state 5) flowing through the recuperator. The specific heat content of biogas is lower than that of natural gas meaning a higher flow rate of biogas will be needed for the same combustion heat output [
17]. Microturbines make use of a recuperator at the turbine exhaust to increase the temperature of the combustor inlet air. The hot turbine exhaust gas (around 650 °C) is used to preheat the compressed air (around 150 °C) to reduce the heat required to increase the temperature of the compressed air to the turbine inlet temperature. This helps to increase their efficiency which is normally much lower compared to other cycles. They operate at high rotational speeds, often reaching 60,000 revolutions per minute (rpm) [
8,
18].
The flue gas exiting the recuperator (state 9) will still possess a considerable amount of thermal energy as a result of its temperature. This energy can be recovered and used for other purposes. In the present study, the heat recovery steam generator (HRSG) is used to recover the heat from the flue gas at state 9 and this heat is used in the bottoming organic Rankine cycle (ORC). The ORC working fluid (N-Pentane) will gain the heat lost by the flue gas in the HRSG and emerge as a superheated vapor (state 13) which is then passed through the ORC turbine. The expansion of the N-Pentane in the turbine causes it to rotate and this rotational energy is also converted to electricity by generator 2. The fluid leaving the ORC turbine (state 14) will then flow into the condenser. The saturated liquid (state 11) leaving the condenser is pumped to the upper-pressure level of the ORC, and this high-pressure fluid (state 12) will be passed into the HRSG to complete the cycle. The condensation is done with the aid of water (state 15) and the heat removed from the condenser is used by the biogas digester. The micro-gas turbine engine employed in this study is based on the commercially available Capstone C1000-kW unit [
19,
20,
21] while the ORC is based on the commercially available ORMAT 200 kW ORC system [
22,
23].
The flue gas leaving the HRSG (state 10) is then passed to the generator of the absorption chiller. The generator-absorber exchange (GAX) absorption chiller is employed in this study. They operate on ammonia-water working fluid pair and pass the heat rejected in the absorber to aid the working fluid pair separation in the generator. This way, the coefficient of performance (COP) will be increased compared to the simple ammonia-water single-effect absorption chiller. Another advantage of the GAX system is its reduced size as it will not require a solution heat exchanger between the generator and the absorber. When the incoming working fluid mixture (state 23) is separated in the generator, the absorbent water (state 24) flows back into the absorber after its pressure has been reduced to that of the absorber (state 25). The refrigerant ammonia (state 26) is passed into the rectifier where the refrigerant is further separated to remove any traces of water left. The pure refrigerant is then condensed and flashed into the evaporator (state 31) where the cooling effect occurs. The absorbent and the refrigerant are then mixed again in the absorber as it cools, and the cycle can start again. Lastly, the remaining energy of the flue gas (state 17) is used in a water heater to raise the temperature of water at ambient temperature (state 19) to about 60 °C (state 20).
3. Thermodynamic Modeling
The volume flow rate of the produced biogas can be determined using:
where
is the mass flow of the biogas and
signifies the biogas density. The quantity of the substrate in the bioreactor is then found using:
where
is the biogas yield of the bioreactor.
The mass, energy, and exergy balance equations utilized in analyzing the system are presented here. The governing equations for mass conservation are:
The first law of thermodynamics gives the energy balance of each component of the whole system as:
The energy from the combustion of the biogas is derived using:
where
and
,
, &
represent the enthalpy of the reactants, the enthalpy of the products, and the molar mass of the biogas respectively,
The complete combustion of the biogas-air mixture to giving out the combustion gases is based on the following equation:
where
denotes the molar air-fuel ratio and
n represents the molar fraction of each combustion product.
The exergy balance equation can be written as:
The total exergy rate of each component is calculated using the equation:
where
is the specific physical exergy and
represents the specific chemical exergy.
for the water, organic streams, and biogas streams are determined respectively using:
The specific chemical exergies of the organic streams are calculated using the model of Song et al. [
24]
where
C,
H,
O,
N,
S, and
A determine the organic content of the substances, which are carbon, hydrogen, oxygen, nitrogen, sulfur, and ash, respectively.
And the specific chemical exergy of the biogas streams was computed using [
25]:
where
is the universal gas constant and
, the gas constant of the biogas is derived using:
The exergy destruction for each state point is defined as:
The energy performance of the power cycles, the cogeneration cycles, and the multigeneration system are defined in accordance with literature [
22,
26] as:
Likewise, the exergy performances of the systems are calculated using:
The thermodynamic modeling of the system was implemented using the Engineering Equation Solver (EES) software [
27] based on the input parameters of the CHP system shown in
Table 1. The following assumptions are considered in the energy and exergy analyses of the system:
The operation of the system is assumed to be in a steady state.
Pressure changes in the system besides in the pumps, valves, compressors, and turbines are neglected.
Complete combustion at 90% is assumed to take place in the combustion chamber.
The reference state temperature and pressure are 25 °C and 100 kPa respectively.
Both the ambient air and the exhaust gases are considered to be a mixture of ideal gases.
The operating conditions for all processes in the system are listed in
Table 2. The design parameters of the individual components in the CHP system are from specifications provided by the manufacturers.
The equations for the energy and exergy balance for each component of the multigeneration system are presented in
Table 3.
4. Results and Conclusions
In this study, the thermodynamic modeling of the multigeneration system was performed using the design specifications of the microturbine and ORC units given in
Table 2 and the energetic and exergetic modeling equations presented in the preceding section. In this section, the results from the thermodynamic modeling of the CHP system is discussed extensively. From the simulation outputs, the thermodynamics properties of each state of the system are tabulated in
Table 4. The simulation summary of the CHP system is presented in
Table 5. This performance is calculated with the thermodynamic properties (temperature, pressure, enthalpy, mass flowrate, exergy, etc.) presented in
Table 6.
The LHV of the biogas is 17,683 (kJ/kg) which yields combustion energy of 3864 kW. An air-fuel ratio of 35.53 is needed to aid the combustion and to ensure a suitable turbine inlet temperature (TIT) is obtained. The air-fuel ratio is an important parameter in the operation of gas engines. Excessively high or low air-fuel ratios can lead to problems such as low efficiency and high pollutant emissions. The compression work is 1253 kW while the gas turbine produces an output of 2637 kW. The back-work ratio indicates how much of the turbine output is used to drive the compressor and in this system, almost 50% of the turbine output is used by the compressor. In
Table 5, it can also be seen that for the Capstone C-65 micro-gas turbine engine to be powered by biogas (assuming 60% methane content), 0.181 kg/s of the biogas must be fed into the combustion chamber. Using this in Equation (1), together with the density of the biogas (also displayed in
Table 4) will give the volume of the biogas produced daily. The amount of the volatile solids of the substrates of each of the 4 biogas types can then be determined using Equation (2) and the biogas yield values presented in
Table 1.
Figure 2 shows the comparison of the biogas yield of each of the biogas types as reported in
Table 1 and also the comparison of the substrate amount of each of the 3 biogas types needed to produce the biogas to power the multigeneration system. Biogas-C will require the most amount of substrates due to its low yield while Biogas-B will require the least amount of substrates to produce the needed biogas to power the system.
Table 6 shows the performance results of the multigeneration system. The energy and exergy efficiencies of the system modeled in this study improve significantly from 41.50 and 39.72% when generating electricity only to 76.44 and 42.92% when trigeneration power, cooling, and hot water. This further shows the importance of integrating other subsystems with the power cycle to maximize the renewable energy contained within the system. In a broader perspective, this integration will have a positive effect on global carbon emission reduction as the renewable energy source used is maximized.
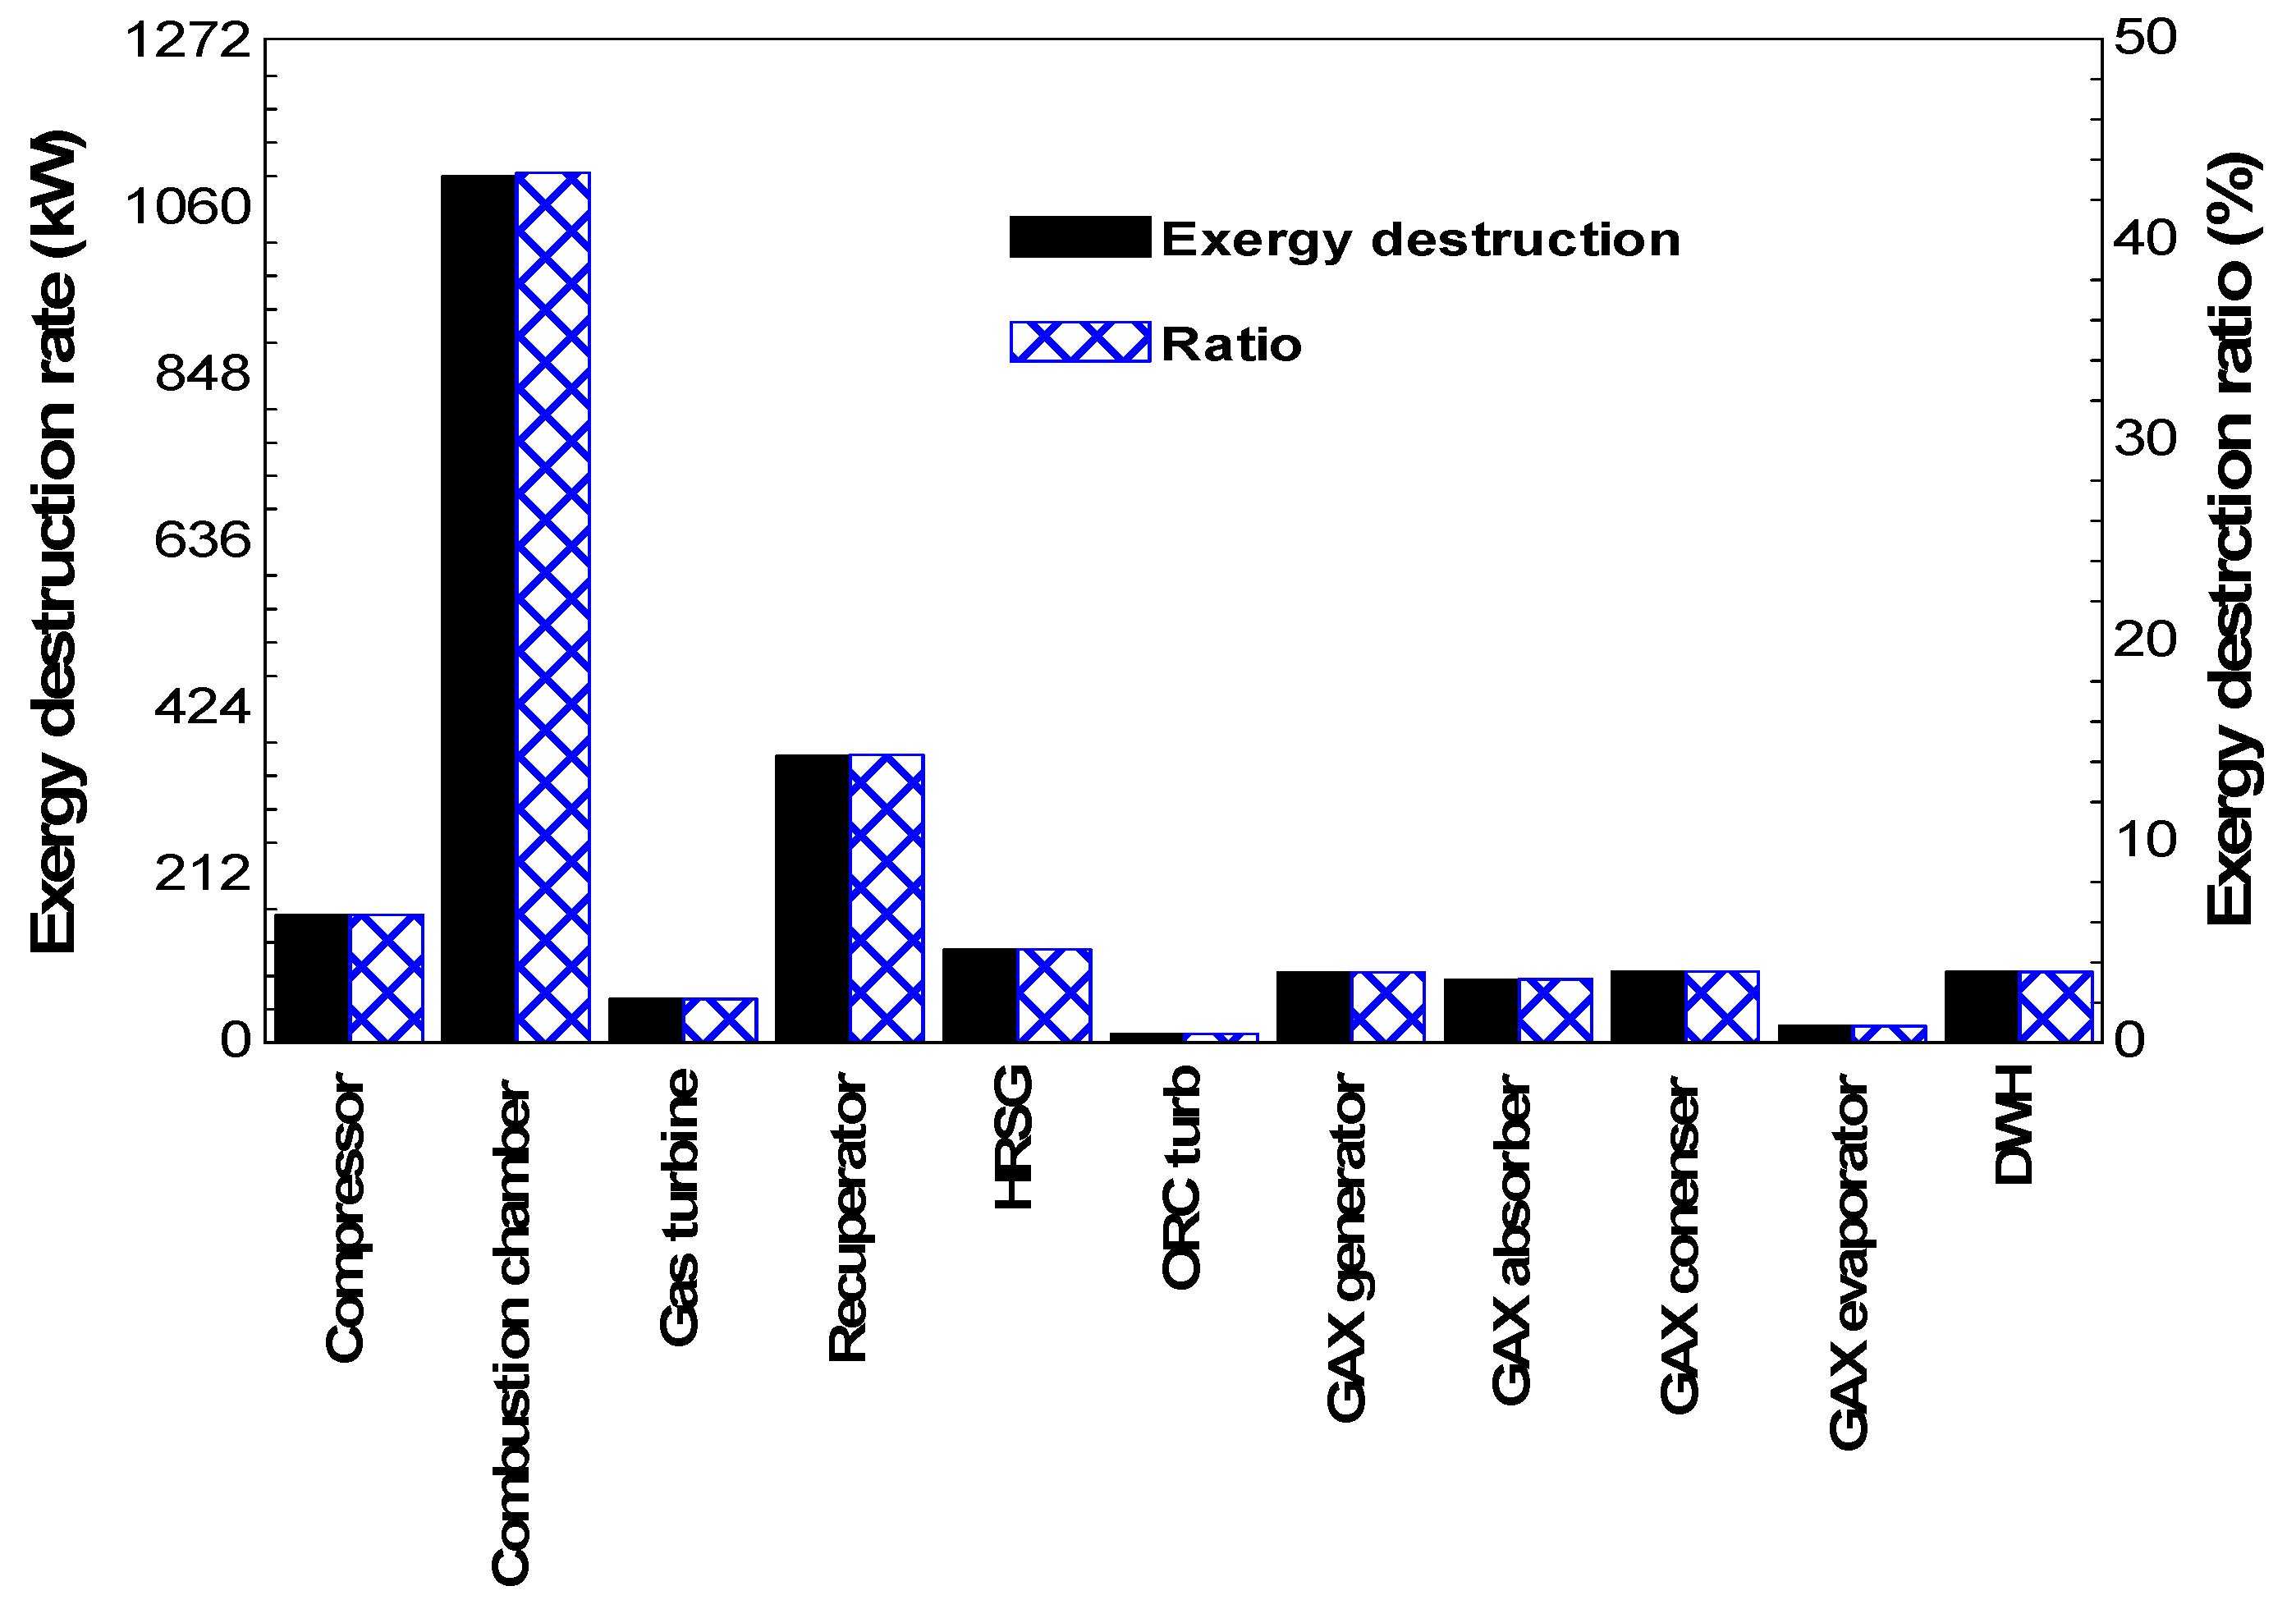
According to
Figure 3, the majority of the exergy destruction (45%) occurs in the combustion chamber of the system followed by the recuperator (16%). This is mainly due to the irreversible chemical combustion reactions and significant heat and mass transfer during the combustion processes.
Table 6 shows the performance results of the multigeneration system. The energy and exergy efficiencies of the system modeled in this study improve significantly from 41.50 and 39.72% when generating electricity only to 76.44 and 42.92% when trigenerating power
4.1. Effect of the Methane Content of the Biogas on the System
The methane content has a direct effect on the LHV of the biogas and this is shown in
Figure 4 where varying the methane content of the biogas results in a change in its LHV. For an increase in the methane content from 40% to 70% (the average range for biogas), the LHV of the biogas increases from 9789 kJ/kg to 23,085 kJ/kg. In the operation of the CHP system, this will also have an impact on the mass flow rate of the biogas needed for combustion.
Figure 4 also shows that the mass flow rate of the biogas needed to maintain the same amount of electricity generation reduces from 0.4 kg/s to 0.17 kg/s. When the methane content is low, more fuel will be required for the biogas combustion because of the decrease in the LHV of the fuel.
As the change in the methane content of the biogas affects the mass flow rate, it makes sense that the substrate amount required to produce the biogas in the biodigester will also vary for each biogas type. The effect of the biogas methane content on the substrate amount is shown in
Figure 5 where the substrate amounts at 40% methane content are 55.58, 52.46, and 129.7 tons-VS/day for biogas A-C respectively. At 70% methane content, the substrate amounts for each biogas type reduces to 29.61, 27.95, and 69.12 tons-VS/day for biogas A-C respectively. This shows that the methane content of the biogas is a huge factor when designing a biogas-powered system.
To check the sensitivity of the system, the effect of the biogas methane content on the energetic and the exergetic performance of the system is analyzed (
Figure 6). As the methane content of the biogas constituent increases, the energy and exergy performance decreases. However, it is noteworthy from these two figures that the reduction in the efficiencies (especially energy efficiency) is minimal and this shows that the model system is adaptable to different operating conditions. This further shows that this system will have a good performance considering the biomass sources used in this study and other biomass energy sources in literature.
4.2. Effect of Recuperator Efficiency on the System
The importance of the recuperator to the operation and performance of the microturbine and the CHP system in
Figure 7,
Figure 8,
Figure 9 and
Figure 10. In
Figure 7, the effectiveness of the recuperator increasing from 65% to 100% is shown to increase the combustor inlet air temperature (CIAT) from 490 °C to 630 °C. The impact of this on the system is also shown in
Figure 7 where the biogas mass flow rate reduces with this change in recuperator effectiveness. The heat transfer in the recuperator increases the CIAT, therefore reducing the fuel flow required to achieve the design turbine inlet temperature (920 °C) for a given air mass flow. This means that the mass flow rate of the biogas will be reduced as shown in
Figure 7, reducing from 0.03 kg/s to 0.021 kg/s.
Figure 8 shows that the substrate amount for each biogas type will also be affected by the performance of the recuperator. As the mass flow rate of the biogas passed into the combustion chamber reduces, the substrate amounts also reduce because they are directly proportional; as explained earlier.
Figure 9 shows the effect of the recuperator’s effectiveness on the exergetic destruction of the combustion chamber and the overall system. An increase in the recuperator effectiveness means there will be improved utilization of the input exergy available to the system. In
Figure 10, the energetic and exergetic efficiencies of all the sub-systems and the overall multigeneration system increase as the recuperator efficiency increases. This is in line with the reduction in the exergy destruction in the multigeneration system encountered as a result of improved utilization of the input exergy.
4.3. Effect of Ambient Temperature on the System
The ambient temperature affects both the enegetic and exertetic performance of the CHP system. The increase in ambient temperature will lead to an increase in the air density which will, in turn, reduce the volume of air per unit area. In
Figure 11, this is shown to affect the compression work done by the system. As the ambient temperature increases from 5 °C to 40 °C, the compression work increases from 1170 kW to 1316 kW. The density of the biogas will also increase as a result of the increase in ambient temperature which will lead to an increase in the energy content of the biogas per unit volume.
Figure 11 shows that there will be a reduction from 21,034 kJ/m
3 to 18,675 kJ/m
3. This means that for a fixed combustion size, more gas will need to be injected to obtain the same combustion output energy. The same will happen for the fixed size compressor which will need to perform extra work to increase the pressure of the same mass of air.
While the increase in ambient temperature has a positive effect on the power efficiency and the cogeneration 1 (of power and cooling) efficiency of the system, it has a negative effect on the cogeneration 2 (of power and hot water) and the overall trigeneration energy efficiency (as shown in
Figure 12). This trend is also the same for the exergetic efficiencies, however, the increase and decrease in efficiencies are more evident for these efficiencies. The integration of hot water production with the power plant justifies this variation in performance. Hot water production being a low grade heat energy utilization source will affect the exergetic performance drastically as the ambient temperature approach the desire temperature for the hot water production. Going by the definition of exergy, a system is said to have zero exergy when it is in thermodynamic equilibrium with the environment. The high efficiencies also recorded by the system when trigenerating power, hot water, and cooling is due to the integration of hot water production. Therefore, the performance of the model in this study follows thermodynamic principles as the system’s (cogeneration 2 and trigeneration) efficiencies drop when the ambient temperature approaches the design temperature of the hot water production subsystem.
4.4. Effect of Ambient Temperature on the System
The obtainable electric power production from the CHP system in this study amounts to 28,800 kWh/day. For Biogas-B (the substrate combination that gives the highest biogas yield), it will be able to generate about 964 kWh per ton of volatile solid of the substrate added to the digester. The comparison of this power generation potential with another study performed by Hutnan et al. [
31] presented in
Table 7. The results show that the power system efficiency retrieved in this study—which was 37.89%—was comparatively higher than those from other studies.
The power production potential of the systems varies between 801 (kWh/Ton-VS) to 1200 (kWh/Ton-VS). The comparison of the results from these studies highlights various important factors that determine the power production potential.
The electric power obtained per substrate largely depends on the biogas yield which in turn depends on the hydraulic retention time (HRT). One of the many factors that affect biogas/methane production is the retention period [
35]. The complete degradation of a substrate depends on how long it is kept under proper reactor conditions [
35]. However, it should be noted that for a longer retention time, the reactor size will have to be bigger.
The organic loading rate (OLR) is another important factor as it has a huge influence on methane yield [
36,
37]. It measures the amount of influent substrate added to the digester per unit of time. This, in addition to the volume of the digester, will determine the substrate amount in the digester which will, in turn, impact the power production potential.
The efficiency of the power system is also important in obtaining a higher electrical output per substrate. In the present study, the electrical efficiency of the CHP system is boosted by waste heat utilization. The bottoming ORC cycle ensures that the system output is increased for the same input substrate amount.
5. Conclusions
An energetic and exergetic evaluation of a multigeneration system that utilizes AD products for biogas fuel has been presented. The multigeneration system comprises a microturbine gas engine, an organic Rankine cycle, a GAX chiller, and a water heater. The multigeneration system was modeled based on the design information provided by commercial manufacturers of each of the individual engines. This modeling revealed that for biogas with an assumed methane content of 60%, a mass flow rate of 0.2185 kg/s will be needed to provide the needed combustion energy to power the 1200 kW CHP system. The amount of biogas available is an important factor in sizing such gas-powered engines and this biogas yield from the anaerobic digestion of waste depends mainly on the type of substrates used. For each of the biogas types, the reported methane yields were used to estimate the required amount of substrates to power the 1200 kW multigeneration system. It was found that Biogas-C which is produced from the co-digestion of swine manure and corn straw will require the highest substrate amount. About 81.87 tons-VS/day will produce the needed amount of biogas for the system compared to 35.07 tons-VS/day for Biogas-A (poultry manure and food waste) and 33.11 tons-VS/day for Biogas-B (Cattle manure and food waste).
The study also showed the importance of factors such as the methane content of the biogas, recuperator effectiveness of the microturbine, and the ambient conditions. For an increase in the methane content, the study showed that the substrate amount for each biogas type will reduce. This is due to the increase in the LHV of the biogas meaning less amount of the fuel will be burnt to produce the same combustion energy. The total exergy destruction of the system will also reduce, which will increase the exergy efficiency of the system. An increase in the recuperator effectiveness also showed the same effects on the system. The increasing effectiveness will also increase the combustor inlet air temperature (CIAT). When the ambient temperature increases, the densities of both the biogas and the compressor inlet air increases. The effect of this on the system is that the combustion energy will reduce and the compression work will increase. Since both the biogas and air constitute the inlets of the multigeneration system, the energetic and exergetic performance will be adversely affected.


