Abstract
Environmental pollution in the pottery industry is a severe problem, particularly dust and smoke pollution from the building-pottery industry. The main objectives of this study are to quantify the carbon emissions and solid-waste generation from the life cycle of pottery production in Yunnan. This study was carried out between November 2020 and May 2021. LCA was used, and 1 kg of pottery was used as the functional unit. There is a lot of literature to obtain data on the carbon emissions and solid waste generated in the process of pottery production for reference and calculation. This study forces the extraction of raw materials to the processing point, the device boundary of the pottery-production process. Carbon emissions in the pottery-production process account for about 80% of the whole pottery life cycle. Moreover, a large amount of solid waste is mainly produced as a result of the waste and production process. It is recommended that the serious pollution-causing combustion system should be reformed. The enterprise’s waste can be recycled. Most of the waste products can only be used as construction filling, and a small amount of the waste products can be used as hard materials in proportion after crushing.
1. Introduction
Within the world’s pottery industry, China’s pottery industry an essential life position in national production. Of China’s five pillar industries, the pottery industry is one the highest globally (with the highest global concentration). There are data for China’s pottery production in the calendar years from 2000–2005, and potteries had a yearly average growth rate of 7% [1].
Due to people’s low expectations and the prevention of the adverse effects of China’s highly developed industry, there are three major global crises: resource shortage, environmental pollution, and ecological destruction [2]. Environmental pollution in the pottery industry, especially dust and smoke pollution in the building-pottery industry, is a severe problem. The pottery industry is a high-energy-consumption industry, with total energy consumption accounting for 30% to 40% of the cost of pottery production [2]. High energy consumption brings high pollution, which causes significant pollution to the environment in the rapidly developing pottery-production areas and surrounding areas. The environmental pollution in and around the pottery factory is mainly due to increasingly severe air pollution, which is considerably harmful to the health of human beings, animals, and plants [3]. Thus, it is essential to improve the utilization rates of resources in order to reduce pollution from the pottery industry to the environment. The general industrial solid waste generated in the production process of the ceramic-product-manufacturing industry mainly includes waste mud, waste blank, waste glaze, coal ash, waste gypsum mold, refractory waste material, waste kiln furniture, desulfurization solid waste, polishing waste residue, waste brick, and waste porcelain. Hazardous wastes generated in the production process of ceramic products mainly include wastes generated from the use of inks and solvents, as well as coal tars generated during the production of coal-gasifier gas.
With the development of the circular economy and technological progress, significant progress has been made in the utilization of solid waste in the ceramic-product-manufacturing industry. Traditionally, bulk wastes such as waste sludge, waste blanks, and wastewater-station sludge can essentially be reused in our factory. The amount of waste porcelain produced is about 6% to 15% of the product. The utilization of waste porcelain was once a common difficulty in the industry. At present, the proportion of waste porcelain (waste bricks) in the factory is usually 3% to 7%, and it is reused according to different products. The proportions vary. In addition to being reusable in the factory, the technology of mass utilization of waste bricks and waste porcelain has made breakthroughs in recent years. In major ceramic-production bases, foamed ceramics and permeable bricks have become an important recycling industry chain for waste-porcelain utilization [4]. Most of the garbage without treatment is transported to the countryside by the construction unit, which is treated by piling up or landfilling in the open air, consuming many requisition fees and garbage-cleaning freight. At the same time, in cleaning and stacking, the problems of dust and other issues have caused severe secondary pollution. In 2019, the 2nd China International Pottery Exhibition was held in Kunming, Yunnan Province. A seminar on the development of the pottery industry was held in Yunnan Province. These indicate that Yunnan Province will regard the development of the pottery industry as one of the major industries for future development. Therefore, taking Yunnan Province as the research object to reduce carbon emissions and solid waste is significant for the future development of pottery and environmental governance in Yunnan Province.
This paper considered using Life-Cycle Assessment (LCA) [2] to measure a product’s life cycle, which would cause environmental impacts and resources used, i.e., from the acquisition of raw materials, through the production and use phases, to waste management. Thus, this study aims to quantify the carbon emissions in the process of life-cycle pottery production in Yunnan and to quantify the potential solid waste from this life cycle of pottery production in Yunnan. We are guided by the following questions: (a) What is the process of pottery production that contributes the highest carbon emissions, and how much carbon emission is in Yunnan? (b) What are the processes contributed by the pottery production in Yunnan, and how much solid waste is generated in Yunnan?
This research is crucial to a better understanding of the impact of pottery production in the Yunnan region. In addition, this study helps to consider the positive and negative impacts of pottery-industry development on the environment as a whole. It also supports the pottery-processing industry to identify stages in the product or process life cycle where carbon emissions and solid-waste factors may be taken into account.
2. Literature Review
Pottery is an essential good in our daily life, but the consumption of its products includes energy and raw materials and causes severe environmental pollution. According to a study, the cost portfolio of life-cycle assessment is carried out by quantifying the environmental and economic impact of pottery production from entry to the proficiency, ascertaining the significant substance, and eliminating the production issues under processing [5]. The results show that ecotoxicity, terrestrial ecotoxicity, climate change, fossil depletion, and human toxicity are the main types of environmental impacts. Principle substances include Cl2 in the soil, SO2, and CO2 in the air. The overall economic cost is USD 2.77 per square meter, and this cost comes from raw materials. In addition, inorganic chemicals used as raw materials take part in the environment at 12.9%, and the economic burden is 39.6%. Apart from that, decreasing the use of inorganic chemicals can lead to a win–win situation for the environment and economy, such as when coal, electricity, and raw-materials transportation have achieved optimization.
However, Haiyong and Jie (2016) [6] reported that building-pottery carbon emissions were analyzed, and put the calculation method forward based on the life cycle. The life-cycle calculation included three steps: the mining of raw materials, transportation of raw materials, and the production of products. Moreover, this method was applied in the production of building pottery in eastern China, with some suggestions on how to reduce the emissions. This study shows that the carbon emission of pottery in the life-cycle scope is 0.714 kgCO2/kg. According to this study, carbon emissions take the highest proportion. The percentage of the proportion is 81.23%. A number of studies have examined a range of environmental impact categories on LCA, and the study’s goals are dependent on which one is chosen. Some typical categories in the pottery LCA literature were resource shortage, environmental pollution, and ecological destruction [2].
Qinwen and Xiaoqian [2] also point out that seven subprocesses including raw-material mining, raw-material preparation, forming processing, glaze application, firing production, product use or abandonment, and transportation were analyzed, and based on the LCA method energy consumption, and environmental impact were calculated, respectively. Therefore, it says that the production of 1 m2 of a model number named VWHOO2NP glazed tiles’ negative impact on the environment is a load of 129.038 mm human equivalent. The effect of the production of building pottery on the environment is mainly solid waste, smoke, and dust; the impact on local areas is the first. Meanwhile, the impact of global acidification and warming cannot be ignored. Contaminants that include metals have the potential to create a wide range of health problems in people when they enter the bloodstream [7].
Different tools and material approaches are introduced into ceramic-surface treatment by science and technology, which produce important outcomes. The designer identifies talents and empowers creators. Despite the fact that clay arts lack the necessary ecodesign rules, they may learn from the electronic industry’s sustainable-development footprint. The process of glazing and ceramic fire, which consumes a lot of energy and emits a lot of CO2, cannot be overlooked in the vivid display of ceramic art [8]. Eutrophication mainly comes from kaolin production and electric-power production, raw-material transportation (90.430%) and other processes; global warming mainly comes from electricity production, kaolin production (86.202%), and other processes; and solid waste mainly comes from feldspar production, power production (91.769%), and other processes [9]. Different production technologies, raw materials, processing and production, and product transportation may affect carbon emission. A similar study [10] shows that based on the life-cycle theory, CO2 emissions in the pottery-production process are related to three links: original material mining, transportation, and processing and production. The carbon emission of Zhujiang sanitary pottery in the processing and production stage accounts for more than 70%, which should create new production technology, an emphasis on personnel training, and the introduction of preferential policies to achieve a low-carbon emission reduction that is more in line with the existing Chinese market to achieve the development goals.
Furthermore, under the study of the carbon footprint of a building or sanitary pottery, the paper “Carbon Footprint of Building and Sanitary Ceramics According to Life Cycle Theory” [9] reported that the carbon emissions of building pottery and clean pottery in life-cycle scopes are 9.59 kg/m2 and 776.75 kg/t, respectively. This indicates that carbon emission in the production processes takes the highest proportion and has a critical influence. In addition, the proportion of building potteries and sanitary pottery is 72.8% and 70.7%. The proportion of carbon emissions in the mining and transport process of raw materials and products transported is less than 30%. Pottery production contributes to air pollution, especially CO2, and consumes a lot of nonrenewable resources. The carbon emission of building pottery was analyzed. The carbon emission of pottery in the life cycle scope is 0.714 kgCO2/kg. According to this study, carbon emissions account for the highest proportion [6].
The purpose of the research review is to help in understanding the concept of the study and provide information related to the study. Previous research described the environmental impacts of pottery production. Several aspects of production were thought to contribute to the objectives of the research. There is still a tiny amount of research on pottery production based on previous studies.
Due to the comprehensive nature of the LCA assessment method, it includes the acquisition and treatment of raw materials, the manufacture, transportation, use, and maintenance of the product up to the maximum recovery or final disposal stage, and the life-cycle assessment lists the energy and materials used by all product-related industries (such as manufacturing, use, and services), and calculates the emissions into the environment. The ultimate goal is to record and improve the negative impact of products on the environment. Therefore, life-cycle assessment (LCA) was used in this study.
Due to regional culture and climate, pottery types, materials, and thus the amount of carbon dioxide and solid waste produced in the production process varies. Unlike previous literature, the carbon-dioxide emissions and solid waste generated in this paper may also be different due to the particularity of purple pottery (only in Yunnan). In addition, in this literature review, some important factors affecting the environment in the pottery life cycle were identified. Furthermore, the literature review found that aspects of pottery making include temperature, region, staff, and yield. The gaps in the literature analysis are shown in different pottery types, and the pollution controls by local environmental protection bureaus account for some of the discrepancies. Similar studies have shown that based on the life-cycle theory, CO2 emissions in the process of pottery production are related to the mining and transportation of raw materials, processing and production, and product transportation [4].
3. Methodology
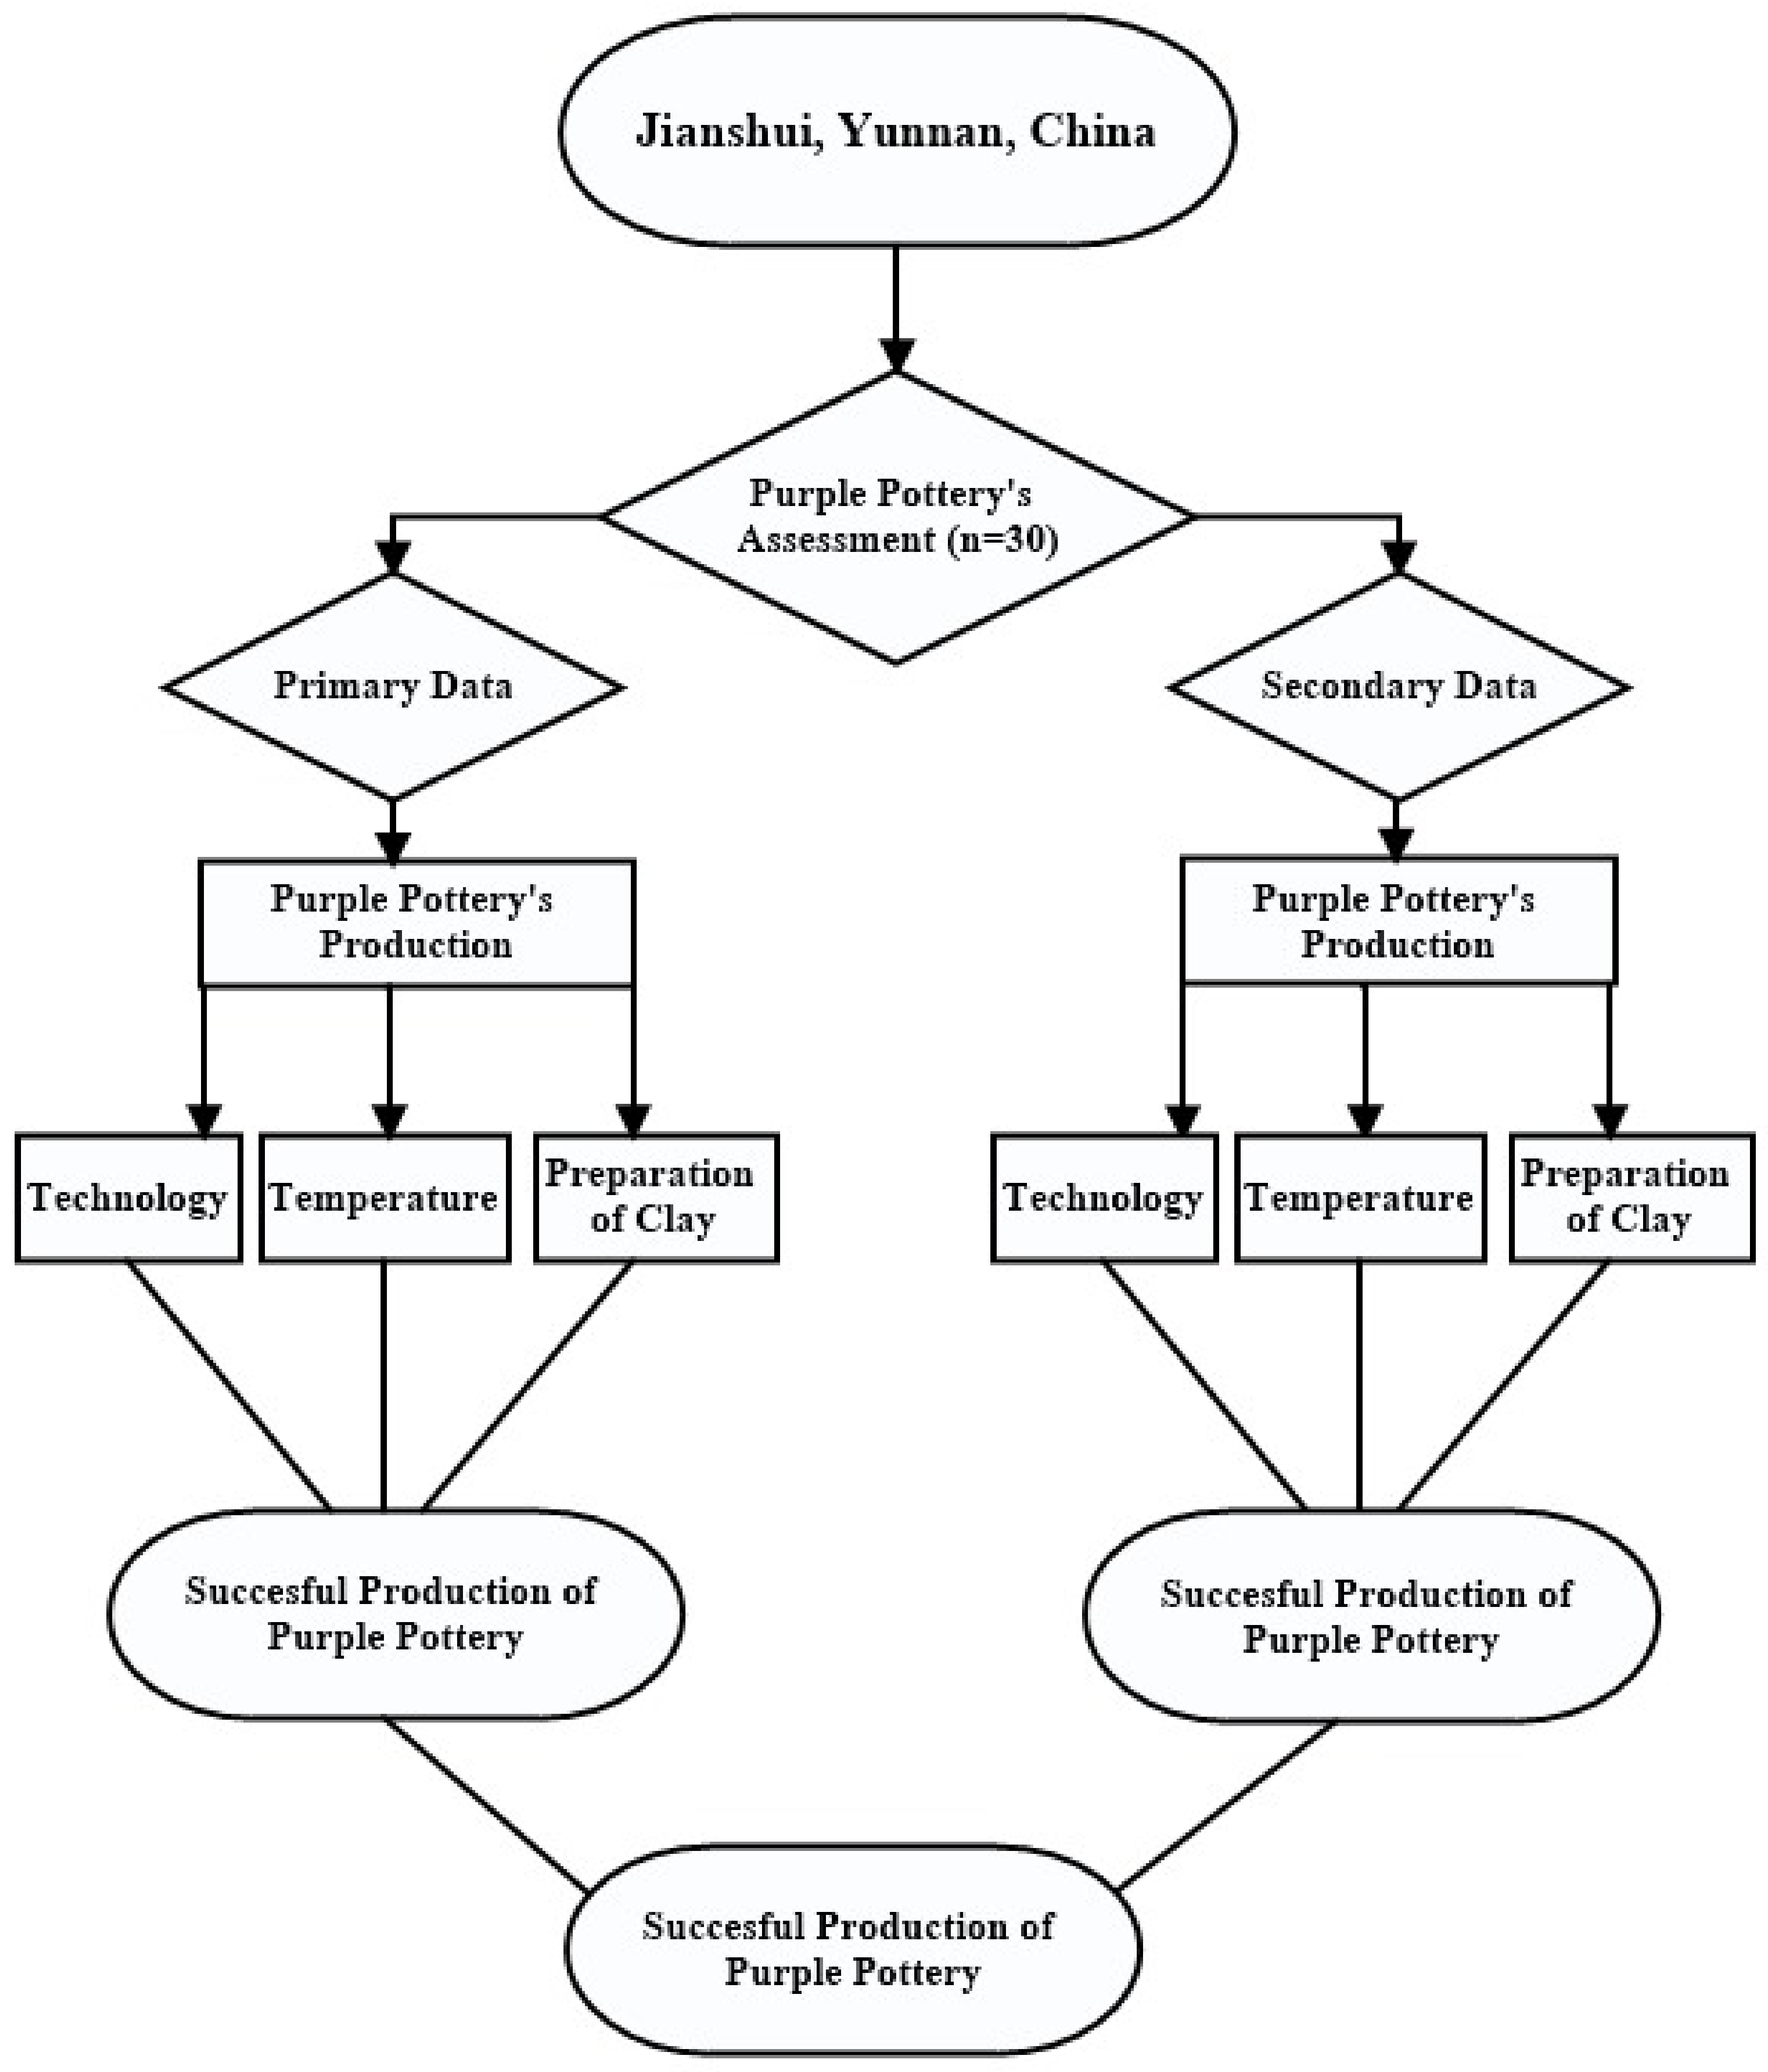
This study aimed to discover which processes in pottery production have the highest carbon emissions and solid-waste production in the system. Based on previous research, the environmental impact of pottery production is described. A Life-Cycle Assessment (LCA) was adopted in this study. Figure 1 shows the conceptual framework of LCA research.
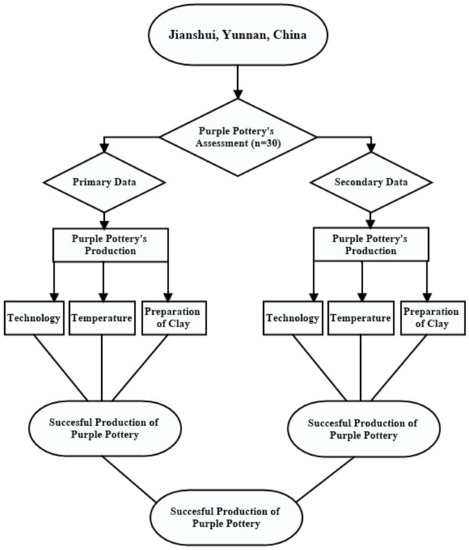
Figure 1.
Conceptual framework of the life cycle assessment (LCA) studies.
3.1. LCA Research Framework
The general methodology used in this study is based on the fact that traditionally, LCA has used either a process-based or a product-based approach. This method followed the ISO14040 and ISO14044: 2006 [11,12] which consist of 4 phases: (1) Goal and scope; (2) Life-cycle inventory; (3) Life-cycle impact assessment; and (4) Interpretation. Figure 2 shows the phases of LCA.
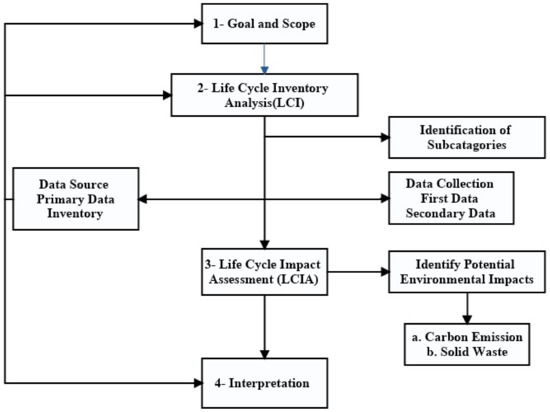
Figure 2.
LCA research framework.
3.2. Goal and Scope Definition
The study aimed to use LCA to analyze carbon emissions and solid waste generated during the life cycle of pottery production. The scope of this study focused on the areas where the most impact occurs. The boundary begins with the raw-material mining before being sent to the factory process (pottery). This is a cradle-to-gate study (Figure 3). 1 kg of pottery is used as the production unit, and this study was conducted in two pottery companies Yunnan, China. This study was conducted for five months, from November 2020 to May 2021. For this LCA study, the audience or target group was the pottery industry and government departments to determine their distributive health, safety, and social benefits.
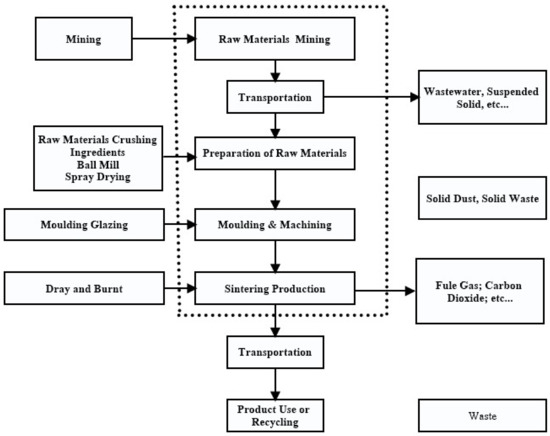
Figure 3.
System boundary of pottery-production process.
3.3. Life-Cycle Inventory (LCI) Analysis
The purpose of the whole life-cycle method was to carry out a quantitative analysis of the research object, gather information for a hotspot assessment, and collect data from the high-yield pottery production area in Yunnan.
There were two sources of data used for carbon-emission calculation and analysis: raw-material allocation, production energy consumption, transportation, and other data closely related to the study, provided by production enterprises; and basic data such as the exploitation of energy, using national or local statistical data such as government data from each year, which adds to the data sources that come from carbon emission.
Hotspot estimation provided additional information about the most critical concerns in the product life cycle. This study used the pottery industry in Yunnan as the research object, so it was necessary to collect the production data of pottery factories in Yunnan Province. The data collected is based on the carbon emissions from pottery production and the environmental impact of the solid waste produced. Data that may be collected include: What activities are variable? The second step in data collection is usually about the supply of raw materials. The third step of data collection and the primary data collection is screening the desktop data collection, using literature reviews (Science Direct, Database, etc.) and website searches (PRC State Environmental Protection Administration).
The data used in this paper are mainly from the enterprise’s files and the government’s reports each year. In addition to the data, the sources include some literature and historical references on environmental monitoring, and waste disposal by local health departments and the use of statistical sampling surveys. Specific data collection may be held together with an audit and involve auditing enterprise files (such as an EIA report, etc.). To the audit, authorities and nongovernmental organizations submit documents through a participatory approach.
3.4. Life-Cycle Impact Assessment (LCIA)
Impact assessment includes quantitative and qualitative assessments. According to the ISO14044 [12] framework, impact assessment consists of three steps: classification, characterization, and weighted assessment. Classification refers to the classification of the influence indicators of the research object. Characterization refers to using transformation factors to model potential impacts and obtain metrics for impact categories; relative weighting of influence categories; and assessment and reporting.
3.4.1. Calculation Method of Carbon Emission
According to [1], the formula for calculating carbon emissions from energy consumption is shown in Equation (1):
where is the carbon emission generated by energy consumption;
- is the amount of energy consumed;
- is the low calorific value;
- is the carbon content per unit calorific value;
- is the 20-oxidation rate.
In addition, the carbon emissions generated by energy consumption can also be expressed as follows in Equation (2):
where is the carbon-dioxide emission factor.
For the carbonates in the raw materials, the carbon emission produced during calcination at a high temperature shall be calculated according to Equation (3):
where is the carbon dioxide discharged by the hydrolysis of carbonates;
- is the consumption of carbonate raw materials;
- is the carbon-dioxide-emission factor of carbonate materials.
By combining Equations (1)–(3), the carbon-emission calculation formula for the life cycle of building pottery is obtained as shown in Equation (4):
where C is the total carbon emission of building pottery within the boundary, and Cei is the carbon emission in the upstream phase of energy (Qinwen & Xiaoqian, 2008) [2]. The consumption of energy in the pottery-production process, including electricity, natural gas, diesel, raw coal, and energy consumption products per kilogram of production, mainly comes from the emission of energy and the decomposition of raw-material carbonate combustion-emission process.
The consumption of carbonate raw materials for pottery production is mainly limestone. When calculating the emission factor, the figure published by the Shanghai Development and Reform Commission is 0.43 kg/kg [2].
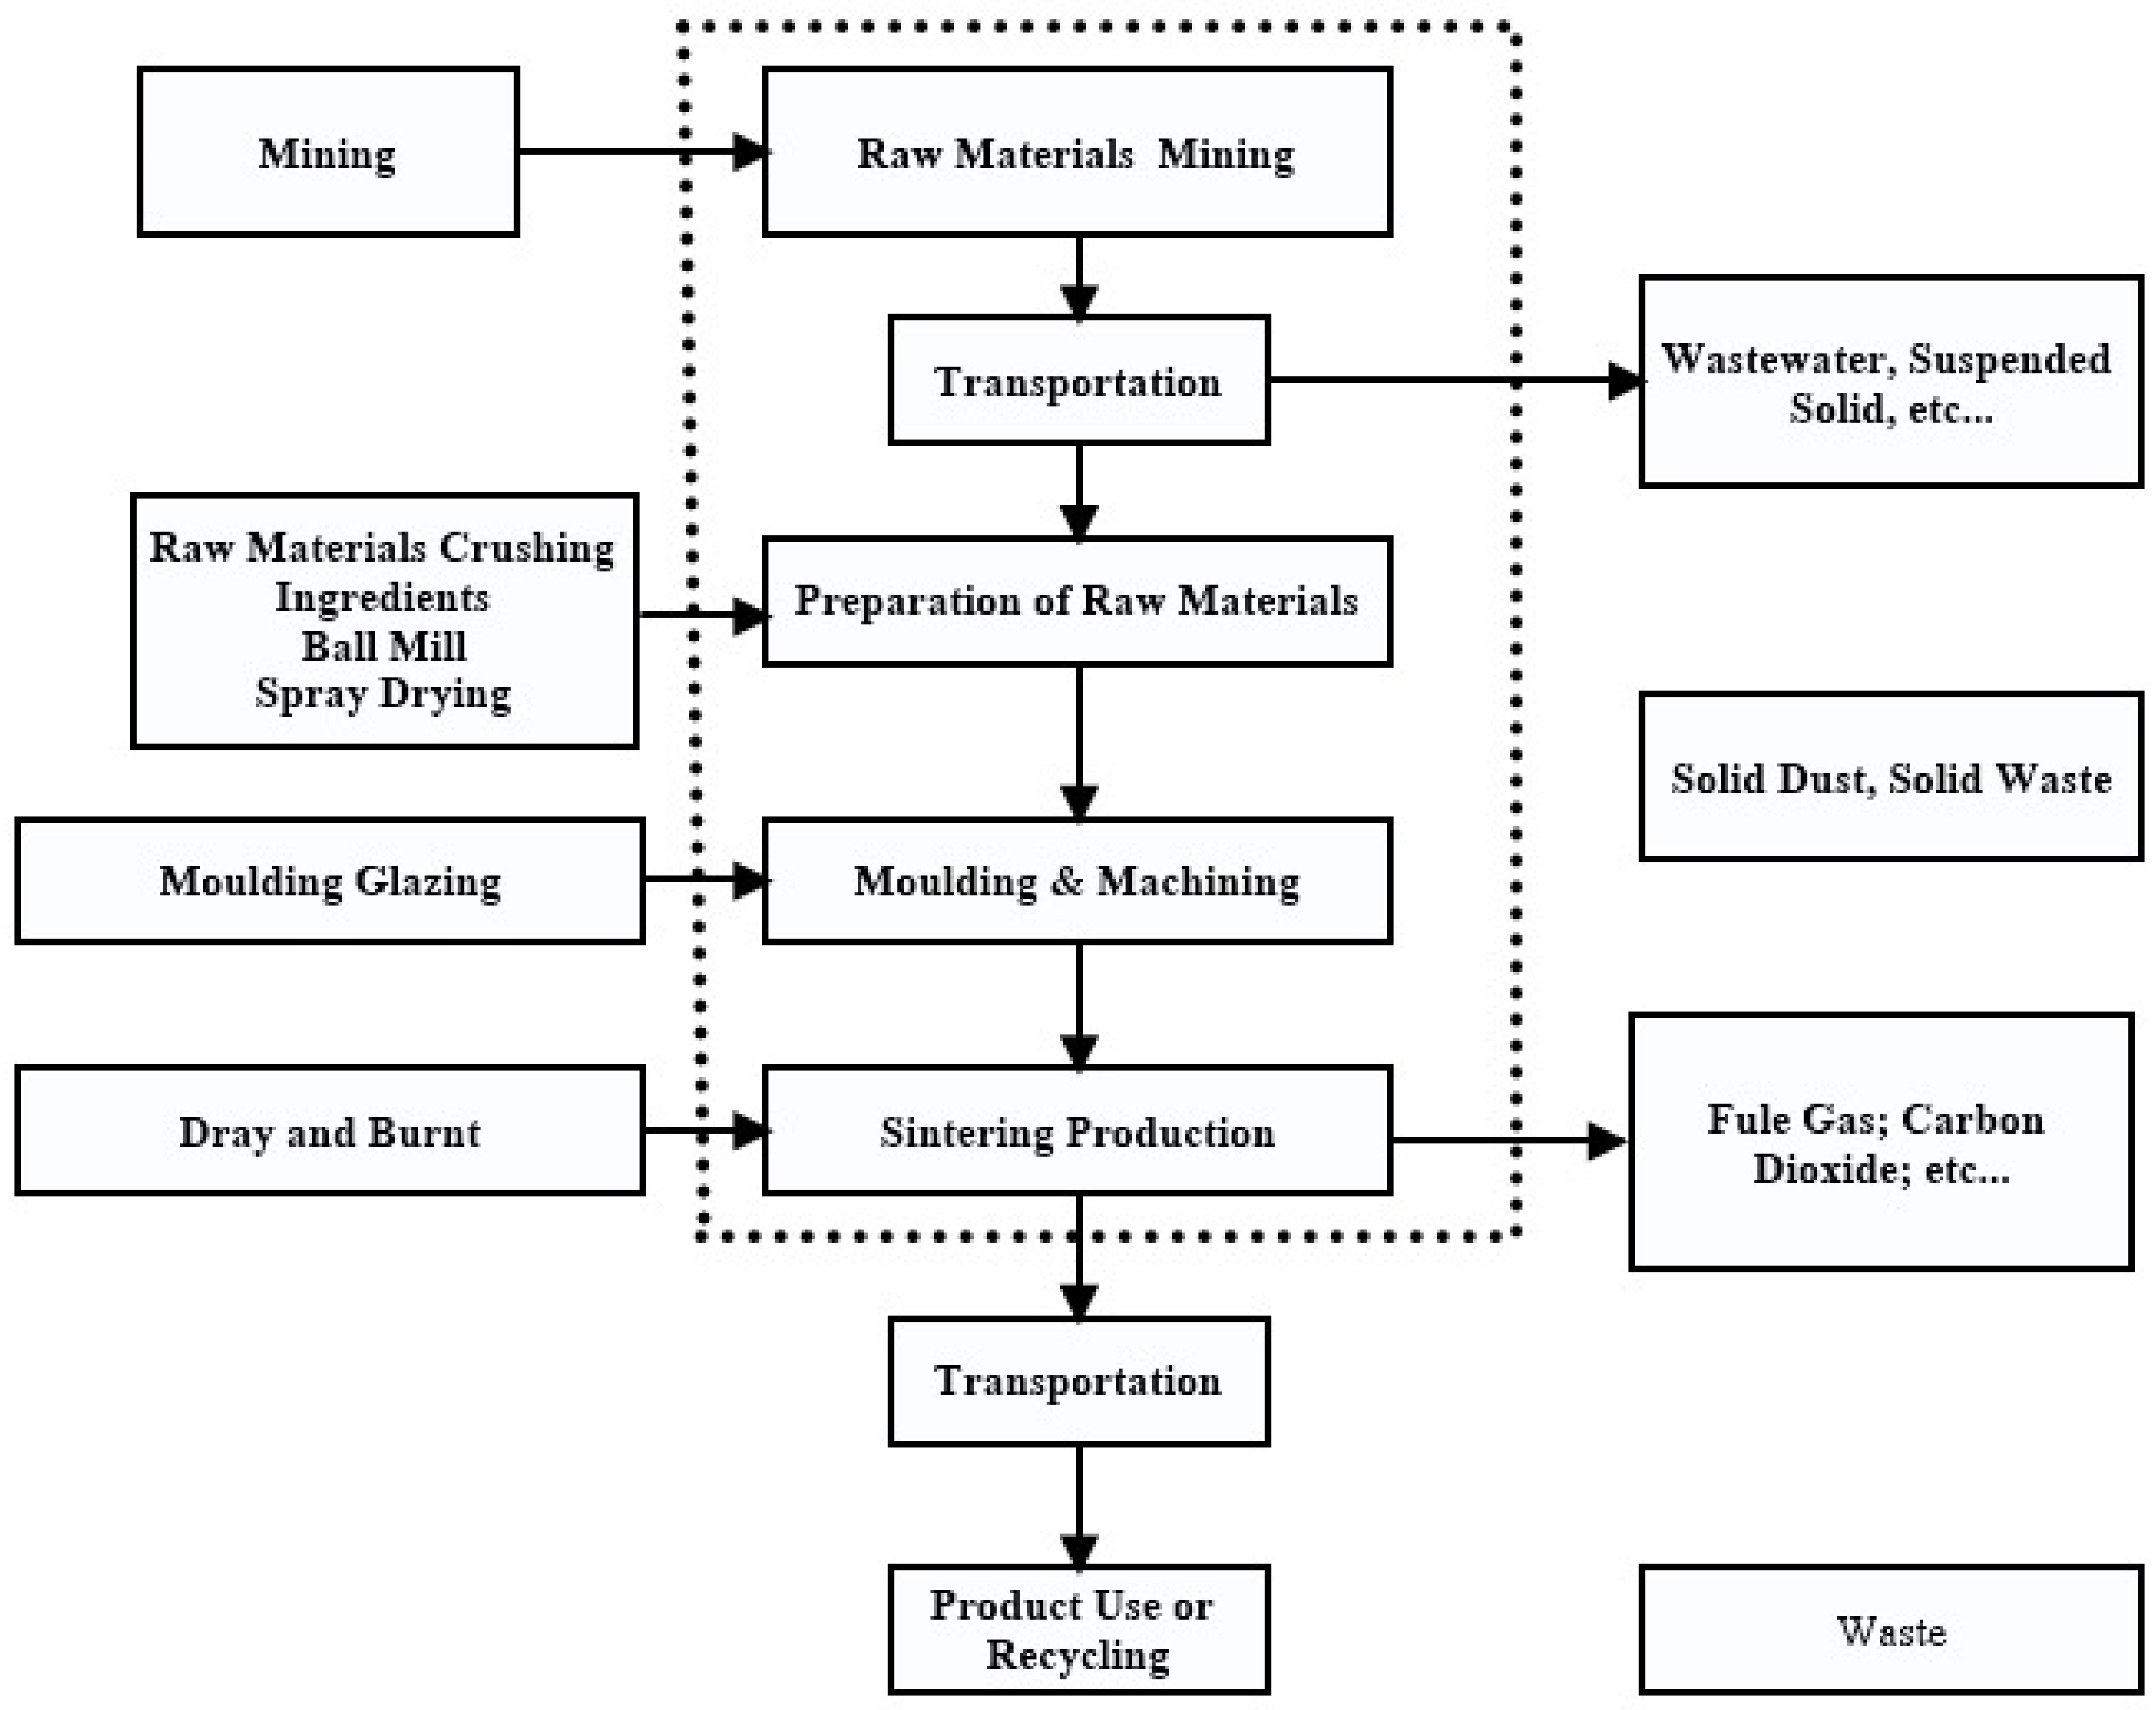
3.4.2. Industrial Production and the Generation of Pollutants
Pottery production will cause a variety of pollutions, including air pollution, water pollution, solid-waste pollution, noise pollution, etc. The main sources of these pollutants include raw-material preparation and molding processes. Specific pollution-production links of pottery-manufacturing enterprises are shown in Appendix A Figure A1.
The atmospheric pollutants in the pottery-manufacturing kiln mainly include particulate matter, sulfur dioxide (SO2), nitrogen oxide (NOx), chloride, fluoride, lead and its compounds, cadmium and its compounds, and nickel and its compounds. The common range of initial concentration of the particulate matter, SO2, and NOx at 6 degrees is shown in Appendix A Table A1. Pottery-production wastewater mainly includes sludge wastewater, glaze wastewater, pottery-tile post-treatment wastewater, and desulfurization wastewater from the raw-material-preparation process. The pollutants in pottery-production wastewater mainly include suspended solids, a small amount of CODCr, and ammonia nitrogen. In the process of pottery production, the preparation process of waste mud glaze and fly ash, the molding process of waste gypsum mold, the firing process of refractory materials and waste kiln furniture, and the firing and finishing process of polishing waste residue are the primary sources of general solid waste. Finally, material-crushing machines, ball mills, kiln fans, air compressors, and other equipment are used in pottery production, which can cause noise pollution to the environment.
3.4.3. Data Sources and Forecasting Methodologies of Solid Waste
According to the Four Pass Group technical personnel [13] exposition, pottery waste is difficult to degrade, landfill treatment takes up many land resources, and pottery production needs to consume many raw mineral materials. “Currently, the resources of traditional pottery-producing areas across the country are depleted, and some pottery-producing regions are forced to withdraw from the industry due to shortages. Therefore, developing new sources of raw materials and carrying out research on the comprehensive utilization of resources is one of the keys to maintaining the pottery industry’s sustainable development.” At present, the content of waste porcelain powder in our recycled porcelain clay has increased to 30–36%. The annual use of waste porcelain has reached 28,000 tons, which saves a lot of resources and effectively reduces the burden on the environment.
In this study, according to the environmental statistics published by China every year, solid-waste disposal data was used to make predictions, making up for the small environmental statistics indicator coverage. This study also forecasted the industrial solid-waste output of township enterprises based on the survey data of pollution sources. Solid-waste generation is a multidimensional stochastic process. Because the influencing factors are challenging to obtain, it is impossible to use the regression-analysis method to predict. However, these factors can be replaced by time synthesis and treated as a one-dimensional random process. Time-series analysis is to anticipated and forecasted by analyzing this two-dimensional stochastic process [14]. In this study, power exponential-smoothing time-series analysis was used. Smoothing computation is the advance of a time series past the data-weighted average of rows, the weight of which depends on α(1 − α) t − 1. Predictions can be made from past continuous observations, or an independent trend (such as linearity, exponential, or decay) can be attached. The simple exponential-smoothing formula is:
S t = α·Xt + (1 − α)·S t − 1 = α·Xt + α(1 − α) Xt − 1 + α(1 − α) 2 Xt − 2 + … + α(1 − α) t − 1 X1 + (1 − α) t S 0
3.4.4. Confirmation of Type of Environmental Impact
In this study, we learned that pottery is produced in Yunnan, so the water-resource depletion used in pottery production is a regional characteristic. Carbon emissions from pottery production could also contribute to global warming. In addition, acidification and eutrophication have regional characteristics determined by the ecological cycle in Yunnan. In addition, solid waste, soot, and dust, determined by all local factories, are localized. Therefore, based on the results of the energy-consumption analysis, the environmental impacts listed using the life-cycle approach are the regional depletion of water, global warming, regional acidification, regional eutrophication, localization of solid waste, and localization of smoke and dust.
3.5. Sensitivity Analysis
Sensitivity analysis is essential for studying the robustness of life-cycle assessment results and their sensitivity to uncertain factors. To discuss the critical processes’ impact and degree of influence on a significant environment, this research analyzed the environmental load sensitivity caused by a 5% change in the key links of pottery and its life cycle. As shown in Table 1, if the consumption of inorganic chemicals is reduced by 5%. The reduction of inorganic chemicals has a significant effect on the reduction of impact potential in all key environmental categories. Transportation is second only to inorganic chemicals as a sensitive link, and reducing this process has little impact on the potential effect of each significant categorical type.

Table 1.
Sensitivity analysis results.
4. Results and Discussion
The evaluation parameter of carbon emission in the life cycle of pottery is the CO2 emission per kilogram of unit product produced, which is expressed in Kg. The “cradle” can be traced back to the energy-extraction stage. Energy can be divided into primary energy and secondary energy. Primary energy refers to all kinds of energy directly taken from nature without processing and conversion. In contrast, secondary energy is obtained directly or converted from primary energy after processing and conversion. The primary energy sources involved in the production of sanitary pottery are raw coal, crude oil, and natural gas, and the secondary energy sources are electricity, diesel oil, etc. The carbon-emission inventory of energy production is the basis for carrying out industrial and product life-cycle assessments. The results can also clarify the basic environmental behavior of energy production. Therefore, the upstream carbon emissions of energy were first studied. Carbon emissions in the upstream energy phase were calculated based on statistical data. According to the calculation model, the upstream production carbon emissions of raw coal, crude oil, natural gas, electricity, and diesel were obtained, as shown in Table 2.
Table 2.
Upstream phase of energy carbon emissions.
Raw-material mining, transport, and products produced during the life cycle of pottery were the sources of carbon emissions. It is concluded that the carbon emission of raw-material mining accounts for 14.43% of the carbon emission in the life cycle [6]. Therefore, continuous optimization of the production process, selection of appropriate upstream suppliers, and reasonable transportation modes are all methods to significantly reduce carbon emissions through analysis. In addition, improving the recycling of production waste is also a meaningful way to reduce carbon emissions from products.
4.1. Carbon-Emission Analysis of Pottery’s Life Cycle
4.1.1. Production List of Raw Materials
A wide variety of raw materials are used in pottery production, including kaolin (Al2O2·2SiO2·2H2O), feldspars (KAlSi3O8 or NaAlSiO3 or CaAl2Si2O8), quartz (SiO2), limestone, clay, and auxiliary chemical materials. Due to the small amount of auxiliary chemical raw materials, they are not considered in this evaluation. These raw materials can be roughly divided into plastic materials, fineness materials, and flux materials. The mining characteristics and the carbon emissions in the mining process are similar. Therefore, one material is selected to represent this whole category of materials for calculation. The energy-consumption data of kaolin during mining was adopted as the representative plastic material. Quartz was the representative barren material. Feldspar was selected as the representative flux material. Limestone will decompose to produce CO2 in the burning process, so the limestone will be considered separately, as shown in Table 3.
Table 3.
Raw-material-mining energy-consumption list.
According to a report [15] calculating data from the GABI database and comparing them with data from the SIMAPRO database, it was found that their raw-material-mining lists are roughly the same, and it was concluded that the carbon emission of pottery raw-material mining accounts for 6.9% of the carbon emission during the life cycle. However, another piece of literature chose the SimaPro5.1 database. It used feldspar as the primary representative, and the result was that the carbon emission of raw material mining accounts for 14.43% of the life cycle. Since the subject is unchanged, the gap can be ignored.
4.1.2. Transportation List of Raw Materials
Most of the natural mineral resources used in pottery production are transported by water, as shown in Table 4. As shown in Table 5, the energy consumption per unit of different modes of transport is in the current land-transport system. Most of the transport vehicles use diesel, so this paper sets the road transport fuel for diesel.
Table 4.
Transportation parameters of raw materials.
Table 5.
Energy consumption per unit of different modes of transport.
According to Chen and Xiaoqian [2], resource depletion in the pottery industry is represented by the primary energy consumption and the leading resource consumption, and energy is evaluated as a resource. The disposable resource consumption of pottery production (energy consumption) is gasoline 0.920 MJ and 0.020 kg; diesel oil 153.424 MJ; 3.568 kg coal 75.09 MJ; or 2.503 kg standard coal. Since the consumption above represents only the total consumption of the resource and does not reflect its relative size, they use the resource consumption baseline to standardize, assuming that the average pottery has a lifespan of 20 years. The potential value of coal, oil, and other resources is obtained, reflecting the proportion of resources consumed in pottery production based on per capita resources consumption (based on 1990). After standardization, diesel oil accounts for 57.77%, gasoline oil for 0.39%, and coal for 41.84%.
Thus, in the resource consumption of the whole life cycle, after standardization, diesel oil accounts for 84.04%, gasoline 0.57%, and coal 5.39%, reflecting the actual situation that the production process of building ceramics in China, which is dominated by oil. The emissions and consumption in the transportation stage contribute little to the environment, and the proportion of emissions in the transportation process in the whole life cycle is CO, accounting for 0.38%, indicating that the collection half path in the transportation stage is not the decisive factor in determining the whole system’s CO.
4.2. Analysis of Emission-Reduction Potential
Figure 4 visually shows the proportion of carbon emissions at each stage of the life cycle of pottery. As shown in Figure 4, the carbon emission of pottery raw-material mining accounts for 6.9% of the carbon emissions in the life cycle, raw-material transportation accounts for 4.0%, and product production accounts for 89.1%. Reducing the carbon emissions of life-cycle sanitary pottery is essentially a low-carbon product-production process.
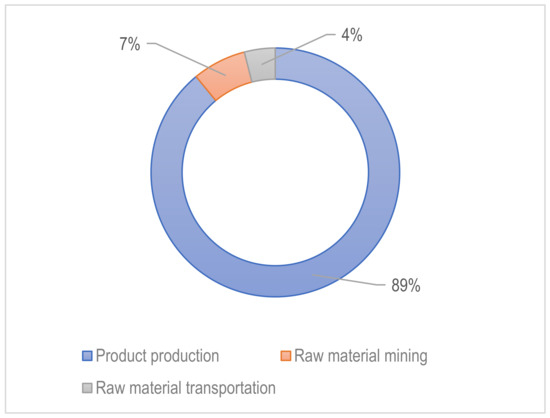
Figure 4.
The proportion of carbon emissions in each stage of pottery production.
In 2008, the ceramic-tile-manufacturing sector emitted 2.9 million tons of carbon dioxide. Of these emissions, 91% were generated by natural gas combustion in the cogeneration systems and process facilities. The remaining 9% was from the decomposition of the carbonates present in the raw materials during the firing stage. Specific thermal energy and electricity consumption correspond to 90% and 10% of total consumption in the two types of studied companies (spray-dried granule manufacturers and pressed ceramic-tile manufacturers). The stages with the highest thermal energy consumption are spray drying of the ceramic suspensions and drying of the tile bodies. The firing stage uses the largest amount of energy (55% of total consumption), followed by spray drying of the suspensions (36%) and tile drying (9%). The difference in energy consumption, measured among kilns manufacturing different products, was approximately 20% [16]. Therefore, the energy-saving of the kiln is the key to reducing the carbon emissions of pottery products. To improve the energy conservation of kilns, the first step is to improve the energy-utilization efficiency and further improve the combustion efficiency of traditional coal kilns, and at the same time, to promote the utilization of waste heat in kilns and other technologies to save energy and reduce carbon emissions. Thirdly, in the kiln design, the use of new insulation materials to build the kiln can enhance the insulation effect of the kiln. With the continuous expansion of the pottery market, the resources for high-quality pottery are becoming increasingly limited. Although the carbon emission of natural mineral resources is not large in the process of exploitation, long-distance transportation consumes a lot of energy. Using industrial waste residue as a raw material for pottery can help to reduce the carbon emissions of industry.
The energy consumption of pottery is relatively high because of its many production processes and high firing temperature. The repeated glazing and repeated firing increase the energy consumption of the firing link. The total energy consumption of the secondary-fired porcelain for pottery is above 800 kgce/t, and the energy consumption increases by about 10–20% for each additional firing [17]. Moreover, the particulate matter-control technology in the pottery industry usually includes bag-dust removal, wet-dust removal, cyclone-dust removal, spray-dust removal, and water-film-dust removal. The National Environmental Protection Standard of the People’s Republic of China “Technical specifications for ceramic industry exhaust gas treatment”, published by the Ministry of Ecology and Environment, stated that the treatment of aerosol particles in spray-drying towers is a problematic point in the environmental treatment of building-pottery enterprises. Cylinder-dust removal used to be the spray-drying tower’s main flue-gas treatment facility in China’s pottery industry. Due to the high resistance of cyclone-dust removal and the possibility of flue gas discharging from the bypass, the bag-dust collector is the primary flue-gas-particulate control method of the spray-drying tower in China’s pottery industry. To control particulate matter from the flue gas of pottery kilns, building-pottery enterprises remove particulate matter through wet desulfurization [18].
4.3. Solid Waste of Raw-Material Consumption
The raw materials for pottery are usually sourced from local mineral deposits. Waste in the life cycle of pottery is divided into waste gas, wastewater, and solid waste. The industrial waste discharge in solid waste is 28.77 kg/m2, and the slag is 4400 kg/m, mainly from the waste and production process. The discharge of solid waste in the mining process is counted in the production process, which is shown in Table 6.
Table 6.
Solid waste emissions to the environment from 1 m2 pottery production throughout its life cycle.
The results show that in the pottery life cycle (including raw materials, mining, transportation, production process), solid waste is major environmental impact related to pottery production, followed by industrial smoke and dust, the local impact still takes first place, while the impact of global warming and acidification cannot be ignored.
5. Conclusions
Based on the above calculation, carbon emission per kilogram of the life cycle of pottery is 1.91 kgCO2, of which the carbon emission of raw-material mining accounts for 6.9%, raw-material transportation accounts for 4%, and product production accounts for 89.1%. The link is the main factor affecting the carbon emissions of sanitary pottery. Enhancing the energy-saving effect of the kiln, expanding the quality of raw-material sources, and improving the utilization rate of industrial waste residue can reduce sanitary pottery emissions. In other related studies conducted in the life cycle of building pottery (including the raw-material mining, transportation, and production processes), the environmental noise related to pottery production is mainly solid waste, followed by industrial smoke and dust. Local noise still occupies first place, while the impact of global warming and acidification cannot be ignored [2]. However, reducing the carbon emissions of life-cycle sanitary pottery is essentially a low-carbon product-production process. Otherwise, the carbon emissions of pottery can be reduced by using industrial waste residue as a raw material. However, according to Jie and Weiguo (2014), the slag-utilization rate in the pottery industry is shallow. The utilization rate of waste and waste residue is less than 10% [9]. Industrial solid waste does not require processing, and its carbon emission is zero, so it has a unique advantage in reducing the carbon emission of materials. There is still excellent space for development in the pottery industry to maximize the industrial solid-waste-utilization rate.
Recommendations for reducing carbon emissions and other emissions mainly come from the flue gas of kiln firing and part of the drying stage. The type and quantity of toxic gases in the flue gas are related to the kind of fuel. Cleaner gas fuel is used in foreign countries, resulting in complete combustion and fewer poisonous gas emissions. At the same time, they use the fiber filter bag containing lime to treat the flue gas (lime reacts with the flue gas to produce calcium fluoride, sulfide, carbonate, and other volatile metals) to achieve the purpose of purifying the flue gas. According to the region’s current situation and the production plant, the combustion system should be formed to prevent severe pollution. The gas system should be used as much as possible. Smoke exhaust can be treated with lime filter bags in areas without conditions, such as enterprises using oil as fuel. Coal as a material can be used in an efficient way of feeding, condensing the decontamination method and secondary ventilation method for processing. These methods should be determined according to the kiln structure, such as being secondary to the wind. Because of the Sunan, more than 50 push-board kilns in the region burn coal, and coal-combustion emissions occur when black smoke is produced.
Waste products can be divided into green waste products, fired waste products, glazed waste products, and unglazed waste products. Green waste products mainly come from the molding, drying, and glaze-handling processes. This waste can be recycled in the enterprise. However, the waste green billet after glazing or the waste products after direct firing cannot be reused in some daily pottery production. It can only be used for building filling with the same waste products. Unglazed green waste or blank waste can be completely reused in the enterprise. For the glazed green waste, some rough pottery production can be used in small amounts according to the proportion of mixed clay material. However, most daily pottery production (expansion tools, the second firing of fine pottery, etc.) cannot be used. Otherwise, it will affect the quality of the glaze firing. Most of the waste products can only be used as construction fillers, and a small amount of the waste products can be used as hard materials in proportion after crushing.
There are some recommendations and suggestions for future studies regarding pottery production. At the same time, the pottery-production process accounts for the highest proportion of environmental emissions in the whole life cycle. CO2 accounted for a total of 87.65%. At the same time, clean production is advocated to reduce the emission of pollutants in the whole life cycle of pottery.
According to the environmental impact assessment of the whole life cycle of pottery mentioned above, the energy conservation and emission reduction of China’s building-pottery industry should adopt the following methods as countermeasures:
- (1)
- Consume fewer resources: To use resources efficiently, we should choose the technical route of saving resources, reducing the consumption of resources, and using as few raw resources as possible.
- (2)
- Adopt new technology and save energy in the whole process: The internal energy-saving technology transformation of pottery-manufacturing enterprises should cover raw materials, production equipment, process conditions, and process systems and consider the collocation of different products and specifications, as well as the utilization of three wastes, and constantly improve the production process and the development of new raw materials, and research new technology and formulas.
- (3)
- Adopt new energy-saving technologies: Ref. [19] reported that about 61 percent of the energy consumed in the pottery industry is used in the sintering process. Therefore, in the design of kilns, this adoption of a new type of heat-preservation material is used to enhance the heat-preservation effect of the kiln, and control technology is adopted to make the kiln energy saving reach a new height.
- (4)
- Strengthen energy-conservation management, followed by legislation and the enforcement of energy conservation and environmental protection laws: Vigorously promote the technological innovation of the pottery industry, and develop and popularize new energy-saving products. Formulate energy-consumption standards for the pottery industry, publicize them regularly, transform and improve production lines with backward technical indicators within a time limit, and support and encourage advanced enterprises.
Author Contributions
Conceptualization, A.H.S.; performance and analysis, Y.L. and S.M.; writing, Y.L.; checks and revisions, W.W., Z.H. and L.A.G. All authors have read and agreed to the published version of the manuscript.
Funding
UPM Putra Grant (GP-IPS/2021/9698900).
Institutional Review Board Statement
Not Applicable.
Informed Consent Statement
Not Applicable.
Data Availability Statement
Not Applicable.
Acknowledgments
We thank Universiti Putra Malaysia (UPM) for providing us with their resources for conducting this study, and thanks to the company that provide the data for this study, thanks to all the authors’ contributions to this paper.
Conflicts of Interest
The authors declare no conflict of interest.
Appendix A. Informative Appendix
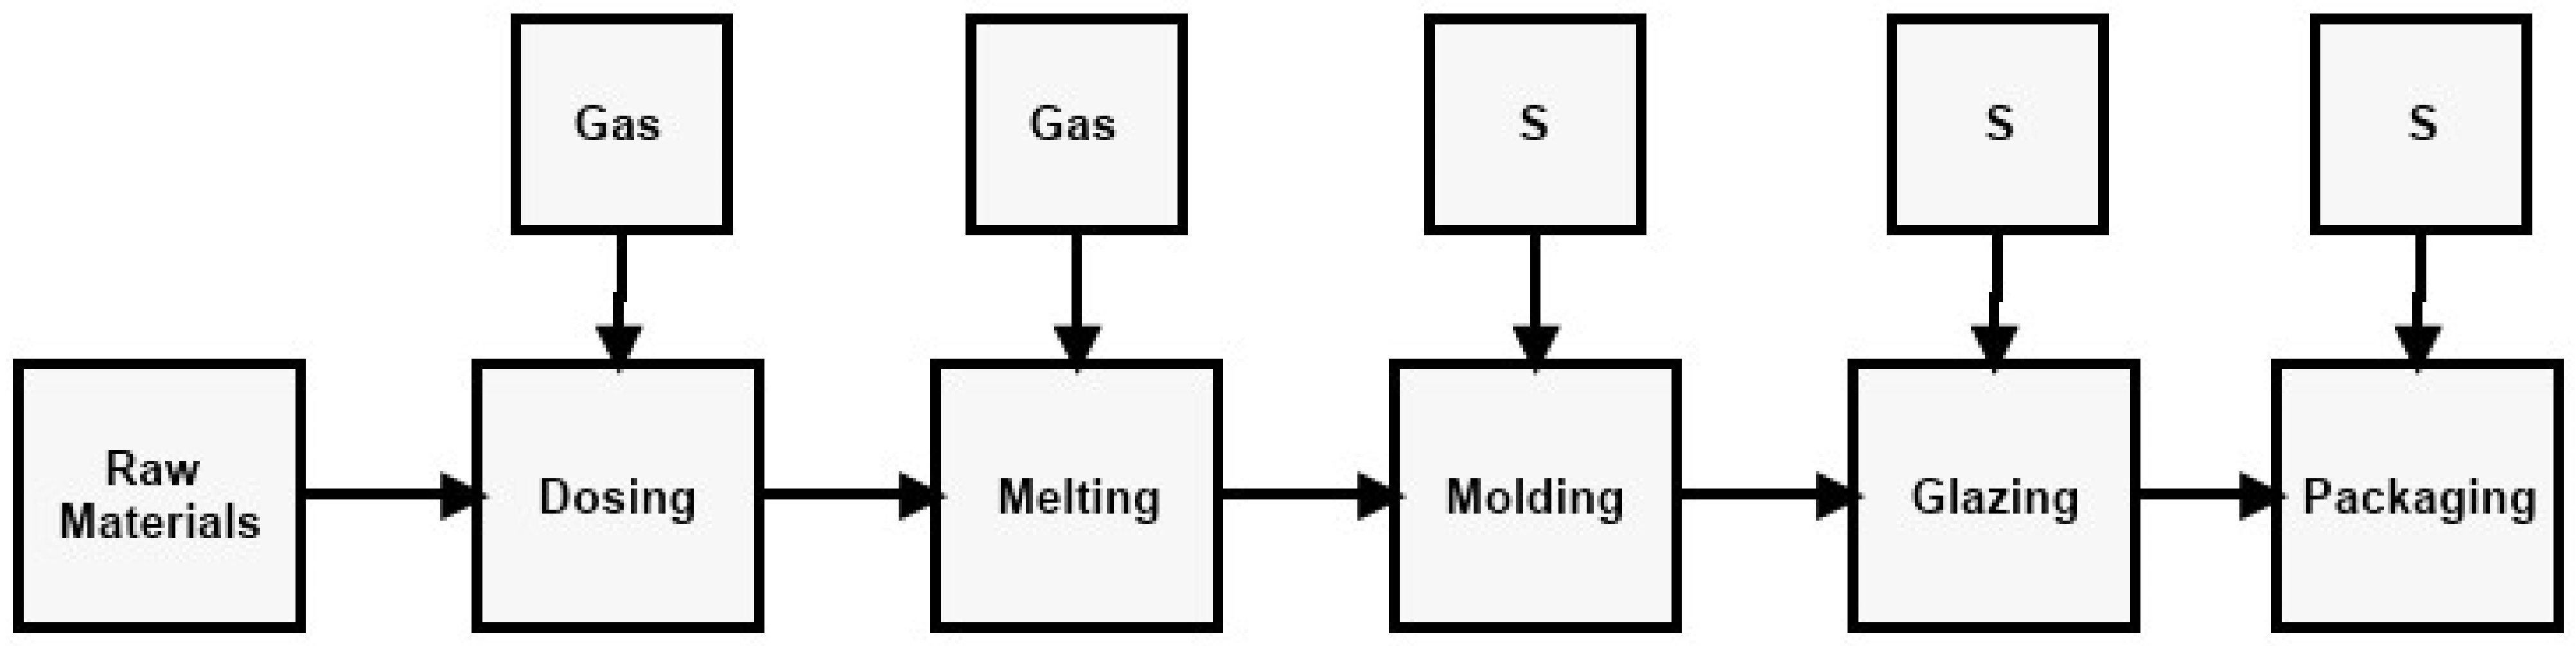
The pottery-production process and main pollution-production nodes.
The typical production process and contaminant-generation nodes of building pottery are shown in Figure A1. Pottery, daily use, and display of art pottery are typical production processes, and pollutant-generation nodes of unique pottery are shown in Figure A1.
Cutline: S—solid waste.

Figure A1.
Typical production process and pollutant-generation node of pottery.
Figure A1.
Typical production process and pollutant-generation node of pottery.
Appendix B. Informative Appendix
Kiln and spray-drying tower air-pollutant initial concentrations are common in pottery-product manufacturing.
Table A1.
Common range of initial concentration of atmospheric pollutants in the kiln of the pottery-manufacturing industry. Unit: Mg/m3.
Table A1.
Common range of initial concentration of atmospheric pollutants in the kiln of the pottery-manufacturing industry. Unit: Mg/m3.
| Manufacturing | Fuel | Kiln Type | Particulate | SO2 | NOx |
|---|---|---|---|---|---|
| Building pottery | Natural gas, liquefied petroleum gas, | Roll kiln | 70–100 | 50–300 | 90–250 |
| Coalbed methane, coke oven gas | |||||
| Building pottery | Coal gas | Roller kiln | 50–200 | 70–600 | 90–250 |
| Sanitary pottery, art pottery for daily use and display, and special pottery | Natural gas, liquefied petroleum gas, Coalbed methane, coke oven gas | Tunnel kiln, shuttle-type Kilns, roller kilns, etc. | 15–30 | 10–30 | 30–180 (Generally < 100) |
Appendix C. Inventory Sheet of Data Sources
The data used in this study are the actual production-monitoring data of Mingchuan Enterprises in Yunnan Province in 2019, which is a modern pottery-production enterprise with a total annual output of 1030 pieces. The enterprise is equipped with modern craft equipment and a production line. The enterprise mainly produces traditional pottery and art pottery. The annual output of traditional pottery products is 980 pieces, accounting for 95% of the total output. For art pottery products, the annual output is 50 pieces, which accounts for 4% of the total output. Secondly, part of the background data design in this study comes from the Chinese Process-based Localization Lifecycle Inventory Database (CPLCID), which contains background data on key processes such as limestone production and energy consumption (electricity consumption, coal mining, etc.), transportation, direct atmospheric emissions, municipal landfill and dumping, sewage treatment, incineration and disposal of industrial hazardous waste, land transportation, infrastructure development. More detailed data are shown in Table A2.
Table A2.
Life-cycle inventories of ceramic-tile production. (Values are presented per functional).
Table A2.
Life-cycle inventories of ceramic-tile production. (Values are presented per functional).
| Type | Unit | Pottery | |
|---|---|---|---|
| Raw material | Kaolin | kg | 1.33 |
| Bentonite | kg | 1.33 | |
| Magnesite | kg | 1.45 | |
| Mud | kg | 11.29 | |
| Inorganic chemical | kg | 1.07 | |
| Limestone | kg | 2.09 | |
| Atmospheric emission | Particulate matter | g | 1.87 |
| CO2 | kg | 0.714 | |
| SO2 | g | 2.37 | |
| Fluoride | g | 0.04 | |
| Chloride | g | 0.14 | |
| Nickel | g | 2.3 |
The LCC analysis’s internal costs (sand, bentonite, magnesite, limestone, power, coal, infrastructure investment, equipment maintenance, labor costs, taxes) are all based on prices quoted in the current Chinese market. Direct emission of carbon credit compensation in external costs comes from China’s carbon-trading network; some of the data will not be presented in this appendix due to corporate confidentiality.
References
- Zhang, S.C.; Xu, W.; Sun, D.N.; Zhang, S.C.; Xu, W.; Sun, D.Y. Study on Calculation Methods’ Determination and Application Scopes of Building Carbon Emission. Build. Sci. 2013, 29, 35–41. Available online: http://www.gbwindows.cn/upFiles/download/OT20140823120409431.pdf (accessed on 27 March 2022).
- Chen, Q.W.; Ma, X.Q. Life Cycle Assessment of Architectural Ceramics. China Ceram; China Institute of Light Industry: Jingdezhen, China, 2008; pp. 36–39. Available online: http://www.cqvip.com/QK/91568X/200807/27544579.html (accessed on 27 March 2022).
- Perera, F. Pollution from Fossil-Fuel Combustion is the Leading Environmental Threat to Global Pediatric Health and Equity: Solutions Exist. Int. J. Environ. Res. Public Health 2017, 15, 16. [Google Scholar] [CrossRef] [PubMed] [Green Version]
- Zelin, W.; Lei, L. Instructions for Compilation of “Guidelines for Feasible Technologies for Pollution Prevention and Control in Ceramic Products Manufacturing Industry”; Institute of Building Materials Industry Technology Information: Beijing, China, 2018. [Google Scholar]
- Ye, L.; Hong, J.; Ma, X.; Qi, C.; Yang, D. Life Cycle Environmental and Economic Assessment of Ceramic Tile Production: A Case Study in China. J. Clean. Prod. 2018, 189, 432–441. [Google Scholar] [CrossRef]
- Yu, H.; Zeng, J. Research and Analysis of Carbon Emissions in the Life Cycle of Building Ceramics. Sichuan Build. Mater. 2016, 2, 130–131. [Google Scholar]
- Liu, C.; Liu, Y.H.; Wang, X.L. Research Report on the Unit Energy Consumption Quota of Building Sanitary Pottery Products. J. Ceram. 2009, 3, 51–54. [Google Scholar] [CrossRef]
- Lu, C.L.; Huang, T.S.; Fang-Lin, F. The Intersection of Potters and Environmental Sustainability-Pottery Glaze Cases. E3S Web Conf. 2019, 93. [Google Scholar] [CrossRef]
- Zeng, J.; Yu, W.G.; Zhang, H. Carbon Footprint of Building and Sanitary Ceramics According to Life Cycle Theory. Available online: http://gsytb.jtxb.cn/CN/Y2014/V33/I1/54 (accessed on 27 March 2022).
- Yang, L. Discussion on Carbon Footprint of Building Sanitary Potterys Based on Life Cycle Theory. Green Build. Mater. 2018, 9. Available online: http://www.cqvip.com/QK/98169B/20183/72667467504849564851484952.html (accessed on 27 March 2022).
- ISO 14040:2006; Environmental Management—Life Cycle Assessment—Principles and Framework. International Organization for Standardization: Geneva, Switzerland, 2006. Available online: https://www.iso.org/standard/37456.html (accessed on 27 March 2022).
- ISO 14044:2006; Environmental Management—Life Cycle Assessment—Requirements and Guidelines. International Organization for Standardization: Geneva, Switzerland, 2006. Available online: https://www.iso.org/obp/ui/#iso:std:iso:14044:ed-1:v1:en (accessed on 27 March 2022).
- Gomes, J.M.; Salgado, A.L.F.; Hotza, D. Life Cycle Assessment of Ceramic Bricks. Mater. Sci. Forum 2012, 727–728, 815–820. [Google Scholar] [CrossRef]
- Liu, T.Z.; Li, J.H.; Nie, Y.F. Study on the Removal of Mercury by Vacuum Distillation in Waste Zinc-Manganese Batteries. Available online: http://www.cqvip.com/qk/90325b/200604/21600283.html (accessed on 28 March 2022).
- Xia, G.H.; Zhao, X.D.; Xie, S.; He, C. Current Situation of Resource Utilization of Solid Waste. Environ. Eng. 2012, 30, 302–305. [Google Scholar] [CrossRef]
- Besier, J. Decarbonisation of the Dutch Ceramic Industry: A Techno-Economic Analysis of Decarbonisation Options; Delft University of Technology: Delft, The Netherlands, 2021. [Google Scholar]
- Lin, J.F.; Zheng, S.; Zhang, X.; Liu, H.Y.; Wei, X.H.; Zhang, M.S.; Dou, Y.; Li, P. Carbon Dioxide Emission Accounting and Reporting Project Results Report for Ceramic Production Enterprises. 2013, pp. 1–80. Available online: https://www.efchina.org/Attachments/Report/reports-20130616-zh/reports-20130616-zh (accessed on 27 March 2022).
- Ministry of Ecology and Environment. Technical Specifications for Ceramic Industry Exhaust Gas Treatment; National Environmental Protection Standards of the People’s Republic of China: Beijing, China, 2018.
- Wang, Q.; Zhang, G. Strategy of Thermal Radiation Coatings in Rongdao Kiln of Ceramic Design Industry. Therm. Sci. 2019, 23, 2793–2800. [Google Scholar] [CrossRef] [Green Version]


Publisher’s Note: MDPI stays neutral with regard to jurisdictional claims in published maps and institutional affiliations. |
© 2022 by the authors. Licensee MDPI, Basel, Switzerland. This article is an open access article distributed under the terms and conditions of the Creative Commons Attribution (CC BY) license (https://creativecommons.org/licenses/by/4.0/).