Article

Development of a Novel Green Bio-Nanofluid from Sapindus Saponaria for Enhanced Oil Recovery Processes

1
Grupo de Investigación Fenómenos de Superficie Michael-Polanyi, Facultad de Minas, Universidad Nacional de Colombia, Sede Medellín Kra 80 No. 65-223, Medellín 050034, Colombia
2
Ecopetrol S.A, Bogota 110311, Colombia
*
Authors to whom correspondence should be addressed.
Processes 2022, 10(6), 1057; https://doi.org/10.3390/pr10061057
Submission received: 11 April 2022 / Revised: 1 May 2022 / Accepted: 12 May 2022 / Published: 25 May 2022
(This article belongs to the Section Energy Systems)

Abstract

:
The main objective of this study is to develop a novel green-nanofluid from Sapindus Saponaria for its application in enhanced oil recovery (EOR) processes. The bio-nanofluid is composed of a green active compound (AGC), bio-ethanol, and commercial surfactant (SB) at a low concentration. The AGC was obtained from soapberry “Sapindus Saponaria” using the alcoholic extraction method and characterized by Fourier transform infrared spectroscopy (FTIR), thermogravimetric analysis (TGA), and critical micellar concentration (CMC) to verify the content of saponins as active agents with surface-active behavior. Three types of silica-based nanoparticles were used and characterized by FTIR, TGA, and dynamic light scattering (DLS) analysis. Two commercial nanoparticles (SiO2-C1 and SiO2-C2) were evaluated, and a third one (SiO2-RH) was synthesized from rice husks as an ecological nanomaterial alternative. The performance of the adjusted systems was evaluated by capillary number (effective interfacial tension ( σ e ), wettability and viscosity) and finally with coreflooding tests under reservoir conditions. The FTIR results confirm the presence of saponins in the AGC. In addition, according to the TGA, the AGC is stable under the reservoir temperature of interest. Regarding nanoparticles, siloxane and silanol groups were observed in all samples. For SiO2-C1 and SiO2-C2 samples, the weight loss was lower than 5% for temperatures up to 700 °C. Meanwhile, SiO2-RH had a weight loss of 12% at 800 °C, and 8% at reservoir temperature. Results show a decrease in the interfacial tension (IFT) of up to 83% of the tuned system with only 100 mg·L−1 of rice husk nanoparticles compared to the system without nanoparticles, reaching values of 1.60 × 10⁻¹ mN·m−1. In the coreflooding test, increases of up to 13% of additional crude oil were obtained using the best bio-nanofluid. This work presents an excellent opportunity to include green alternatives to improve conventional techniques with added value during the injection of chemicals in chemical-enhanced oil recovery (CEOR) processes.

1. Introduction

Enhanced oil recovery processes (EOR) have been studied and implemented globally as they allow reservoir reserves to be increased and sustain the current demand for hydrocarbons [1]. The most used technologies in EOR processes are gas injection [2], steam [3], and chemicals [4], which lead to improved crude oil mobility, restoring pressure, and reducing residual oil saturation in the reservoir [5,6]. One of the most used processes in the oil industry is surfactant flooding as a recovery mechanism due to the amphiphilic properties of said substances [7,8,9]. According to their chemical nature [10,11,12], they are located at the crude oil/brine interface, allowing reductions in interfacial tension measurements to improve crude oil sweep [13].
Surfactants can be classified as anionic, cationic, amphoteric, or non-ionic [14,15]. Each of them has a different dissociation power in the presence of an electrolyte [16]. Therefore, the rock/surfactant and surfactant/crude oil/brine interactions will depend closely on the type of surfactant used [17,18]. These amphiphilic compounds can be synthesized from different sources, whether synthetic or biological [19,20]. Currently, due to the concern of the oil industry to reduce the environmental impact generated by its activities and possibly reduce the costs associated with chemical injection processes [21,22,23], it has opted for the study and evaluation of biosurfactants as a profitable and environmentally friendly alternative to obtain increases in the recovery factor of the oil fields and the sustainability of the process [20,24].
In this sense, different studies have focused on using plant sources with a high content of saponins for the extraction of surfactants [25]. This is because the primary source of these compounds are agro-industrial residues, for which their extraction is economical and eco-friendly [26,27]. The saponins are naturally occurring plant glycosides known as non-ionic surfactants with a hydrophilic and hydrophobic dual molecular structure [28], characterized by their foam-forming solid properties in an aqueous solution [29]. Compared to synthetic surfactants, they are biodegradable, have low toxicity, and have a low critical micellar concentration (CMC), making them an excellent alternative to be used in EOR processes [16].
Further, several studies have focused on extracting biosurfactants for their application in EOR processes [30,31,32,33,34,35]. Bachari et al. [31] show a brief review of some investigations of natural surfactants for enhanced oil recovery, including those produced from the leaves of olive, Spitan, Prosopis, and Mulberry, among others. Zyzyphus Spina Christi, Soapnut, and Chamomilla plants showed great potential for their use by reducing the tension to values between 3 and 10 mN·m−1. Chhetri et al. [32] evaluate soapnut extract as a natural surfactant for EOR. Its results present a reduction in IFT by dosages of 10,000, 20,000, 40,000, 80,000 and 12,000 mg·L−1, with the lowest IFT value of 3.25 mN·m−1 at the concentration of 10,500 mg·L−1. Deymeh et al. [33] studied the ability of Seidlitzia Rosmarinus as an EOR agent by considering IFT reduction, showing that IFT was reduced from 32 to 9 mN·m−1. Likewise, Al-Wahaibi et al. [34] investigated biosurfactants from Bacillus subtilis strain B30 from glucose, sucrose, and starch, among others, as an enhanced recovery method from coreflooding tests. The minimum interfacial tension (3.79 mN·m−1) found was for the biosurfactant from glucose in a system with concentrations of 300–500 mg·L−1. Seo et al. [35] tested non-ionic surfactants derived from tannic acid; the recovery measured in a microfluidic system determined an increase of approximately 20% in the cumulative oil recovery percentage compared to the system with a commercial surfactant (sodium dodecyl sulfate—SDS) due to a more significant reduction in interfacial tension. Recently, Nowrouzi et al. [30] studied a herbal extract from Anabasis Setifera for application in the EOR process. Results show a decrease in IFT from 25.608 to 1.066 mN·m−1 at CMC of 3000 mg·L−1.
These studies have shown that biosurfactants cannot obtain low values of IFT [11,31] and reduce the oil residual saturation. Therefore, the addition of nanoparticles emerge like a good option [36,37] since they have been proven in laboratory studies and field applications to promote efficient oil recovery; even under interfacial tension scenarios in the range of 1 × 10⁻¹ mN·m−1, whereas conventional surfactant flooding processes require ultra-low values (less than 1 × 10⁻³ mN·m−1) [38,39], so the use of nanoparticles will result in the reduction in oil residual saturation (Sor). In addition, nanotechnology reduces the adsorption of the surfactant in the rock [38] and, in some particular cases, the controlled and efficient delivery of the surfactant to the crude oil/brine interface is possible.
Multiple authors have tested the effectiveness of biosurfactants in synergy with different types of nanoparticles as an enhanced recovery method [40,41,42,43]. Foroughi et al. [43] studied the effect of silica nanoparticles on two synthesized amino-acid surfactants (L-arg and L-cys). The results show reductions in IFT from 35 to 16 mN·m−1 at dosages of 10,000 mg·L−1 of silica nanoparticles and 2000 mg·L−1 of L-arg and reduction from 35 to 15.5 with 4000 mg·L−1 of L-cys with 10,000 mg·L−1 of silica nanoparticles. Tavakoli et al. [41] used a henna extract as a natural surfactant combined with synthesized nanoparticles (dioxide titanium TiO2, silicon dioxide SiO2, graphene, and the composite of TiO2/graphene). The IFT measurements between kerosene and water show reductions from 18.43 to 14.57 mN·m−1 by including 1 wt% of TiO2 nanoparticles in the henna extract surfactant. Yekeen et al. [42] used a natural surfactant from soapnut (Sapindus Mukorossi). Under reservoir conditions (80 °C and 8 MPa), the system with 5000 mg·L−1 of biosurfactant and 500 mg·L−1 of SiO2 nanoparticles was able to reduce the tension from 23.24 to 0.87 mN·m−1. In the absence of nanoparticles, the system only reduced the interfacial tension to 1.59 mN·m−1.
These studies have demonstrated the ability of biosurfactants to increase oil recovery through a decrease in interfacial tension that results in an increase in the mobility of crude oil. However, to achieve tensions lower than 1 × 10⁻¹ mN·m−1, systems with high concentrations of surfactant and nanoparticles have been used, possibly generating formation damage due to a large concentration of micelles and nanomaterials, which can block the flow channels in the porous medium [39].
According to the specialized literature, the mixture of two or more surfactants is essential to achieving low interfacial tensions [44,45]. Additionally, according to the hydrophilic–lipophilic deviation (HLD) theory, which relates the affinity of the surfactant for the aqueous and oil phase, the addition of an alcoholic type of co-solvent can generate systems with lower interfacial tension at low concentrations [13,46,47]. In this way, the mixture of surfactants supposes to be a highly viable option to reduce the interfacial tension in crude oil/brine systems.
Therefore, the main objective is to design a bio-nanofluid to reduce interfacial tension below 1 × 10⁻¹ mN·m−1, to be efficiently applied in the enhanced chemical oil recovery at low concentrations of surfactant and nanoparticles, with an added value by the inclusion of active compounds from a natural source mixture with nanomaterials. The study was divided into three steps: (1) synthesis and characterization of the active green phase and silica-based nanoparticles; (2) static evaluation of the bio-nanofluid under interfacial phenomena, wettability alteration, and sorption phenomena; and (3) dynamic evaluation by coreflooding test at low pressure and reservoir conditions. This work is expected to generate a promising scenario for synthesizing biosurfactants potentiated with nanoparticles for efficient, cost-effective, and environmentally friendly EOR processes.

2. Materials and Methods

2.1. Materials

Soapnut fruit Sapindus Saponaria pericarp shell samples were collected from Colombian trees located in Medellín (Antioquia, Colombia). Alcoholic solvents such as ethanol (99% purity) were obtained from Merck KGaA (Darmstadt, Germany) for natural surfactant extraction and synthesis. The SB commercial anionic surfactant (density of 0.98 g·mL−1, CMC of 300 mg·L−1, and HLB of 11) was acquired from a study due to its excellent performance in a field application in Colombia, where an incremental production greater than 20% was obtained based on its ability to increase crude oil mobility and reduce residual oil saturation [41]. Ecopetrol S.A provided the bio-ethanol used in the mixture of surfactants. This was obtained from sugar cane bagasse and industrial waste from the production of African palm oil as an ecological alternative that does not compete with food security and generates added value to agro-industrial waste.
Three kinds of nanoparticles were employed for experiments, silica-based nanoparticles purchased from Sigma-Aldrich (Saint Louis, MO, USA) named SiO2-C1, provided by Petroraza S.A.S (Medellín, Colombia). Finally, the synthesis of the silica-based nanoparticles synthesized in-house from rice hulls as a green alternative named SiO2-RH is detailed in previous studies [48].
Sodium Chloride—NaCl (PubChem, Bethesda, MD, USA), Potassium Chloride—KCl (PubChem, Maryland, USA), Calcium Chloride Dihydrate—CaCl2·2H2O (Sigma-Aldrich, USA), Magnesium Chloride Dihydrate—MgCl·2H2O (Sigma-Aldrich, USA) and Barium Chloride Dihydrate—BaCl2·2H2O (Sigma-Aldrich, USA) were used for synthetic brine solution in dosages of 5.72 g·L−1, 7.41 g·L−1, 1.35 g·L−1, 0.38 g·L−1, and 0.09 g·L−1 respectively, formulated to resemble the composition of an injection brine of a Colombian field. The fundamental characterization of prepared brine shows the conductivity of 24.33 mS·cm−1, pH at 25 °C 8.04 units measured by pH-meter (Horiba Navih), viscosity at 1.058 cP, and density of 1.011 g·cm−3 measured by densimeter Anton Paar SVM3000.
An intermediate Colombian crude oil of 21°API with saturate, aromatic, resin, and asphaltene (SARA) contents in mass fractions of 28.2, 14.4, 52.7, and 4.7% was employed for the interfacial tension (IFT) and contact angle measurements, and coreflooding test. Crude oil had a dynamic viscosity of 166.6 cP and surface tension of 29.5 mN·m−1 at 25 °C. API gravity measurement was conducted according to ASTM D1250 standard, while SARA analysis followed the IP 469 method using an Iatroscan MK6 thin-layer chromatography (Iatron Labs Inc., Tokyo, Japan). A heavy crude oil of 7° API was used for wettability restoration of the cores to an oil-wet state for contact angle measurements.

2.2. Methods

A novel bio-nanofluid was designed for its implementation in the EOR process. A mixture of surfactants was made (Saponin extracted from Sapindus Saponaria, bio-ethanol, and commercial SB surfactant) and improved with silica-based nanoparticles. The tests began with the characterization of the saponin extracted from Sapindus Saponaria and silica-based nanoparticles. Subsequently, the bio-nanofluid was designed based on fluid-fluid and fluid-rock performance tests through interfacial tension (IFT) measurements, contact angle, and adsorption tests. Finally, the system was tested under dynamic conditions through a laboratory scale and under reservoir conditions coreflooding test.

2.2.1. AGC Extraction

The active green component (AGC) of the bio-nanofluid was extracted from Sapindus Saponaria due to the high content of saponins (which have specific amphiphilic behavior properties) [49] and the accessibility to the raw material [50,51,52,53]. Saponin extract from soapnut was based on soxhlet alcoholic extraction to isolate active saponin compounds [54,55,56]. The soapnut fruits pericarp shell was dried in an oven at 50 °C for 36 h, then crushed to a fine powder, and added to the extraction solution (70% v·v−1 ethanol in deionized water) at a ratio 1:3. The mixture was continuously stirred for 48 h at 60 °C. Finally, the solution was filtered and purified by dried and solvent evaporation for 12 h [54,55,56].

2.2.2. Characterization of AGC and Silica-Based Nanoparticles

The AGC was characterized by Fourier transform infrared spectroscopy (FTIR) (Shimadzu Corporation, Japan) for chemical composition identification, thermogravimetric analysis (TGA) for thermal stability identification, CMC (critical micelle concentration), and HLB (Hydrophilic–lipophilic balance) determination. FTIR analysis [57] for the liquid sample was performed using a standard of 2-propanol with an infrared spectrometer IRAffinity 1S at room conditions with ten sweeps per minute in the range of 600–4000 cm−1 at a resolution of 1 cm−1. Thermogravimetric analysis was performed on 15 mg of extract conducted under an air atmosphere heated at a flow of 40 mL·min−1 and a rate of 20 °C·min−1 from 30 to 200 °C. CMC test was carried out with surface tension (IFT) measurements at different dosages of AGC in an aqueous solution (formulated brine). The CMC was estimated according to a change in the slope in the plot of IFT vs. concentration. This is accomplished by equalizing IFT curves before and after CMC. Their respective HLB measurement was performed by the method proposed by Chun et al. [58], based on interfacial tension (IFT) measurements between the aqueous solution with AGC and crude oil at a temperature of 25 °C. The measurement of IFT was performed by the Du Noüy ring method in a tensiometer Sigma703D. The value of HLB was calculated based on Equation (1), where σ (mN·m−1) is the IFT measurement between the aqueous solution with surfactant and toluene.
H L B = σ 45.7 2.36
The nanoparticles were characterized by Fourier transform infrared spectroscopy (FTIR) coupled with an infrared spectrometer IRAffinity 1S (Shimadzu Corporation, Kyoto, Japan) for chemical composition identification, thermogravimetric analysis by TGA (Q50, Instruments) for thermal stability identification, and dynamic light scattering (DLS) using a nanoplus-3 (Micromeritics, Norcross, GA, USA) for particle size. For the FTIR test, the KBr solution was mixed with the nanoparticles at a KBr:nanoparticles weight ratio of 30:1. Measurements for each sample were taken in the range of 600–4000 cm−1 at 2 cm−1. Thermogravimetric analysis was performed on 5.0 mg for each nanoparticle conducted under an air atmosphere at flow rate of 40 mL·min−1 and a heating rate of 20 °C·min−1 from 30 to 700 °C. The nanoparticles were dispersed in deionized water in concentrations below 50 mg·L−1 using an Elmasonic E15H ultrasonic bath (ELMA, Singen, Germany) at room temperature for 4 h for the DLS measurements. The resultant pH of all nanoparticles dispersions was 7.1 ± 0.2, resulting in high stability due to the point of zero charge of silica-based nanoparticles that can be found between 2 and 3 [59,60,61,62].

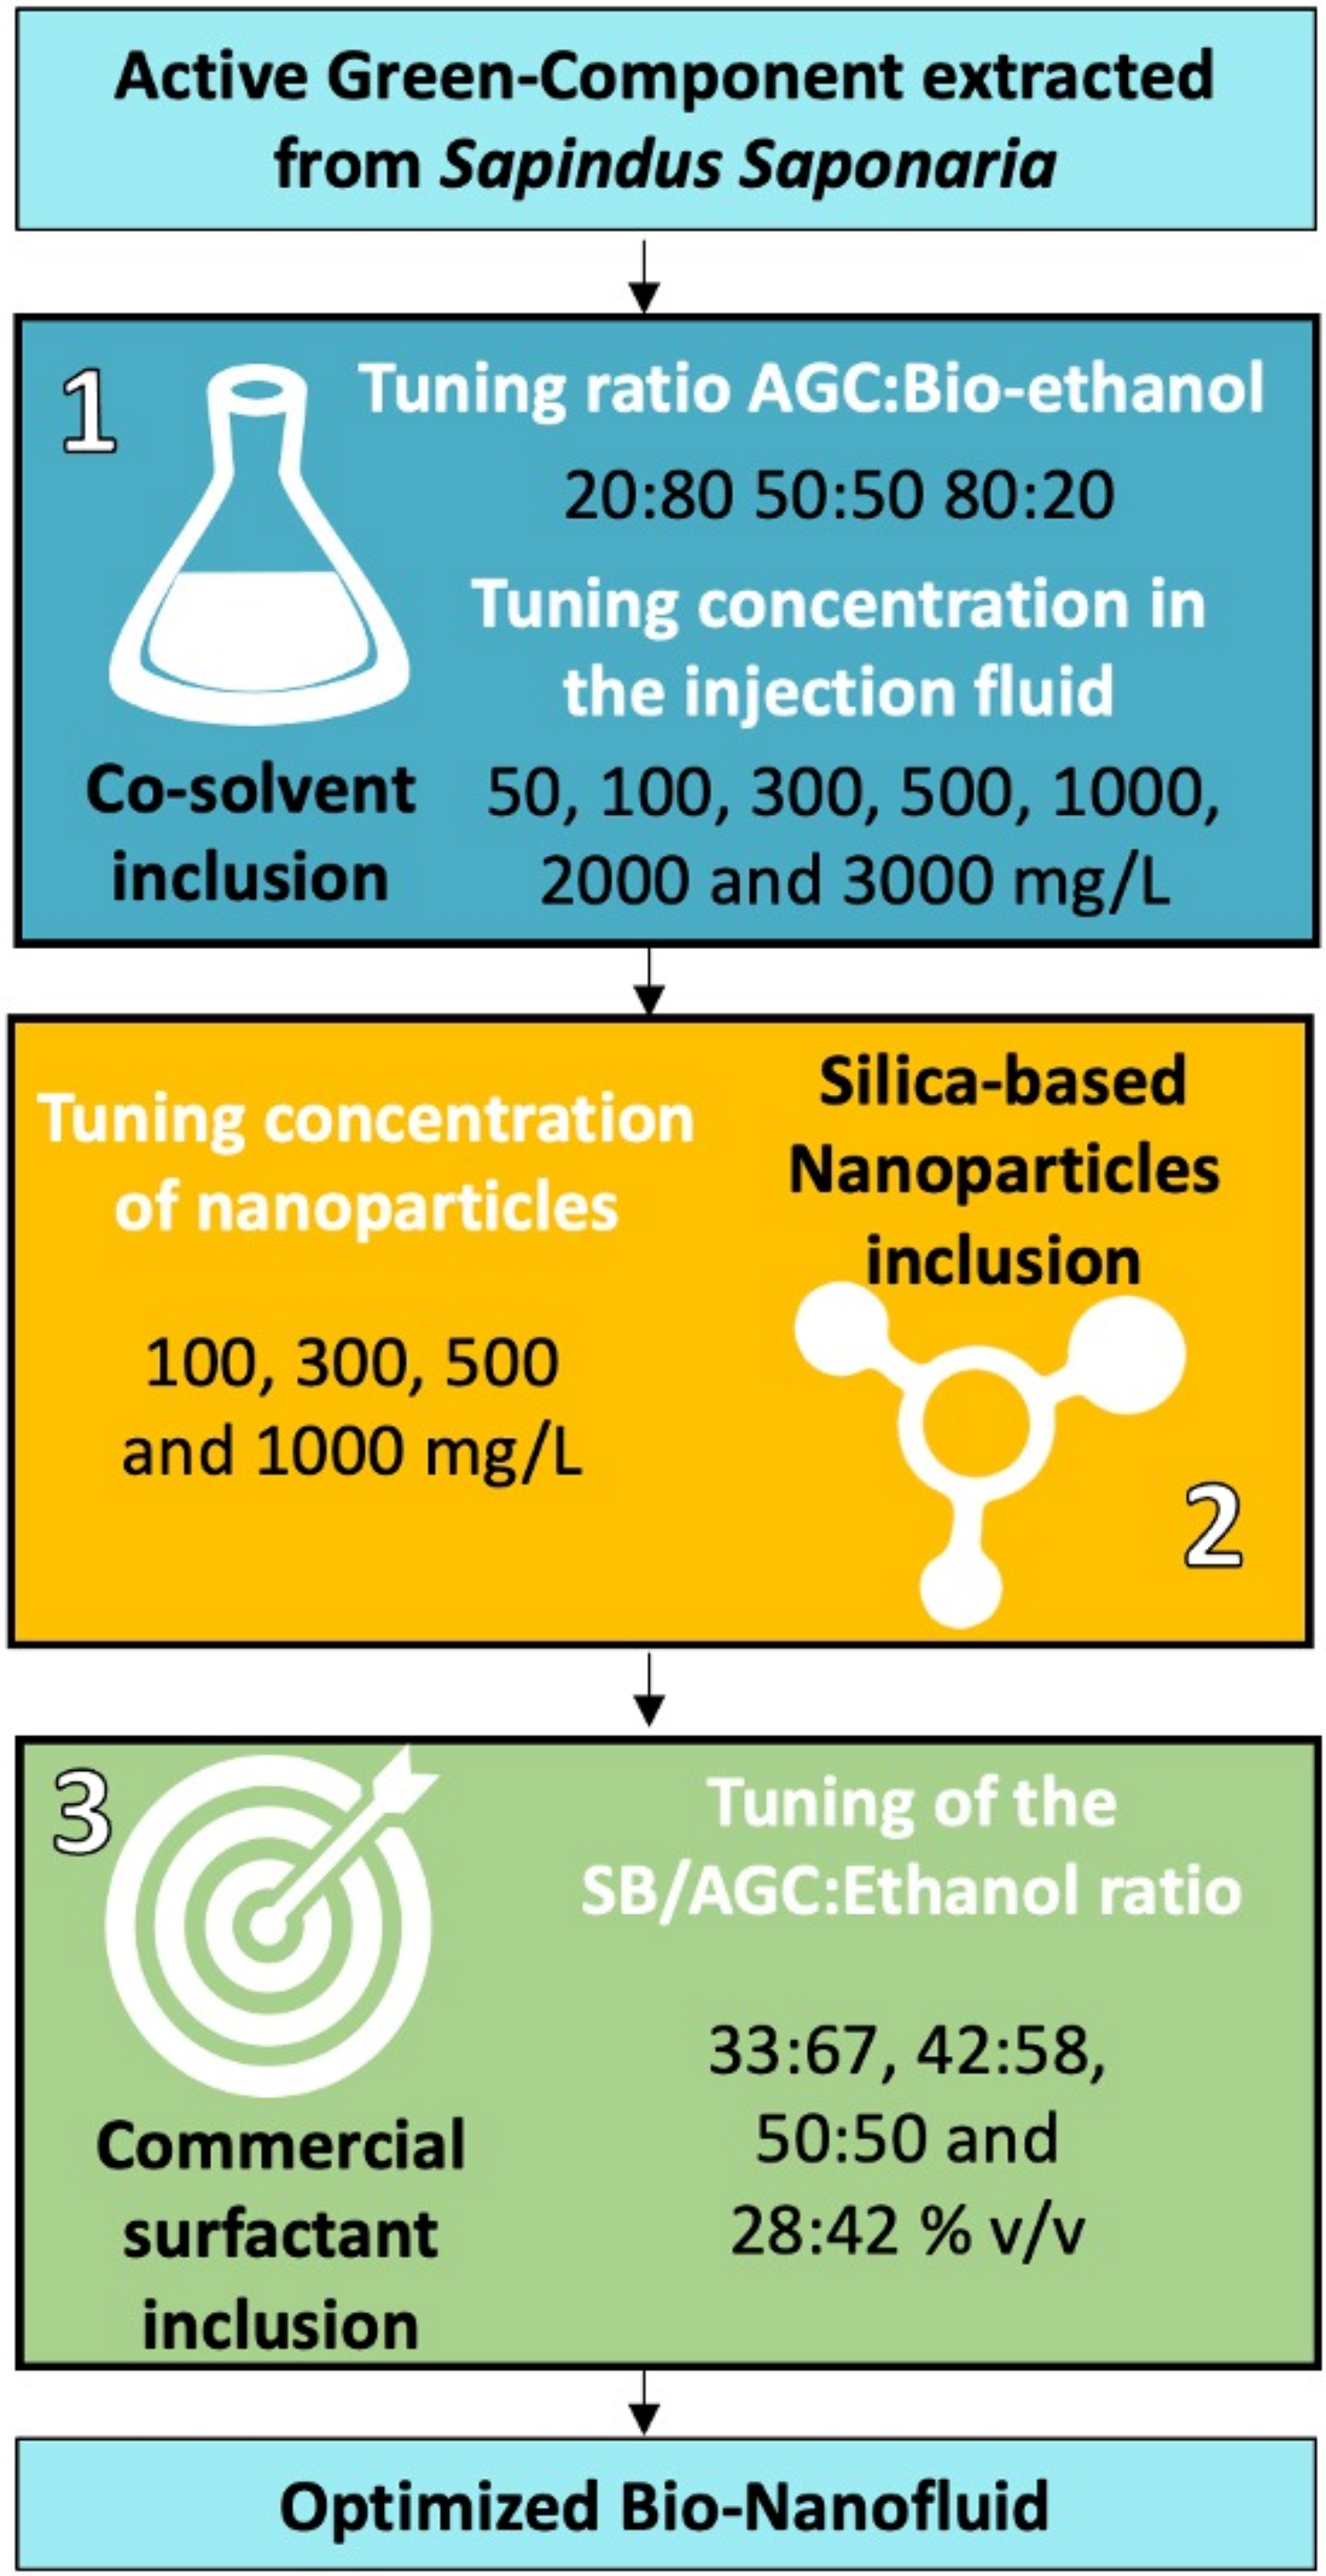
2.2.3. Bio-Nanofluid Design

The main objective of surfactant use for enhanced oil recovery is to look for the reduction in the residual oil saturation, which is achieved with the vanishing of capillary phenomena into porous media by obtaining minimum interfacial tension between the aqueous and oil phase [63]. According to specialized literature, surfactant and co-surfactant mixtures are employed to obtain lower values of IFT (corresponding to HLD near to zero) and thermodynamic stability in the system [13,46,47,64]. Thus, for the enhancement of the performance of the bio-fluid, a mixture of bio-ethanol and the commercial surfactant SB [38] was included with the AGC component to reduce interfacial tension. Then, the system was optimized with the inclusion of silica-based nanoparticles to form the bio-nanofluid. Interfacial tension was selected as the target property due to its importance in the chemical oil recovery processes and its correlation with the dimensionless value of the capillary number.
For this, the work route presented in Figure 1 was followed. Thus, the work path shows the evaluation of three main effects: (1) Effect of bio-ethanol inclusion: ratios of 20:80, 50:50, and 80:20 AGC:bio-ethanol were evaluated as tuning variables. Subsequently, the optimal AGC:bio-ethanol system was evaluated at concentrations of 50, 100, 300, 500, 1000, 2000, and 3000 mg·L−1 in the injection fluid (Brine). (2) Effect of the silica-based nanoparticles inclusion: with the fixed concentration of the AGC:bio-ethanol system in the injection fluid, the capacity of silica-based nanoparticles (SiO2-C1, SiO2-C2, and SiO2-RH) to reduce interfacial tension was evaluated. For this, concentrations of 100, 300, 500, and 1000 mg·L−1 were evaluated; and (3) Effect of SB inclusion: having the fixed concentration of nanoparticles to be used, the effect of the commercial surfactant on the IFT is determined under the SB/AGC:bio-ethanol volume ratios of 33:67, 42:58, 50:50, and 28:42.
The tuning methodology was an assessment following a similar pathway, as reported in previous studies [38]. The optimal bio-nanofluid is designed to evaluate adsorption, capillary number, and oil recovery.
IFT experiments were performed between the aqueous solution and the crude oil. IFT measurements were performed through two methods determined by the ranges of IFT. For IFT values above 1.0 mN·m−1, the Du Noüy ring Method was used in the Du-Noüy tensiometer provided with a platinum-iridium ring (Kruss, Alemania, Germany) [65,66]. For values below 1.0 mN·m−1, a spinning drop tensiometer M6500 (Grace instruments, Houston, USA) was used [67]. In this method, a drop of crude oil is added to the aqueous solution arranged in a capillary. The interfacial tension values are calculated by the Vonnegut equation (Equation (2)) [68,69] when the system reaches the equilibrium, taking into account the elongation of the drop when subjected to a rotational force, as follows:
σ = 1.44   e 7 · Δ ρ · D 3 · θ r 2
where σ (mN·m−1) is the interfacial tension between the aqueous fluid and crude oil, Δ ρ is the density difference of the fluids, θ r (rpm) is the angular velocity, and D (mm) is the diameter of the oil phase drop.
The interfacial tension is also related to the nanoparticles’ binding energy ( Δ E ) at the crude oil/brine interface [70,71,72]. In this way, the bond strength of each type of silica-based nanoparticle with the formation fluids can be determined using the binding energy Equation (3).
Δ E = π R 2 σ a σ p η
where R (m) is the radius of a nanoparticle, σ a (mN·m−1) is the interfacial tension of the system in the absence of nanoparticles, σ p (mN·m−1) is the interfacial tension of the system in the presence of nanoparticles, and η is a fixed value corresponding to the compact structure at the crude oil/brine interface.

2.2.4. Adsorption Test

Adsorption isotherms were performed to determine sorption interaction between the tuned bio-nanofluid system. The methodology was based on previous works [36,73]. Adsorption batch experiments were conducted under room conditions by fixing the adjusted system bio-fluid concentration and varying the dosage of each nanoparticle between 100 and 1000 mg·L−1. The surfactant concentration was selected according to optimal results from the previous tuning section. Initially, tuning the aqueous solution, and then nanoparticles are included. Each system was stirred at 200 rpm for 24 h to ensure adequate dispersion and interaction. The adsorptive capacity was determined by the thermogravimetric method using a TGA analyzer (Q50, TA Instruments Inc., New Castle, DE, USA), based on the quantification of mass decomposition associated with the amount adsorbed compared to adsorbent without adsorbate [36,74]. Estimation of amount of bio-fluid adsorbed over nanoparticles surface was estimated by Equation (4).
N = C i C E M
where C i (mg·L−1) and C E (mg·L−1) are the initial concentration of the bio-fluid in an aqueous solution and the equilibrium concentration of bio-fluid, respectively. M (g·L−1) is the mass ratio of the nanoparticles and solution volume. The adsorption was evaluated at temperatures of 25, 40, and 50 °C.
To figure out the adsorptive behavior of the biosurfactant system onto nanoparticles we used the solid–liquid equilibrium (SLE) model developed by Montoya et al. [75], which is related to the adsorption of self-assembly molecules, such as surfactants on the nanoparticle’s surface [38,73,76]. SLE model is described by Equations (5) and (6).
C E = ψ H 1 + K ψ e x p ψ N m
ψ = 1 + 1 + 4 K · N m · N N m N 2 K
where N m (mg·g−1) is the maximum adsorption capacity, H (mg·g−1) is the Henry’s constant related to the adsorbent–adsorbate affinity, and K (g·g−1) is a constant related to the adsorbate–adsorbate interaction after the formation of a bio-fluid self-association on the nanoparticle’s surface. The root square mean error in Equation (7) ( R S M E % ) determined the model’s accuracy, where p represents the amount of data used.
R S M E % = i p ( X e x p e r i m e n t a l , i X m o d e l e d , i ) 2 p
Finally, changes in enthalpy “ Δ H a d s o r p t i o n 0 ” (kJ·mol−1), entropy “ Δ S a d s o r p t i o n 0 ” (J·(mol·K)−1), and the Gibbs free energy “ Δ G a d s o r p t i o n 0 ” (J·mol−1) of adsorption are calculated to determine the thermodynamic nature of the adsorption reaction. For this, Equations (8)–(10) were used [75,77].
Δ H a d s o r p t i o n 0 = K 1 R
Δ S a d s o r p t i o n 0 = K 0 R
Δ G a d s o r p t i o n 0 = R T L n K
where K 1 and K 0 are values related to the enthalpy and entropy of the reaction, respectively, and R = 8.314472 J·(mol·K)−1.
A similar methodology was used to determine the adsorption of the bio-nanofluid in the rock. For this case, the amount of sand representative of the reservoir was fixed and put in contact for 24 h with aqueous solutions with concentrations of 100, 500, and 1000 mg·L−1.

2.2.5. Capillary Number

The capillary number ( N c ) expression as a dimensionless number is a crucial factor directly related to the sweep efficiency of displacement fluid of EOR methods [78,79,80]. This expression shows insights about mechanisms involved in oil mobilization in the reservoir, evaluating the performance of the EOR method. It can approximate efficiency for the scenarios considered of the tuned bio-nanofluid system in the presence and absence of nanoparticles. The capillary number is related to properties such as IFT, wettability condition of the porous media, flow velocity, and viscous forces, as described in Equation (11) [81]:
N c = υ μ σ e cos θ
where μ (Pa·s) is the viscosity of the displacement fluid (brine), υ (m·s−1) is the average fluid velocity, σ e (N·m−1) the effective interfacial tension after adsorption of the bio-nanofluid on the rock and nanoparticles, and θ is the contact angle related to the water wettability of the porous medium [82].
Wettability measurements were conducted through contact angle measurements to evaluate affinity preferences between rock and fluids. For this work, the affinity of surface rock was determined toward the water phase. In order to restore wettability to a representative condition of the reservoir, an aging process was performed to induce oil wettability in the outcrop samples following the methodology of previous studies [83]. Then, during the aging process, the outcrops were soaked in the respective aqueous solution to evaluate the presence and absence of nanoparticles for 48 h, and afterward were dried at 100 °C for 12 h. Each outcrop sample’s contact angle was measured using a theta optical tensiometer (Biolin Scientific, Gothenburg, Sweden) equipped with a high-definition camera for water/air/rock system at reservoir temperature (see Figure 2). The rock samples were positioned in the equipment, and a drop of brine was deposited onto the sample surface. The high-definition camera recorded sequent drop deformation, and the software calculated the contact angle in real time [73,84].

2.2.6. Coreflooding Test

The potential for enhancing the oil recovery with the tuned bio-fluid system in the presence and absence of silica-based nanoparticles was evaluated through a coreflooding test conducted under reservoir conditions with a synthetic core designed with representative mineralogy of the reservoir. Two core samples were used for the tuned bio-fluid system; a baseline and the system with nanoparticles. The properties are detailed in Table 1. Initially, petrophysical properties such as porosity, water, and oil effective permeability were estimated with stages of water and oil saturation of porous media remaining in the recovery factor baseline (waterflooding as secondary recovery), ensuring additional brine injection up to the condition of constant recovery factor, as has been reported in previous works [38]. Then, tertiary recovery oil is continued by treatment injection with 5 PVs of the bio-fluid or bio-nanofluid. Finally, 10 PVs of brine were injected to determine the final recovery factor. Figure 3 shows the schematic representation of the setup used for the coreflooding test. Further, to ensure that the injectivity condition of the fluids through porous media, the pressure drop profiles during the coreflooding test were recorded at all times.

3. Results

The results section is divided into seven sections: (i) Characterization of AGC and nanomaterials, (ii) Effect of bio-ethanol inclusion, (iii) Effect of the silica-based nanoparticles inclusion, (iv) Effect of SB inclusion, (v) Bio-fluid adsorption, (vi) Capillary Number Estimation, and (vii) Coreflooding tests.

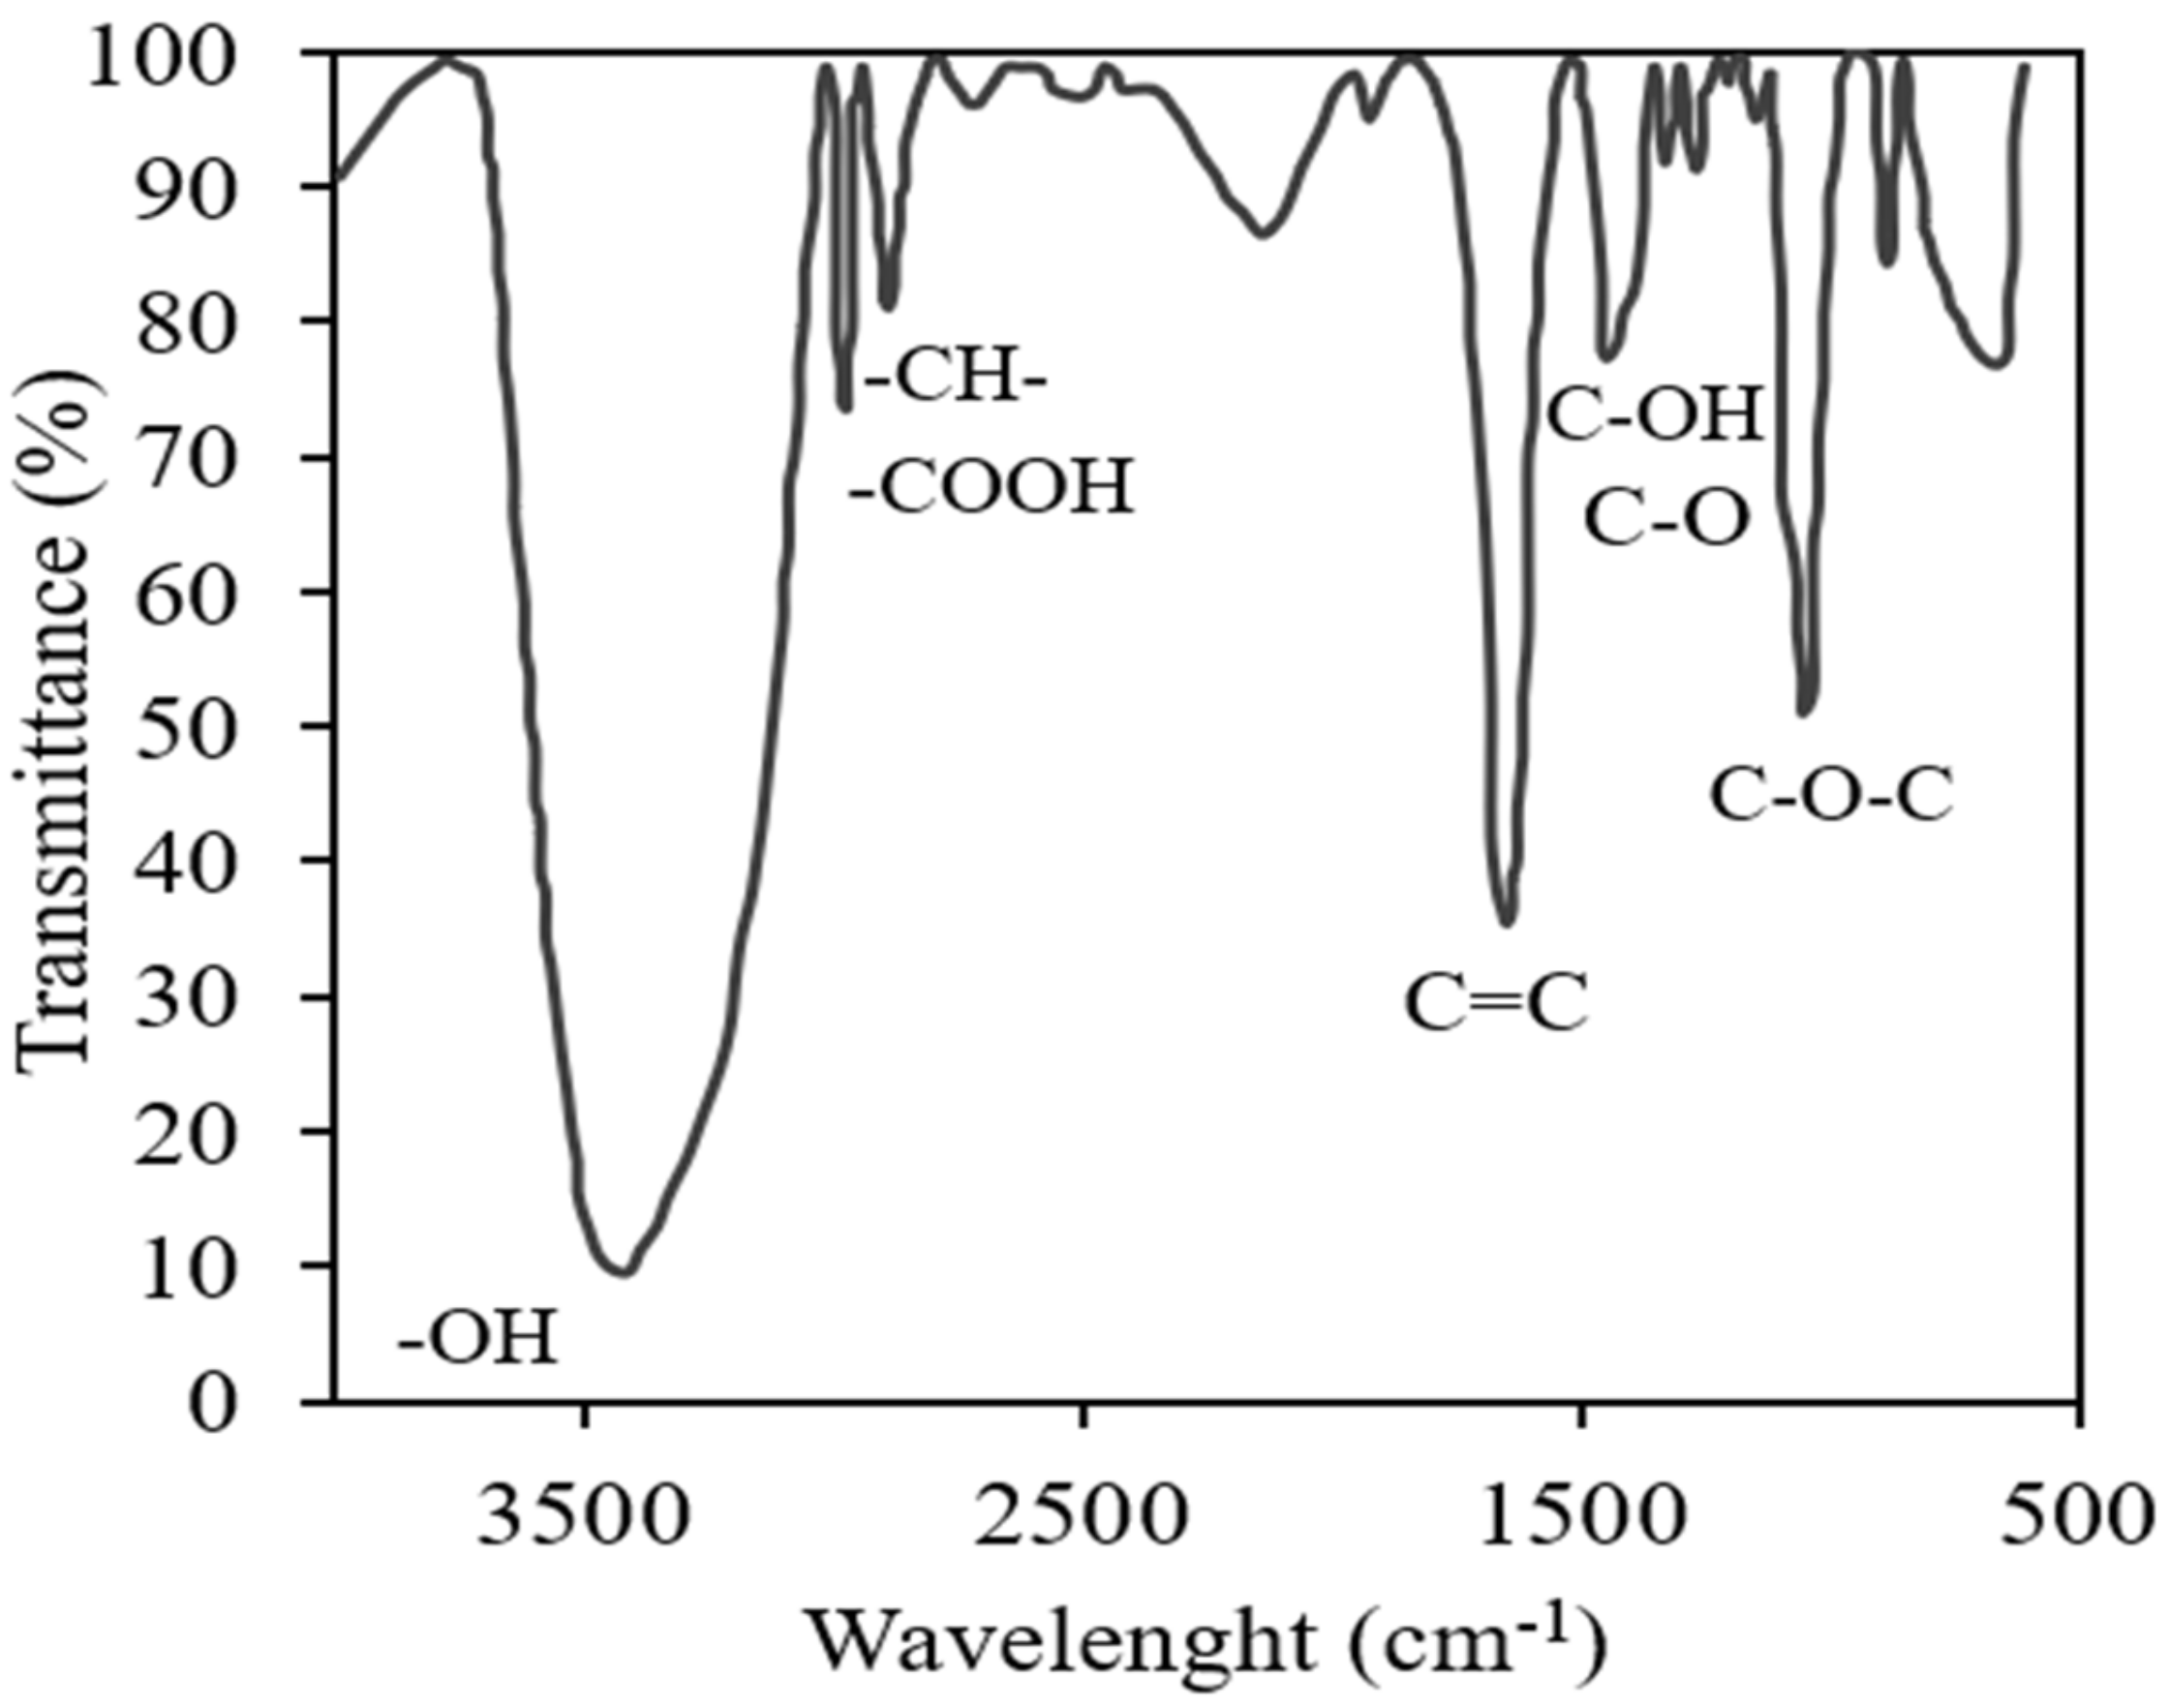
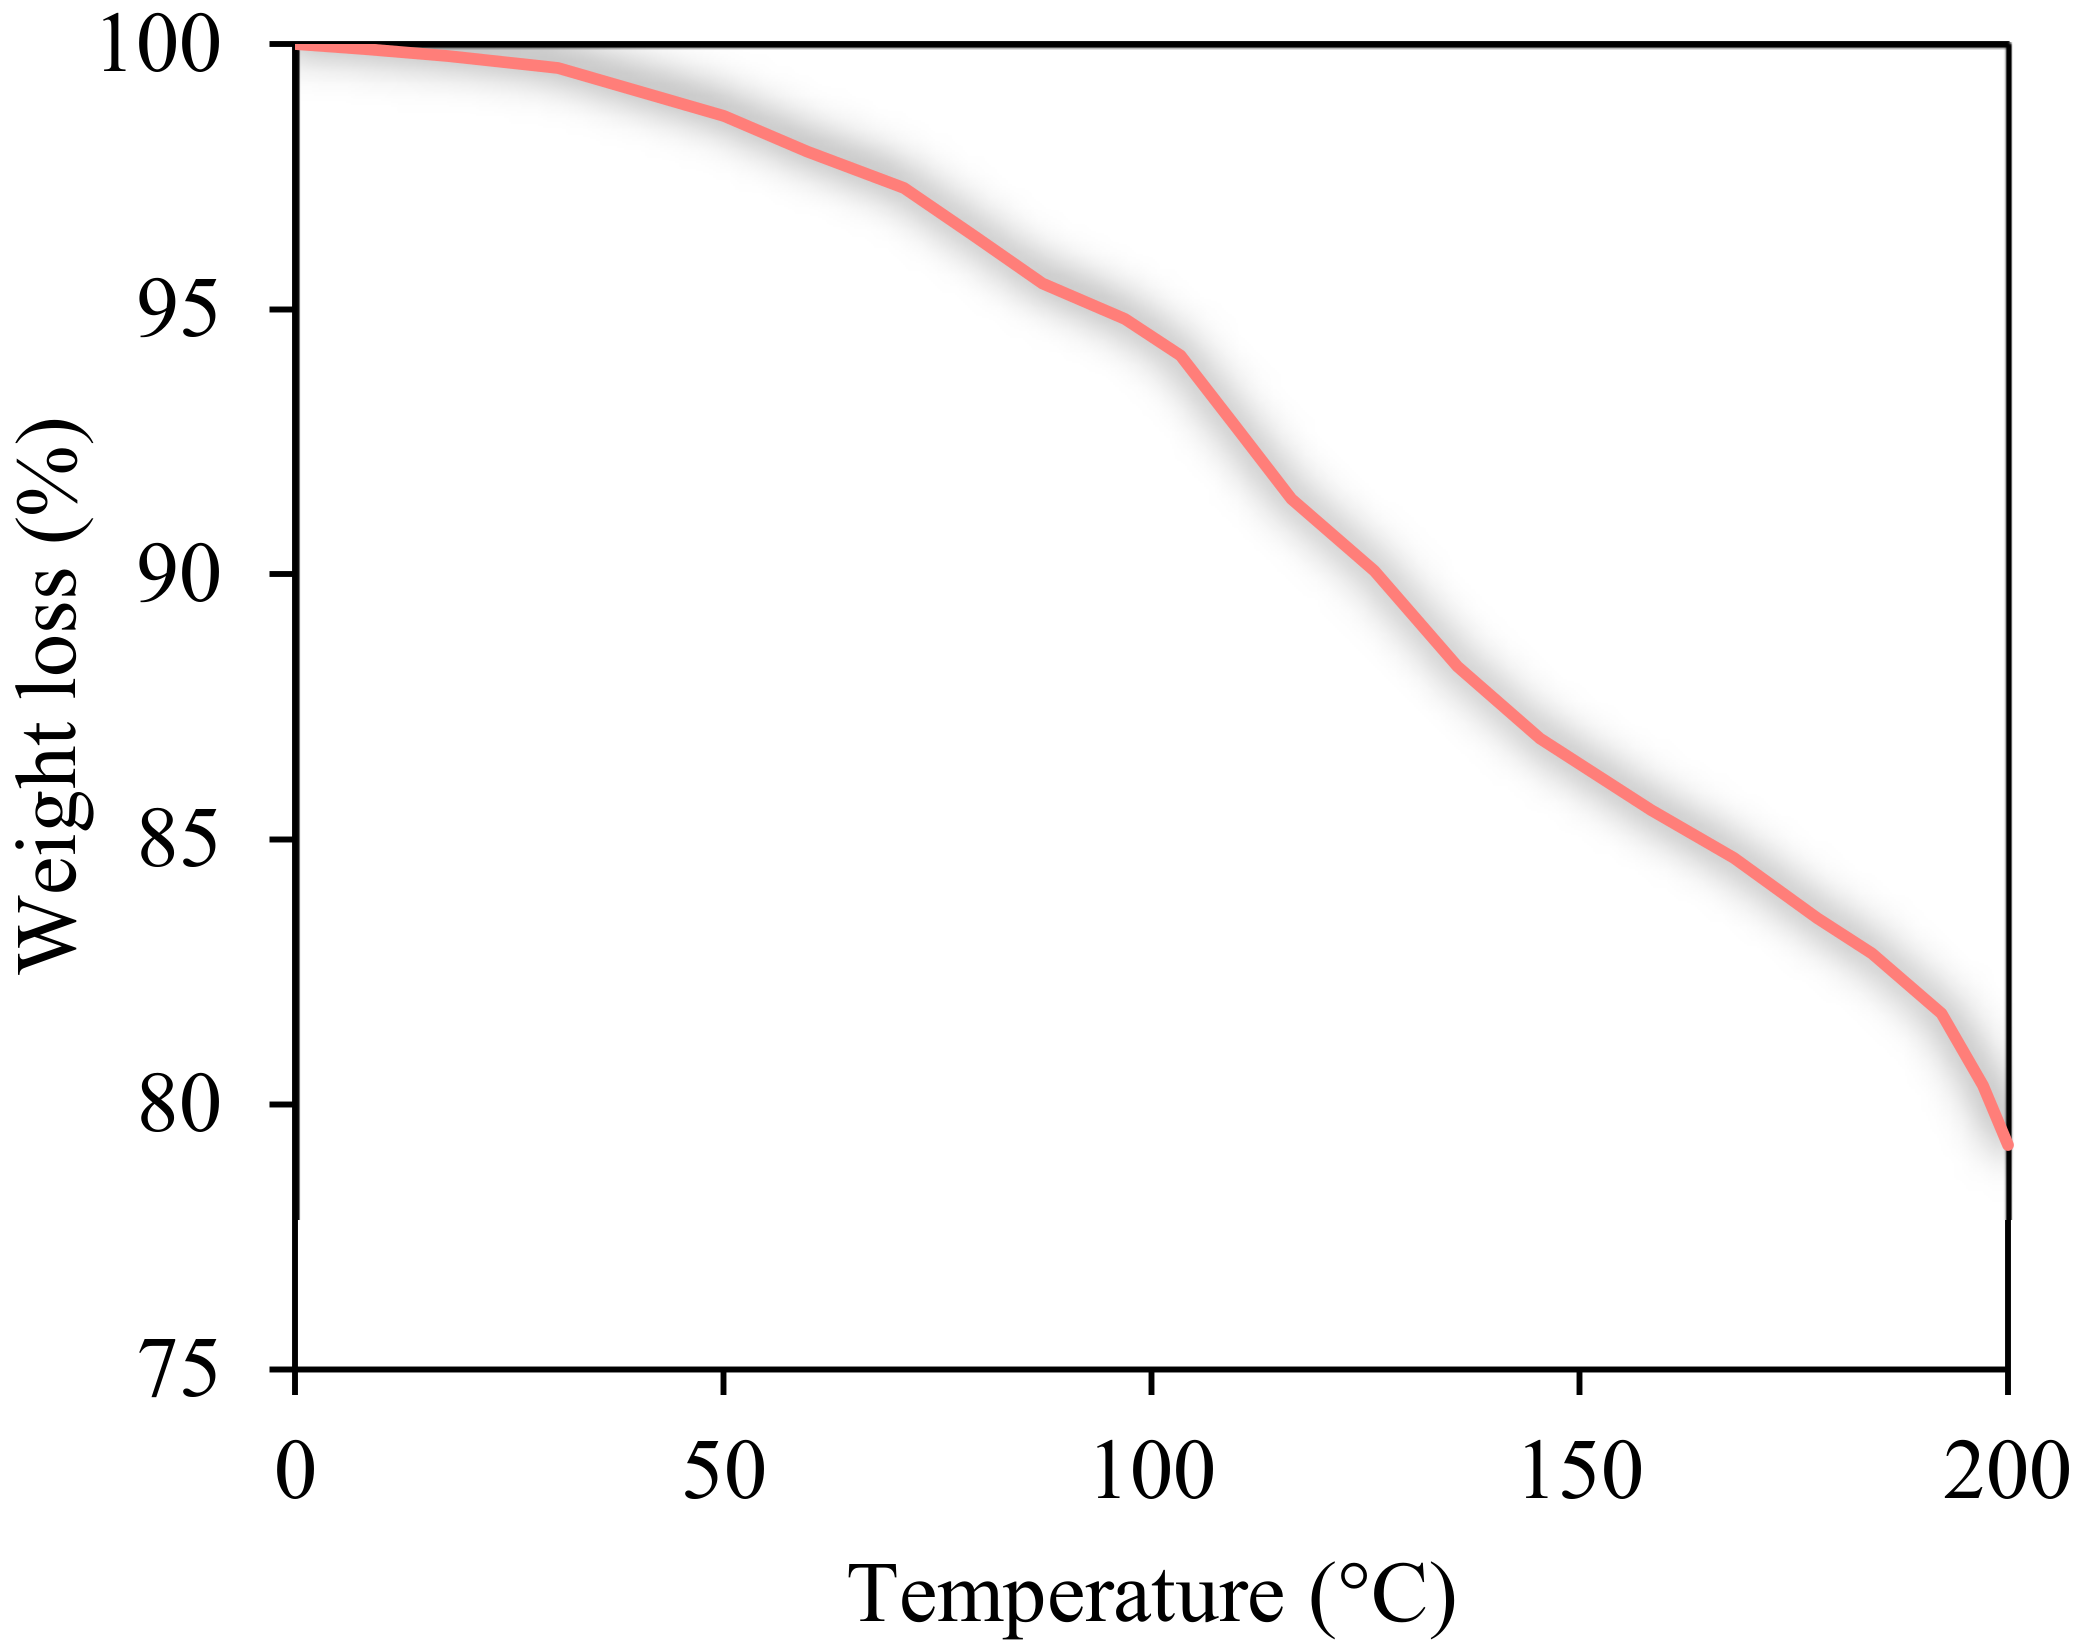
3.1. Characterization of AGC and Nanomaterials

The AGC extract from soapnut was carried out by the procedure described in previous sections, obtaining a consistent excerpt with a brownish coloration. Figure 4 shows FTIR spectra of the AGC sample and the pure saponin extract. The bands ranging from 3525 to 3281 cm−1 are related to the stretching vibration of hydroxyl groups of the oligosaccharide chain of saponin [30,85]. The observed peaks belonging to -OH and -COOH were related to the glucose structure and carboxylic acid derivate [30,85]. The band at 2970 cm−1 is associated with C-H aliphatic sapogenin saponin graft [86]. The band at 1384 cm−1 shows -OH bonds. The C=C absorbance was observed at 1613 cm−1, and therefore, the absorbance of oligosaccharide linkage C-O-C was presented at 1030 cm−1 leading to glycoside being connected to the sapogenins [86]. In general, bands of -OH, -C=O, C-H, and C=C are associated with a triterpene structure representative of saponins [30,85,86,87]. The characteristic bands related to the presence of saponins are observed along with the bandwidths, as reported by Samael et al. [87]. These results confirm that the extraction of the AGC by alcoholic extraction was successful. In addition, the bands recognized in this analysis ensure the action of the surfactant in the crude oil/brine interface due to the presence of hydrophilic and oleophilic compounds [30,87].
On the other hand, Figure 5 shows the thermogravimetric analysis (TGA), which shows an initial weight loss from approximately 30 to 200 °C of up to 20% with deviations in the measurement <3%. This result agrees with that reported by Magthalin et al. [88]. For temperatures below 110 °C, the mass loss is mainly due to the humidity present in the sample and the hydrolysis of bonds present in the organic fraction of the AGC extract [89]. However, considering a reservoir temperature of 47 °C, thermal stability is observed with a loss of <3% in the weight of the extract. Therefore, the AGC extract is thermally stable for injection under reservoir conditions of interest.
Figure 6 shows the curves of interfacial tension as a function of AGC concentration in an aqueous solution. The concentrations used are 50–3000 mg·L−1 to ensure the critical micelle concentration. The CMC value (around 770 mg·L−1) agrees with the literature reported with some differences in salinity [90]. Therefore, this result is significant as it defines the behavior of micellar formation to favor dynamic adsorption in the interface of fluids (water/crude oil), implying a better performance in reducing IFT values. For injections in the reservoir, the injection above the critical micellar concentration is recommended to ensure the efficiency of the process [91]. In the case of the study, said concentration must be greater than 770 mg·L−1.
Moreover, the HLB parameter was calculated in approximately 15.1 units, which proffer a hydrophilic character [92]. This suggests that the AGC extract is highly soluble in water and has detergent characteristics. The HLB value is close to that reported by Lozsan et al. [55]. Thus, considering the characterization carried out, it is expected that the active component AGC allows the reduction in the interfacial tension at the crude oil/brine interface through its injection into a water current [13].

3.2. Nanoparticles Characterization

Figure 7 shows FTIR spectra for nanoparticles used for bio-nanofluid system tuning. Such as was described in the methodology section, three kinds of nanoparticles were employed. The SiO2-RH nanoparticles were developed with an in-house synthesis from husk rice, which shows a great potential to use waste resources [48]. Moreover, the nanoparticles SiO2-C1 and SiO2-C2 were silica-based commercial samples. Figure 7 shows a similar trend of the spectra, with peaks representing silica showing typical siloxane and silanol groups [48,93]. Bands around 790 and 830 cm−1 are associated with the Si-O bond flection. The 1000 to 1300 cm−1 represents asymmetric stretching of O-Si-O bonds [48,93]. Moreover, the wideband between 2800 and 3800 cm−1 is associated with hydroxyl groups by scissoring vibrations and is even related to samples’ moisture [48,93]. So, these results agree with those reported in the literature for silica-based nanoparticles, as was expected [48,93].
In addition, the thermal stability was determined by TGA analysis, as shown in Figure 8, where high thermal stability of the SiO2-C1 and SiO2-C2 nanoparticles is observed with a loss of less than 5% for temperatures up to 700 °C [94]. On the other hand, the SiO2-RH nanoparticles showed a mass loss of approximately 12% at a temperature of 700 °C. This behavior could be due to the organic nature of the nanoparticles synthesized from organic rice husk residue. This agrees with what was reported by Usgodaarachchi et al. [95] and Hincapié et al. [96]; however, with a loss of less than 8% for the reservoir temperature. The results suggest that all the evaluated nanomaterials have high stability to thermal degradation.
Finally, the different nanoparticles’ dynamic light scattering analysis was performed, ensuring the nanometric size. Thus, the results show the size of 9.5 nm, 10.0 nm, and 11.5 nm for nanoparticles SiO2-C1, SiO2-RH, and SiO2-C2, respectively. Said results show that the nanomaterials evaluated are nanometric size (1–100 nm). They can be injected into the reservoir without generating damage associated with the obstruction of the pore throats [97,98,99].

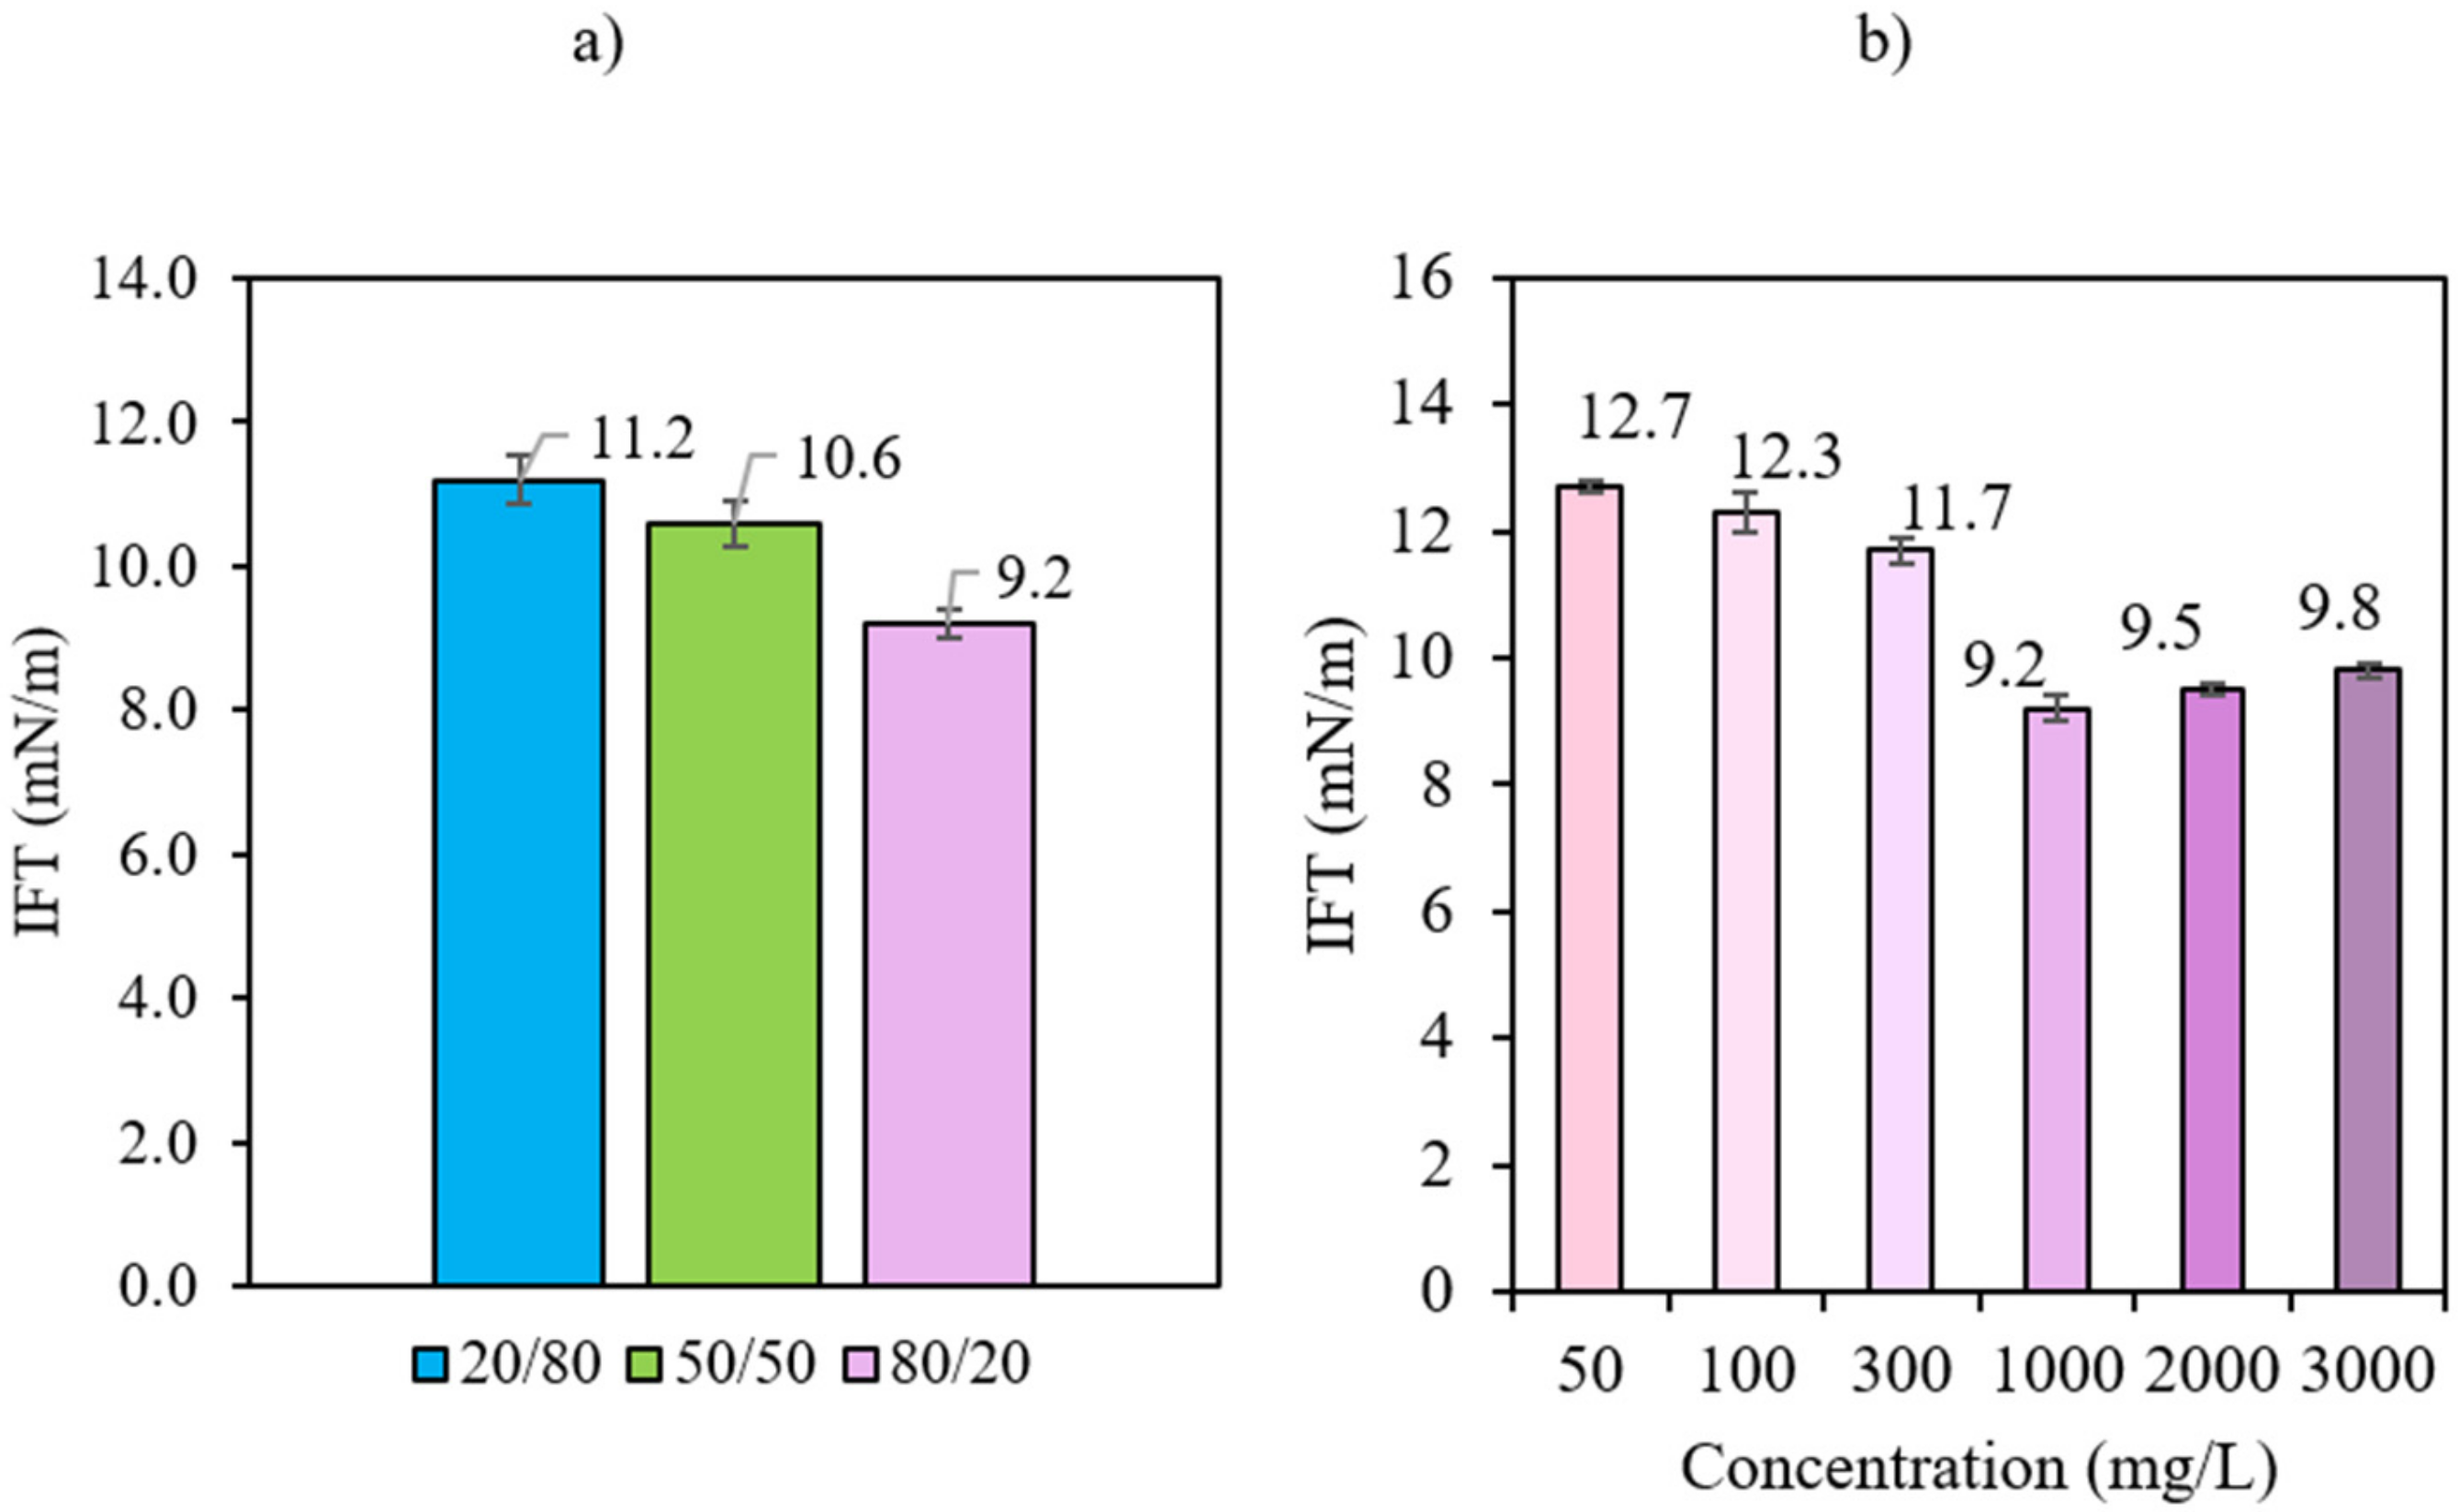
3.3. Effect of Bio-Ethanol Inclusion

Figure 9a shows the interfacial tension for different AGC:bio-ethanol ratios to evaluate the effect of the inclusion of this co-solvent. The concentration of the AGC:bio-ethanol system was set at 1000 mg·L−1 for comparative purposes. This concentration was selected considering that in the injection of surfactants such as EOR methods, it must be carried out above the CMC (~770 mg·L−1) [91]. The IFT of the system when using only bio-ethanol was 21.2 mN·m−1. It is observed that under an 80:20 AGC:bio-ethanol ratio, the performance of the bio-fluid solution improves, showing a 6% reduction in the IFT regarding the system with only AGC. This would provide greater cost-effectiveness by reducing the amount of AGC needed to obtain a significant reduction in interfacial tension [100,101]. Figure 9b shows the relationship between the concentration of AGC:bio-ethanol (80:20) in the brine and the interfacial tension. The interfacial tension was 12.7, 12.3, 11.7, 9.2, 9.5, and 9.8 mN·m−1 for concentrations of 50, 100, 300, 1000, 2000, and 3000 mg·L−1, respectively. Which corresponds to reductions of 56.9, 58.3, 60.33, 68.8, 67.7, and 66.8%, respectively, concerning the base system (29.5 mg·L−1). Thus, dosages below and above 1000 mg·L−1 increase interfacial tension. For this reason, the concentration of 1000 mg·L−1 of AGC:bio-ethanol is set at a ratio of 80:20 in the brine for the following tests.
These results confirm that adding short-chain alcohols, such as ethanol as a co-solvent, would increase the hydrophilic character of the formulation, which is essential to obtain a high reduction in interfacial tension under reservoir conditions [100]. In addition, this bio-ethanol obtained from agro-industrial waste is an economical and eco-friendly source, so its addition would mean a decrease in the economic and environmental costs of the designed biofluid [101].

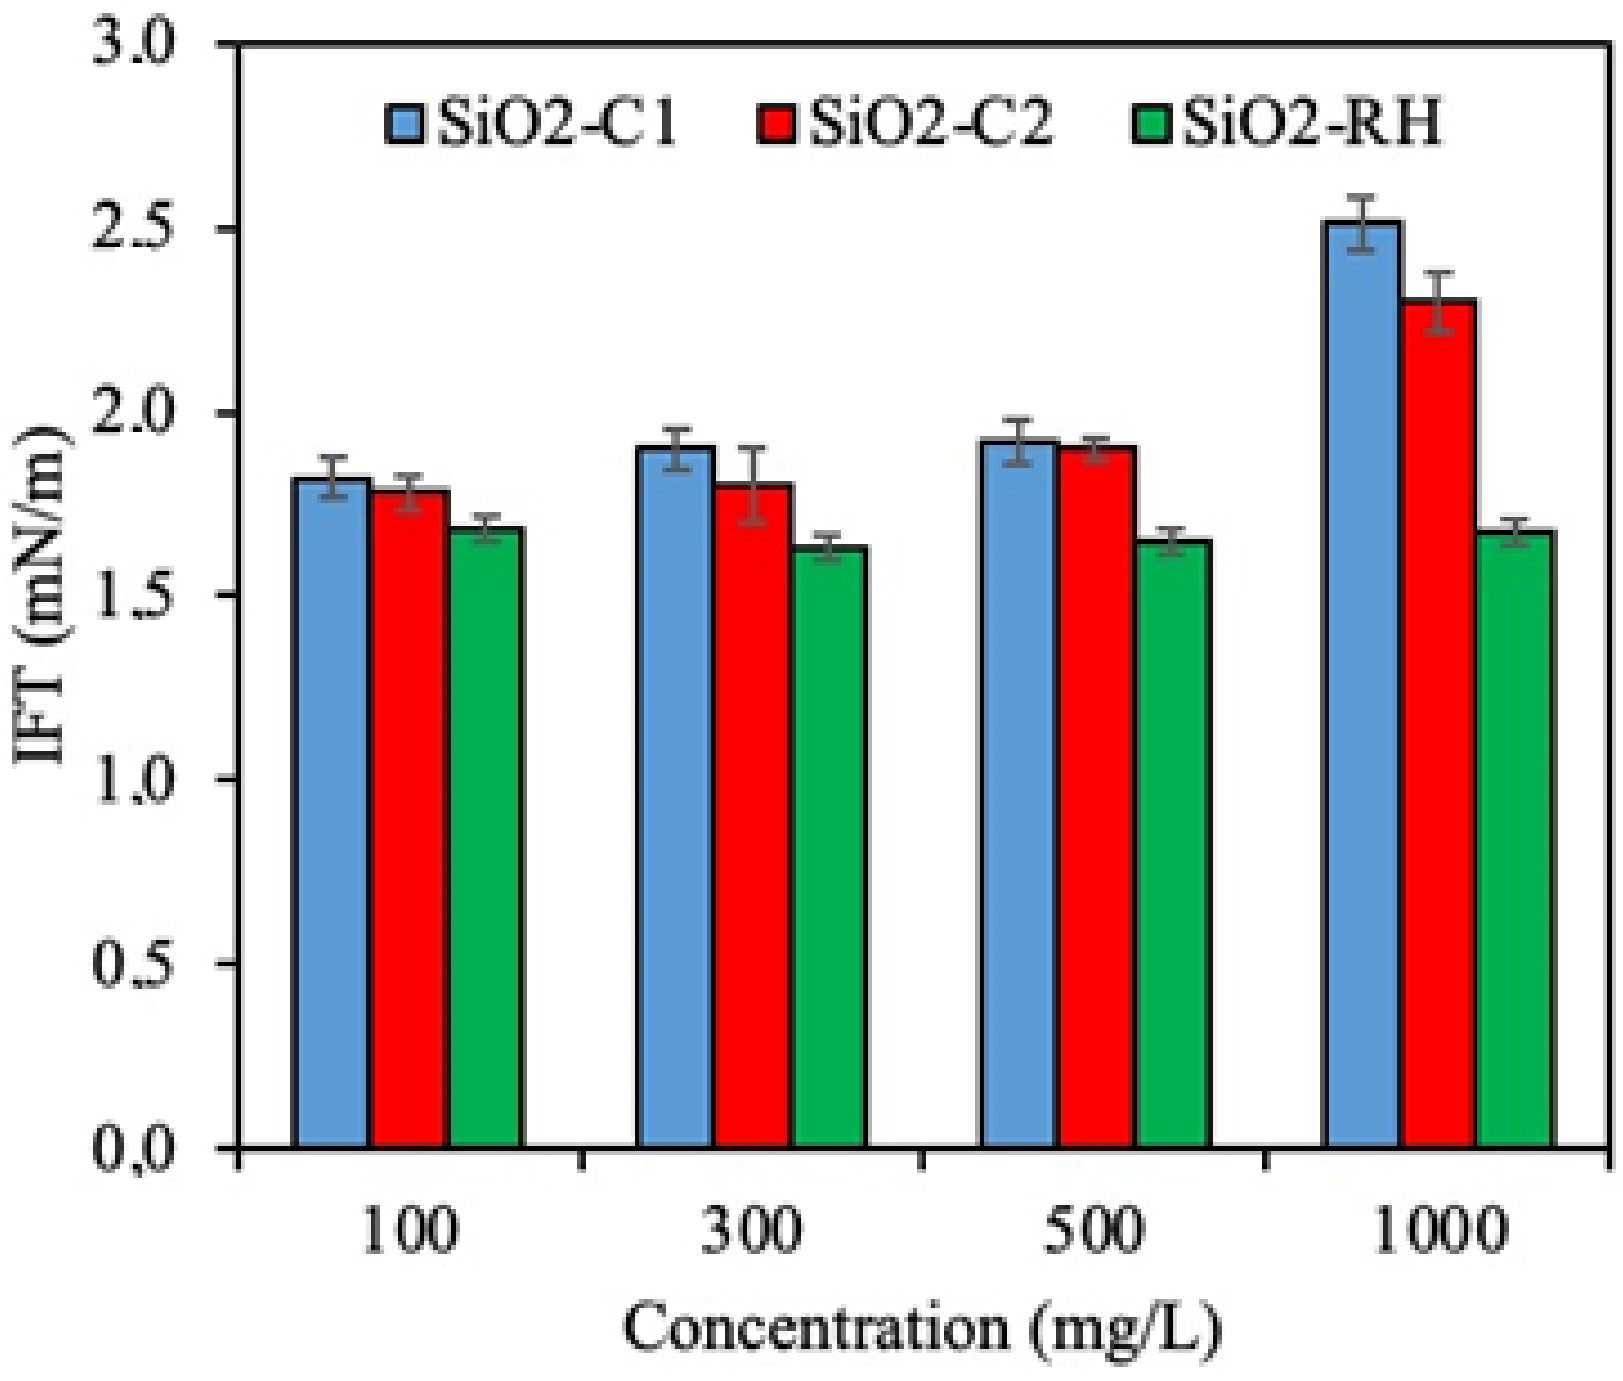
3.4. Effect of Silica-Based Nanoparticles Inclusion

To search for the best-biobased surfactant setting condition, silica-based nanoparticles were included due to the great benefits they have been shown to have when applied in EOR processes [38,102]. Figure 10 summarizes the data obtained. For the tuned AGC:bio-ethanol system, concentrations of 100, 300, 500, and 1000 mg·L−1 of the nanoparticles were added, and the reduction in interfacial tension was evaluated. A higher interfacial tension was observed when increasing the concentration of silica-based nanoparticles used for the considered cases. This behavior is due to the high adsorption of the AGC:bio-ethanol system on the nanoparticles, which prevents the surfactant from locating at the crude oil/brine interface [103].
However, for a low concentration of 100 mg·L−1, a reduction of 80.2, 80.7, and 81.7% is obtained for the SiO2-C1, SiO2-C2, and SiO2-RH nanoparticles, respectively, concerning the system in the absence of nanoparticles. This suggests the capacity of the nanomaterials assessed to reduce the tension between crude oil and brine. This could be because the surfactant micelles are uniformly adsorbed on the nanoparticles, allowing efficient delivery of the bio-fluid at the crude oil/brine interface by attractive electrostatic interactions. This is in agreement with the results reported by Vatanparast et al. [104]. Due to the results obtained, the SiO2-RH nanoparticles were selected at a dosage of 100 mg·L−1 to be used in subsequent measurements as an environmentally friendly and efficient option for reducing interfacial tension.
The results of the binding energy (related to the bond strength) are recorded in Table 2. It is observed that this parameter increases in the direction SiO2-RH > SiO2-C2 > SiO2-C1, which would indicate more significant adsorption of the SiO2-RH particles in the crude oil/brine interface [71,72]. Therefore, the interfacial tension decreases, in the same way, SiO2-RH > SiO2-C2 > SiO2-C1. It is also observed that, for nanoparticles of the same chemical nature, the binding energy ranges between −1.3 × 10² and −1.9 × 10² KBT for the tuned system.

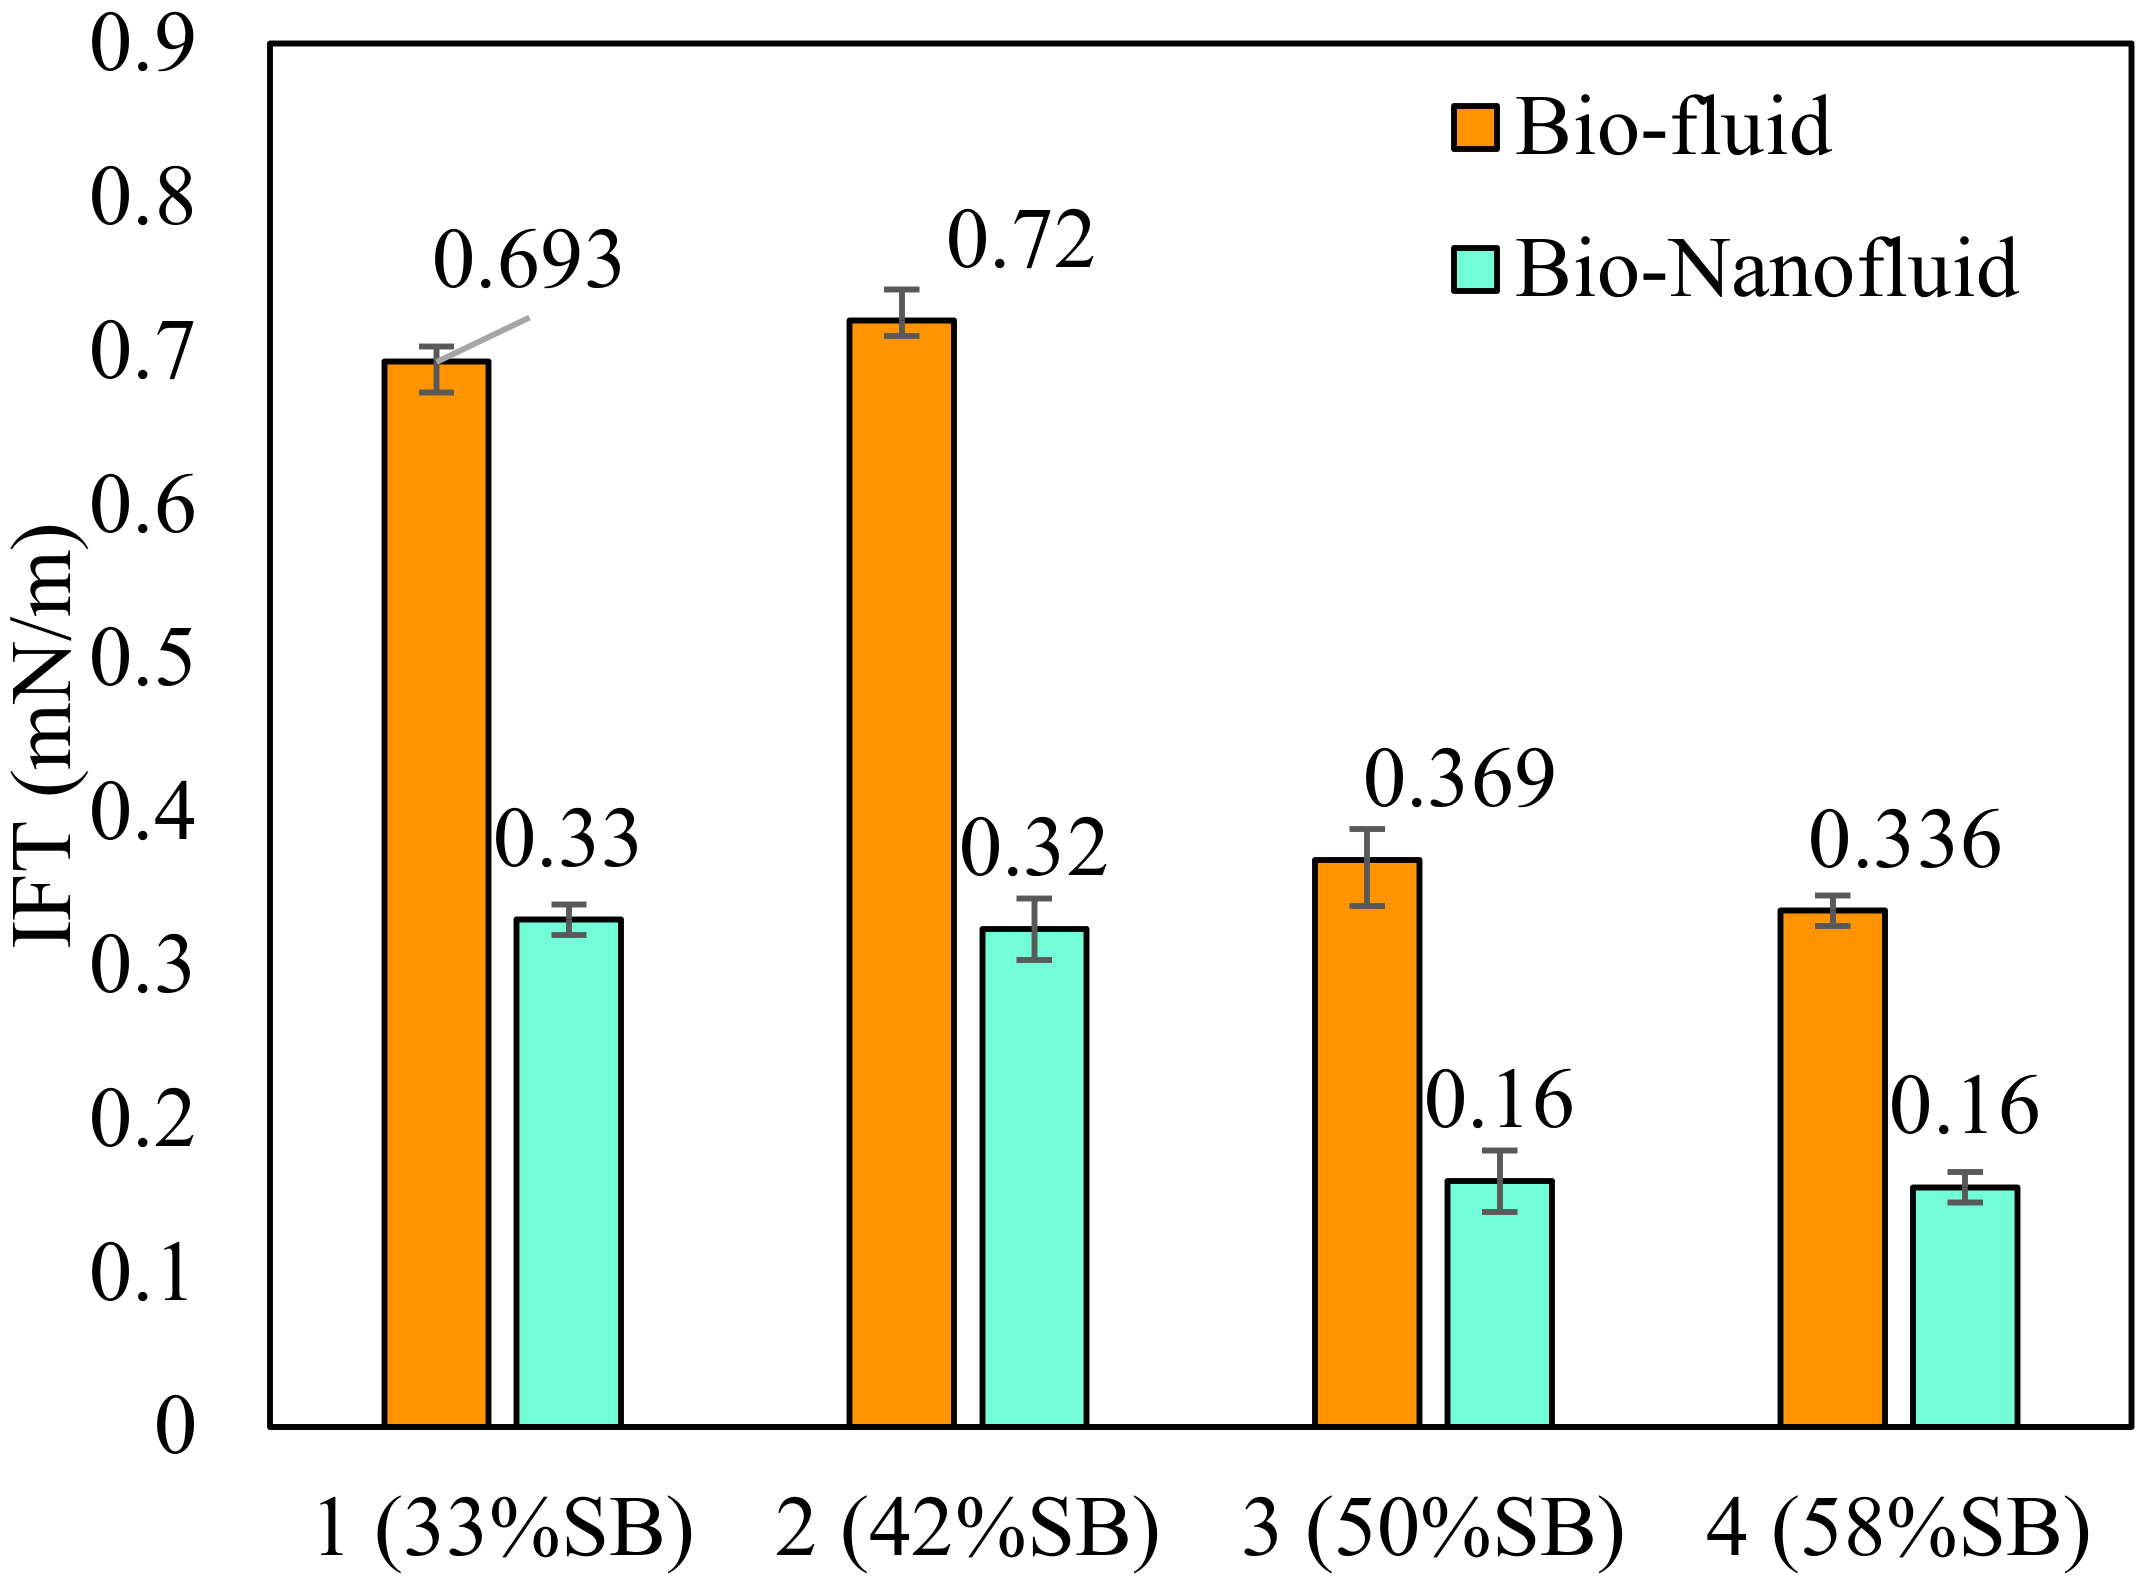
3.5. Effect of SB Inclusion

However, the results of the previous sections showed that the AGC/bio-ethanol/Silica-based nanoparticles interaction generates substantial reductions in interfacial tension measurements, showing promise for its implementation in EOR processes. Nevertheless, it is necessary to obtain tensions below 1 × 10⁻¹ mg·L−1. For this reason, the commercial surfactant (SB) is included and, in this way, favors a synergy between surfactants of a different nature through a mixture of surfactants [45]. Figure 11 shows the effect on IFT when adding commercial surfactant in volume ratios of 33:67, 42:58, 50:50, and 58:42 (SB/AGC:bio-ethanol) in the absence and presence of the SiO2-RH nanoparticles under the fixed dosage of 100 mg·L−1.
It is observed that only the inclusion of the commercial SB surfactant reduces the interfacial tension of the system in the absence of nanoparticles from 9.2 to 0.369 mg·L−1 for a 1:1 ratio (SB/AGC:bio-ethanol). While, in the presence of the SiO2-RH nanoparticles at 100 mg·L−1, a reduction of 90.47% is obtained, decreasing from 1.68 to 0.16 mg·L−1. This additional reduction is because the presence of an anionic surfactant (SB) improves the dipole–dipole interactions between the nanoparticles and the bio-fluid. Therefore, the intelligent delivery of the surfactant in the crude oil/brine interface is more efficient [73].
Thus, for the tuned system (bio-nanofluid), the binding energy of −233.44 KBT was found. This indicates an increase of 20.21% in the capacity of the nanoparticle to be adsorbed at the crude oil/brine interface compared to the system without commercial surfactant (SB), which corroborates the high ability of this optimized system to reduce interfacial tension at a temperature of 47 °C. In this way, the study found an optimal bio-nanofluid (SB/AGC:bio-ethanol/SiO2-RH) for its evaluation in terms of adsorption, capillary number, and core flooding tests, with a much superior performance in IFT reduction compared to those reported so far in the literature [40,41,42,43].

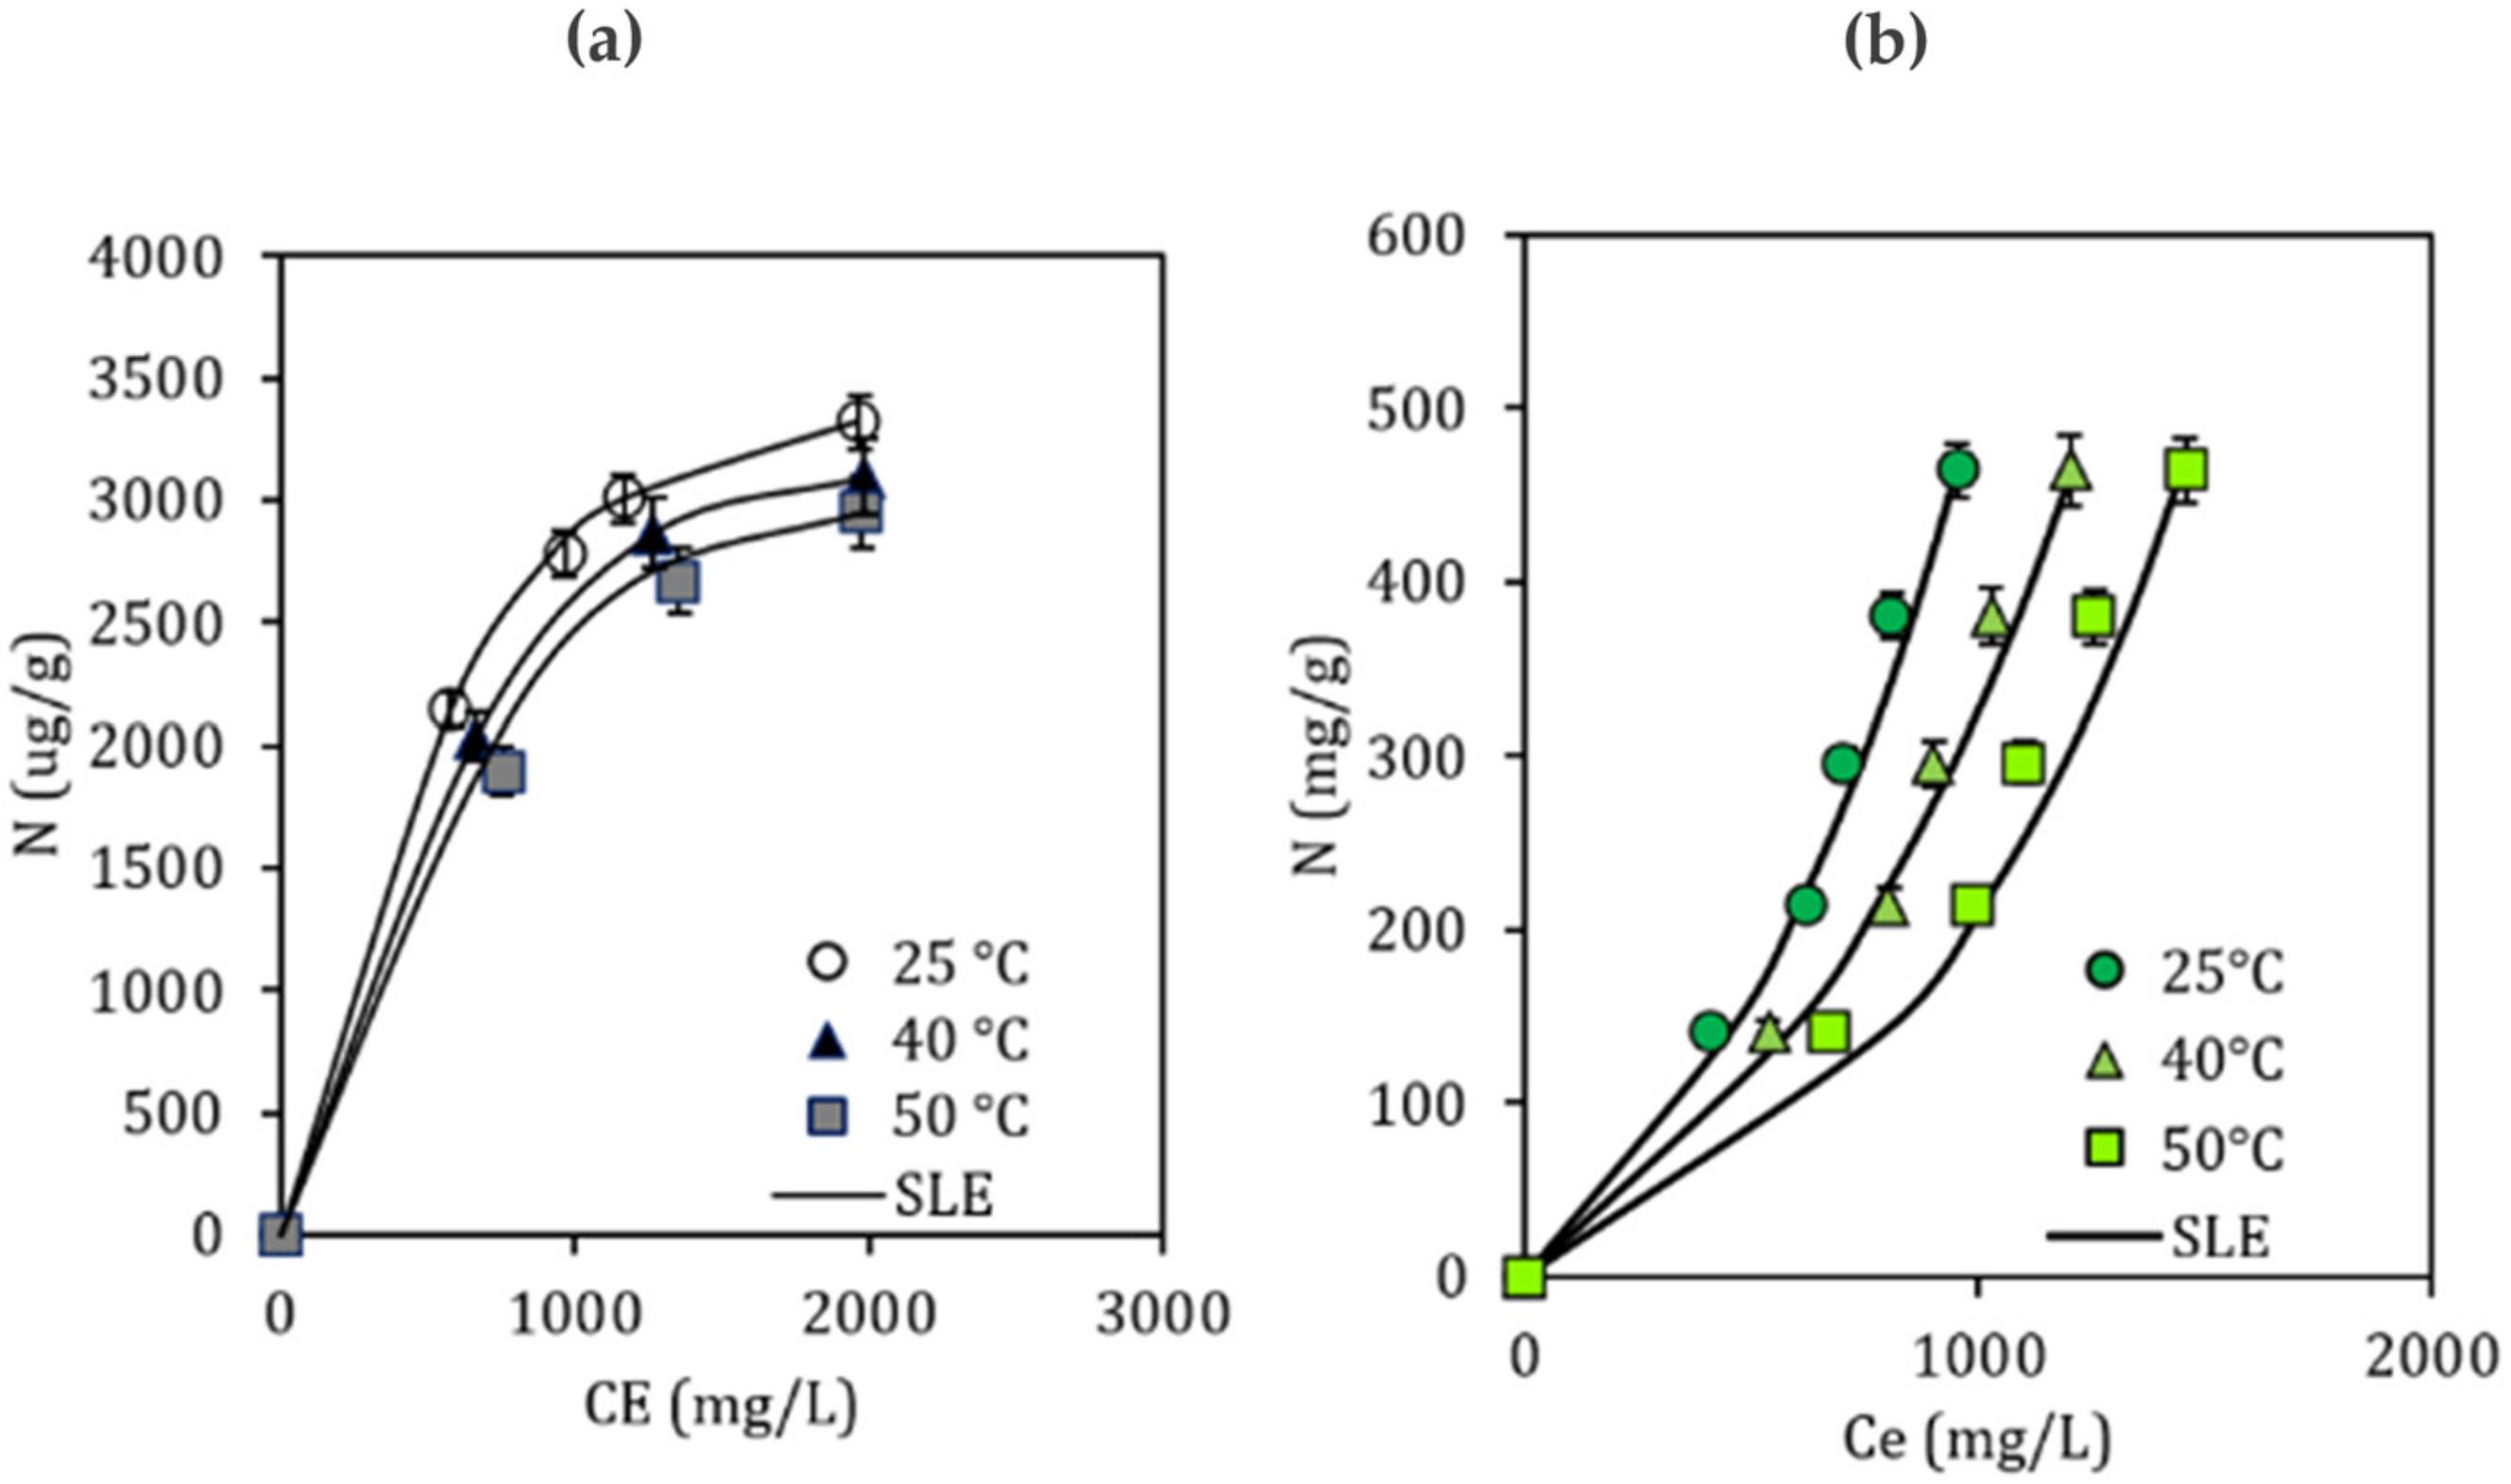
3.6. Adsorption Test

The composition of the optimal bio-nanofluid synthesized is shown in Table 3. This tuned compound was used for adsorption, capillary number, and nucleus flooding tests.
As a crucial factor in the EOR processes, the adsorptive process provides valuable information related to the system interaction between the porous media, the chemicals tensoactive, and even the nanoparticles. In the traditional surfactant flooding process, the adsorptive process onto the surface rock can have significant value leading to the reduction in surfactant molecules for crude oil/water interface interaction. Thereby, for the understanding of the interaction regarding the tuned bio-nanofluid, adsorption isotherms on sandstones by the thermogravimetric method were development, with Ottawa sand as adsorbent and the bio-nanofluid as adsorbate at dosages of 100, 500, and 1000 mg·L−1. Figure 12a shows the isotherm trend onto sand following a type I shape according to the IUPAC classification [105], which can be associated with micelles formation (CMC = 770 mg·L−1) thanks to the solvation capacity of the dissolved ions in the synthetic brine, limiting the adsorption onto surface rock to being only related to individual molecules free on fluid, instead of surfactant aggregates [106]. However, it is observed that these values are between 3259 and 3770.86 μg·g−1, which indicates that the SiO2-RH nanoparticle is adsorbing the surfactant, preventing it from being adsorbed in the porous medium, as shown in Figure 12b. The results agree with previous studies on the adsorption of surfactants in the sand [38].
To corroborate the adsorptive effect of the nanoparticles on the synthesized bio-nanofluid, the adsorption isotherms are carried out at temperatures of 25, 40, and 50 °C. Figure 12b shows the results obtained. The isotherms follow a Type III trend shape (IUPAC classification) related to a low affinity between the adsorbate and the adsorbent [105]. This is because the adsorption of the micelles on the silica-based nanoparticles generates complexes that are unstable over time, which can generate weak polar interactions. These interactions allow the inclusion of organic molecules in the oily phase, reducing the interfacial tension of the previously evaluated systems [104]. In addition, hydrophobic interactions and hydrogen bonds can be generated between the SiO2-RH/bio-nanofluid nanoparticle due to the carboxylate groups in the surfactant and the negative surface charges in the silica. The FTIR analysis corroborated the presence of these functional groups (Figure 4) [104]. Both for the adsorption on the rock and the adsorption on the SiO2-RH nanoparticles, a decrease in the adsorption of the bio-nanofluid was observed with the increase in temperature. This behavior is because the adsorbate molecules (bio-nanofluid) will have higher energy with increased temperature, reducing the interaction capacity with the porous medium and the SiO2-RH nanoparticles. This behavior indicates that adsorption on the rock at reservoir conditions is unfavorable, which favors the enhanced recovery process by effectively bringing the surfactant to the crude oil/brine interface [107,108].
The experimental data of the adsorption isotherms were fitted to the SLE model (Solid–Liquid Equilibrium), describing the behavior of adsorption on sandstone rock and nanoparticles. This model was used since it allows a good mathematical and phenomenological adjustment of adsorption in the presence of particles with a self-associative nature, such as bio-nanofluid. [38,73,74,75,109]. Table 4 shows the parameters H , K , N m , and R S M E % for the two six systems evaluated. A good fit towards the experimental data is observed with an R S M E % of less than 9% for all cases. The Henry law constant, H , indicates the affinity between the rock and the nanoparticles and the designed bio-fluid. It is observed that H decreases in the 50 °C > 40 °C > 25 °C direction, which indicates a lower affinity of the rock surface/SiO2-RH nanoparticle for the adsorbate for the reservoir temperature (47 °C). In addition, it is observed that the parameter K follows the opposite trend, for which the adsorbate particles will have a higher degree of self-association at a higher temperature [110]. The adsorption will be less uniform and less effective for the system at high temperatures [36]. Finally, the parameter N m represents the maximum adsorption capacity of the adsorbent, which is reached when the active sites of the adsorbent are completely saturated without additional layers of adsorbate in their environment. Thus, it is observed that the theoretical maximum quantity that the rock can experience is much less than the theoretical maximum adsorbed quantity of the nanoparticles. The increase in temperature decreases the capacity of both systems to adsorb the bio-fluid. These results are in agreement with what was stated by Betancur et al. [73].
Based on the adsorption isotherms found for the rock/bio-nanofluid and nanoparticle SiO2-RH/bio-fluid systems at 25, 40, and 50 °C, the thermodynamic parameters were estimated. The results are shown in Table 5. It is observed that the entropy is positive ( Δ S a d s o r p t i o n 0 > 0), while the enthalpy and the change in Gibbs free energy for the three temperatures are less than zero ( Δ H a d s o r p t i o n 0 and Δ G a d s o r p t i o n 0 < 0). Thus, it is confirmed that the adsorption process is random. In addition, a change in the magnitude of the Δ G a d s o r p t i o n 0 in the direction 25 °C < 40 °C < 50 °C in percentages 0.0, 63.4, and 71.8% for the rock and 0.0, 25.4, and 175.7% for the SiO2-RH nanoparticles based on the system at room temperature indicates that the bio-fluid adsorption in both systems is an exothermic and spontaneous process [111].

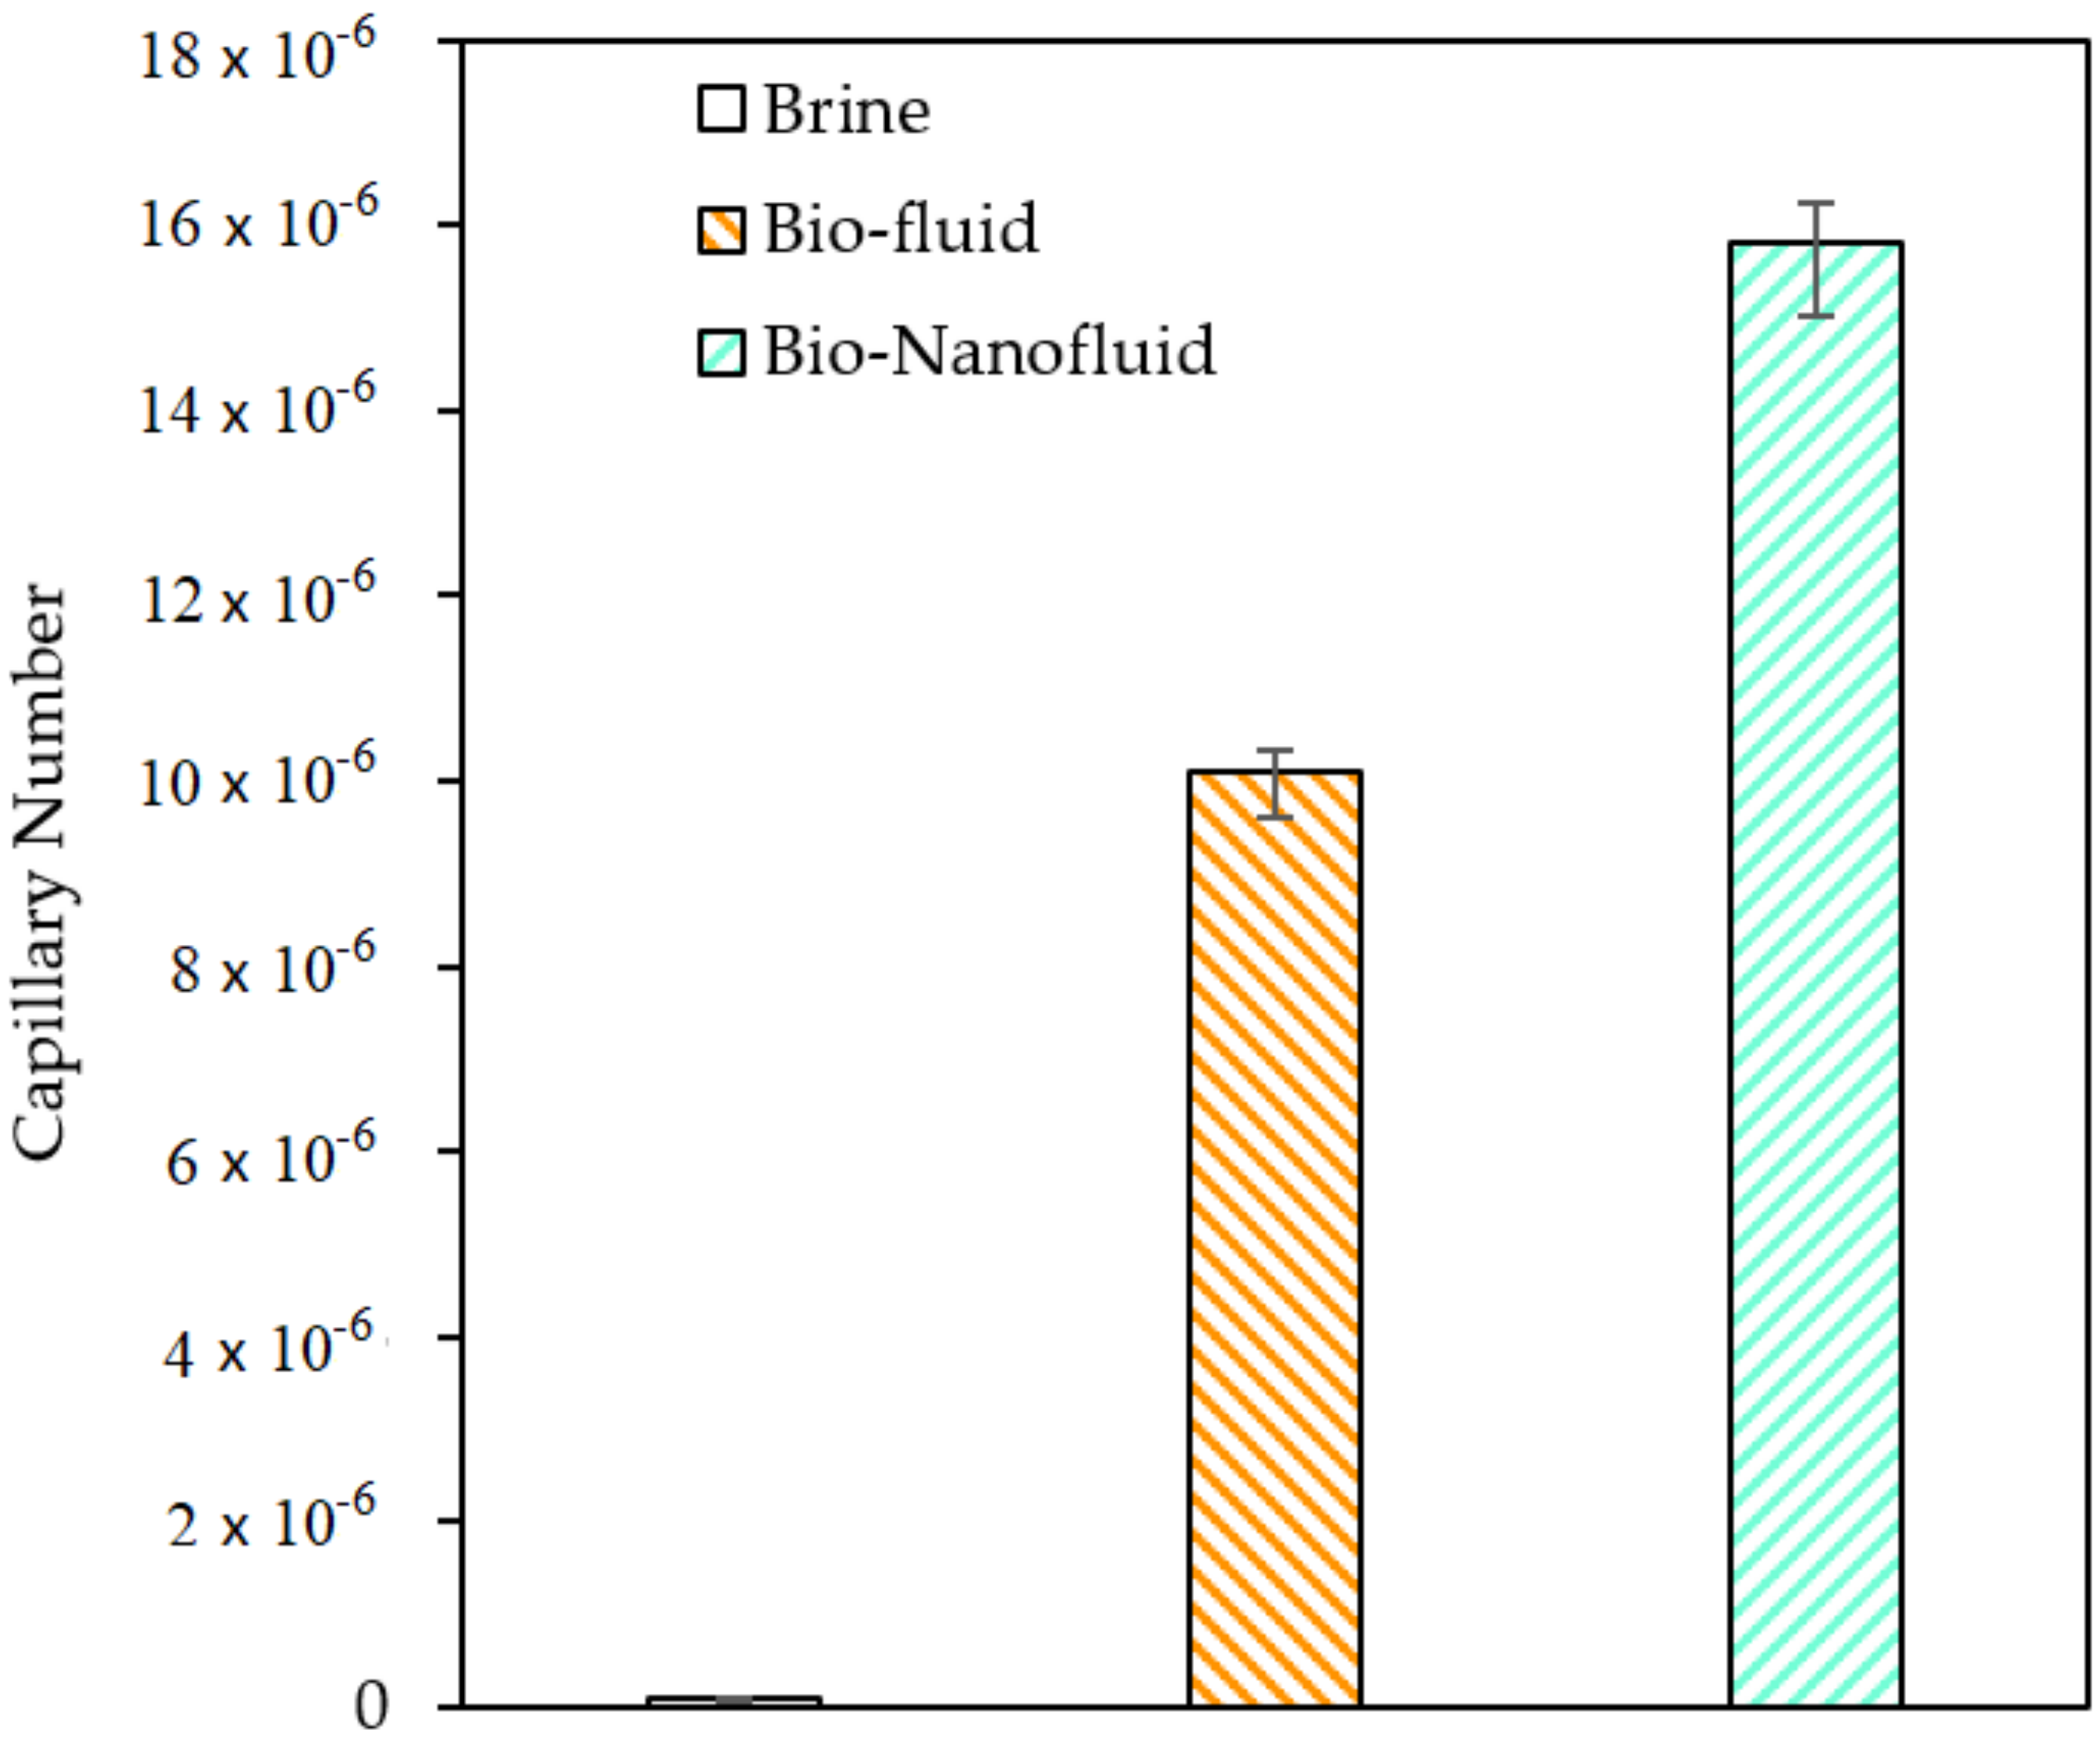
3.7. Capillary Number Estimation

To determine the capillary number of the systems with the influence of the newly designed bio-nanofluid, it is essential to determine the wettability of the rock after performing the chemical injection processes, as indicated by Equation (11). In this way, the water wettability of the system is determined by the contact angle at this phase. Figure 13 summarizes the results found.
It is observed that only brine as treatment did not have a relevant impact on the wettability preference for water with a measurement of 115.2 ± 0.2°, which represents the restored wettability for crude oil conditions. Thus, this is taken as the base scenario in the absence of the bio-nanofluid. When the system is put in contact with the designed bio-fluid in the absence of nanoparticles, the contact angle to the water changes slightly to 88.1 ± 0.1°, representing a 22.0% reduction and a tendency of the system to a mixed wettability [112]. This result is associated with the interaction of the biologically based surfactant with the rock surface due to the phenomenon of adsorption of the surfactant molecules by interaction with the charged sites on the rock surface [113]. Mineral surface and interaction of hydrophobic chains on the rock surface (hydrocarbon chains such as asphaltenes) with a biobased surfactant allow the surfactant’s exposed hydrophilic tail to interact with the aqueous phase [114].
Finally, when the system comes into contact with the designed bio-nanofluid (presence of SiO2-RH nanoparticles at 100 mg·L−1), the contact angle with water is reduced by 41.6% to 66.8 ± 0.1°. The primary mechanism associated with wettability change is related to the decoration of nanoparticles onto the rock surface, which allows exposing their owing polarity by hydroxyl groups to interact with water feasibility, a significant preference for this phase [38,83]. These results provide essential information within the study since they indicate that the mobility of the phase of interest (crude oil) will be favored during the injection of the bio-nanofluid.
As expressed in the methodology section, the expression for the capillarity number (Nc) could be calculated from Equation (11), related to the primary mechanism governing fluid displacement in porous media. Therefore, the properties of viscosity, interfacial tension, and contact angle found for the system in the presence of bio-fluid and bio-nanofluid at a concentration of 1000 mg·L−1 concerning brine were used to estimate Nc. The behavior of the viscosity of the viscous forces of the tuned solutions in the absence and presence of nanoparticles was quantified and the results are presented in Table 6. A slight increase in the viscosity and density of the brine is observed in the presence of the bio-fluid and bio-nanofluid. However, this increase in properties does not exceed 10% for virgin brine.
The results are shown in Figure 14. The capillary number increases in the direction of brine < bio-fluid < bio-nanofluid with values of 7.68 × 10⁻⁸, 1.01 × 10⁻⁵, and 1.58 × 10⁻⁵, respectively. This behavior is due to the results obtained for the system in the presence of the bio-nanofluid in terms of interfacial tension (IFT < 1 × 10⁻¹) and wettability ( θ < 90°), and is in agreement with the results found in previous works [71], exhibiting a synergistic phenomenon with higher Nc for the system in the presence of the SiO2-RH nanomaterials. Expression of the capillary number directly relates to the recovery factor, being a first approximation of what can be expected in a possible injection of this type of tuned bio-nanofluid in the reservoir. This expression relates the viscous and capillary forces and the adsorptive phenomena involved in the presence of SiO2-RH nanomaterials [81]. Therefore, with the results obtained, it is expected that the injection of the bio-nanofluid in a porous medium under dynamic conditions will be successful.

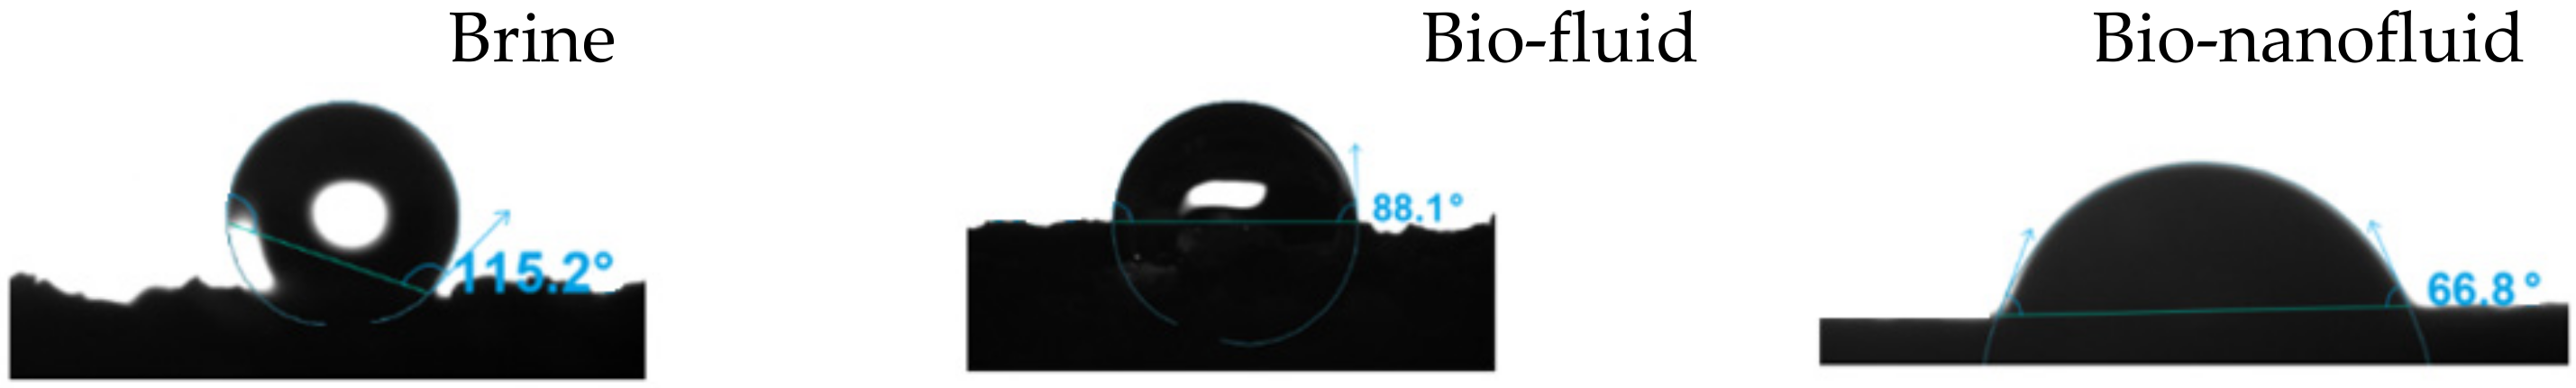
3.8. Coreflooding Test

Having promising results in the static stage of evaluation. We evaluate the designed system under dynamic conditions to determine the potential of the tuned system in EOR processes. In the first instance, crude oil recovery is evaluated in a dynamic system at reservoir temperature and atmospheric pressure. The results are shown in Figure 15. The performance of the bio-fluid and bio-nanofluid system is evaluated after an injection stage of 10 porous volumes of brine (waterflooding), see Figure 15. The results obtained validate that (i) The injection of the bio-fluid (in the absence of nanoparticles) increases the recovery percentage by 6.7% compared to the system with only brine injection. (ii) The injection of the bio-nanofluid (in the presence of nanoparticles) increases the recovery percentage by 23.33% compared to the system with only brine injection.
The curve slope after starting the treatment injection shows essential characteristics of the process. The increase in the slope of the curve with the inclusion of nanoparticles stands out, which may be associated with a reduction in adsorption in the porous medium, which leads to greater effectiveness in the displacement of fluids thanks to the fact that the nanoparticles act as a bio-fluid delivery target based on tuning at the interface. Thus, it is stated that the bio-nanofluid has a high potential to improve the rates of enhanced oil recovery in values close to 10% compared to the same system without nanoparticles [115].
Finally, Figure 16 presents the crude oil recovery results at reservoir conditions for injection of bio-nanofluid tuned for this work. Thus, considering the injection of the bio-nanofluid system was performed in bumps of 0.33 VPI in decreasing dosage order, initially 1000 mg·L−1 of the tuned bio-nanofluid system, then at 750 mg·L−1, and ending with 500 mg·L−1 at reservoir temperature and pressure.
According to the results obtained, a 9.3% increase in the recovery factor is evidenced with the injection of the tuned treatment, presenting a steep slope as soon as the water chase injection begins, which indicates a decrease in adsorptive processes in the porous medium in addition to the other benefits imparted by the inclusion of nanomaterials that finally allow a higher percentage of additional crude oil recovered [115]. Additionally, Figure 16 shows the monitoring of injectivity through pressure differentials, which account for the null alteration that the system presents when injected into a porous medium, which translates into favorableness for its continuous injection in the reservoir without showing locks that affect the integrity of the medium.

4. Conclusions

The development of this work made it possible to demonstrate the great potential that some agricultural products have as raw material for synthesizing bio-based surfactants. The soapnut has high prospects given its high performance in obtaining saponins (active amphiphilic compound). According to the mixture design carried out for the fine-tuning of the bio-based surfactant, outstanding results were found with adding alcoholic co-solvents such as ethanol. A good performance was obtained in the AGC:bio-ethanol ratios (80:20% v·v−1). Using this type of solvent also presents an excellent opportunity to take advantage of the resources from agro-industrial waste.
On the other hand, the modification of the biological-based surfactant tuned with SiO2-RH nanoparticles at 100 mg·L−1 synthesized from rice husks improves the characteristics of the biological-based surfactant: bio-ethanol (80:20), obtaining an IFT value of 1.46 mg·L−1 a significant reduction of 82%, a result that is later enhanced with the inclusion of a commercial anionic surfactant (SB), which, due to the effect of AGC:bio-ethanol/SB interactions, favors a more significant decrease in the IFT at values up to 0.16 mg·L−1.
In addition, the inclusion of nanoparticles generates an added value in the bio-fluid system since, in addition to having a bio/eco character, it has the different benefits of the inclusion of nanomaterials in terms of changes in IFT, changes in wettability, and reduction in adsorption in the porous medium, shown numerically with the estimate of the expression for the number of capillaries. Finally, it is important to highlight the results obtained in the displacement tests, which corroborate the great potential of the tuned bio-nanofluid to increase the recovery factor during tests at real reservoir temperature and pressure conditions.

Author Contributions

Conceptualization, all authors; methodology, L.J.G. and D.G.-C.; formal analysis, all authors; data curation, F.B.C. and C.A.F. (Carlos A. Franco); writing—original draft preparation, L.J.G. and D.G.-C.; writing—review and editing, C.A.F. (Carlos A. Franco) and F.B.C.; review, J.A., F.V. and C.A.F. (Camilo A. Franco). All authors have read and agreed to the published version of the manuscript.

Funding

Thanks to Ecopetrol (Colombia) for the economic support provided (grant number [2020]).

Institutional Review Board Statement

Not applicable.

Informed Consent Statement

Not applicable.

Data Availability Statement

The data presented in this study are available on request from the corresponding author.

Acknowledgments

Authors acknowledge Ecopetrol and Universidad Nacional de Colombia for the support provided.

Conflicts of Interest

The authors declare no conflict of interest.

References

  1. Pal, S.; Mushtaq, M.; Banat, F.; Al Sumaiti, A.M.J.P.S. Review of surfactant-assisted chemical enhanced oil recovery for carbonate reservoirs: Challenges and future perspectives. Petrol. Sci. 2018, 15, 77–102. [Google Scholar] [CrossRef] [Green Version]
  2. Memon, M.K.; Elraies, K.A.; Al-Mossawy, M.I. Impact of new foam surfactant blend with water alternating gas injection on residual oil recovery. J. Pet. Explor. Prod. Technol. 2017, 7, 843–851. [Google Scholar] [CrossRef] [Green Version]
  3. Patzek, T.W.J.S.R.E. Field applications of steam foam for mobility improvement and profile control. SPE Res. Eng. 1996, 11, 79–86. [Google Scholar] [CrossRef]
  4. Srivastava, M.; Nguyen, Q.P. Application of gas for mobility control in chemical EOR in problematic carbonate reservoirs. In Proceedings of the SPE Improved Oil Recovery Symposium, Tulsa, OK, USA, 24–28 April 2010. [Google Scholar]
  5. Nwidee, L.N.; Theophilus, S.; Barifcani, A.; Sarmadivaleh, M.; Iglauer, S. EOR processes, opportunities and technological advancements. In Chemical Enhanced Oil Recovery (cEOR)—A Practical Overview; Books on Demand: Norderstedt, Germany, 2016; pp. 2–52. [Google Scholar]
  6. Petrichenko, M.; Vatin, N.; Nemova, D.; Kharkov, N.; Staritcyna, A. EOR (oil recovery enhancement) technology using shock wave in the fluid. Appl. Mech. Mater. 2014, 627, 297–303. [Google Scholar] [CrossRef]
  7. Samanta, A.; Ojha, K.; Sarkar, A.; Mandal, A. Surfactant and surfactant-polymer flooding for enhanced oil recovery. Adv. Pet. Explor. Dev. 2011, 2, 13–18. [Google Scholar]
  8. Johannessen, A.M.; Spildo, K. Enhanced oil recovery (EOR) by combining surfactant with low salinity injection. Energy Fuels 2013, 27, 5738–5749. [Google Scholar] [CrossRef]
  9. Amirianshoja, T.; Junin, R.; Idris, A.K.; Rahmani, O. A comparative study of surfactant adsorption by clay minerals. J. Pet. Sci. Eng. 2013, 101, 21–27. [Google Scholar] [CrossRef]
  10. Mehrabianfar, P.; Bahraminejad, H.; Manshad, A.K. An introductory investigation of a polymeric surfactant from a new natural source in chemical enhanced oil recovery (CEOR). J. Pet. Sci. Eng. 2021, 198, 108172. [Google Scholar] [CrossRef]
  11. Atta, D.Y.; Negash, B.M.; Yekeen, N.; Habte, A.D. A state-of-the-art review on the application of natural surfactants in enhanced oil recovery. J. Mol. Liq. 2020, 321, 114888. [Google Scholar] [CrossRef]
  12. Wu, J.; Mei, P.; Wu, J.; Fu, J.-W.; Cheng, L.; Lai, L. Surface properties and microemulsion of anionic/nonionic mixtures based on sulfonate Gemini surfactant in the presence of NaCl. J. Mol. Liq. 2020, 317, 113907. [Google Scholar] [CrossRef]
  13. Salager, J.-L.; Antón, R.E.; Sabatini, D.A.; Harwell, J.H.; Acosta, E.J.; Tolosa, L.I. Enhancing solubilization in microemulsions—state of the art and current trends. J. Surfactants Deterg. 2005, 8, 3–21. [Google Scholar] [CrossRef]
  14. Cullum, D. Surfactant types; classification, identification, separation. In Introduction to Surfactant Analysis; Springer: Berlin/Heidelberg, Germany, 1994; pp. 17–41. [Google Scholar]
  15. Yu, M. Development of Herding Agents for Marine Oil Spill Response. Master’s Thesis, Memorial University of Newfoundland, St. John’s, NL, Canada, 2021. [Google Scholar]
  16. Lin, W.; Chen, G.-J.; Sun, C.-Y.; Guo, X.-Q.; Wu, Z.-K.; Liang, M.-Y.; Chen, L.-T.; Yang, L.-Y. Effect of surfactant on the formation and dissociation kinetic behavior of methane hydrate. Chem. Eng. Sci. 2004, 59, 4449–4455. [Google Scholar] [CrossRef]
  17. Salager, J.; Morgan, J.; Schechter, R.; Wade, W.; Vasquez, E. Optimum formulation of surfactant/water/oil systems for minimum interfacial tension or phase behavior. Soc. Pet. Eng. J. 1979, 19, 107–115. [Google Scholar] [CrossRef]
  18. Wade, W.; Morgan, J.C.; Schechter, R.; Jacobson, J.; Salager, J. Interfacial tension and phase behavior of surfactant systems. Soc. Pet. Eng. J. 1978, 18, 242–252. [Google Scholar] [CrossRef]
  19. Torres, L.; Moctezuma, A.; Avendaño, J.R.; Muñoz, A.; Gracida, J. Comparison of bio-and synthetic surfactants for EOR. J. Pet. Sci. Eng. 2011, 76, 6–11. [Google Scholar] [CrossRef]
  20. Saxena, N.; Goswami, A.; Dhodapkar, P.; Nihalani, M.; Mandal, A. Bio-based surfactant for enhanced oil recovery: Interfacial properties, emulsification and rock-fluid interactions. J. Pet. Sci. Eng. 2019, 176, 299–311. [Google Scholar] [CrossRef]
  21. Negin, C.; Ali, S.; Xie, Q.J.P. Most common surfactants employed in chemical enhanced oil recovery. Petroleum 2017, 3, 197–211. [Google Scholar] [CrossRef]
  22. Sofla, S.J.D.; Sharifi, M.; Sarapardeh, A.H. Toward mechanistic understanding of natural surfactant flooding in enhanced oil recovery processes: The role of salinity, surfactant concentration and rock type. J. Mol. Liq. 2016, 222, 632–639. [Google Scholar] [CrossRef]
  23. Akhlaghi, N.; Riahi, S. Experimental study of salinity and ionic strength effects on Critical Micelle Concentration of a cationic surfactant (HTAB). J. Appl. Chem. Res. 2020, 14, 91–107. [Google Scholar]
  24. Tay, A.; Mouret, A.; Mascle, M. Internal ketone sulfonate: A new bio-sourced surfactant for chemical EOR in Sea Water. In Proceedings of the Offshore Technology Conference, Houston, TX, USA, 6–9 May 2019. [Google Scholar]
  25. Liu, Z.; Li, Z.; Zhong, H.; Zeng, G.; Liang, Y.; Chen, M.; Wu, Z.; Zhou, Y.; Yu, M.; Shao, B. Recent advances in the environmental applications of biosurfactant saponins: A review. J. Environ. Chem. Eng. 2017, 5, 6030–6038. [Google Scholar] [CrossRef]
  26. Das, A.J.; Kumar, R. Utilization of agro-industrial waste for biosurfactant production under submerged fermentation and its application in oil recovery from sand matrix. Bioresour. Technol. 2018, 260, 233–240. [Google Scholar] [CrossRef] [PubMed]
  27. Das, A.J.; Kumar, R. Production of biosurfactant from agro-industrial waste by Bacillus safensis J2 and exploring its oil recovery efficiency and role in restoration of diesel contaminated soil. Environ. Technol. Innov. 2019, 16, 100450. [Google Scholar] [CrossRef]
  28. Liu, X.; Liu, S.; Cheng, Y.; Xu, G. Decrease in hydrophilicity and moisture readsorption of lignite: Effects of surfactant structure. Fuel 2020, 273, 117812. [Google Scholar] [CrossRef]
  29. Oleszek, W.; Hamed, A. Saponin-based surfactants. In Surfactants from Renewable Resources; John Wiley & Sons, Ltd.: West Sussex, UK, 2010; pp. 239–251. [Google Scholar]
  30. Nowrouzi, I.; Mohammadi, A.H.; Manshad, A.K. Engineering. Water-oil interfacial tension (IFT) reduction and wettability alteration in surfactant flooding process using extracted saponin from Anabasis Setifera plant. J. Pet. Sci. Eng. 2020, 189, 106901. [Google Scholar] [CrossRef]
  31. Bachari, Z.; Isari, A.A.; Mahmoudi, H.; Moradi, S.; Mahvelati, E.H. Application of natural surfactants for enhanced oil recovery–critical review. In Proceedings of the IOP Conference Series: Earth and Environmental Science, Prague, Czech Republic, 3–7 September 2019; p. 012039. [Google Scholar]
  32. Chhetri, A.; Watts, K.; Rahman, M.; Islam, M.J.E.S. Soapnut extract as a natural surfactant for enhanced oil recovery. Energy Sources A Recovery Util. Environ. Eff. 2009, 31, 1893–1903. [Google Scholar] [CrossRef]
  33. Deymeh, H.; Shadizadeh, S.; Motafakkerfard, R. Experimental investigation of Seidlitzia rosmarinus effect on oil–water interfacial tension: Usable for chemical enhanced oil recovery. Sci. Iran. 2012, 19, 1661–1664. [Google Scholar] [CrossRef] [Green Version]
  34. Al-Wahaibi, Y.; Joshi, S.; Al-Bahry, S.; Elshafie, A.; Al-Bemani, A.; Shibulal, B. Biosurfactant production by Bacillus subtilis B30 and its application in enhancing oil recovery. Colloids Surf. B Biointerfaces 2014, 114, 324–333. [Google Scholar] [CrossRef]
  35. Seo, S.; Mastiani, M.; Mosavati, B.; Peters, D.M.; Mandin, P.; Kim, M. Performance evaluation of environmentally benign nonionic biosurfactant for enhanced oil recovery. Fuel 2018, 234, 48–55. [Google Scholar] [CrossRef]
  36. Betancur, S.; Giraldo, L.J.; Carrasco-Marín, F.; Riazi, M.; Manrique, E.J.; Quintero, H.; García, H.A.; Franco-Ariza, C.A.; Cortés, F.B. Importance of the nanofluid preparation for ultra-low interfacial tension in enhanced oil recovery based on surfactant–nanoparticle–brine system interaction. ACS Omega 2019, 4, 16171–16180. [Google Scholar] [CrossRef] [Green Version]
  37. Betancur, S.; Carrasco-Marín, F.; Pérez-Cadenas, A.n.F.; Franco, C.A.; Jiménez, J.; Manrique, E.J.; Quintero, H.; Cortés, F.B. Effect of magnetic iron core–carbon shell nanoparticles in chemical enhanced oil recovery for ultralow interfacial tension region. Energy Fuels 2019, 33, 4158–4168. [Google Scholar] [CrossRef]
  38. Franco, C.A.; Giraldo, L.J.; Candela, C.H.; Bernal, K.M.; Villamil, F.; Montes, D.; Lopera, S.H.; Franco, C.A.; Cortés, F.B. Design and tuning of nanofluids applied to chemical enhanced oil recovery based on the surfactant–nanoparticle–brine interaction: From laboratory experiments to oil field application. Nanomaterials 2020, 10, 1579. [Google Scholar] [CrossRef] [PubMed]
  39. Franco, C.A.; Franco, C.A.; Zabala, R.D.; Bahamón, I.t.; Forero, A.n.; Cortés, F.B. Field Applications of nanotechnology in the oil and gas industry: Recent advances and perspectives. Energy Fuels 2021, 35, 19266–19287. [Google Scholar] [CrossRef]
  40. Elakkiya, V.T.; SureshKumar, P.; Alharbi, N.S.; Kadaikunnan, S.; Khaled, J.M.; Govindarajan, M. Swift production of rhamnolipid biosurfactant, biopolymer and synthesis of biosurfactant-wrapped silver nanoparticles and its enhanced oil recovery. Saudi J. Biol. Sci. 2020, 27, 1892–1899. [Google Scholar] [CrossRef] [PubMed]
  41. Tavakoli, P.; Shadizadeh, S.R.; Hayati, F.; Fattahi, M.J.P. Effects of synthesized nanoparticles and Henna-Tragacanth solutions on oil/water interfacial tension: Nanofluids stability considerations. Petroleum 2020, 6, 293–303. [Google Scholar] [CrossRef]
  42. Yekeen, N.; Malik, A.A.; Idris, A.K.; Reepei, N.I.; Ganie, K. Foaming properties, wettability alteration and interfacial tension reduction by saponin extracted from soapnut (Sapindus Mukorossi) at room and reservoir conditions. J. Pet. Sci. Eng. 2020, 195, 107591. [Google Scholar] [CrossRef]
  43. Asl, H.F.; Zargar, G.; Manshad, A.K.; Takassi, M.A.; Ali, J.A.; Keshavarz, A. Effect of SiO2 nanoparticles on the performance of L-Arg and L-Cys surfactants for enhanced oil recovery in carbonate porous media. J. Mol. Liq. 2020, 300, 112290. [Google Scholar] [CrossRef]
  44. Rosen, M.J.; Wang, H.; Shen, P.; Zhu, Y. Ultralow interfacial tension for enhanced oil recovery at very low surfactant concentrations. Langmuir 2005, 21, 3749–3756. [Google Scholar] [CrossRef]
  45. El-Batanoney, M.; Abdel-Moghny, T.; Ramzi, M. The effect of mixed surfactants on enhancing oil recovery. J. Surfactants Deterg. 1999, 2, 201–205. [Google Scholar] [CrossRef]
  46. Witthayapanyanon, A.; Harwell, J.; Sabatini, D. Hydrophilic–lipophilic deviation (HLD) method for characterizing conventional and extended surfactants. J. Colloid Interface Sci. 2008, 325, 259–266. [Google Scholar] [CrossRef]
  47. Ho, H.-O.; Hsiao, C.-C.; Sheu, M.-T. Preparation of microemulsions using polyglycerol fatty acid esters as surfactant for the delivery of protein drugs. J. Pharm. Sci. 1996, 85, 138–143. [Google Scholar] [CrossRef]
  48. Montes, D.; Henao, J.; Taborda, E.A.; Gallego, J.; Cortés, F.B.; Franco, C.A. Effect of textural properties and surface chemical nature of silica nanoparticles from different silicon sources on the viscosity reduction of heavy crude oil. ACS Omega 2020, 5, 5085–5097. [Google Scholar] [CrossRef] [PubMed]
  49. Lovato, L.; Pelegrini, B.L.; Rodrigues, J.; de Oliveira, A.J.B.; Ferreira, I.C.P. Seed oil of Sapindus saponaria L.(Sapindaceae) as potential C16 to C22 fatty acids resource. Biomass Bioenergy 2014, 60, 247–251. [Google Scholar] [CrossRef]
  50. Hess, H.-D.; Monsalve, L.M.; Lascano, C.E.; Carulla, J.E.; Diaz, T.; Kreuzer, M. Supplementation of a tropical grass diet with forage legumes and Sapindus saponaria fruits: Effects on in vitro ruminal nitrogen turnover and methanogenesis. Aust. J. Agric. Res. 2003, 54, 703–713. [Google Scholar] [CrossRef]
  51. Güçlü-Üstündağ, Ö.; Mazza, G. Saponins: Properties, applications and processing. Crit. Rev. Food Sci. Nutr. 2007, 47, 231–258. [Google Scholar] [CrossRef]
  52. Rai, S.; Bhattarai, A. A Review on Saponin: Plant-Derived Natural Surfactants. Available online: https://encyclopedia.pub/item/revision/1aaebb7a6600912bcdb117f9977aefd1 (accessed on 4 April 2022).
  53. Kregiel, D.; Berlowska, J.; Witonska, I.; Antolak, H.; Proestos, C.; Babic, M.; Babic, L.; Zhang, B. Saponin-based, biological-active surfactants from plants. In Application and Characterization of Surfactants; InTech Open: London, UK, 2017; pp. 184–205. [Google Scholar]
  54. Hernández Royero, R. Obtención de crudos de saponinas hipocolesteromizantes del Chenopodium quinoa Willd. Rev. Cuba. De Med. Mil. 1997, 26, 55–62. [Google Scholar]
  55. Lozsan, A.; Rivas, I.; Rodriguez, G.; Martinez, S.; Pérez, M. Determination of surface-active characteristics of a natural surfactant extracted from Sapindus saponaria. Tenside Surfactants Deterg. 2017, 54, 109–117. [Google Scholar]
  56. Bezerraa, K.G.; Durvala, I.J.; Silvab, I.A.; CG, F.J.C.E. Emulsifying Capacity of Biosurfactants from Chenopodium Quinoa and Pseudomonas Aeruginosa UCP 0992 with Focus of Application in the Cosmetic Industry. J. Ital. Assoc. Chem. Eng. 2020, 79, 211–216. [Google Scholar]
  57. Strother, T.; Lowry, S.; Bravo, B. Measurement of Dispersed Oil in Water Using an Infrared Analysis Method; Thermo Fisher Scientific: Madison, WI, USA, 2013. [Google Scholar]
  58. Chun, A.H.; Martin, A.N. Measurement of hydrophile-lipophile balance of surface-active agents. J. Pharm. Sci. 1961, 50, 732–736. [Google Scholar] [CrossRef]
  59. Fisher, M.L.; Colic, M.; Rao, M.P.; Lange, F.F. Effect of silica nanoparticle size on the stability of alumina/silica suspensions. J. Am. Ceram. Soc. 2001, 84, 713–718. [Google Scholar] [CrossRef]
  60. Franco, C.A.; Martínez, M.; Benjumea, P.; Patiño, E.; Cortés, F.B. Water remediation based on oil adsorption using nanosilicates functionalized with a petroleum vacuum residue. Adsorpt. Sci. Technol. 2014, 32, 197–207. [Google Scholar] [CrossRef]
  61. Milanova, D.; Kumar, R. Heat transfer behavior of silica nanoparticles in pool boiling experiment. J. Heat Transf. 2008, 130, 042401. [Google Scholar] [CrossRef]
  62. Dietrich, P.; Lerche, K.-H.; Reusch, J.; Nitzsche, R. The characterization of silica microparticles by electrophoretic mobility measurements. Chromatographia 1997, 44, 362–366. [Google Scholar] [CrossRef]
  63. Salager, J.-L.; Andérez, J.M.; Briceño, M.I.; De Sanchez, M.P.; de Gouveia, M.R. Emulsification yield related to formulation and composition variables as well as stirring energy. Rev. Téc. Ing. Univ. Zulia 2002, 25, 129–139. [Google Scholar]
  64. Salager, J.; Loaiza-Maldonado, I.; Minana-Perez, M.; Silva, F. Surfactant-oil-water systems near the affinity inversion part I: Relationship between equilibrium phase behavior and emulsion type and stability. J. Dispers. Sci. Technol. 1982, 3, 279–292. [Google Scholar] [CrossRef]
  65. Lunkenheimer, K.; Wantke, K.-D. Determination of the surface tension of surfactant solutions applying the method of Lecomte du Noüy (ring tensiometer). Colloid Polym. Sci. 1981, 259, 354–366. [Google Scholar] [CrossRef]
  66. Negm, N.A.; Morsy, S.M.; Said, M.M. Biocidal activity of some Mannich base cationic derivatives. Bioorg. Med. Chem. 2005, 13, 5921–5926. [Google Scholar] [CrossRef] [PubMed]
  67. Wang, X.; Zeng, M.; Yu, Y.-H.; Wang, H.; Mannan, M.S.; Cheng, Z. Thermosensitive ZrP-PNIPAM Pickering emulsifier and the controlled-release behavior. ACS Appl. Mater. Interfaces 2017, 9, 7852–7858. [Google Scholar] [CrossRef]
  68. Elmendorp, J.; De Vos, G. Measurement of interfacial tensions of molten polymer systems by means of the spinning drop method. Polym. Eng. Sci. 1986, 26, 415–417. [Google Scholar] [CrossRef]
  69. Verdier, C.; Vinagre, H.T.; Piau, M.; Joseph, D.D. High temperature interfacial tension measurements of PA6/PP interfaces compatibilized with copolymers using a spinning drop tensiometer. Polymer 2000, 41, 6683–6689. [Google Scholar] [CrossRef] [Green Version]
  70. Du, K.; Glogowski, E.; Emrick, T.; Russell, T.P.; Dinsmore, A.D. Adsorption energy of nano-and microparticles at liquid− liquid interfaces. Langmuir 2010, 26, 12518–12522. [Google Scholar] [CrossRef]
  71. Giraldo, L.J.; Gallego, J.; Villegas, J.P.; Franco, C.A.; Cortés, F.B. Enhanced waterflooding with NiO/SiO2 0-D Janus nanoparticles at low concentration. J. Pet. Sci. Eng. 2019, 174, 40–48. [Google Scholar] [CrossRef]
  72. Villegas, J.P.; Moncayo-Riascos, I.; Galeano-Caro, D.; Riazi, M.; Franco, C.A.; Cortés, F.B. Functionalization of γ-alumina and magnesia nanoparticles with a fluorocarbon surfactant to promote ultra-gas-wet surfaces: Experimental and theoretical approach. ACS Appl. Mater. Interfaces 2020, 12, 13510–13520. [Google Scholar] [CrossRef] [PubMed]
  73. Betancur, S.; Carrasco-Marín, F.; Franco, C.A.; Cortés, F.B. Development of composite materials based on the interaction between nanoparticles and surfactants for application in chemical enhanced oil recovery. Ind. Eng. Chem. Res. 2018, 57, 12367–12377. [Google Scholar] [CrossRef]
  74. Giraldo, L.J.; Giraldo, M.A.; Llanos, S.; Maya, G.; Zabala, R.D.; Nassar, N.N.; Franco, C.A.; Alvarado, V.; Cortés, F.B. The effects of SiO2 nanoparticles on the thermal stability and rheological behavior of hydrolyzed polyacrylamide based polymeric solutions. J. Pet. Sci. Eng. 2017, 159, 841–852. [Google Scholar] [CrossRef]
  75. Montoya, T.; Coral, D.; Franco, C.A.; Nassar, N.N.; Cortés, F.B. A novel solid–liquid equilibrium model for describing the adsorption of associating asphaltene molecules onto solid surfaces based on the “chemical theory”. Energy Fuels 2014, 28, 4963–4975. [Google Scholar] [CrossRef]
  76. Llanos, S.n.; Giraldo, L.J.; Santamaria, O.; Franco, C.A.; Cortés, F.B. Effect of sodium oleate surfactant concentration grafted onto SiO2 nanoparticles in polymer flooding processes. ACS Omega 2018, 3, 18673–18684. [Google Scholar] [CrossRef] [Green Version]
  77. Acosta, L.; Galeano-Caro, D.; Medina, O.E.; Cortés, F.B.; Franco, C.A. Nano-intermediate of magnetite nanoparticles supported on activated carbon from spent coffee grounds for treatment of wastewater from oil industry and energy production. Processes 2021, 9, 63. [Google Scholar] [CrossRef]
  78. Gupta, S.P.; Trushenski, S.P. Micellar flooding-compositional effects on oil displacement. Soc. Pet. Eng. J. 1979, 19, 116–128. [Google Scholar] [CrossRef]
  79. Johannesen, E.B.; Graue, A. Mobilization of remaining oil-emphasis on capillary number and wettability. In Proceedings of the International Oil Conference and Exhibition in Mexico, Veracruz, Mexico, 27–30 June 2007. [Google Scholar]
  80. Xia, H.; Wang, D.; Wu, W.; Jiang, H. Effect of the visco-elasticity of displacing fluids on the relationship of capillary number and displacement efficiency in weak oil-wet cores. In Proceedings of the Asia Pacific Oil and Gas Conference and Exhibition, Jakarta, Indonesia, 30 October–1 November 2007. [Google Scholar]
  81. Bashiri, A.; Kasiri, N. Properly use effect of capillary number on residual oil saturation. In Proceedings of the Nigeria Annual International Conference and Exhibition, Abuja, Nigeria, 30 July–3 August 2011. [Google Scholar]
  82. Moore, T.; Slobod, R. Displacement of oil by water-effect of wettability, rate, and viscosity on recovery. In Proceedings of the Fall Meeting of the Petroleum Branch of AIME, New Orleans, LA, USA, 2–5 October 1955. [Google Scholar]
  83. Giraldo, J.; Benjumea, P.; Lopera, S.; Cortés, F.B.; Ruiz, M.A. Wettability alteration of sandstone cores by alumina-based nanofluids. Energy Fuels 2013, 27, 3659–3665. [Google Scholar] [CrossRef]
  84. Franco-Aguirre, M.; Zabala, R.D.; Lopera, S.H.; Franco, C.A.; Cortés, F.B. Interaction of anionic surfactant-nanoparticles for gas-Wettability alteration of sandstone in tight gas-condensate reservoirs. J. Nat. Gas Sci. Eng. 2018, 51, 53–64. [Google Scholar] [CrossRef]
  85. Almutairi, M.S.; Ali, M. Direct detection of saponins in crude extracts of soapnuts by FTIR. Nat. Prod. Res. 2015, 29, 1271–1275. [Google Scholar] [CrossRef] [PubMed]
  86. Kareru, P.; Keriko, J.; Gachanja, A.; Kenji, G. Direct detection of triterpenoid saponins in medicinal plants. Afr. J. Tradit. Complement. Altern. Med. 2008, 5, 56–60. [Google Scholar] [CrossRef] [PubMed] [Green Version]
  87. Samal, K.; Das, C.; Mohanty, K. Eco-friendly biosurfactant saponin for the solubilization of cationic and anionic dyes in aqueous system. Dye. Pigment. 2017, 140, 100–108. [Google Scholar] [CrossRef]
  88. Magthalin, C.J.; Varadharajan, A.; Swarnalatha, S.; Sekaran, G. Utilization of chicken tallow for the production of cationic biosurfactant and thereof for decontamination of Cr (III) containing soil. Procedia Environ. Sci. 2016, 35, 895–913. [Google Scholar] [CrossRef]
  89. De Araujo, L.L.; Sodré, L.G.; Brasil, L.R.; Domingos, D.F.; de Oliveira, V.M.; da Cruz, G.F. Microbial enhanced oil recovery using a biosurfactant produced by Bacillus safensis isolated from mangrove microbiota-Part I biosurfactant characterization and oil displacement test. J. Pet. Sci. Eng. 2019, 180, 950–957. [Google Scholar] [CrossRef]
  90. Bordoloi, N.; Konwar, B. Bacterial biosurfactant in enhancing solubility and metabolism of petroleum hydrocarbons. J. Hazard. Mater. 2009, 170, 495–505. [Google Scholar] [CrossRef]
  91. Fuseni, A.B.; Al-Zahrani, B.H.; AlSofi, A.M. Critical micelle concentration of different classes of EOR surfactants under representative field conditions. In Proceedings of the SPE Kingdom of Saudi Arabia Annual Technical Symposium and Exhibition, Dammam, Saudi Arabia, 24–27 April 2017. [Google Scholar]
  92. Gadhave, A. Determination of hydrophilic-lipophilic balance value. IJSR 2014, 3, 573–575. [Google Scholar]
  93. Al-Oweini, R.; El-Rassy, H. Synthesis and characterization by FTIR spectroscopy of silica aerogels prepared using several Si (OR) 4 and R′′ Si (OR′) 3 precursors. J. Mol. Struct. 2009, 919, 140–145. [Google Scholar] [CrossRef]
  94. Hurtado, Y.; Beltran, C.; Zabala, R.D.; Lopera, S.H.; Franco, C.A.; Nassar, N.N.; Cortes, F.B. Effects of surface acidity and polarity of SiO2 nanoparticles on the foam stabilization applied to natural gas flooding in tight gas-condensate reservoirs. Energy Fuels 2018, 32, 5824–5833. [Google Scholar] [CrossRef]
  95. Usgodaarachchi, L.; Thambiliyagodage, C.; Wijesekera, R.; Bakker, M.G. Synthesis of mesoporous silica nanoparticles derived from rice husk and surface-controlled amine functionalization for efficient adsorption of methylene blue from aqueous solution. Curr. Res. Green Sustain. Chem. 2021, 4, 100116. [Google Scholar] [CrossRef]
  96. Rojas, D.F.H.; Gómez, P.P.; Rivera, A.R. Production and characterization of silica nanoparticles from rice husk. Adv. Mater. Lett 2019, 10, 67–73. [Google Scholar] [CrossRef]
  97. Kazemzadeh, Y.; Shojaei, S.; Riazi, M.; Sharifi, M. Review on application of nanoparticles for EOR purposes: A critical review of the opportunities and challenges. Chin. J. Chem. Eng. 2019, 27, 237–246. [Google Scholar] [CrossRef]
  98. Franco, C.A.; Zabala, R.; Cortés, F.B. Nanotechnology applied to the enhancement of oil and gas productivity and recovery of Colombian fields. J. Pet. Sci. Eng. 2017, 157, 39–55. [Google Scholar] [CrossRef]
  99. Medina-Erazo, O.; Castaño-Correa, J.; Caro-Vélez, C.; Zabala-Romero, R.; Bahamón-Pedrosa, J.I.; Cortés-Correa, F.; Franco-Ariza, C. Disaggregation and discretization methods for formation damage estimation in oil and gas fields: An overview. Dyna 2020, 87, 105–115. [Google Scholar] [CrossRef]
  100. Baviere, M.; Schechter, R.; Wade, W. The influence of alcohols on microemulsion composition. J. Colloid Interface Sci. 1981, 81, 266–279. [Google Scholar] [CrossRef]
  101. Solana, M.; Boschiero, I.; Dall’Acqua, S.; Bertucco, A. A comparison between supercritical fluid and pressurized liquid extraction methods for obtaining phenolic compounds from Asparagus officinalis L. J. Supercrit. Fluids 2015, 100, 201–208. [Google Scholar] [CrossRef]
  102. Chaturvedi, K.R.; Sharma, T. Rheological analysis and EOR potential of surfactant treated single-step silica nanofluid at high temperature and salinity. J. Pet. Sci. Eng. 2021, 196, 107704. [Google Scholar] [CrossRef]
  103. Cheraghian, G.; Hendraningrat, L. A review on applications of nanotechnology in the enhanced oil recovery part B: Effects of nanoparticles on flooding. Int. Nano Lett. 2016, 6, 1–10. [Google Scholar] [CrossRef] [Green Version]
  104. Vatanparast, H.; Eftekhari, M.; Javadi, A.; Miller, R.; Bahramian, A. Influence of hydrophilic silica nanoparticles on the adsorption layer properties of non-ionic surfactants at water/heptane interface. J. Colloid Interface Sci. 2019, 545, 242–250. [Google Scholar] [CrossRef]
  105. Thommes, M.; Kaneko, K.; Neimark, A.V.; Olivier, J.P.; Rodriguez-Reinoso, F.; Rouquerol, J.; Sing, K.S. Physisorption of gases, with special reference to the evaluation of surface area and pore size distribution (IUPAC Technical Report). Pure Appl. Chem. 2015, 87, 1051–1069. [Google Scholar] [CrossRef] [Green Version]
  106. Azam, M.R.; Tan, I.M.; Ismail, L.; Mushtaq, M.; Nadeem, M.; Sagir, M. Static adsorption of anionic surfactant onto crushed Berea sandstone. J. Pet. Explor. Prod. Technol. 2013, 3, 195–201. [Google Scholar] [CrossRef] [Green Version]
  107. Wu, Y.; Chen, W.; Dai, C.; Huang, Y.; Li, H.; Zhao, M.; He, L.; Jiao, B. Reducing surfactant adsorption on rock by silica nanoparticles for enhanced oil recovery. J. Pet. Sci. Eng. 2017, 153, 283–287. [Google Scholar] [CrossRef]
  108. Suresh, R.; Kuznetsov, O.; Agrawal, D.; Darugar, Q.; Khabashesku, V. Reduction of surfactant adsorption in porous media using silica nanoparticles. In Proceedings of the Offshore Technology Conference, Houston, TX, USA, 30 April–3 May 2018. [Google Scholar]
  109. Guzmán, J.D.; Betancur, S.; Carrasco-Marín, F.; Franco, C.A.; Nassar, N.N.; Cortés, F.B. Importance of the adsorption method used for obtaining the nanoparticle dosage for asphaltene-related treatments. Energy Fuels 2016, 30, 2052–2059. [Google Scholar] [CrossRef]
  110. Feng, Y.; Yang, F.; Wang, Y.; Ma, L.; Wu, Y.; Kerr, P.G.; Yang, L. Basic dye adsorption onto an agro-based waste material—Sesame hull (Sesamum indicum L.). Bioresour. Technol. 2011, 102, 10280–10285. [Google Scholar] [CrossRef] [PubMed]
  111. Bera, A.; Kumar, T.; Ojha, K.; Mandal, A. Adsorption of surfactants on sand surface in enhanced oil recovery: Isotherms, kinetics and thermodynamic studies. Appl. Surf. Sci. 2013, 284, 87–99. [Google Scholar] [CrossRef]
  112. Seyyedi, M.; Sohrabi, M.; Farzaneh, A. Investigation of rock wettability alteration by carbonated water through contact angle measurements. Energy Fuels 2015, 29, 5544–5553. [Google Scholar] [CrossRef]
  113. Amirmoshiri, M.; Zhang, L.; Puerto, M.C.; Tewari, R.D.; Bahrim, R.Z.B.K.; Farajzadeh, R.; Hirasaki, G.J.; Biswal, S.L. Role of wettability on the adsorption of an anionic surfactant on sandstone cores. Langmuir 2020, 36, 10725–10738. [Google Scholar] [CrossRef]
  114. Somasundaran, P.; Zhang, L. Adsorption of surfactants on minerals for wettability control in improved oil recovery processes. J. Pet. Sci. Eng. 2006, 52, 198–212. [Google Scholar] [CrossRef]
  115. Imuetinyan, H.; Agi, A.; Gbadamosi, A.; Junin, R. Extraction, characterization and evaluation of saponin-based natural surfactant for enhanced oil recovery. Arab. J. Geosci. 2022, 15, 226. [Google Scholar] [CrossRef]
Figure 1. Roadmap for the tuning of the bio-nanofluid.
Processes 10 01057 g001
Figure 2. Experimental setup for contact angle measurement in the theta optical tensiometer. The four main components of the assembly are observed: (1). Software, (2). High-definition camera, (3). High-pressure cell, and (4). Light source.
Processes 10 01057 g002
Figure 3. Schematic representation of the experimental setup for displacement tests at reservoir condition: (1) Hydraulic pump, (2) pressure transducer, (3) manometer, (4) valves, (5) coreholder, (6) cylinder, (7) filter, (8) displacement pump, and (9) pressure multiplier. Adapted with permission from Franco et al. [38], Nanomaterials; published by MDPI, 2020.
Processes 10 01057 g003
Figure 4. FTIR spectra sample of AGC extracted from soapnut.
Processes 10 01057 g004
Figure 5. Thermogravimetric analysis of the AGC extracted from soapnut.
Processes 10 01057 g005
Figure 6. Interfacial tension (σ) for the critical micelle concentration (CMC) determination at different concentrations of AGC. Measurements made at 25 °C.
Processes 10 01057 g006
Figure 7. FTIR spectra of silica-based nanoparticles from commercial silica-based nanoparticles SiO2-C1 and SiO2-C2, and silica-based nanoparticles in-house synthesized from rice husks (SiO2-RH) used for bio-nanofluid system tuning.
Processes 10 01057 g007
Figure 8. Thermogravimetric analysis (TGA) of silica-based nanoparticles from Sigma-Aldrich (SiO2-C1), silica-based nanoparticles in-house synthesized from rice husks (SiO2-RH), and commercial silica-based nanoparticles (SiO2-C2).
Processes 10 01057 g008
Figure 9. (a) Interfacial tension for ratios of 20:80, 50:50, and 80:20 AGC:bio-ethanol at a fixed concentration of AGC of 1000 mg·L−1. (b) Interfacial tension for concentrations of 50, 100, 300, 1000, 2000, and 3000 mg·L−1 of AGC in brine at 80:20 ratio AGC:bio-ethanol solution. Measures at 25 °C by the Du-Noüy ring Method. Measurements were performed in triplicate, and error bars represent standard deviation.
Processes 10 01057 g009
Figure 10. Interfacial tension measurements for the AGC:bio-ethanol (80:20) and dosages of 100, 300, 500, and 1000 mg·L−1 of silica-based nanoparticles from Sigma-Aldrich (SiO2-C1), silica-based nanoparticles in-house synthesized from rice husks (SiO2-RH), and commercial silica-based nanoparticles (SiO2-C2). Measurements at reservoir temperature of 47 °C by spinning drop equipment. The error bars correspond to their standard deviation.
Processes 10 01057 g010
Figure 11. Interfacial tension measurements for combinations of SB/AGC:bio-ethanol at proportions of SB at 33, 42, 50, and 58% v·v−1 in the presence and absence of SiO2-RH nanoparticles at 100 mg·L−1. Measurements at reservoir temperature (47 °C) by spinning drop equipment. The standard deviation is represented by error bars.
Processes 10 01057 g011
Figure 12. (a) Adsorption isotherms of bio-nanofluid onto Ottawa sand at 25, 40, and 50 °C. (b) Adsorption isotherms of bio-fluid onto SiO2-RH nanoparticles at 25, 40, and 50 °C. The symbols represent the experimental data with respective error bars of standard deviation. The continuous line represents the SLE model fitting.
Processes 10 01057 g012
Figure 13. Contact angles measurements of the water phase. Brine, bio-fluid, and bio-nanofluid were used to treat previously aged cores. The experiments were performed at reservoir temperature (47 °C). The treatment was carried out for 48 h at reservoir temperature.
Processes 10 01057 g013
Figure 14. Estimated capillarity number (Nc) for Brine, bio-fluid, and bio-nanofluid systems.
Processes 10 01057 g014
Figure 15. Recovery factor of displacement test at low pressure of bio-fluid and bio-nanofluid system at a dosage of 1000 mg·L−1. Setup performed at room conditions.
Processes 10 01057 g015
Figure 16. Recovery factor of displacement test at reservoir conditions of bio-nanofluid tuned with SiO2-RH nanoparticles at 100 mg·L−1 assessed in dosage of 500, 750, and 1000 mg·L−1 at 0.33 VPI each one before waterflooding. Setup performed at reservoir conditions (overburden pressure 2500 psi and 47 °C).
Processes 10 01057 g016
Table 1. Properties of the porous media used for the optimal scenario of bio-fluid (Core 1) and bio-nanofluid injection (Core 2).
PropertyCore 1Core 2
Length (cm)7.37.5
Diameter (cm)3.84.0
Porosity (%)1213
Permeability (mD)149155
Mineralogy50% Ottawa sand–50% reservoir core cuts
Table 2. Binding energy (ΔE) of a single particle to the oil/water interface for SiO2-RH, SiO2-C2, and SiO2-C1 at different concentrations at 47 °C.
Silica-Based Nanoparticle Concentration (mg·L−1) Δ E   K B T
SiO2-C1100130.05
300128.64
500128.29
1000117.89
SiO2-C2100144.88
300144.49
500142.54
1000134.73
SiO2-RH100194.19
300195.48
500194.96
1000194.45
Table 3. Concentration of AGC:bio-ethanol (80:20), commercial surfactant (SB), and SiO2-RH nanoparticles in the tuned bio-nanofluid.
ComponentConcentration in the Bio-Nanofluid
AGC:bio-ethanol (80:20)50% v·v−1
Commercial surfactant (SB)50% v·v−1
SiO2-RH nanoparticles100 mg·L−1
Table 4. Parameters of solid–liquid equilibrium (SLE) model for bio-fluid adsorption isotherms onto the sand rock and SiO2-RH nanoparticles.
AdsorbentTemperature (°C) H (mg·g−1) K (g·g−1) N m   ( mg · g 1 ) R S M E %
Ottawa sand250.420.753.772.05
400.941.583.390.01
501.001.593.268.40
SiO2-RH nanoparticles25 °C4.401.511678.302.95
40 °C5.831.641382.303.79
50 °C9.522.871225.207.10
Table 5. Thermodynamics parameters for bio-fluid adsorption isotherms onto the sand rock and SiO2-RH nanoparticles.
AdsorbentTemperature
(°C)
Δ S a d s o r p t i o n 0   ±   0.01
(J· (mol·K)−1)
Δ H a d s o r p t i o n 0   ±   0.02
(kJ· mol−1)
Δ G a d s o r p t i o n 0   ±   0.01
(J· mol−1)
Ottawa sand250.0824.230.73
401.19
501.25
SiO2-RH nanoparticles250.0720.501.03
401.29
502.83
Table 6. Characterization of Density and Viscosity for Brine, bio-fluid tuned system (Brine + 1000 mgL−1 bio-fluid), and bio-nanofluid tuned system (Brine + 1000 mg·L−1 bio-nanofluid).
SystemDensity (g·cm−3)Viscosity (m·Pas·s−1) @ 5.6 s−1
Brine1.0111.058
Bio-fluid1.0361.064
Bio-nanofluid1.0441.165
Publisher’s Note: MDPI stays neutral with regard to jurisdictional claims in published maps and institutional affiliations.

