Abstract
Thymoquinone (THY) is a bioactive compound present in the seed powder of Nigella sativa (NS). This research aims to precisely and accurately estimate THY using high-performance liquid chromatography (HPLC) with a Quality by Design (QbD) application. Box-Behnken design (BBD) was employed to optimize the chromatographic conditions for HPLC method development, taking mobile phase flow rate, pH of the buffer, and λmax as independent variables and retention time and tailing factor as the measured responses. The mobile phase composition was methanol: acetonitrile: buffer (2.2 mM ammonium formate) at the ratio of 35:50:15 v/v/v on a Symmetry® C18 (5 μm, 3.9 × 150 mm) column. In isocratic mode, it had a flow rate 0.9 mL min−1 and eluted analyte was detected at 249 nm. Validation parameters followed the International Council for Harmonization (ICH) guidelines for the new HPLC method. The method was linear over the range 6.25–100 µg mL−1 with a coefficient of determination (r2) of 0.9957. The limit of detection (LOD) and limit of quantification (LOQ) were 2.05 and 6.25 µg mL−1, respectively. The %RSD of system suitability for retention time was 1.42% and for the tailing factor it was 0.695%. In addition, the developed method was precise, accurate, and robust according to ICH criteria. The developed HPLC method is simple, accurate, quick, and robust, and it could be used for the routine analysis of THY in different kinds of formulations.
1. Introduction
The Nigella sativa L., a miracle plant that belongs to the family Ranunculaceae, contains thymoquinone (THY) as the main active constituent of the seed. Apart from THY, there are many bioactive ingredients in the seed powder. THY has several pharmacological effects, reported by several researchers, which is why it is of high importance among the ingredients [1]. The IUPAC name of THY is 2-isopropyl-5-methylbenzo-1,4-quinone (Figure 1).
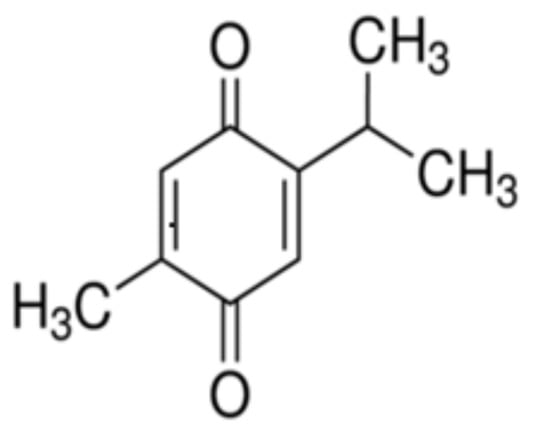
Figure 1.
Molecular structure of 2-isopropyl-5-methylbenzo-1,4-quinone (THY).
Therapeutics effects of THY have shown potential benefits in Coronavirus (COVID-19) [2], anticancer [3], antimicrobial [4] and analgesic effect [5], protection against several diseases with anti-inflammatory effects [6], and neuroprotective effects reported with the mechanism MAP Kinase and apoptosis pathways [7]. In formulation development, the desired constituents must first be extracted in high concentration from the herbal extract without affecting its natural properties, then, the active ingredient needs to be isolated. Several extraction methods have been reported, such as solvent extraction, cold press extraction, and supercritical fluid extraction (SFE). In oil, the extraction method generally adopted is supercritical fluid method extraction. Cold press and solvent extraction are the conventional techniques [8].
Characterization and quantification of the extracts have been performed by different analytical techniques such as spectrophotometric, chromatographic, or hyphenated. Different studies have been reported for the estimation and identification of THY from the seed powder extracts such as ultra-violet (UV)-spectrophotometer [9,10], high-performance thin-layer chromatography (HPTLC) [11,12,13], and high-performance liquid chromatography (HPLC)-UV [14,15,16], and ultra-high-performance liquid chromatography (UHPLC) [17]. Some HPLC-UV and HPLC-diode array detection (DAD) methods have also been used for the determination of THY in combination with various polyphenols [14,15,18,19,20,21]. HPLC-DAD methods have also been used for the determination of bioactive phenolic compounds in various plants and food-based products [22,23].
Box-Behnken design (BBD) is a useful approach in the optimization of chromatographic conditions for analytical methods. BBD-based optimization is based on three-factor analysis combined in blocks [24]. Compared with other approaches, the BBD optimization reduces the total numebr of experiments required for the optimization. BBD can be utilized as a technique for the optimization of chromatographic parameters [24,25]. The approach of quality by design (QbD) in an experiment to enhance the reliability of the result is a unique method. In method development and validation by the HPLC analytical technique, the chromatographic conditions optimized by QbD lead to both cost- and time-saving, which is very useful for routine analysis. HPLC method development followed the trial-and-error or one-factor-at-a-time (OFAT) approach, where a series of experiments are performed until a sufficient resolution of the peak is observed by changing one chromatographic parameter continuously. The number of experiments increased if more than one parameter is considered and it can be controlled using the QbD approach [25,26].
Reported analytical methods of THY analysis lack the optimization provided by QbD or BBD. Therefore, the present research work has been performed with a focus on developing a new HPLC method for the estimation of THY in seed powder of NS with a QbD approach, and validating the developed method according to International Council for Harmonization (ICH) guidelines. We followed the (ICH) Q8 and ICH Q8 (R2) for the QbD application in this study.
2. Materials and Methods
2.1. Drugs and Chemicals
The reference sample THY (purity > 99%) was obtained from Sigma Aldrich (St. Louis, MO, USA). All reagents were of analytical grade, and water was used to prepare the aqueous solution. Buffers were prepared using Milli-QR Gradient A10 R (Millipore, Moscheim Cedex, France) having a pore size of 0.22 μm.
2.2. Instruments
A Waters HPLC system (Waters Breeze 1525, Eschborn, Germany) was used, equipped with binary pump (Waters 1525), auto-sampler (Waters 2707), and UV-Visible detector (Waters 2489). Analytical C-18 reverse phase columns were fitted in an HPLC system with different package material, length, and micro-level-particle sizes with suitable guard columns. A Mettler Toledo analytical balance (Kern & Sohn GmbH, Darmstadt, Germany), micropipettes (Eppendorf, St. Louis, MO, USA), and Shimadzu UV-spectrophotometer were the other instrument used in this analysis.
2.3. Nigella sativa Seed Powder Extraction
The N. sativa seeds were collected from Jaipur, Rajasthan, India in November 2021. The collected seeds were transferred to amber-colored glass bottles and kept cool and dark until needed. The weighted quantity of seed powder was transferred in a container which was covered with muslin cloth, and a sufficient volume of methanol. The obtained mixture was kept like this for 72 h. Whatman paper no. 42 was used for the extraction of the methanolic extracts. The filtrates were passed through the rotary evaporator to concentrate the filtrate under reduced pressure. The filtrate was labelled as meth-NS and preserved in an airtight amber-colored glass container at 4 °C until use.
2.4. Determination of λmax and Preparation of Standard Solution
For the preparation of stock solution, 5 mg of standard THY was weighed accurately and dissolved in 5 mL of methanol, giving a concentration of 1 mg mL−1 (1000 μg mL−1). Further, from the stock solution, a solution having a concentration of 100 μg mL−1 was prepared and this solution was run in the wavelength range from 190–400 nm and was founded λmax at 249 nm.
2.5. Phytochemical Screening
Following the Harborne and Kokate methodology, the methanolic extract was further dissolved in the mother solvent to perform the phytochemical screening [27,28].
2.6. QbD Approach for the HPLC Method Development
2.6.1. Risk Assessment Studies
The object of the risk assessment studies (RASs) is to identify and line up the factors that affect the critical quality attributes (CQAs). In the QbD approach, the first step in the process of early pharmaceutical development is RAS. The RAS aims to examine the different factors that control the target method quality profile (TMQP). As the critical analytical attributes (CAAs) are studied, it is then easy to establish the relationships among the critical method parameters of the TMQP before risk assessment studies. The results of the RAS made it easy to discover the reason for the problems, and then afterwards to fix the rationale of the defects, variations, or failures. To perform the RAS first requires accumulating the information about the individual’s factor risk, and it is segregated into high, medium, and low. A total of seven factors with three levels was considered in the present research for screening the systemic optimization. Out of the seven, only two factors were selected [29,30,31,32].
2.6.2. Optimization
Box-Behnken design (Design Expert 13.0.3.0 software Stat-Ease Inc., Minneapolis, MN, USA) was employed for the trials as each trial differed from the other due to interaction effects over the dependent variables. The experiment was designed with two dependent variables of retention time (minute) and tailing factor, and three independent variables, which are flow rate (mL/min), pH of the buffer, and λmax of single and combined effects, to achieve optimized chromatographic conditions in a total of seventeen runs [24,33]. All the variables were statistically analyzed using one-way analysis of variance (ANOVA).
2.7. Method Development
For the method development the chromatographic separation was performed using an asymmetry LC-18 stainless steel column (150 mm × 3.9 mm × 5 μm). The composition of the mobile phase was a methanol: acetonitrile: buffer (2.2 mM ammonium formate) ratio of 35:50:15 v/v/v, eluted in isocratic mode at a flow rate 0.9 mL min−1. The filtered mobile phase was degassed in an ultrasonic bath for 5 min, then filtration was performed using a Millipore membrane filter (0.2 μm) (Millipore, Yonezawa, Japan). The volume of sample for injection was 15 μL and detection of the analyte was performed using a UV-spectrophotometer detector at 249 nm having a column oven temperature of 28 °C and sample cooler temperature of 8 °C ± 0.3 °C. A resolved peak with desired peak symmetry was observed with the above chromatographic conditions. The total run time was 18 min. Before chromatographic analysis, the column interacted with the mobile phase for the saturation of the stationary phase.
2.8. Stock, Standard, and Quality Control Sample
A stock solution of THY of strength (1 mg mL−1) was prepared in methanol, then it was diluted to make a solution of strength 100 μg mL−1. From this solution, five dilutions were made to create concentrations in the range of 6.25–100 μg mL−1. Over this concentration range, the determination coefficient (r2) value of 0.9957 was obtained.
2.9. Method Validation
The HPLC developed method was validated as per the ICH guidelines. The parameters that were performed for the validation are system suitability, linearity, LOD, LOQ, accuracy, precision, robustness, and solution stability [34].
2.9.1. System Suitability Test
HPLC instrument performance was checked by the system suitability experiment. This follows USP 24/NF 19, where the experimental result must be reproducible. Before analysis of any batch, the chromatographic system’s reproducibility was checked. This considered two factors such as retention time and tailing factors of individual results for six batches (n = 6) of sample and reported its percentage relative standard deviation (%RSD) [34].
2.9.2. Linearity
Five dilutions of standard THY was considered for the preparation of a calibration curve over the range of 6.25–100 μg mL−1 (n = 6). Each dilution response was ensured by the detector and coefficient of determination value r2 by the regression equation. The curve was plotted between the area of the peak on the Y-axis and concentration of standard solution on the X-axis. With the help of this curve, the quantification of the extract was calculated by measuring the absorbance in the given λmax [35].
2.9.3. Precision and Accuracy
The experiment was performed for the determination of the precision of the developed method in terms of inter-day and intra-day results, and reported the practical concentration of three quality control samples such as LQC (6.25 μg mL−1) MQC (25 μg mL−1) and HQC (100 μg mL−1) of the drug and determined the %RSD of each level of concentration. The accuracy of the developed method was determined by a traditional addition approach method (percentage recovery). For this, a pre-quantified concentration of the sample was taken at a concentration of 45 μg mL−1, then 0, 50, 100, and 150 percent of drug solution was added [36].
2.9.4. Solution Stability
The experiment was performed to check the stability of the solution with a quality control sample of a level MQC (25 μg mL−1), at a temperature of 25 °C for 14 days and 2–8 °C for 30 days. Experiment results are presented in terms of % recovery and %RSD [37,38].
2.9.5. Robustness Study
To establish the robustness of the developed HPLC method for this performed experiment, with intentional change in the chromatographic conditions, if the variations in the result were within the acceptable range, the HPLC method was considered a robust method. For this, the parameters considered included the pH of the buffer, the flow rate, and the detector’s wavelength, all of which influence the retention time, and tailing factor [37].
2.9.6. Limit of Detection (LOD) and Limit of Quantification (LOQ)
The LOD and LOQ was fixed by the formula 3.3 xSD/Slope and 10 xSD/Slope, respectively.
3. Results
3.1. Phytochemical Screening
The extract was subjected to the Carbohydrate test [Molisch’s Test(+), Iodine Test(-), and Benedict’s Test(+)], Alkaloids test [Hager’s Test(+) and Wager’s Test(+)], Lipids [Grease(+)], 1 mL extract+ Few drops of dilute NaOH, then a few drops of dilute acid added [Flavonoid(+)], Extract + Conc.H2SO4 [Steroids(+)], Salkowski test [Terpenoids(+)], and diphenylhydrazine dissolved in concentrated sulphuric acid were added to extract [Vitamin C(+)].
3.2. Risk Assessment Studies
After screening and analyzing the various factors in the risk assessment studies, the two responses of retention time and tailing factor were considered for the method development. The effects of each component on chromatographic conditions have been presented in Table 1.

Table 1.
Risk assessment studies for HPLC method development.
3.3. Optimization
3.3.1. Retention Time
The retention time was optimized with the two independent variables. The BBD surface response was robust, as five trials results were shown ANOVA for the quadratic model (trial 13–17) Table 2. The inbuilt model is significant as the F-value was 28.05. There is only a 0.01% chance that an F-value this large could occur due to noise. Model terms are significant because P-values were less than 0.0500. Here, the significant model terms are, A, B, C, AB, BC, A², B² (ANOVA for quadratic model), where “A” (flow rate), “B” (molarity of buffer and “C” (λmax). Signal-to-noise ratio is measured by adequate precision, with a value greater than 4 being desirable. Here, the value of 21.766 indicates an adequate signal. Model graphs of this in terms of contour plots (AB, AC, and BC) are seen in Figure 2, and 3D responses (AB, AC, and BC) in Figure 3.
Retention time = + 7.5 − 0.1625 ∗ A + 0.1625 ∗ B + 0.1 ∗ C − 0.175 ∗ AB − 0.05 ∗ AC − 0.1 ∗ BC + 0.3125 ∗ A2 + 0.1125 ∗ B2 + 0.0375 ∗ C2.
Table 2.
Box-Behnken design (BBD) based independent variables and their effect on dependent variables.
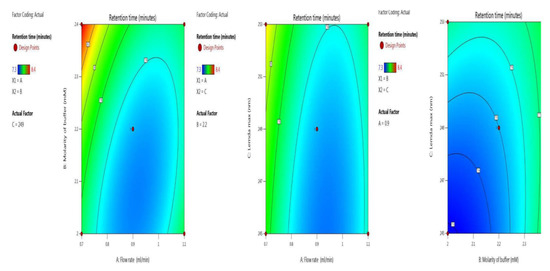
Figure 2.
Contour plots for retention time in terms of AB, AC, and BC.
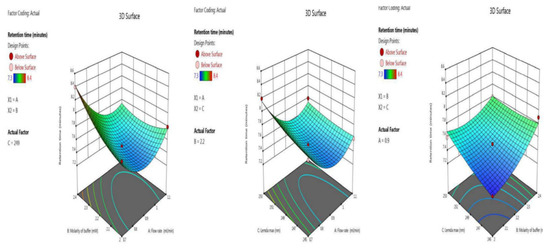
Figure 3.
3 D responses for retention time in terms of AB, AC, and BC.
3.3.2. Tailing Factor
Symmetry and the shape of the peak indicate the developed method’s accuracy. Here we optimized the tailing factor value by BBD surface response with ANOVA for the quadratic model, the results of which are shown in the last five trials (13–17) in Table 2. The inbuilt model was significant with an F-value of 126.81. There was a chance of only 0.01% that an F-value this large could occur due to noise. The p-value indicates model terms are significant, as it less than 0.0500; here the model terms are A, B, C, AB, AC, A², B², C². Values greater than 0.1000 indicate the model terms are not significant. An adequate signal was observed, as the value of 34.326 is greater than 4, which is desirable. Model graphs of this in terms of contour plots (AB, AC, and BC) are seen in Figure 4, and 3D responses (AB, AC, and BC) in Figure 5.
Tailing factor = 0.98 – 0.00375 ∗ A + 0.0075 ∗ B − 0.00375 ∗ C − 0.0425 ∗ AB + 0.045 ∗ AC + 0.0025 ∗ BC − 0.005 ∗ A2 + 0.0275 ∗ B2 + 0.015 ∗ C2.
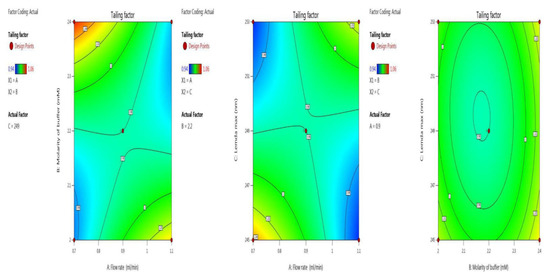
Figure 4.
Contour plots for tailing factor time in terms of AB, AC, and BC.
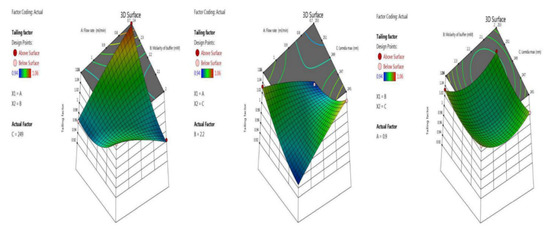
Figure 5.
3 D responses for tailing factor in terms of AB, AC, and BC.
3.4. Stock, Standard, and Quality Control Sample
At optimized conditions, we ran the sample to check the specificity and retention time of the drug THY. The results of the study showed no peak in blank solution, which confirmed the specificity of the result and confirmed the retention time as shown in Figure 6.
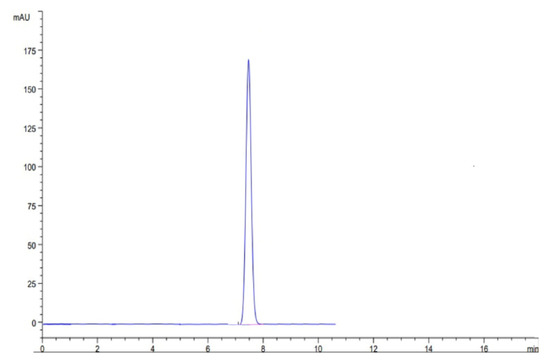
Figure 6.
Representative HPLC chromatogram of TYH.
3.5. Method Validation
3.5.1. System Suitability Test
The system suitability test result of the sample batch showed reproducible results for retention time and tailing factor. The value of standard deviation (SD) and percentage relative standard deviation (%RSD) indicated that the reproducibility of the chromatographic system was good. The %RSD below 5% was in line with the acceptance criteria (Table 3).
Table 3.
System suitability (n = 6).
3.5.2. Linearity
The calibration of the five dilutions in the range of (6.25–100 μg mL−1) was plotted between peak area and concentration. Results of linear regression analysis of calibration curves (n = 6) of THY are shown in Table 4.
Table 4.
Linear regression analysis of calibration curves (n = 6).
3.5.3. Precision and Accuracy
The experiment was performed for the determination of precision and accuracy for the developed HPLC method (n = 6) for the three quality control levels, with the result presented in Table 5. The %RSD value of the precision and accuracy was below 2%, indicating that the developed method was precise and accurate.
Table 5.
Precision and accuracy (n = 6).
3.5.4. Solution Stability
The stability of the drug solution (THY) was checked at a temperature of 25 °C for 14 days and 2–8 °C for 30 days for a concentration level of 25 μg mL−1. The results at 25 °C for 14 days was 24.65 μg mL−1 ± 0.223 (% recovery 98.6 ± 1.652 and value of %RSD = 1.685) and at 2–8 °C for 30 days was 24.42 µg/mL ± 0.243 (% recovery 97.68 ± 1.752 and value of %RSD = 1.645). The %RSD of the experiment was less than 2, which was desirable. The possible degradation product of THY in aqueous solution could be a thymohydroquinone. The proposed scheme for the degradation of THY in an aqueous solution is included in Figure 7.
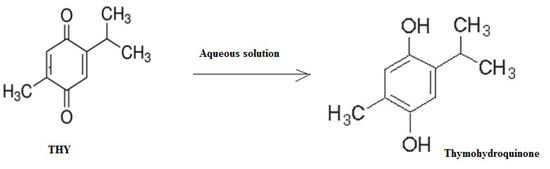
Figure 7.
The possible degradation scheme of THY in an aqueous solution.
3.5.5. Robustness Study
Intended changes in the developed method, i.e., change in pH of the buffer, flow rate, and detector wavelength, do not significantly affect the drug’s (THY) retention time and tailing factor. The results are shown in Table 6.
Table 6.
Robustness (n = 6).
4. Discussion
4.1. Method Optimization
A new HPLC method is developed with the application of QbD for the optimization of chromatographic conditions. The two measured responses were tailing factor and retention time. Two responses were well optimized using three independent variables by applying the QbD approach. The optimized conditions are new and reliable, making the method simple, economic, robust, precise, and accurate. For the evaluation of the factors influencing the retention time and tailing factors, first, a screening was performed and then the factors were selected. After that, the method was developed with the final selected factors. A resolved and symmetric peak without interference in retention time was obtained.
4.2. Method Validation
Developed the new HPLC method was validated according to ICH guidelines. The proposed HPLC method of THY analysis was linear, accurate, precise, robust, and sensitive for the determination of THY. The results of the validation parameters were in the acceptable range, which indicates the HPLC method is robust and reliable for routine analysis of THY in extract or formulations. Various methods are reported for the determination of THY in different samples. Most of the reported methods are also accurate and precise for THY determination [14,15,16,18,19,20,21]. However, reported analytical methods of THY analysis were not optimized for the chromatographic conditions using a QbD approach. The present method of THY analysis has been optimized well for different chromatographic parameters using a QbD approach in addition to its simplicity, economy, precision, and accuracy.
5. Conclusions
Estimation of THY in seed powder of N. sativa with the approach of QbD for the optimization of chromatographic conditions for the HPLC method is simple, accurate, and cost-effective. This method will be employed in routine analysis. The HPLC method was developed by employing QbD (following ICH Q8 and ICH Q8 (R2) guidelines) and validated. The extract of the NS seed powder was analyzed with the developed calibration curve, and from the calibration curve, THY was estimated in the extract by the extra plotting method. The results of every validation parameter were promising, indicating that the new method is robust and precise. This new method can be used for the analysis of a THY-containing formulation. To achieve a better quality of product, it requires focusing on the quality of the process that can be gained by employing the quality by design approach. The reported methods of THY analysis were not optimized for different chromatographic conditions compared with the present analytical method. It is a simple, accurate, and economical method for THY estimation. By improving the quality of the process, we can improve the quality of the finished product. A better quantity of THY determination will help in the study of its antimicrobial and antioxidant therapeutic effects.
Author Contributions
Conceptualization, P.A. and M.T.; methodology, M.T., F.S., A.I.F., M.H.A. and T.M.A.; software, M.M.G.; validation, S.A., F.S. and M.M.G.; formal analysis, M.M.G.; investigation, T.M.A. and A.I.F.; resources, S.A.; data curation, M.T.; writing—original draft preparation, M.T.; writing—review and editing, S.A., F.S. and P.A.; visualization, S.A.; supervision, P.A.; project administration, P.A.; funding acquisition, S.A. All authors have read and agreed to the published version of the manuscript.
Funding
This research was funded by the Researchers Supporting Project (number RSP-2021/146) at King Saud University, Riyadh, Saudi Arabia and The APC was funded by RSP.
Institutional Review Board Statement
Not applicable.
Informed Consent Statement
Not applicable.
Data Availability Statement
Not applicable.
Acknowledgments
Authors are thankful to Researchers Supporting Project (number RSP-2021/146) at King Saud University, Riyadh, Saudi Arabia.
Conflicts of Interest
The authors declare no conflict of interest.
References
- Ahmad, A.; Mishra, R.K.; Vyawahare, A.; Kumar, A.; Rehman, M.U.; Qamar, W.; Khan, A.Q.; Khan, R. Thymoquinone (2-Isopropyl-5-methyl-1, 4-benzoquinone) as a chemopreventive/anticancer agent: Chemistry and biological effects. Saudi Pharm. J. 2019, 27, 1113–1126. [Google Scholar] [CrossRef]
- Badary, O.A.; Hamza, M.S.; Tikamdas, R. Thymoquinone: A promising natural compound with potential benefits for COVID-19 prevention and cure. Drug Des. Dev. Ther. 2021, 15, 1819–1833. [Google Scholar] [CrossRef] [PubMed]
- Gomathinayagam, R.; Ha, J.H.; Jayaraman, M.; Song, Y.S.; Isidoro, C.; Dhanasekaran, D.N. Chemopreventive and anticancer effects of thymoquinone: Cellular and molecular targets. J. Cancer Prev. 2020, 25, 136–151. [Google Scholar] [CrossRef] [PubMed]
- Forouzanfar, F.; Bazzaz, B.S.; Hosseinzadeh, H. Black cumin (Nigella sativa) and its constituent (thymoquinone): A review on antimicrobial effects. Iran. J. Basic Med. Sci. 2014, 17, 929–938. [Google Scholar] [PubMed]
- Celik, F.; Göçmez, C.; Karaman, H.; Kamaşak, K.; Kaplan, I. Therapeutic effects of thymoquinone in a model of neuropathic pain. Curr. Ther. Res. Clin. Exp. 2014, 76, 11–16. [Google Scholar] [CrossRef]
- Kohandel, Z.; Farkhondeh, T.; Aschner, M.; Samarghandian, S. Anti-inflammatory effects of thymoquinone and its protective effects against several diseases. Biomed. Pharmacother. 2021, 138, 111492. [Google Scholar] [CrossRef]
- Tabeshpour, J.; Mehri, S.; Abnous, K.; Hosseinzadeh, H. Neuroprotective effects of thymoquinone in acrylamide-induced peripheral nervous system toxicity through MAPKinase and apoptosis pathways in rat. Neurochem. Res. 2019, 44, 1101–1112. [Google Scholar] [CrossRef]
- Zhang, Q.-W.; Lin, L.-G.; Ye, W.-C. Techniques for extraction and isolation of natural products: A comprehensive review. Chin. Med. 2018, 13, 20. [Google Scholar] [CrossRef]
- Salmani, J.M.; Asghar, S.; Lv, H.; Zhou, J. Aqueous solubility and degradation kinetics of the phytochemical anticancer thymoquinone; probing the effects of solvents, pH and light. Molecules 2014, 19, 5925–5939. [Google Scholar] [CrossRef]
- Snehalatha, B.; Momin, M.; Mishal, A.V.; Kale, T.R. Development and validation of spectrophotometric method for simultaneous estimation of Nigella sativa seed oil and ginger extract in the same dosage form. Int. J. Pharm. Sci. Res. 2014, 5, 5235–5239. [Google Scholar]
- Belete, Y.; Dagne, E. HPTLC assay of thymoquinone in black seed and black seed oil (Nigella sativa Linn) and identification of thymoquinone conversion with Uv-Vis. J. Drug Deliv. Ther. 2014, 4, 5–9. [Google Scholar] [CrossRef]
- Taleuzzaman, M.; Imam, S.S.; Gilani, S.J. Quantitative determination of thymoquinone in Nigella sativa and its nano formulation using validated stability indicating HPTLC densiometric method. Int. Curr. Pharm. J. 2017, 6, 53–60. [Google Scholar] [CrossRef]
- Foudah, A.I.; Shakeel, F.; Alqarni, M.H.; Ross, S.A.; Salkini, M.A.; Alam, P. Green NP-HPTLC and green RP-HPTLC methods for the determination of thymoquinone: A contrast of validation parameters and greenness assessment. Phytochem. Anal. 2022, 33, 184–193. [Google Scholar] [CrossRef] [PubMed]
- Iqbal, M.S.; Ahmad, A.; Pandey, B. Solvent based optimization for extraction and stability of thymoquinone from Nigella sativa Linn and its quantification using RP-HPLC. Physiol. Mol. Biol. Plants 2018, 24, 1209–1219. [Google Scholar] [CrossRef] [PubMed]
- Habib, N.; Choudhry, S. HPLC quantification of thymoquinone extracted from Nigella sativa L. (Ranunculaceae) seeds and antibacterial activity of its extracts against Bacillus species. Evid. Based Compl. Altern. Med. 2021, 2021, 6645680. [Google Scholar] [CrossRef] [PubMed]
- Gilani, S.J.; Imam, S.S.; Ahmed, A.; Chauhan, S.; Mirza, M.A.; Taleuzzaman, M. Formulation and evaluation of thymoquinone niosomes: Application of developed and validated RP-HPLC method in delivery system. Drug Dev. Ind. Pharm. 2019, 45, 1799–1806. [Google Scholar] [CrossRef]
- Ahmad, N.; Ahmad, R.; Al-layly, A.; Al-shawi, H.; Al-ali, A.; Amir, M.; Mostafa, A. Ultra-high-performance liquid chromatography-based identification and quantification of thymoquinone in Nigella sativa extract from different geographical regions. Pharmacogn. Mag. 2018, 14, 471–480. [Google Scholar] [CrossRef]
- Jongsawatsataporn, N.; Tanaka, R. The simultaneous analysis of 14 antioxidant compounds using HPLC with UV detection and their application to edible plants from Asia. Food Anal. Methods 2022. [Google Scholar] [CrossRef]
- Hadad, G.M.; Salam, R.A.A.; Soliman, R.M.; Mesbah, M.K. HPLC-DAD determination of seven antioxidants and caffeine in different phytopharmaceuticals. J. Chromatogr. Sci. 2014, 52, 617–623. [Google Scholar] [CrossRef][Green Version]
- Dimcheva, V.; Kaloyavov, N.; Karsheva, M.; Funeva-Peycheva, M.; Stoilova, N. HPLC-DAD method for simultaneous determination of natural polyphenols. Open J. Anal. Bioanal. Chem. 2019, 3, 39–43. [Google Scholar]
- Marzouk, H.M.; Teaima, M.H.; El-Desoky, A.M.; Mohamed, S.O. A validated HPLC-DAD method for simultaneous determination of major bioactive constituents of antidiabetic herbal extracts; application to a newly co-formulated nutraceutical product. Microchem. J. 2020, 159, 105472. [Google Scholar] [CrossRef]
- Moura, H.F.S.; Dias, F.D.S.; e Souza, L.B.S.; de Magalhaes, B.E.A.; Tannus, C.D.A.; de Carvalho, W.C.; Brandao, G.C.; dos Santos, W.N.P.; Korn, M.G.A.; dos Santos, D.C.M.B.; et al. Evaluation of multielement/proximate composition and bioactive phenolics contents of unconventional edible plants from Brazil using multivariate analysis techniques. Food Chem. 2021, 363, 129995. [Google Scholar] [CrossRef] [PubMed]
- Sa, R.R.; Matos, R.A.; Silva, V.C.; Caldas, J.D.C.; Sauthier, M.C.D.S.; dos Santos, W.N.P.; Magalhaes, H.I.F.; Junior, A.D.F.S. Determination of bioactive phenolics in herbal medicines containing Cynara scolymus, Maytenus ilicifolia, Mart ex Reiss and Ptychopetalum uncinatum by HPLC-DAD. Microchem. J. 2017, 135, 10–15. [Google Scholar] [CrossRef]
- Czyrski, A.; Sznura, J. The application of Box-Behnken-design in the optimization of HPLC separation of fluoroquinolones. Sci. Rep. 2019, 9, 19458. [Google Scholar] [CrossRef]
- Patel, K.Y.; Dedania, Z.R.; Dedania, R.R.; Patel, U. QbD approach to HPLC method development and validation of ceftriaxone sodium. Future J. Pharm. Sci. 2021, 7, 141. [Google Scholar] [CrossRef]
- Jadhav, M.L.; Tambe, S.R. Implementation of QbD approach to the analytical method development and validation for the estimation of propafenone hydrochloride in tablet dosage form. Chromatogr. Res. Int. 2013, 2013, 676501. [Google Scholar] [CrossRef]
- Harborne, J.B. Phytochemical Methods: A Guide to Modern Techniques of Plant Analysis, 2nd ed.; Chapman and Hall: London, UK, 1998; pp. 54–84. [Google Scholar]
- Kokate, K.C. Practical Pharmacognosy, 4th ed.; Vallabh Prakashan: Delhi, India, 1997; p. 218. [Google Scholar]
- Németh, Z.; Pallagi, E.; Dobó, D.G.; Csóka, I. A proposed methodology for a risk assessment-based liposome development process. Pharmaceutics 2020, 12, 1164. [Google Scholar] [CrossRef]
- Jain, P.; Taleuzzaman, M.; Kala, C.; Kumar Gupta, D.; Ali, A.; Aslam, M. Quality by design (Qbd) assisted development of phytosomal gel of Aloe vera extract for topical delivery. J. Liposome Res. 2021, 31, 381–388. [Google Scholar] [CrossRef]
- Taleuzzaman, M.; Sartaj, A.; Gupta, D.K.; Gilani, S.J.; Mirza, M.A. Phytosomal gel of Manjistha extract (MJE) formulated and optimized with central composite design of quality by design (QbD). J. Disp. Sci. Technol. 2021. [Google Scholar] [CrossRef]
- Yu, L.X. Pharmaceutical quality by design: Product and process development, understanding, and control. Pharm. Res. 2008, 25, 781–791. [Google Scholar] [CrossRef]
- Afzal, M.; Muddassir, M.; Alarifi, A.; Ansari, M.T. Box-Behnken assisted validation and optimization of an RP-HPLC method for simultaneous determination of domperidone and lansoprazole. Separations 2021, 8, 5. [Google Scholar] [CrossRef]
- European Medicines Agency. ICH, Q2 (R1) Validation of Analytical Procedures: Text and Methodology; European Medicines Agency: Amsterdam, The Netherlands, 1995.
- Yuyun, Y.; Jithavech, P.; Thitikornpong, W.; Vajragupta, O.; Rojsitthisak, P. A stability-indicating ultra performance liquid chromatographic (UPLC) method for the determination of a mycophenolic acid-curcumin conjugate and its applications to chemical kinetic studies. Molecules 2021, 26, 5398. [Google Scholar] [CrossRef] [PubMed]
- Gide, M.; Sharma, P.; Saudagar, R.; Shrivastava, B. Method development and validation for determination of febuxostat from spiked human plasma using RP-HPLC with UV detection. Chromatogr. Res. Int. 2014, 2014, 307430. [Google Scholar] [CrossRef]
- Mukhtar, H.M.; Singh, A.; Soni, V.; Singh, A.; Kaur, H. Development and validation of RP-HPLC method for the determination of stigmasterol in the botanical extract of Ficus deltoidea. Nat. Prod. Res. 2019, 33, 2868–2872. [Google Scholar] [CrossRef] [PubMed]
- Savadkouhi, B.M.; Vahidi, H.; Ayatollahi, A.M.; Hooshfar, S.; Kobarfard, F. RP-HPLC method development and validation for determination of eptifibatide acetate in bulk drug substance and pharmaceutical dosage forms. Iran. J. Pharm. Res. 2017, 16, 490–497. [Google Scholar]


Publisher’s Note: MDPI stays neutral with regard to jurisdictional claims in published maps and institutional affiliations. |
© 2022 by the authors. Licensee MDPI, Basel, Switzerland. This article is an open access article distributed under the terms and conditions of the Creative Commons Attribution (CC BY) license (https://creativecommons.org/licenses/by/4.0/).